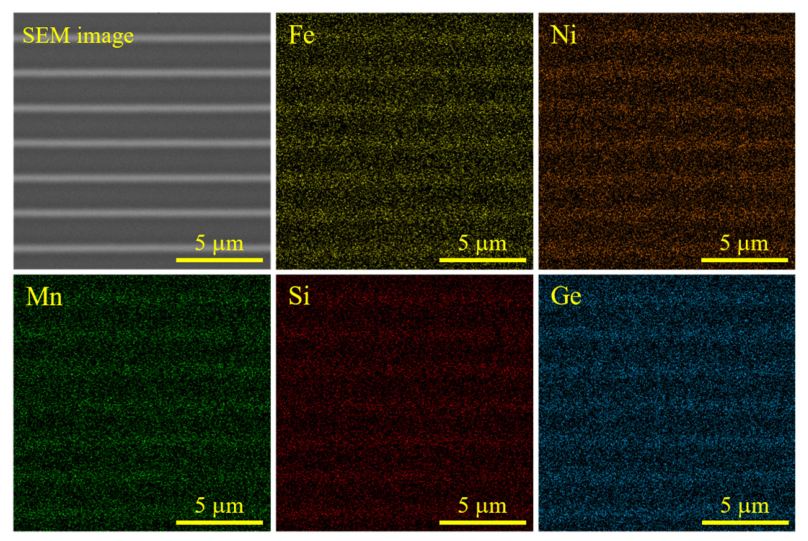
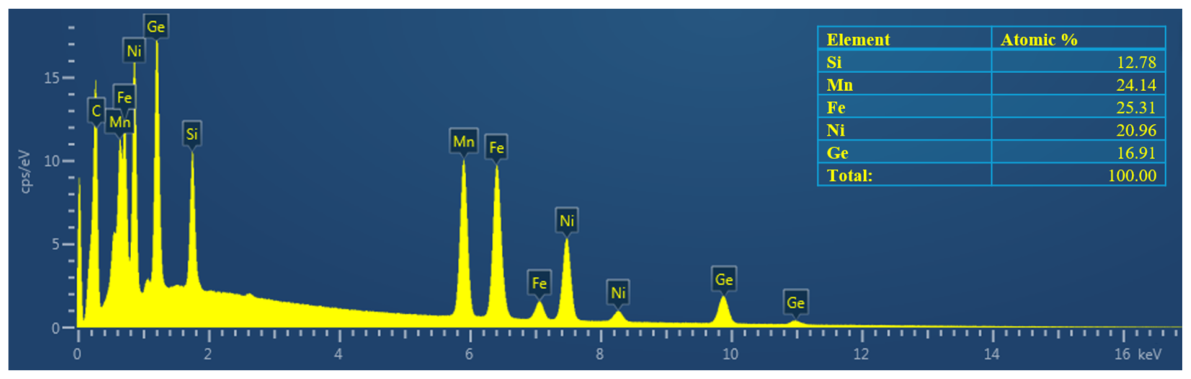
3.1. TEM and AFM Investigations
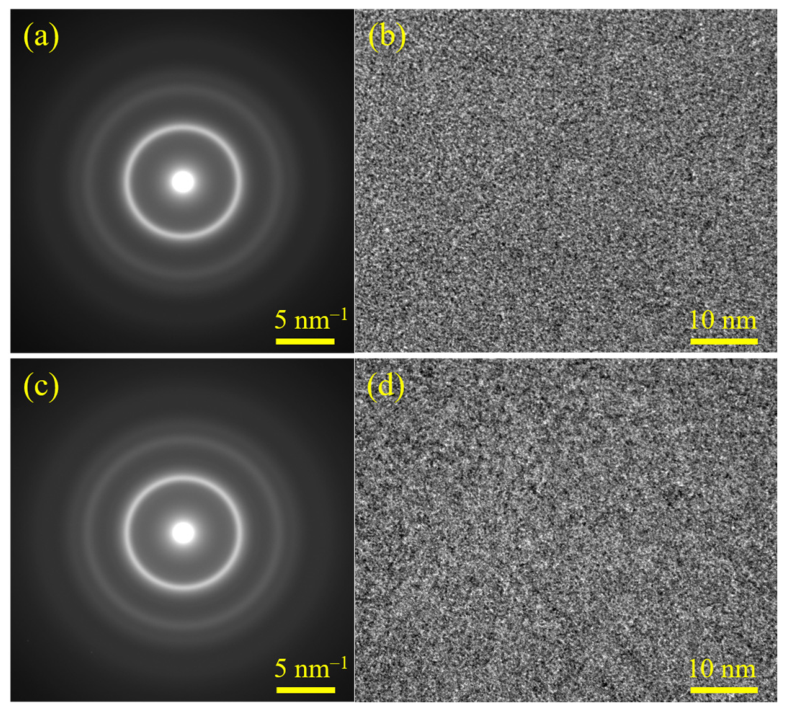
Figure 4 shows electron diffraction patterns and TEM images of Fe
25Ni
21Mn
24Si
13Ge
17 HEA after deposition at room temperature (RT) and annealing at 700 K. After deposition and annealing, the diffraction patterns exhibit only diffuse, broad concentric rings (
Figure 4a,c), a signature of an amorphous state or an extremely fine, disordered ultra-nanocrystalline matrix where long-range atomic order is absent. This is confirmed by corresponding TEM imaging (
Figure 4b,d). No distinct grain boundaries, large crystalline precipitates, or long-range lattice fringes are visible at this scale, confirming that the material maintains a highly disordered atomic configuration.
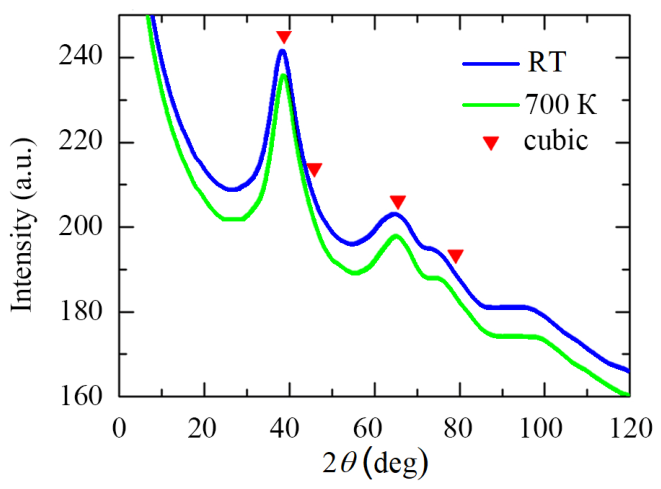
To provide deeper insight into the structure of the HEA samples, the electron diffraction patterns were processed using specialized software and presented in the form of electron diffraction profiles (
Figure 5). The diffraction peaks marked with red inverted triangles in
Figure 5 correspond to a cubic crystal structure with 2
θ = 38.5°, 45.0°, 65.0°, and 78°. The diffraction spectra at RT and 700 K are almost identical in shape, peak positions, and widths. This demonstrates that the Fe
25Ni
21Mn
24Si
13Ge
17 HEA exhibits thermal stability, maintaining its single-phase cubic structure without phase decomposition, crystallization of the amorphous matrix, or precipitation of secondary intermetallic phases up to 700 K.
To investigate the surface morphology of Fe
25Ni
21Mn
24Si
13Ge
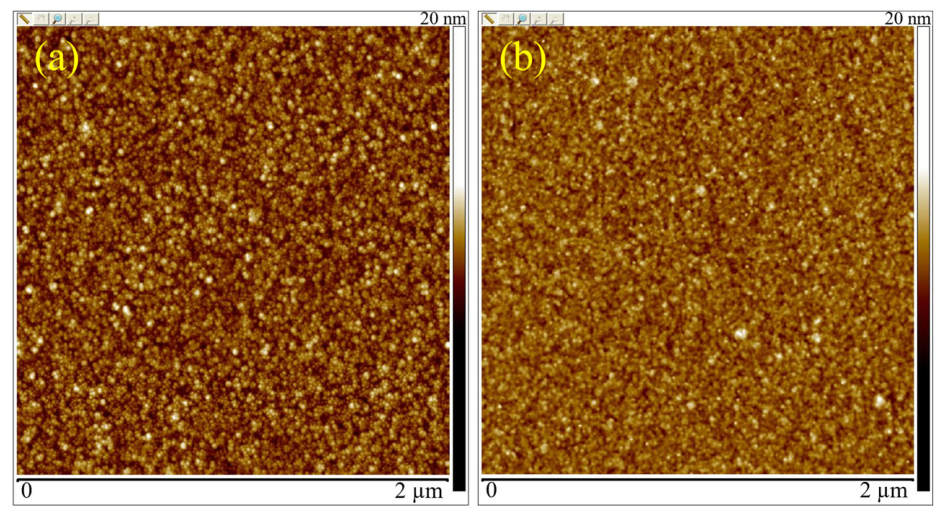
17 HEA-based thin films and their evolution during annealing, atomic force microscopy analysis (
Figure 6) was performed. As shown in
Figure 6a, the surface exhibits a highly homogeneous nanostructured topography with a uniform spatial distribution. The morphology is characterized by densely packed, spherical nanometer-sized grains. Statistical evaluation of the height profile yields a root-mean-square roughness (
Rq) of 0.794 nm and an average roughness (
Ra) of 0.630 nm, indicating a high degree of surface planarity.
Figure 6b illustrates the morphological modification resulting from thermal annealing at 700 K.
A subtle change in grain arrangement can be seen upon close inspection. This is shown by a slight tendency for individual clusters of many grains to coalesce in one place. However, the fundamental ultra-nanocrystalline or amorphous matrix is fully preserved. The integral roughness values (Rq = 0.79 nm and Ra = 0.63 nm) remain virtually unchanged within experimental error. This indicates excellent thermal stability of the nanostructure and the absence of severe recrystallization or grain growth at 700 K. These results are consistent with TEM analysis.
3.2. Magnetic Properties
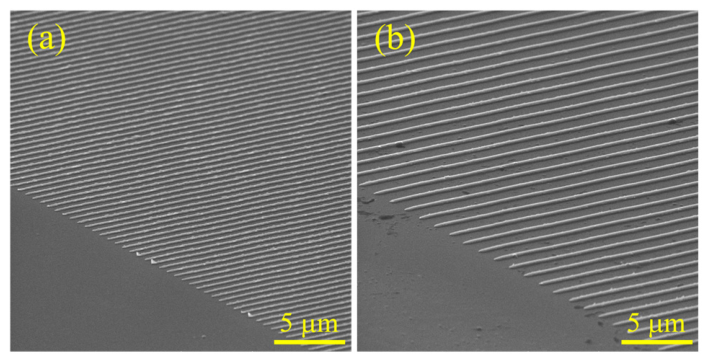
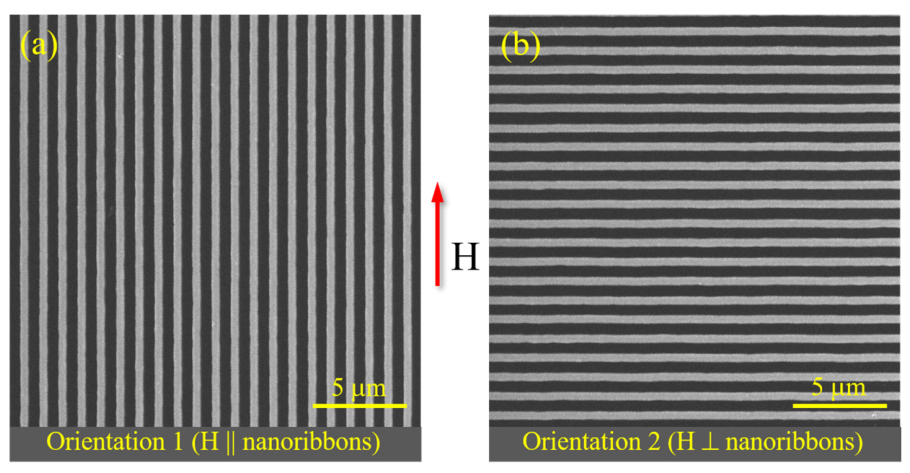
The magnetic properties and magnetization dynamics were investigated under two distinct configurations relative to the external magnetic field (H), as shown in
Figure 7. In Orientation 1 (
Figure 7a), the long axis of the nanoribbon arrays is aligned vertically, running parallel to the direction of the applied magnetic field vector (H ‖ nanoribbons). This configuration is typically used to probe the easy magnetization axis driven by shape anisotropy. In Orientation 2 (
Figure 7b), the array is rotated by 90°, positioning the nanoribbon arrays horizontally so that their longitudinal axis is perpendicular to the applied magnetic field vector (H ⊥ nanoribbons). This setup allows evaluation of the hard-axis behavior and quantification of demagnetizing factors across the nanoribbon’s width.
The high geometric consistency between the two orientations, as confirmed by the 5 µm scale bars, ensures that any observed differences in magnetic parameters (such as coercivity, remanence ratio, or saturation fields) are intrinsic to the directional magnetic anisotropy of the nanoribbons rather than structural artifacts or variations in pattern density.
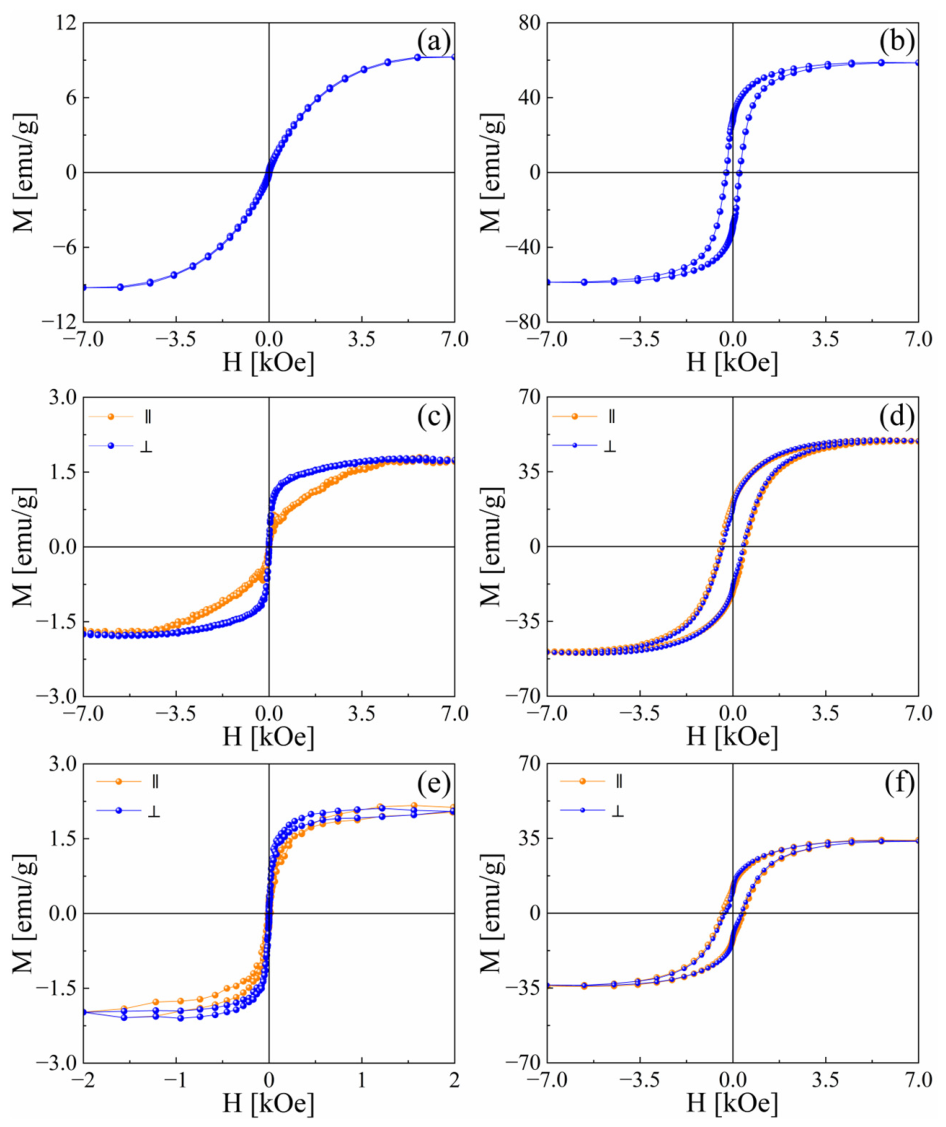
Figure 8 shows the
M(H) hysteresis loops measured at 300 K and 5 K in an external field for Fe
25Ni
21Mn
24Si
13Ge
17 HEA-based thin films and nanoribbon arrays with spacings of 1 µm and 2 µm in the initial state. The experimental curves reveal a pronounced temperature-dependent evolution of both the saturation magnetization and the hysteretic response. At room temperature, the thin film exhibits a narrow hysteresis loop with negligible coercivity and low remanent magnetization, which is characteristic of a soft ferromagnetic state. The magnetic moment approaches saturation relatively slowly, reaching a maximum saturation magnetization
Ms of 9 emu/g at high magnetic fields. Upon cooling the sample to 5 K, a significant enhancement in the magnetic properties is observed. The saturation magnetic moment increases drastically, reaching 60 emu/g. Furthermore, the loop broadens noticeably, exhibiting a distinct open structure with a clear coercive
Hc of 2.4 kOe and a higher remanence ratio,
Mr/
Ms. This significant increase in both the saturation magnetization and coercivity at low temperatures indicates a strong reduction in thermal fluctuations (thermal activation effects) and the subsequent freezing of magnetic moments or suppression of domain wall motion at 5 K, thereby strengthening the effective magnetic anisotropy of the thin-film system [
15].
The character of
M(
H) curves for Fe
25Ni
21Mn
24Si
13Ge
17 HEA-based nanoribbon arrays differs from that of thin films. Such structures exhibit magnetic anisotropy, as evidenced by hysteresis loops measured at 300 K (
Figure 8c,e) [
16]. As presented in
Figure 8c,e, the magnetization process depends on the orientation of the applied magnetic field to the axis of the nanoribbons. In perpendicular orientation, the more rapid remagnetization in the low-field region and higher residual magnetization are observed. At the same time, in parallel orientation, magnetization occurs more gradually. Such behavior agrees with magnetic anisotropy arising from geometric constraints and the domain structure of the nanoribbon arrays.
The value of
Ms decreases to 1.75 emu/g and 2.1 emu/g for nanoribbon arrays with spacings of 1 µm and 2 µm, respectively. At 5 K, the saturation magnetization
Ms also decreases compared with data for thin films, reaching values of 50 emu/g and 35 emu/g for nanoribbon arrays with spacings of 1 µm and 2 µm, respectively. This significant decrease in magnetization indicates increased surface spin frustration and domain pinning along the edges of the nanoribbons. In addition, at 5 K, the nanoribbon arrays with a spacing of 1 µm (
Figure 8d) show a slight anisotropy in approach to saturation. However, for nanoribbon arrays with a spacing of 2 µm (
Figure 8f), curves at the parallel and perpendicular orientations perfectly overlap. This reveals that increasing the spatial separation to 2 µm decouples the nanoribbons, causing the array to exhibit isotropic in-plane behavior at low temperatures.
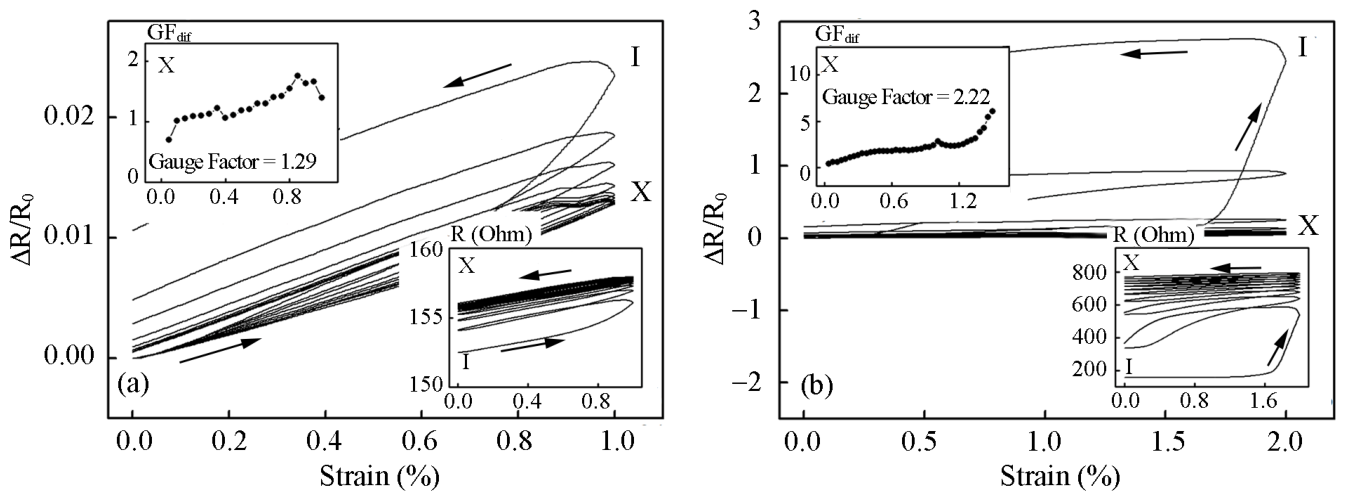
Figure 9 illustrates the response-strain curve of the Fe
25Ni
21Mn
24Si
13Ge
17 HEA thin film within the strain range
εl1 = 0–1% and
εl2 = 0–2%. For strain range
εl1 = 0–1% (
Figure 9a), the Δ
R/
R(
εl) dependences are characterized by a significant difference in the I-st strain cycle from the subsequent cycles. The reason for this behavior is a stabilization process involving microplastic strain, redistribution, and the movement of defects in the crystalline structure and foreign atoms [
17,
18,
19]. Starting with the second strain cycle, a tendency toward stabilization of the Δ
R/
R(
εl) curves is observed. For strain range
εl1 = 0–1%, a nearly linear increase in resistance with increasing strain is observed at the X-th strain cycle. So, elastic deformation occurs up to
εl = 1%. For this reason, the strain range was increased to 2% (
Figure 9b). For this strain range, another characteristic feature is that the first strain cycle differs from the subsequent ones. In subsequent cycles, a stabilization of the strain-stress relationships is also observed. The results demonstrate gauge factors of 1.29 and 2.22 for strain ranges
εl1 = 0–1% and
εl2 = 0–2%, respectively. The electrical resistance behavior under strain confirms that the co-sputtered HEA thin film possesses desirable properties, including compositional homogeneity, surface uniformity, and a dense structure. These characteristics enable efficient and stable strain transfer within the composite structure. These properties guarantee optimal and consistent strain transfer within the HEA thin films. As elastic deformation occurs up 2%, we decided to analyze the effect of strain on magnetic properties over the range
εl2 = 0–2%. Further increasing the strain value is inadvisable, as it may cause the nanoribbons to crack.
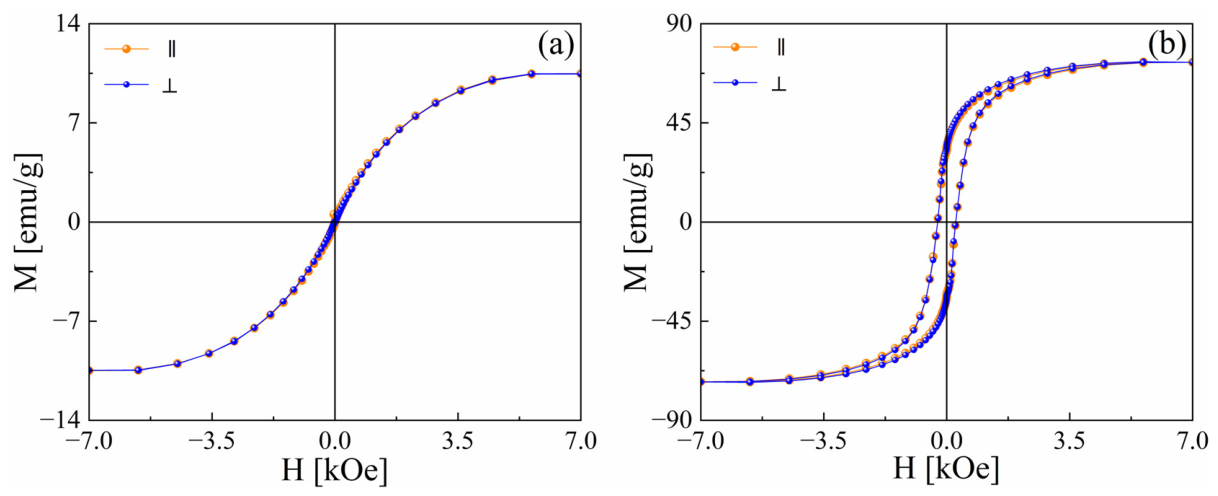
The magnetic behavior of the HEA-based thin film after strain within the range 0–2% is presented in
Figure 10. As shown in
Figure 10, after stress, the thin film retains its strong temperature-dependent magnetization, though a minor decrease in the
Ms to 56 emu/g at 5 K is observed compared with the samples before stress (
Figure 8a,b). Furthermore, the overlap of the loops obtained from two different orientations (
Figure 10) demonstrates that the stress does not break the in-plane magnetic isotropy of the thin film structure.
Resistivity is one of the base parameters affecting the magnetic, magnetotransport, etc., properties of thin film materials [
20,
21] and high-entropy alloys in particular [
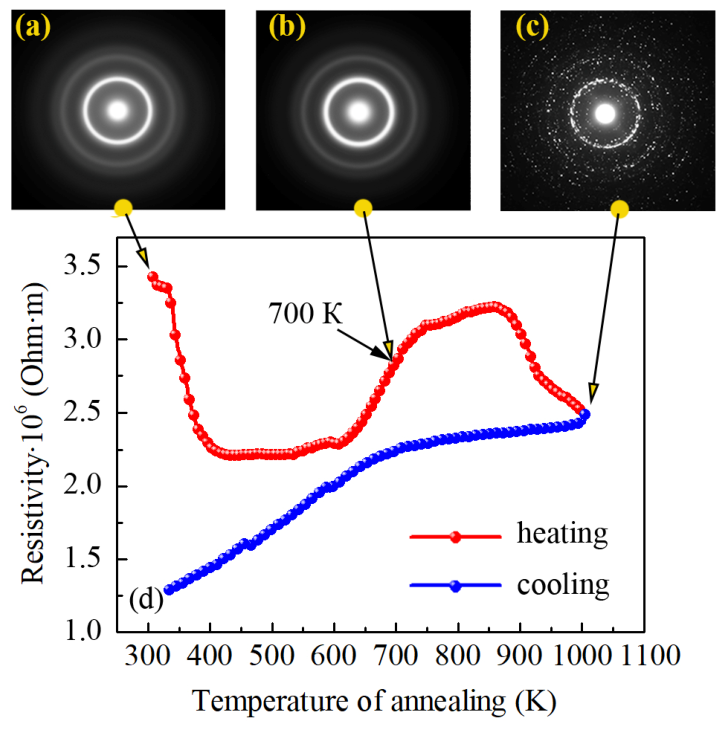
22]. Moreover, thermal stability remains an important research topic. So, a comprehensive investigation of the temperature dependence of resistance and changes in crystal structure under high-temperature annealing was conducted. The results are shown in
Figure 11. The temperature dependence of the resistivity during heating (red line) shows a complex, non-monotonic behavior. Initially, the resistivity decreases sharply upon heating up to approximately 425 K, after which it stabilizes into a plateau. Beyond 625 K, resistivity increases significantly, reaching a local maximum near 855 K before dropping again, reaching a minimum at 1000 K, the maximum annealing temperature. In contrast, the subsequent cooling process (blue line) exhibits a monotonic, metallic-like linear decrease in resistivity down to room temperature, indicating an irreversible structural transformation. Therefore, the processes of electrical transfer in HEA thin films are driven by scattering of conduction electrons at grain boundaries, impurities, and phonons, as in electrically continuous metal layers [
23].
To correlate the electron transport behavior with structural changes, the Selected Area Electron Diffraction patterns were studied at specific temperatures: after deposition, after annealing at a temperature of 700 K that corresponds to the region where resistivity begins to grow rapidly, and after annealing at a temperature of 1000 K that corresponds to the maximum of the annealing temperature (
Figure 11a–c). Data for the 100-nm-thick HEA-based thin film correlate with those presented above. Before annealing, the SAED pattern exhibits broad, diffuse halo rings characteristic of a completely amorphous or highly disordered crystal structure (
Figure 11a). At an annealing temperature of 700 K (
Figure 11b), the diffraction rings remain diffuse, indicating that the amorphous matrix is still predominant or shifting into a precursor state. At the same time, upon reaching the maximum annealing temperature (
Figure 11c), the diffuse halos completely transform into a series of sharp, dotted diffraction rings. This transition provides direct evidence of crystallization, confirming that the high-temperature thermal heat induces the formation of a polycrystalline phase.
Hence, based on the combined electrical resistivity and electron diffraction analysis, an annealing temperature of 700 K was chosen for further magnetic characterization. Investigating magnetic properties at this temperature allows for the study of a “metastable” or “pre-crystallization” state. This helps determine how structural relaxation, short-range ordering, or the very early nucleation of nanocrystals within the amorphous matrix affects magnetic behavior before the full-scale crystallization observed at 1000 K takes over. By selecting 700 K, we can decouple the effects of early-stage atomic rearrangement from the microstructural effects associated with large crystalline grains and dense grain boundaries.
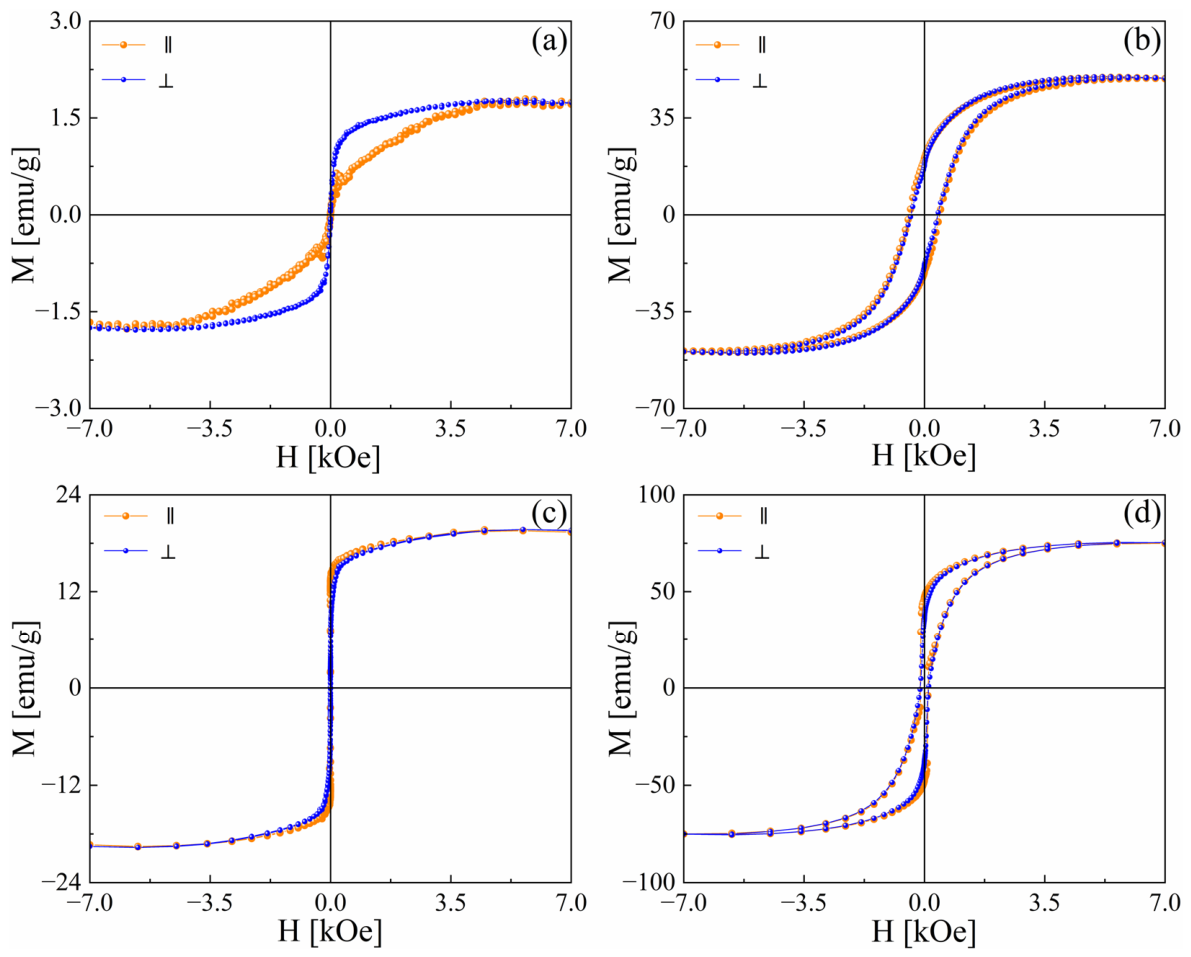
Figure 12 shows the magnetic field-dependent magnetization loops for HEA-based nanoribbons with a spacing of 1 μm, measured at 300 K and 5 K before and after annealing at 700 K. Annealing the sample at 700 K leads to a significant change in the
Ms value. At room temperature,
Ms increases to approximately 19.5 emu/g, accompanied by the complete collapse of directional anisotropy as the parallel and perpendicular loops converge (
Figure 12c). Similarly, at 5 K, heat treatment increases the maximum magnetization capability from approximately 50 emu/g in the initial state to approximately 75 emu/g after annealing (
Figure 12b,d). These developments demonstrate that annealing at 700 K is a vital structural threshold for the HEA system, driving short-range atomic reordering and relieving fabrication-induced mechanical strain. This effectively lowers internal magnetic pinning barriers, establishes isotropic domain-rotation pathways, and significantly increases the total ferromagnetic volume fraction within the nanoribbons.
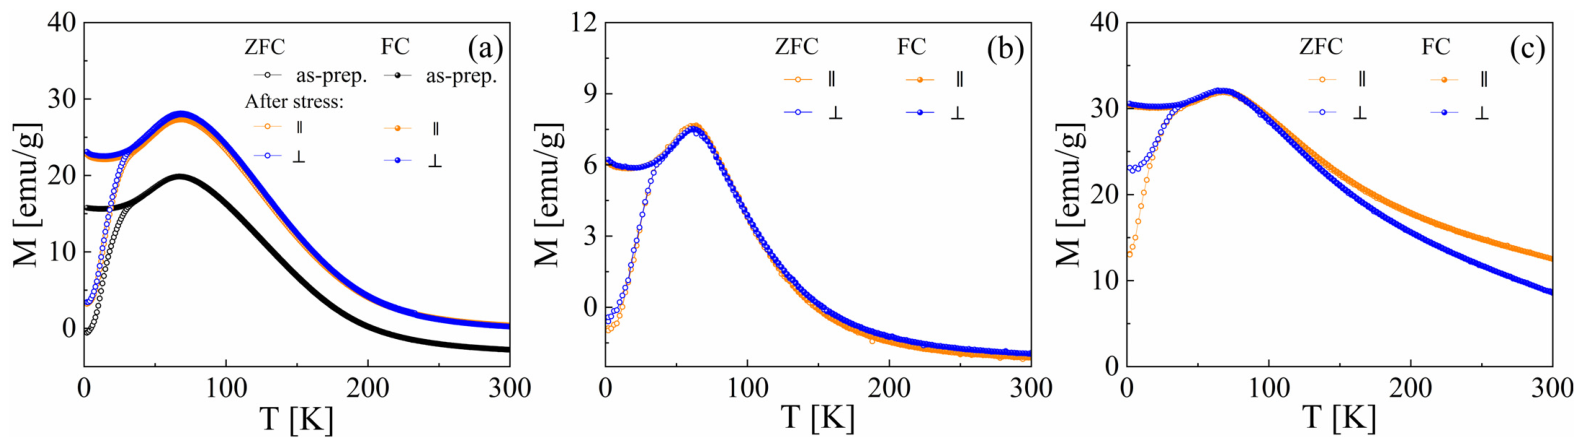
Figure 13 shows the temperature dependence of the ZFC-FC magnetization for the Fe
25Ni
21Mn
24Si
13Ge
17 HEA-based thin film before and after stress (
Figure 13a), and for the nanoribbon arrays before and after annealing at 700 K (
Figure 13b,c), measured in a field of 1 kOe.
For thin films, the ZFC-FC curves do not indicate direct evidence of the magnetic transition from the ferromagnetic to the paramagnetic state. Only a broad maximum, similar to that observed in superparamagnetic systems, was observed, with a well-defined peak at
T ≈ 70 K, determined from the position of the maximum in the temperature dependence of the ZFC magnetization. The application of longitudinal stress does not alter the peak position, which remains at 70 K. This indicates that the thermal energy barrier underlying the main blocking transition in the magnetic clusters is unaffected by the strain. At this, it should be noted that, within the temperature range
T > 100 K, a distinct modification in the slope of the ZFC-FC curves, with significantly higher magnetic moment up to room temperature, is observed after sample stress. This altered temperature decay can be explained by the emergence of magnetoelastic anisotropy [
24] induced by residual internal stresses, which increases the energy barriers against thermal fluctuations and stabilizes the magnetic order at higher temperatures.
The ZFC-FC dependencies in the initial state do not depend on the orientation of the magnetic field relative to the axis of the nanoribbons (
Figure 13b). The temperature value that corresponds to the peak on the ZFC-FC magnetization curve is 62 K. A pronounced magnetic anisotropy is visible across the entire temperature scale. However, subjecting the nanoribbons to thermal annealing at 700 K (
Figure 13c) induces transformations in the magnetic structure. First, the peak specific magnetization increases more than fourfold, growing from 7.5 emu/g in the initial state to 32 emu/g after annealing, indicating a major expansion of the net ferromagnetic volume fraction. Second, while the temperature region
T > 100 K is completely isotropic in the nanoribbons before annealing (
Figure 13b), the annealed sample (
Figure 13c) exhibits a prominent magnetic anisotropy up to room temperature, with the parallel orientation yielding significantly higher magnetization values than the perpendicular orientation. Additionally, the ZFC curves after annealing retain an elevated baseline magnetization at the lowest temperature limit (
T → 0 K). Together, these findings demonstrate that annealing at 700 K promotes short-range atomic reordering and dissipates internal fabrication strains, thereby reducing local domain-pinning centers, enhancing collective exchange interactions, and establishing a robust in-plane magnetic easy axis along the nanoribbon length.
3.3. Magnetocaloric Properties
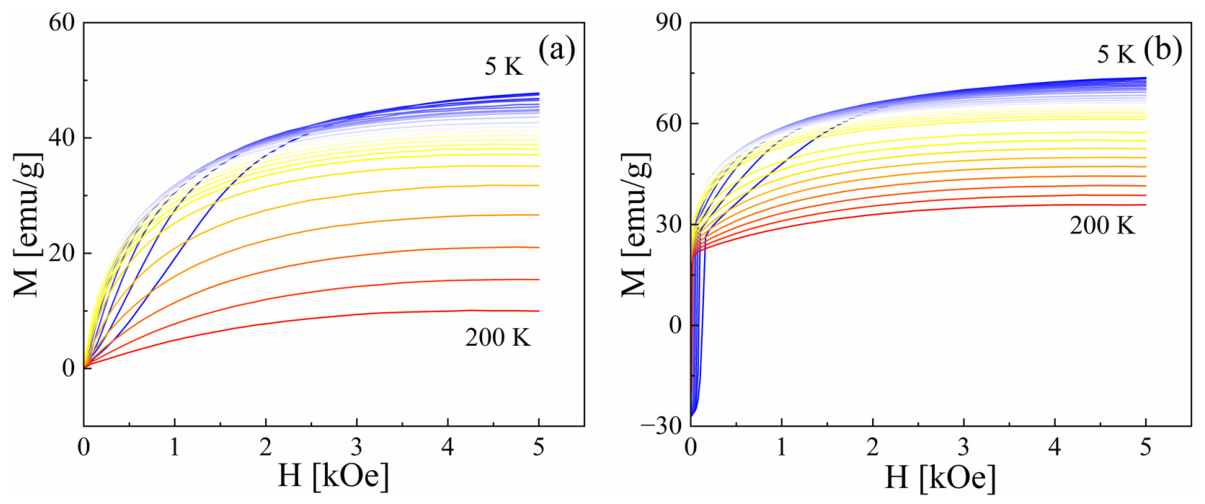
Figure 14 shows the isothermal magnetization and demagnetization curves for the Fe
25Ni
21Mn
24Si
13Ge
17 HEA-based nanoribbons with a spacing of 1 µm over the applied magnetic field range of 0–5 kOe. Both states exhibit a typical soft-magnetic behavior, with magnetization gradually decreasing as temperature increases due to thermal fluctuations. However, a comparative analysis of
M(H) curves for as-deposited (
Figure 14a) and annealed at 700 K (
Figure 14b) samples reveals a substantial enhancement in magnetic performance upon annealing. Specifically, the maximum magnetic moment at 5 K increases from 48 emu/g to 74 emu/g after annealing. Furthermore, the annealed sample exhibits a significantly steeper initial slope at lower fields (
H < 1 kOe), pointing to enhanced magnetic susceptibility. These results indicate that annealing at 700 K promotes atomic reordering and structural relaxation within the HEA nanoribbon, effectively reducing structural pinning centers and optimizing the collective ferromagnetic alignment.
The magnetocaloric properties of the Fe
25Ni
21Mn
24Si
13Ge
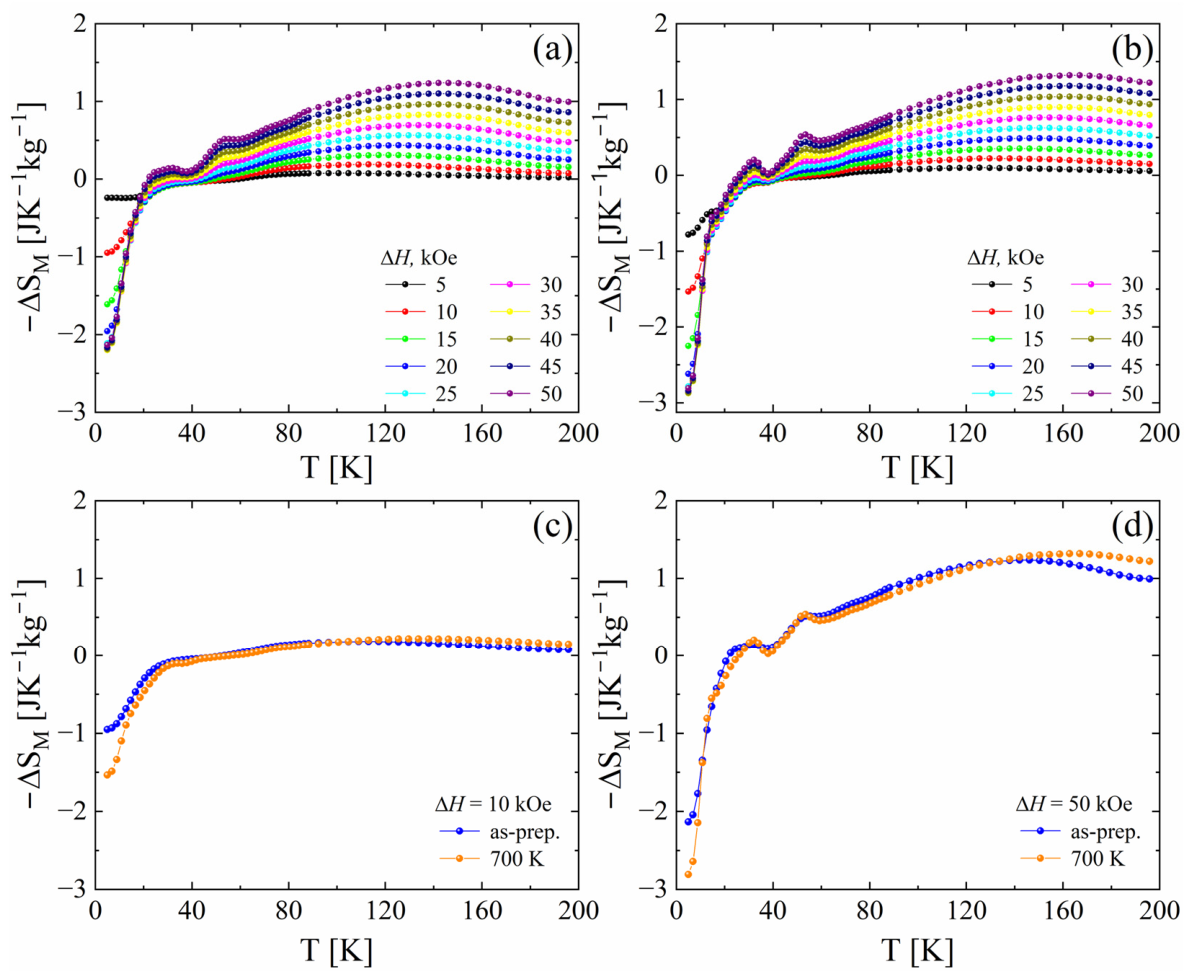
17 HEA-based nanoribbons with a spacing of 1 µm were evaluated by extracting the temperature dependence of the isothermal magnetic entropy change (−Δ
SM(
T)), as shown in
Figure 15. The curves exhibit coexistence of an inverse magnetocaloric effect below 20 K and a broad conventional magnetocaloric peak spanning 40–200 K. The maximum value of the isothermal entropy change −∆
SM = 1.25 JK
−1kg
−1 for parallel orientation was observed at 140 K and Δ
H = 50 kOe. Heat treatment at 700 K increases the maximum value of −Δ
SM to approximately 1.35 JK
−1kg
−1. This enhancement in the magnetic entropy change is highly consistent with the improved magnetization dynamics and structural homogenization induced by the 700 K annealing, which minimizes structural pinning defects and optimizes the spin-entropy variation.
It should be noted that the amplitude value of isothermal entropy, which characterizes HEAs, which do not contain rare-earth elements in their composition [
11,
12,
13], is much higher than that obtained in our work. Namely, in FeMnNiGeSi HEAs, the values of isothermal entropy change as large as 13 JK
−1kg
−1 (for 25 kOe) [
11], 7.3 JK
−1kg
−1 (for 25 kOe) [
12], in MnNiSiFeCoGe HEAs, −16 JK
−1kg
−1 (for 20 kOe) are achieved. According to Refs. [
11,
12,
13], all samples, unlike ours, exhibit a single-phase hcp structure at room temperature after preparation. In our view, this is one of the reasons why our results differ from those published. In this regard, the next stage of our research will involve determining the process conditions under which samples with an ordered crystal structure can be produced via magnetron co-sputtering. In combination with strain engineering and thermal processing, this will allow tuning the magnetic and magnetocaloric behavior of rare-earth-free FeNiMnSiGe HEA nanoribbons.




 ,
,