3.2.1. BaTiO3/PVDF Fibers with Different BaTiO3 Contents
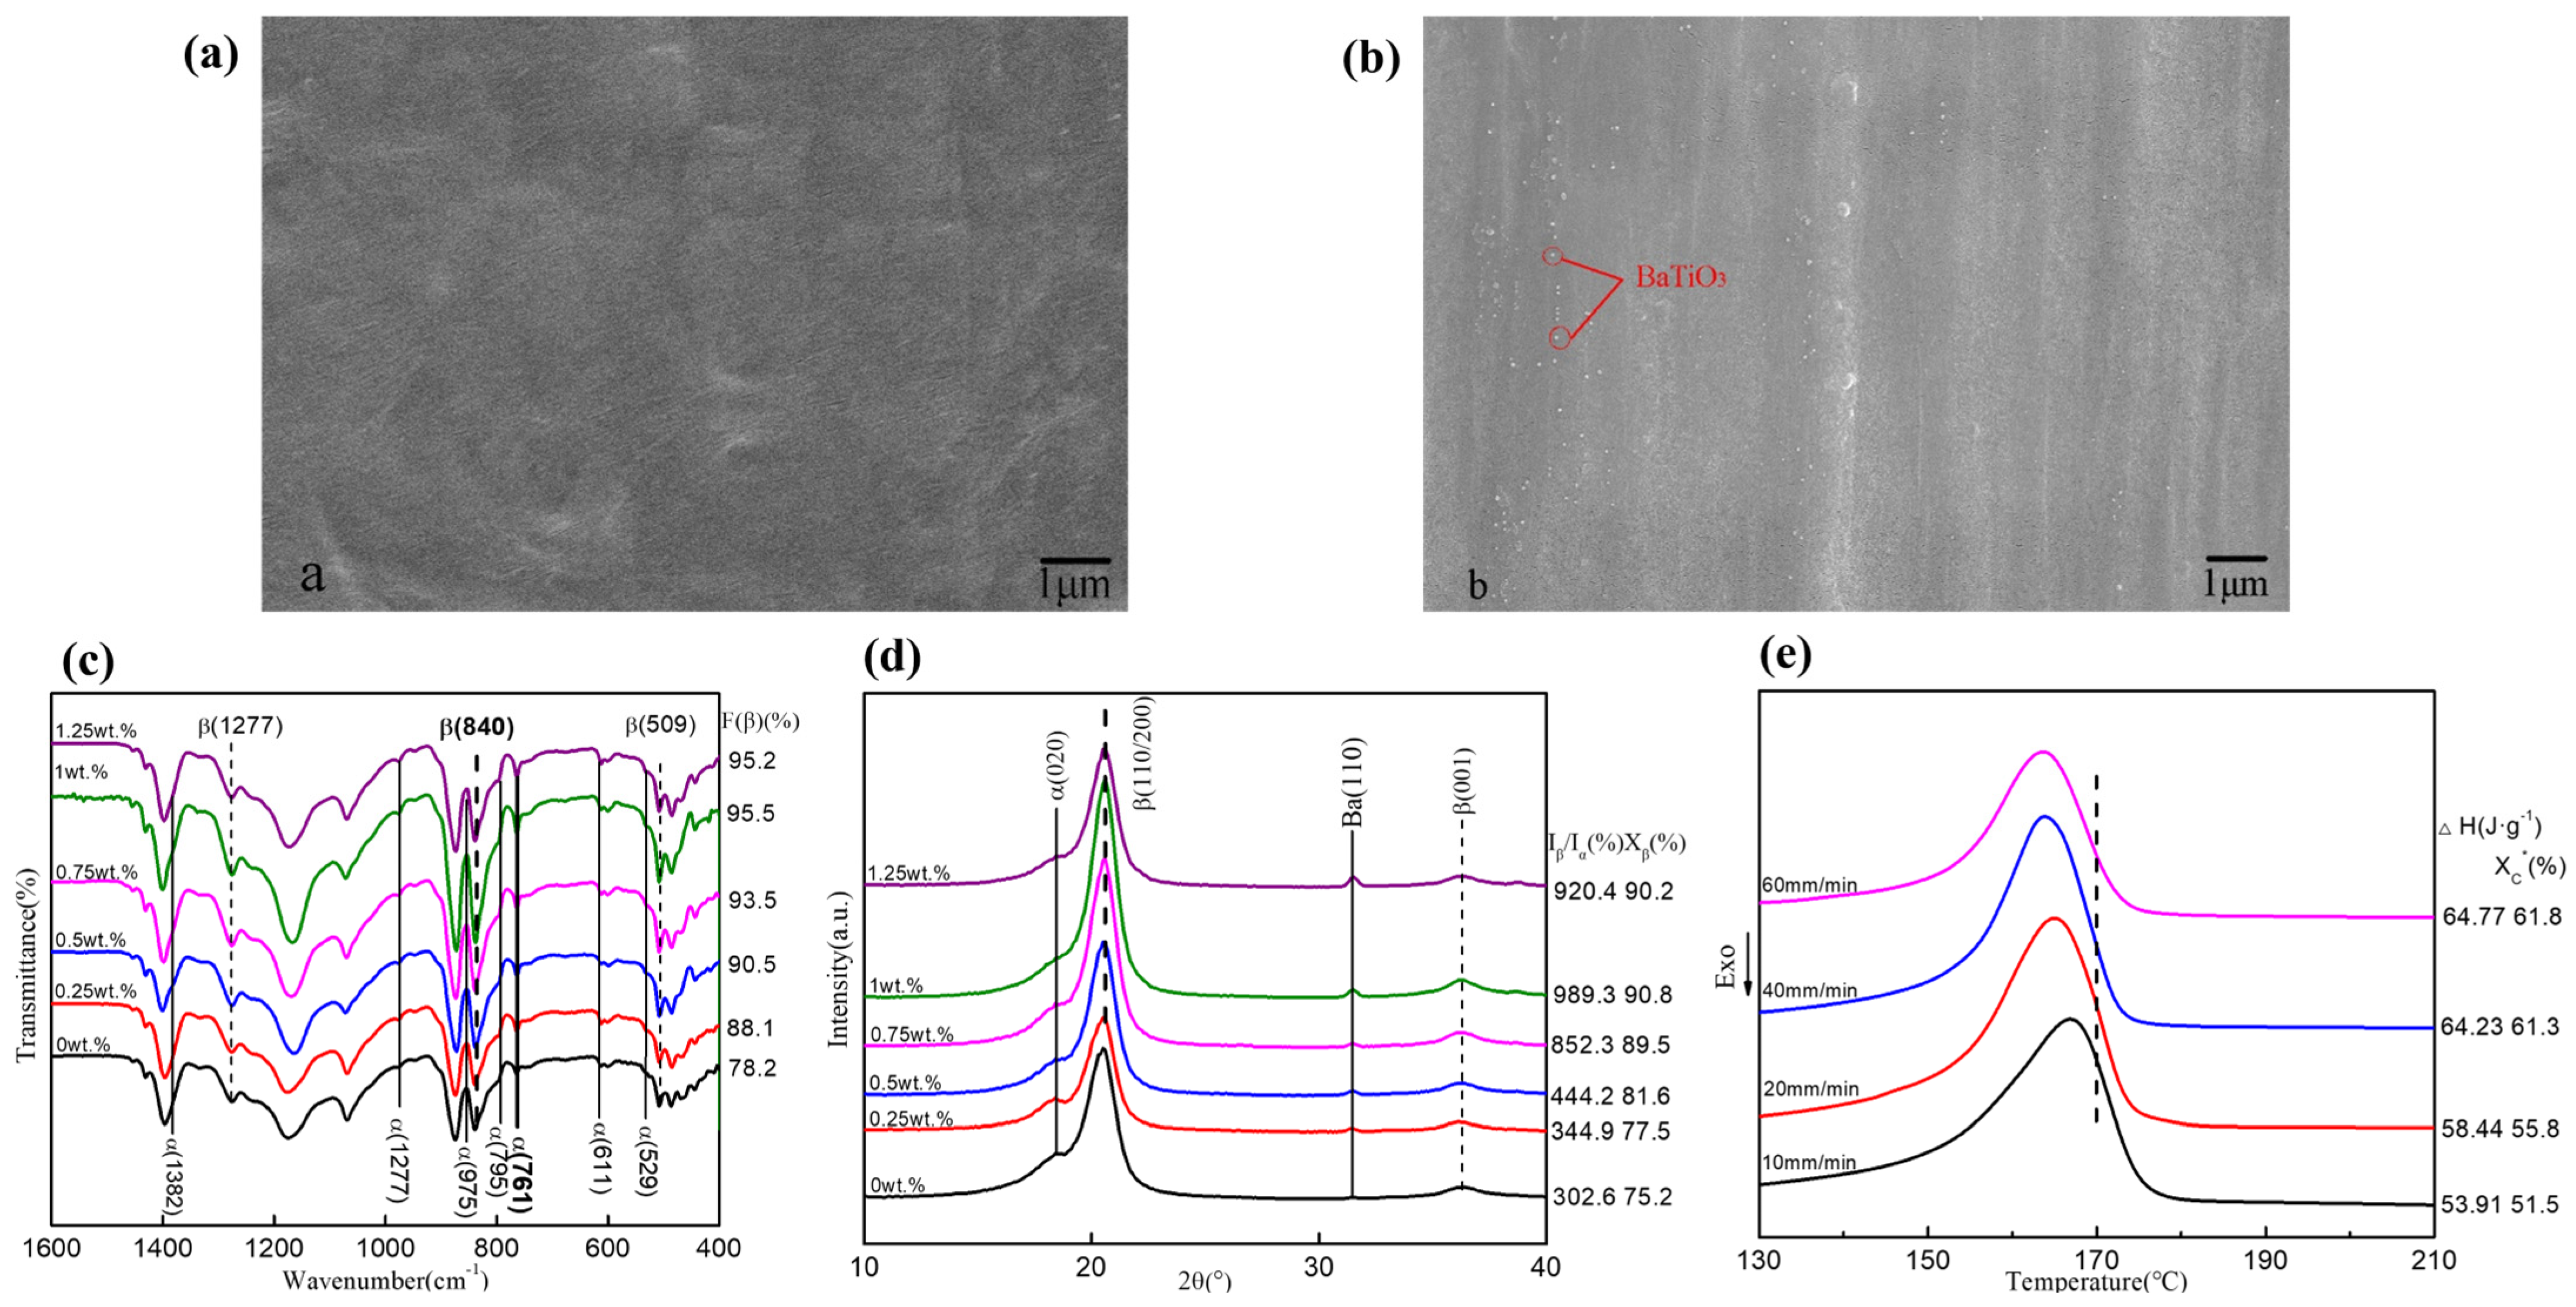
To characterize the microstructure of BaTiO
3/PVDF fibers, SEM was performed on the fiber surface, as shown in
Figure 3a,b. The pure PVDF fiber surface (
Figure 3a) was smooth and free of particles. The composite fiber with 1 wt.% BaTiO
3 showed BaTiO
3 particles on the surface without large-scale aggregation, indicating that the BaTiO
3 particles were relatively uniformly dispersed (
Figure 3b).
Figure 3c shows the FTIR spectra of BaTiO
3/PVDF fibers with different BaTiO
3 contents under a 5× draw ratio, 5× hot stretching, a hot stretching rate of 40 mm/min, and an electric field strength of 18 kV. As shown in
Figure 3c, with the continuous increase in BaTiO
3 content, the α characteristic peak at 761 cm
−1 weakens, while the β characteristic peak at 840 cm
−1 strengthens with increasing content. When BaTiO
3 content is 0 wt.%, F(β) is 78.2%, significantly lower than the F(β) value of the doped composite fiber. With increasing content, when the content reaches 1 wt.%, F(β) reaches its maximum value of 95.5%. The content continued to increase, but F(β) did not increase significantly. This indicates that BaTiO
3 can act as a nucleating agent to promote the crystallization activity of PVDF during the crystallization process. The polymer chains are arranged on the surface of BT particles in the BaTiO
3 conformation. Therefore, in the β phase, a strong interaction is generated between CH
2 and BT in the PVDF chain [
19].
Figure 3d shows the XRD patterns of BaTiO
3/PVDF fibers with different BaTiO
3 contents. As can be seen from
Figure 3d, with an increase in BaTiO
3 content, the α(020) diffraction peak at 18.4° gradually weakens, the α diffraction peak disappears at 19.9°, and the β diffraction peak gradually strengthens, indicating that the fiber mainly contains the β crystal form. When 2θ is 20.4°, the β(110/200) diffraction peak gradually increases, and the β diffraction peak is strongest when the BaTiO
3 content reaches 1 wt.%. Corresponding to the data in
Figure 3d, an increase in BaTiO
3 content gradually increases X
β (%). When the content is 1 wt.%, the I
β/I
α (%) value is 989.3, and X
β (%) reaches a maximum of 90.8%. This indicates that an increase in BaTiO
3 content enhances crystallization activity and promotes the crystallization of the β crystal form, consistent with the results of FTIR analysis in
Figure 3c. Therefore, a BaTiO
3 content of 1 wt.% is optimal.
Figure 3e shows the DSC curves of BaTiO
3/PVDF fibers with different BaTiO
3 contents. It can be observed from
Figure 3e that when the BaTiO
3 content is 0.25 wt.%, the melting temperature is slightly below 170 °C, indicating the presence of a small amount of β-crystal form in the fibers. When the BaTiO
3 content reaches 0.5 wt.%, a distinct α-characteristic peak appears with significantly higher intensity than the α melting peak, suggesting an enhanced β-crystal content in the fibers. At a BaTiO
3 content of 0.75 wt.%, the α melting peak further shifts toward the β melting peak, with the β-crystal form becoming dominant. When the BaTiO
3 content reaches 1 wt.%, the α melting peak almost disappears, while the β melting peak exhibits a larger area and a sharp shape. When the BaTiO
3 content is 0 wt.%, the crystallinity of the fibers is 51.2%, which is lower than the crystallinity of 53% at a BaTiO
3 content of 0.25 wt.%. As the BaTiO
3 content increases, the fiber crystallinity also increases, reaching its highest value at a content of 1 wt.%. This indicates that the increased BaTiO
3 content makes the fiber crystallization more standardized, which helps in the transformation from α to β crystal form.
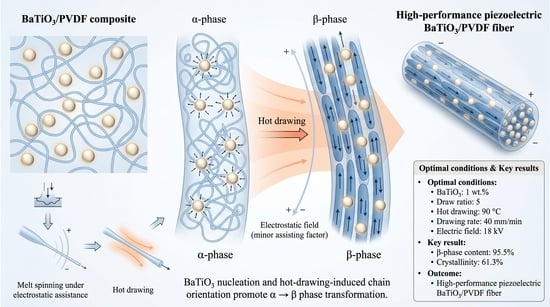
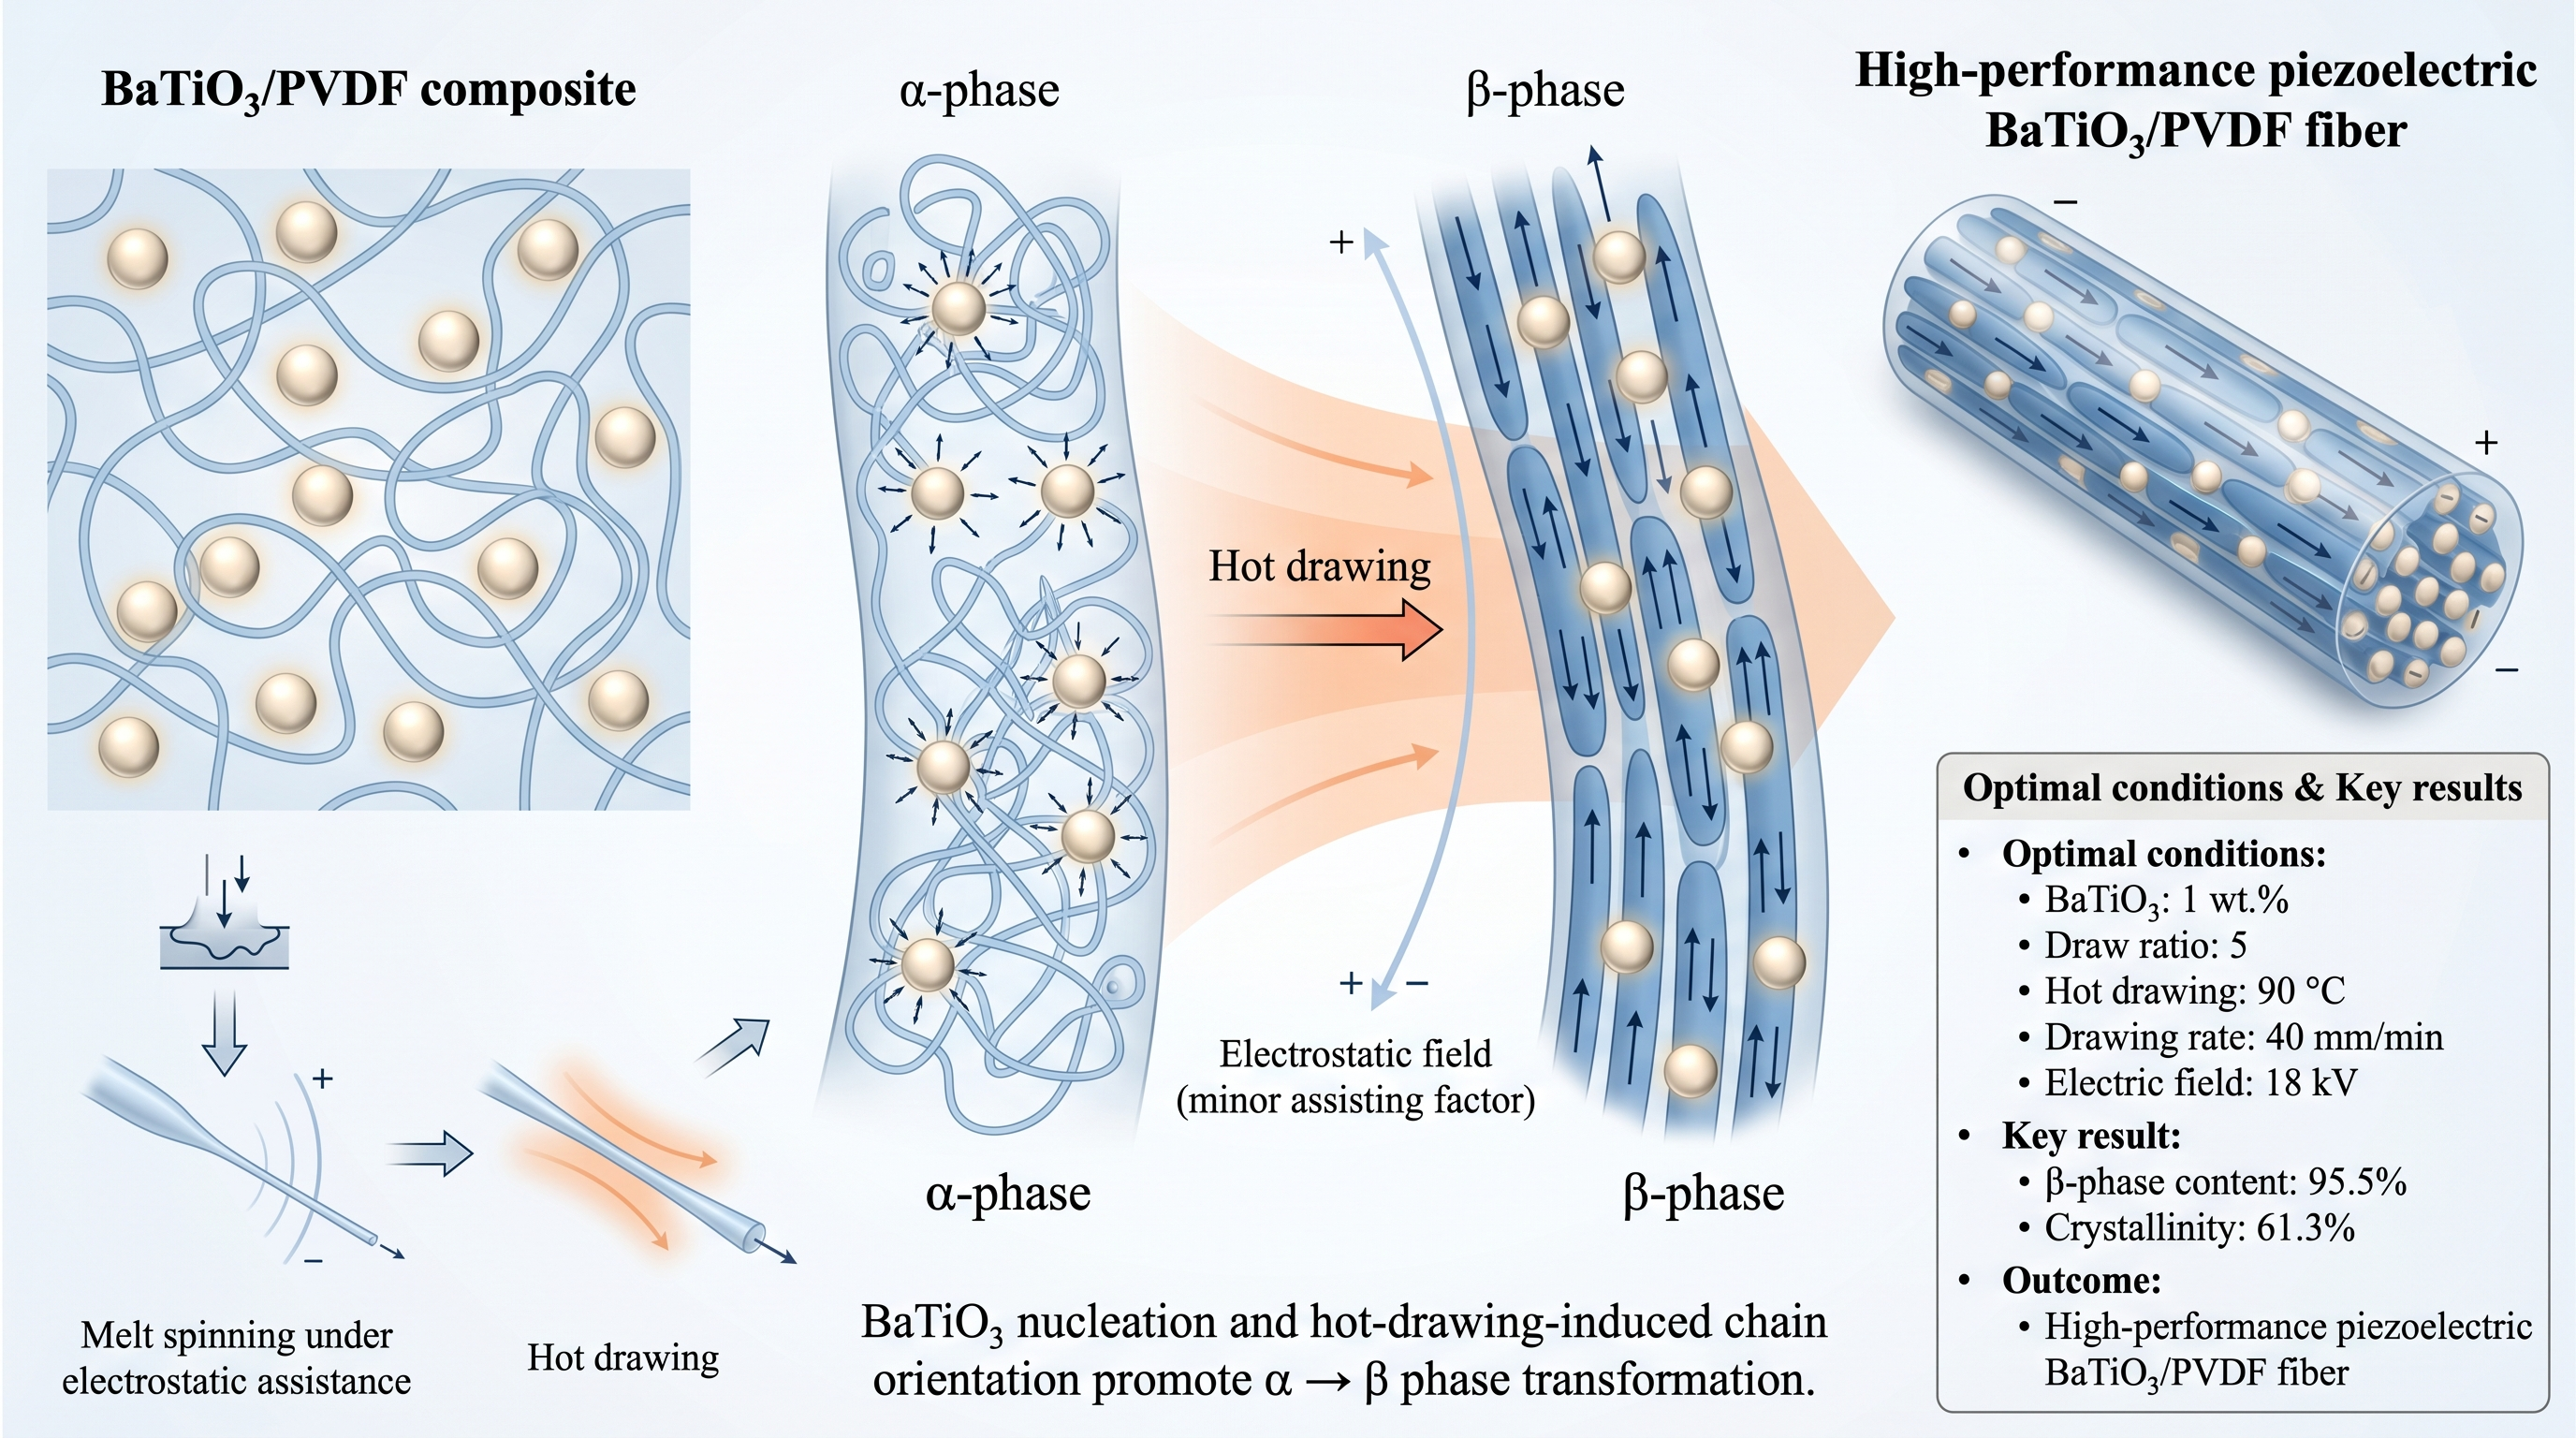
The enhancement of β-phase formation at low BaTiO3 loading can be attributed to a combination of heterogeneous nucleation and interfacial dipole interaction. BaTiO3 particles provide nucleation sites that restrict random PVDF chain packing and favor chain conformations associated with the polar β-phase. At the same time, interfacial interactions between the ceramic surface and PVDF segments can facilitate the alignment of –CH2– and –CF2– dipoles, promoting the transition from the non-polar α-phase to the electroactive β-phase. However, when the BaTiO3 content exceeds the optimum level, additional particles may no longer provide effective nucleation sites because local aggregation can reduce the available interfacial area. This explains why the β-phase content increased up to 1 wt.% BaTiO3 but did not improve substantially at higher loading.
It should be noted that F(β) (FTIR) represents the fraction of the β-phase within the crystalline regions only, whereas X
c (DSC) represents the total crystallinity (all phases), and X
β (XRD) represents the β-phase crystallinity relative to the total polymer mass. Ideally, X
β ≈ X
c × F(β). In our optimized sample, X
c = 61.3% and F(β) = 95.5%, which would predict X
β ≈ 58.5%. The higher X
β value (90.8%) obtained from XRD suggests that different assumptions or baseline corrections were used in the XRD calculation [
11]. We have therefore reported the values as obtained from each method without forcing mathematical consistency.
For comparison, fibers with 1.25 wt.% BaTiO
3 were also prepared.
Table 2 summarizes the results.
The slight decrease in all three parameters at 1.25 wt.% compared to 1 wt.% suggests that excess BaTiO3 particles agglomerate, reducing the effective interfacial area for heterogeneous nucleation. This explains why 1 wt.% is the optimal loading.
It should be noted that while the decrease in F(β), X
β, and X
c at 1.25 wt.% BaTiO
3 (
Table 2) indirectly suggests particle agglomeration, direct imaging (SEM, TEM, or EDS) of the 1.25 wt.% sample was not performed. Such characterization is planned for future work to directly confirm the aggregation mechanism.
To contextualize our results,
Table 3 compares the β-phase content obtained in this work with previously reported values for PVDF-based fibers and composites.
As shown in the previous
Table 3, the β-phase content achieved in this study (95.5%) is significantly higher than previously reported values for melt-spun PVDF fibers (70–75%) and BaTiO
3/PVDF composites (80–85%). This demonstrates that the combined use of solvent-assisted pre-dispersion, electrostatic-field-assisted melt spinning, and controlled thermal drawing is an effective strategy for promoting α-to-β phase transformation.
3.2.2. BaTiO3/PVDF Fibers at Different Thermal Stretching Ratios
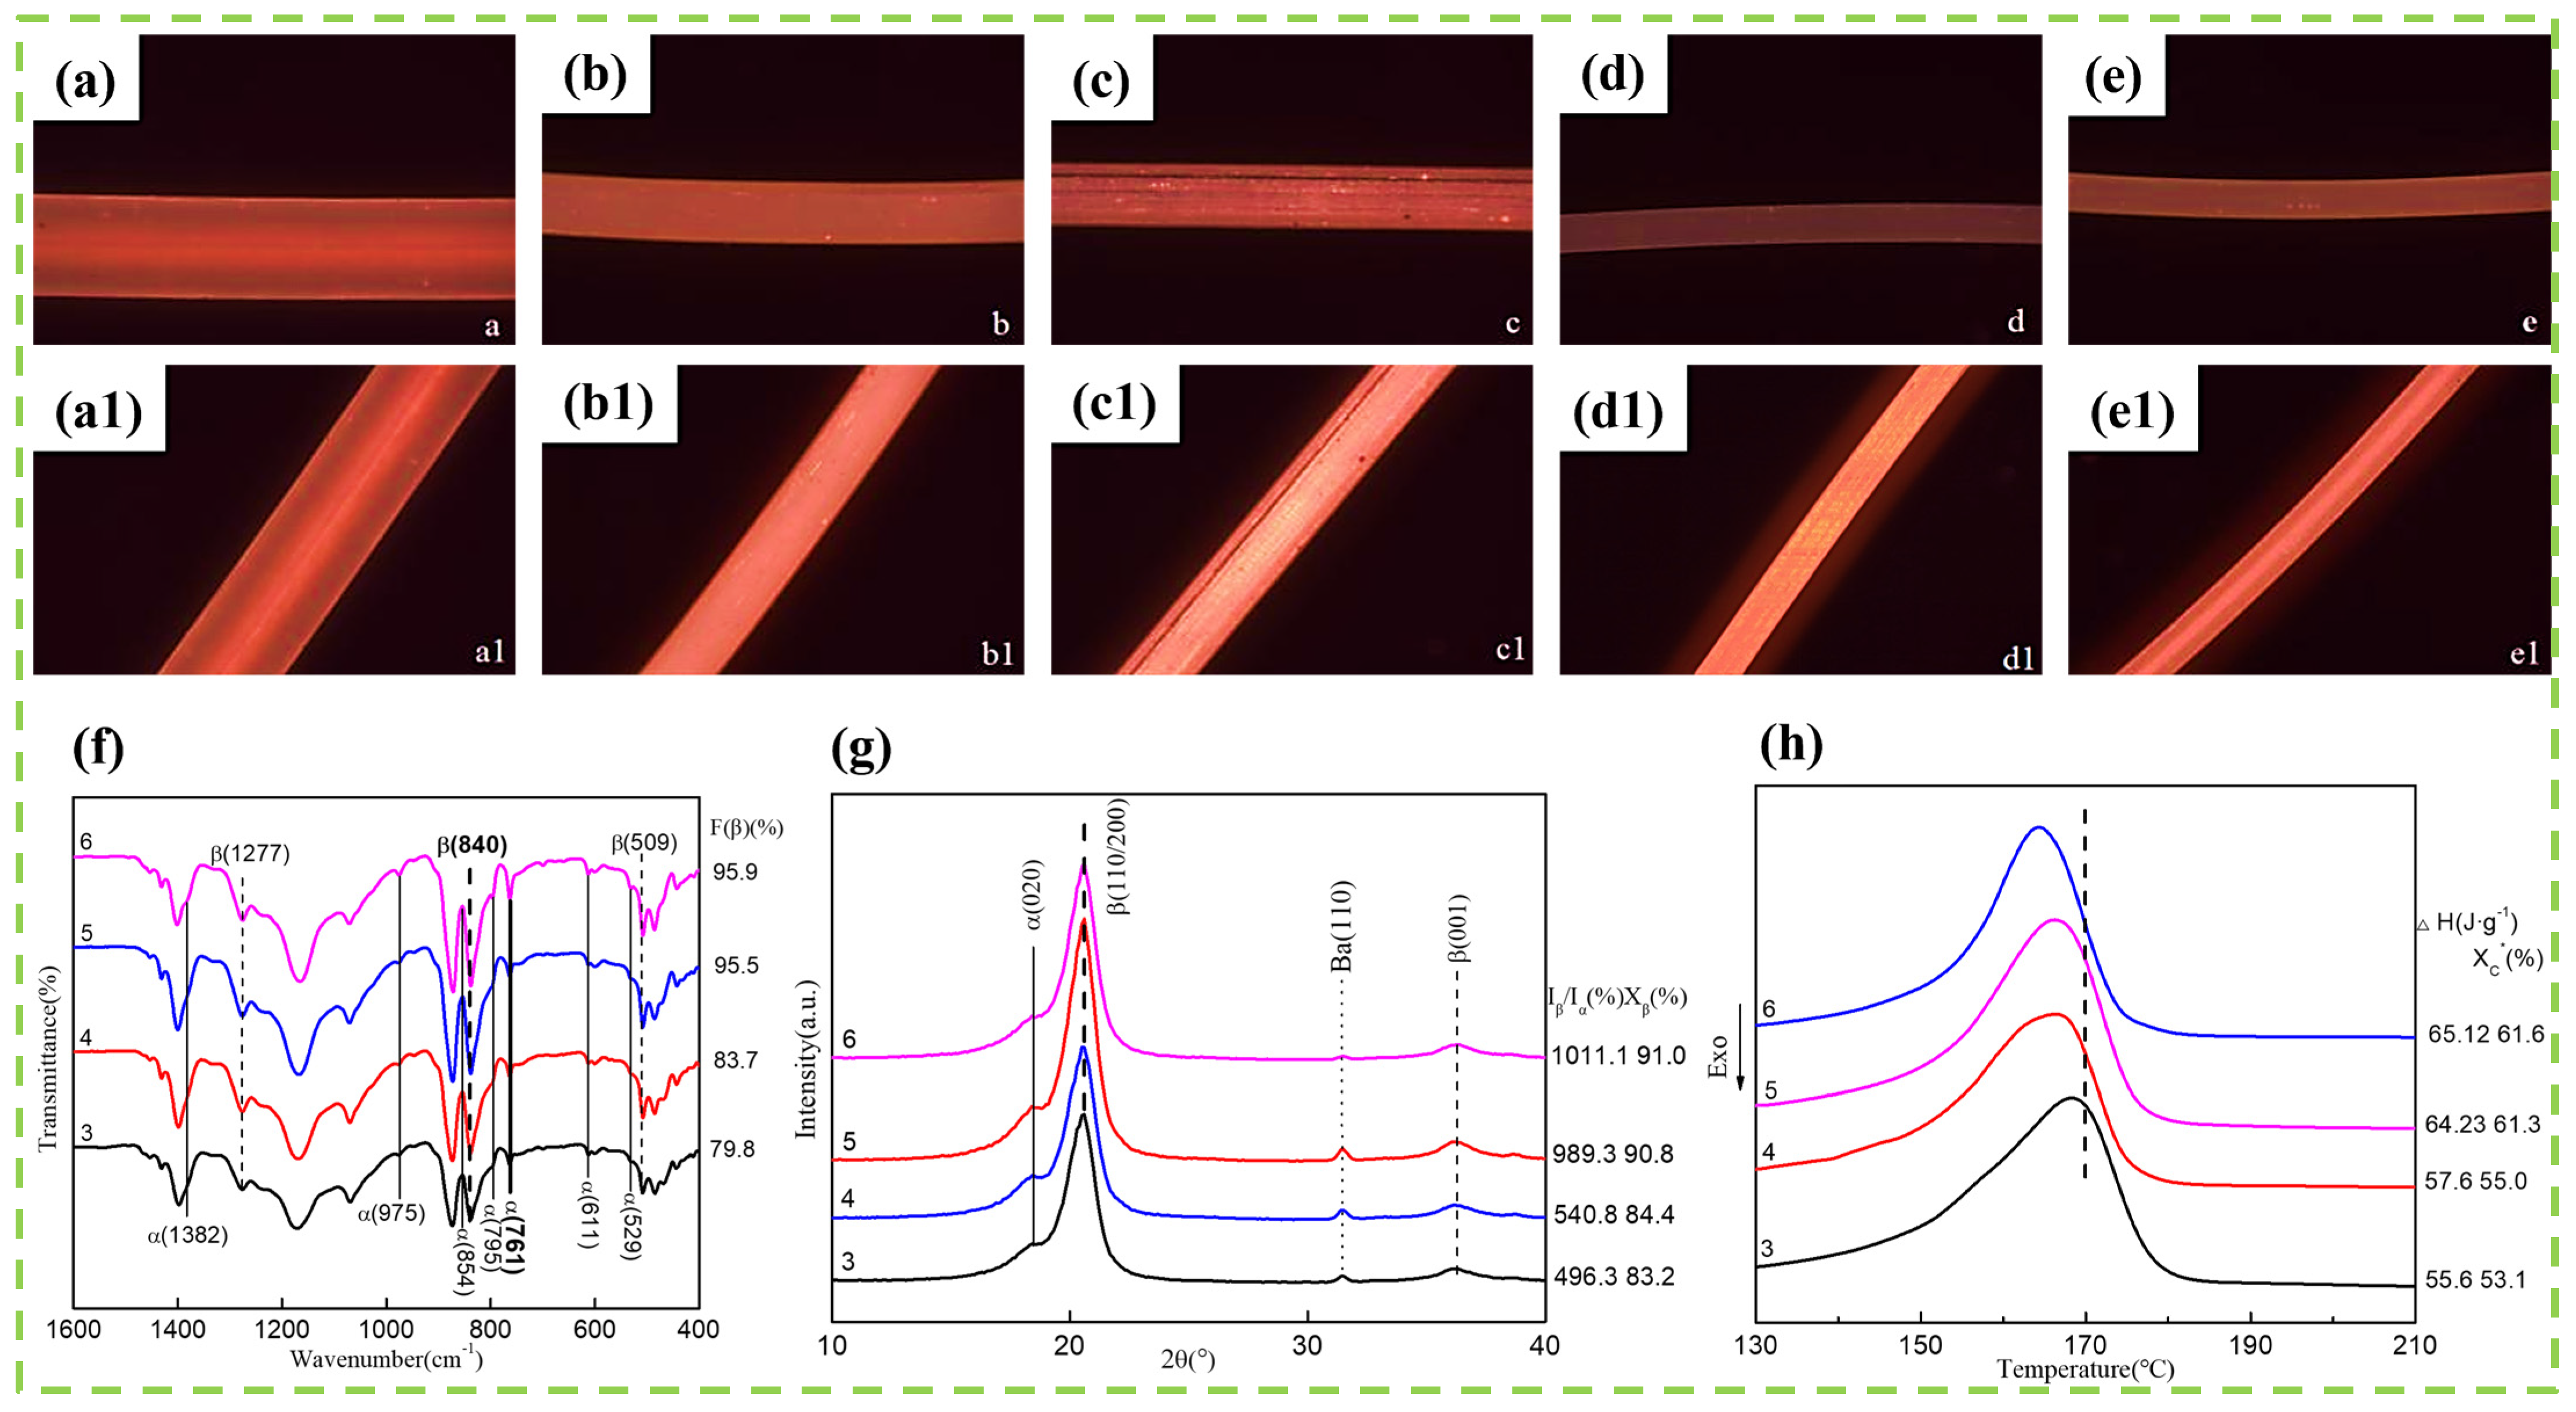
Figure 4a–e1 shows the polarizing microscope (POM) images of BaTiO
3/PVDF fibers at thermal stretching ratios of 0, 3, 4, 5, and 6, with a BaTiO
3 weight content of 1 wt.% in each sample. During testing, the polarizer and the stage were orthogonal in their vibration directions, in an extinction position, with the field of view in darkness.
Figure 4a–e were taken in this state. The stage was rotated 45° to a diagonal position, providing the brightest field of view;
Figure 4a1–e1 were taken in this state. As BaTiO
3/PVDF fibers are stretched uniaxially in the opposite direction, the fiber length increases and the diameter decreases. The molecular chains are affected by external force and point in the direction of that force. In this direction, the macroscopic properties of the polymer are different from those in other directions, and the material is anisotropic [
7]. In terms of optical properties, the orientation of the polymer leads to the occurrence of birefringence. Therefore, the degree of orientation of BaTiO
3/PVDF fibers can be judged by the difference between the extinction position and the diagonal position under different thermal stretching ratios using a polarized light microscope.
Figure 4a,a1 show that the brightness of the nascent PVDF fibers at the diagonal position and the extinction position is almost the same, with no essential difference. This indicates that the nascent fibers are mainly isotropic when they have not undergone thermal stretching treatment. That is, the orientation of the macromolecules in the fibers is not good at this time, and the arrangement is relatively disordered.
Figure 4b,b1 show the composite fibers stretched 3 times. It can be seen that the brightness in
Figure 4b,b1 begins to improve. The brightness at the diagonal position is stronger than that at the extinction position. The fiber orientation gradually increases and the anisotropy gradually increases. The field of view at the extinction position in
Figure 4c becomes darker and darker, while the field of view at the diagonal position in
Figure 4c1 becomes brighter and brighter. The fiber orientation becomes stronger and stronger. When the thermal stretching ratio reaches 5, the darkest area is the extinction position, and the brightest area is the diagonal position, indicating that the BaTiO
3/PVDF fiber has the highest orientation and anisotropy at this point. Further increasing the thermal stretching ratio reduces the orientation of the composite fiber.
Figure 4a–e1 shows the polarizing microscope (POM) images of BaTiO
3/PVDF fibers at thermal stretching ratios of 0, 3, 4, 5, and 6, with a BaTiO
3 weight content of 1 wt.% in each sample. During testing, the polarizer and the stage were orthogonal in their vibration directions, in an extinction position, with the field of view in darkness.
Figure 4a–e were taken in this state. The stage was rotated 45° to a diagonal position, providing the brightest field of view;
Figure 4a1–e1 were taken in this state. As BaTiO
3/PVDF fibers are stretched uniaxially in the opposite direction, the fiber length increases and the diameter decreases. The molecular chains are affected by external force and point in the direction of that force. In this direction, the macroscopic properties of the polymer are different from those in other directions, and the material is anisotropic [
7]. In terms of optical properties, the orientation of the polymer leads to the occurrence of birefringence. Therefore, the degree of orientation of BaTiO
3/PVDF fibers can be judged by the difference between the extinction position and the diagonal position under different thermal stretching ratios using a polarized light microscope.
Figure 4(a,a1) show that the brightness of the nascent PVDF fibers at the diagonal position and the extinction position is almost the same, with no essential difference. This indicates that the nascent fibers are mainly isotropic when they have not undergone thermal stretching treatment. That is, the orientation of the macromolecules in the fibers is not good at this time, and the arrangement is relatively disordered.
Figure 4b,b1 show the composite fibers stretched 3 times. It can be seen that the brightness in
Figure 4b,b1 begins to improve. The brightness at the diagonal position is stronger than that at the extinction position. The fiber orientation gradually increases and the anisotropy gradually increases. The field of view at the extinction position in
Figure 4c becomes darker and darker, while the field of view at the diagonal position in
Figure 4c1 becomes brighter and brighter. The fiber orientation becomes stronger and stronger. When the thermal stretching ratio reaches 5, the darkest area is the extinction position, and the brightest area is the diagonal position, indicating that the BaTiO
3/PVDF fiber has the highest orientation and anisotropy at this point. Further increasing the thermal stretching ratio reduces the orientation of the composite fiber.
Thermal stretching contributes to β-phase formation by extending and aligning PVDF molecular chains along the fiber axis. During stretching, the chain conformation changes from the less ordered α-phase arrangement toward the all-trans conformation characteristic of the β-phase. The applied tensile stress also improves chain packing and dipole orientation, which is consistent with the observed increase in β-phase peak intensity in FTIR and XRD. The plateau beyond a stretching ratio of 5 suggests that most transformable α-phase domains have already been converted, while further stretching mainly increases the risk of mechanical damage rather than producing substantial additional β-phase formation.
Figure 4f shows the FTIR spectra of BaTiO
3/PVDF fibers containing 1 wt.% BaTiO
3, prepared at a fixed hot-stretching speed of 40 mm/min and an electric field strength of 18 kV, under different hot-stretching ratios. The hot-stretching ratio refers to the degree to which the fibers are stretched relative to their original length. As the drawing ratio increases, the β-phase characteristic peak at 840 cm
−1 intensifies sharply compared to the as-spun fiber, while the α-phase peak at 761 cm
−1 weakens dramatically and nearly disappears. This indicates that stress-induced crystallization occurs, accompanied by segmental motion of the polymer chains, leading to a pronounced α-to-β crystal phase transformation. During stretching, the α-phase spherulites are elongated along the fiber axis, and the molecular chains become more extended and aligned until they transform into the β-phase structure [
19,
21]. The β-crystal content increases significantly with the drawing ratio, reaching 95.9% at a ratio of 6. However, when the hot-stretching ratio exceeds 5, the rate of increase in β-crystal content slows down. Considering that a higher hot-stretching ratio also reduces fiber fracture strength, a hot-stretching ratio of 5 is determined to be optimal.
Figure 4g shows the XRD patterns of BaTiO
3/PVDF fibers obtained at different hot-stretching ratios. The results further confirm that the crystal structure evolves progressively with increasing fiber extension. The β-crystalline phase becomes dominant, while the α (011) diffraction peak at 19.9° is almost overlapped by the β (110/200) peak. In addition, the α (020) diffraction peak gradually decreases as the stretching ratio increases. Both I
β/I
α (%) and X
β (%) increase continuously with increasing hot-stretching ratio. At a stretching ratio of 6, I
β/I
α (%) and X
β (%) reach maximum values of 1011.1 and 91%, respectively. Nevertheless, when the stretching ratio exceeds 5, the increase in X
β slows down, which is consistent with the FTIR results. This behavior can be attributed to the tensile force applied along the fiber axis during stretching. As the stretching ratio increases, the molecular chains undergo greater segmental motion and conformational rearrangement under stress, which promotes the deformation of the α-crystal form and its transformation into the β-crystal form. The α-to-β phase transition during stretching is associated with molecular reorientation and the dipole alignment of CF
2 groups perpendicular to the fiber direction [
22].
Figure 4h shows the DSC thermograms of BaTiO
3/PVDF fibers at different hot-stretching ratios. With an increasing stretching ratio, the melting peak shifts slightly toward lower temperatures, indicating that higher fiber extension is favorable for β-phase formation. Moreover, the Xc* data show that the crystallinity of the fibers gradually increases with an increasing hot-stretching ratio.
In summary, the FTIR, XRD, and DSC results consistently demonstrate that increasing the hot-stretching ratio up to 5 promotes β-phase formation and crystallinity, while further stretching offers diminishing returns and may compromise mechanical integrity.
3.2.3. BaTiO3/PVDF Fibers with Different Stretching Rates
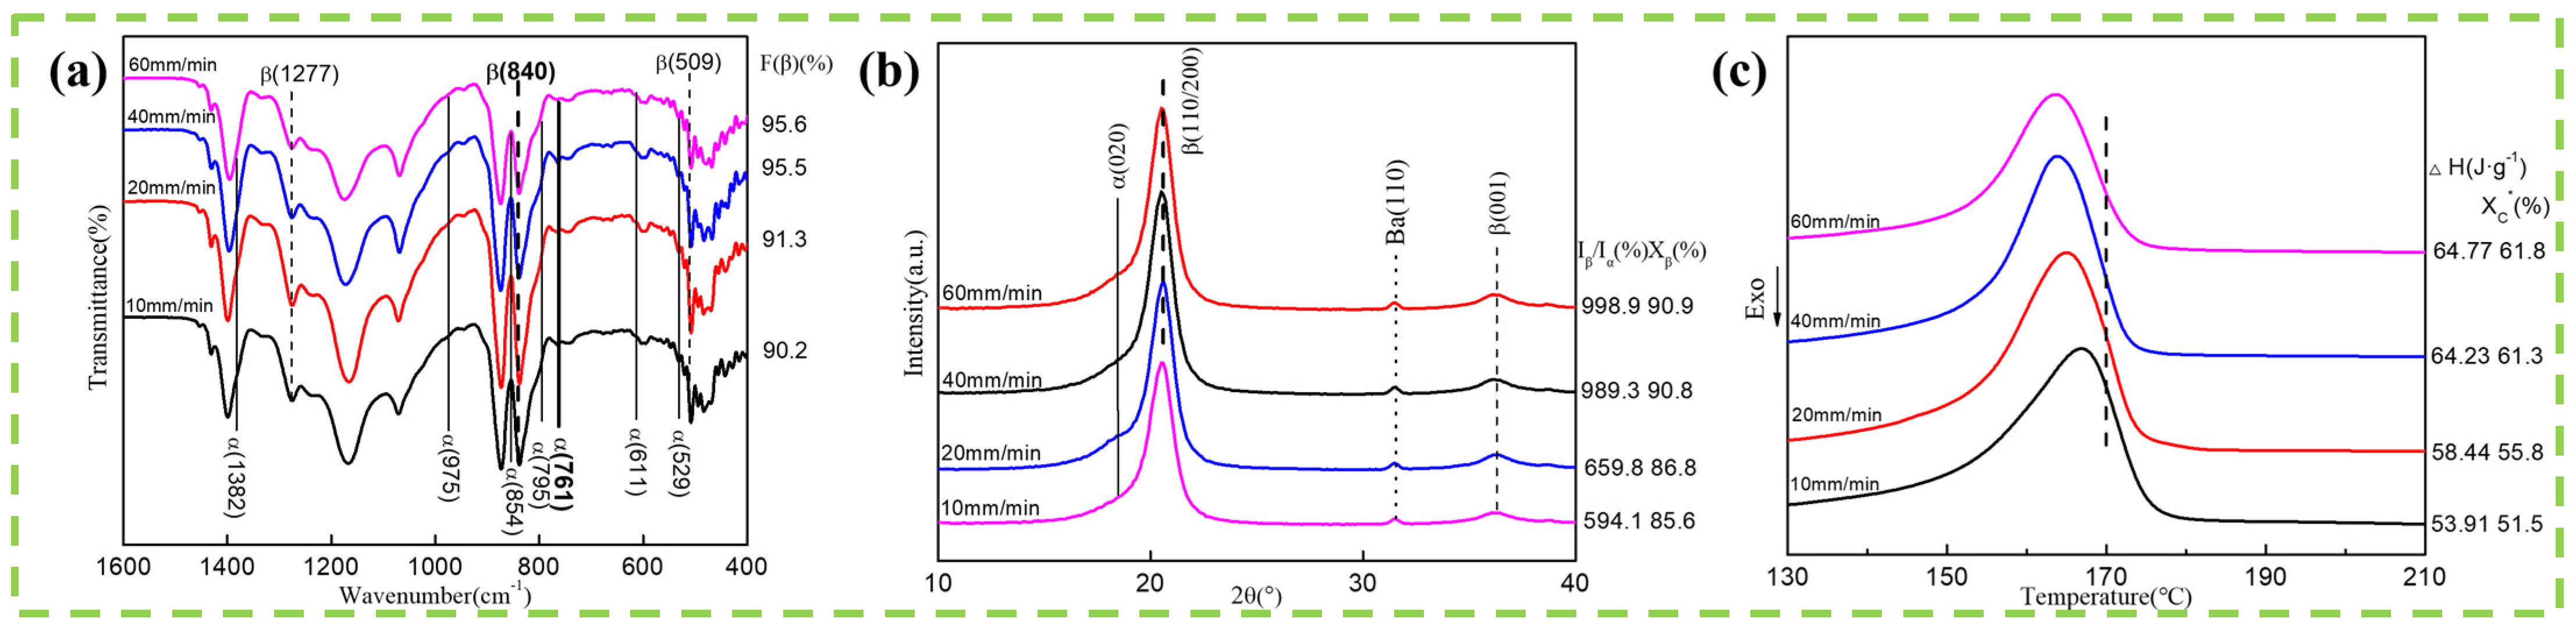
Figure 5a shows the FTIR spectra of BaTiO
3/PVDF fibers containing 1 wt.% BaTiO
3, obtained at a fixed hot-stretching ratio of 5 and an electric field strength of 18 kV, under different hot-stretching rates. Unlike the previous section, which examined the effect of stretching extent, this section focuses on the effect of how rapidly the fibers are stretched. As the hot-stretching rate increases, the β-phase content gradually rises, indicating that a faster stretching process promotes crystal-phase transition and enhances the alignment of macromolecular chains along the fiber axis. In
Figure 5a, F(β) increases progressively with increasing stretching rate, and the most favorable hot-stretching rate is 40 mm/min. When the rate exceeds 40 mm/min, the increase in F(β) becomes marginal, suggesting that further acceleration provides little additional benefit. The XRD results further support this trend. As shown in
Figure 5b, the α(020) diffraction peak gradually weakens and nearly disappears as the hot-stretching rate increases, while the other characteristic peaks remain nearly unchanged. This indicates that increasing the stretching rate promotes the reduction of the α-phase and the development of the β-phase. Correspondingly, the intensity ratio I
β/I
α (%) and the β-phase crystallinity X
β (%) increase with increasing hot-stretching rate. This behavior can be attributed to the higher internal tensile stress generated when the fiber is stretched more rapidly, which intensifies segmental motion and molecular orientation, thereby facilitating crystal transformation [
21,
23]. These results are in good agreement with the FTIR analysis. However, when the stretching rate becomes excessively high, the fiber becomes more susceptible to breakage. Therefore, 40 mm/min is considered the optimal hot-stretching rate.
Figure 5c presents the DSC thermograms of BaTiO
3/PVDF fibers prepared at different hot-stretching rates. As the stretching rate increases, the melting peak shifts toward lower temperatures, indicating an increase in β-phase content. In addition, the X
c* value increases continuously with increasing hot-stretching rate, demonstrating that faster hot stretching contributes to a gradual improvement in fiber crystallinity.
3.2.4. BaTiO3/PVDF Fibers Under Different Electric Field Strengths
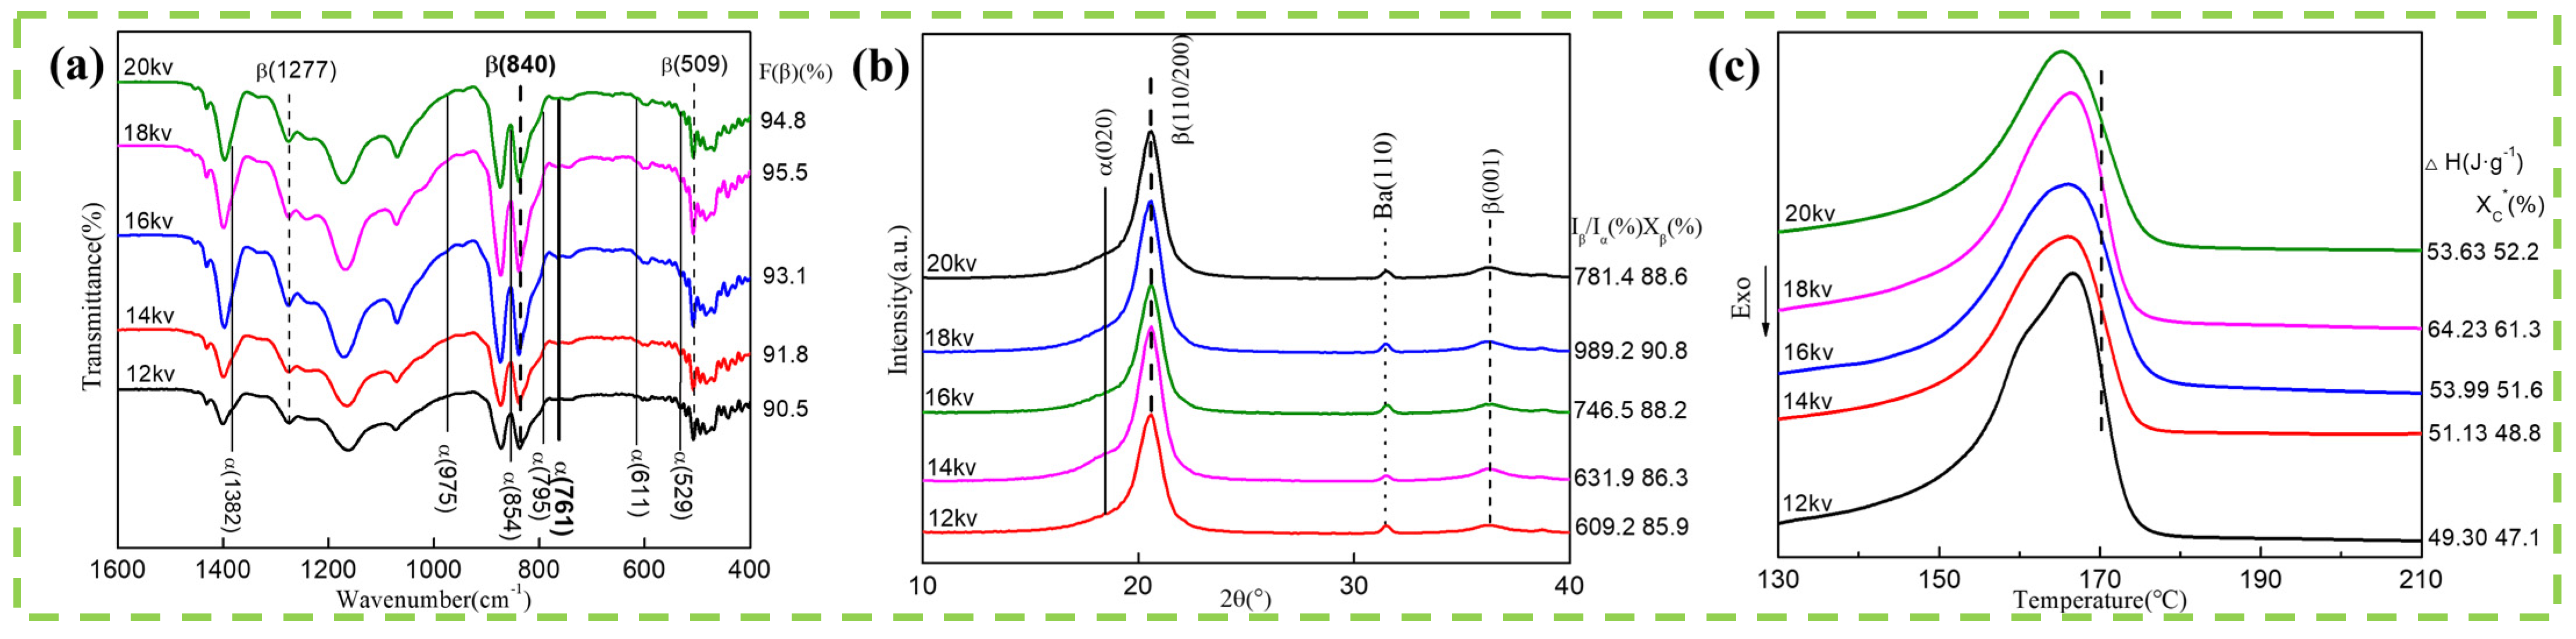
As shown in
Figure 6a, F(β) gradually increases with increasing electric field strength. This is because the fiber is not fully cured at high temperatures due to polarization. When an electrostatic field is applied along the fiber direction, the dipoles within the fiber orient themselves along the electric field direction, which in turn orients them along the fiber direction. This enhances molecular mobility, changes the molecular conformation, and facilitates crystal transformation. The greater the electric field strength, the more pronounced the dipole orientation and the higher the β crystal content. As shown in
Figure 6b, the diffraction peak at α (020) gradually disappears with increasing electric field strength, while I
β/I
α (%) and X
β (%) gradually increase, reaching maximum values of 989.2 and 90.8 respectively at 18 kV. This is consistent with FTIR analysis. The optimal electric field strength is 18 kV.
Figure 6c shows that with increasing electric field strength, the β-crystal content of the fiber increases, and the crystallinity X
c* also continuously improves. This indicates that increasing the electric field strength promotes fiber crystallization and the transformation of β-crystals.
The applied electrostatic field assists dipole orientation while the extruded fiber remains thermally mobile. Under the field, polar –CF2– dipoles tend to orient more favorably, reducing the energetic barrier for β-phase stabilization. Therefore, the electric field works synergistically with BaTiO3 nucleation and thermal drawing: BaTiO3 promotes heterogeneous nucleation, drawing aligns the chains, and the electric field assists dipole orientation. The optimum at 18 kV indicates that sufficient field strength is required for dipole alignment, whereas further increases may not produce additional β-phase growth because the available transformable domains become limited.
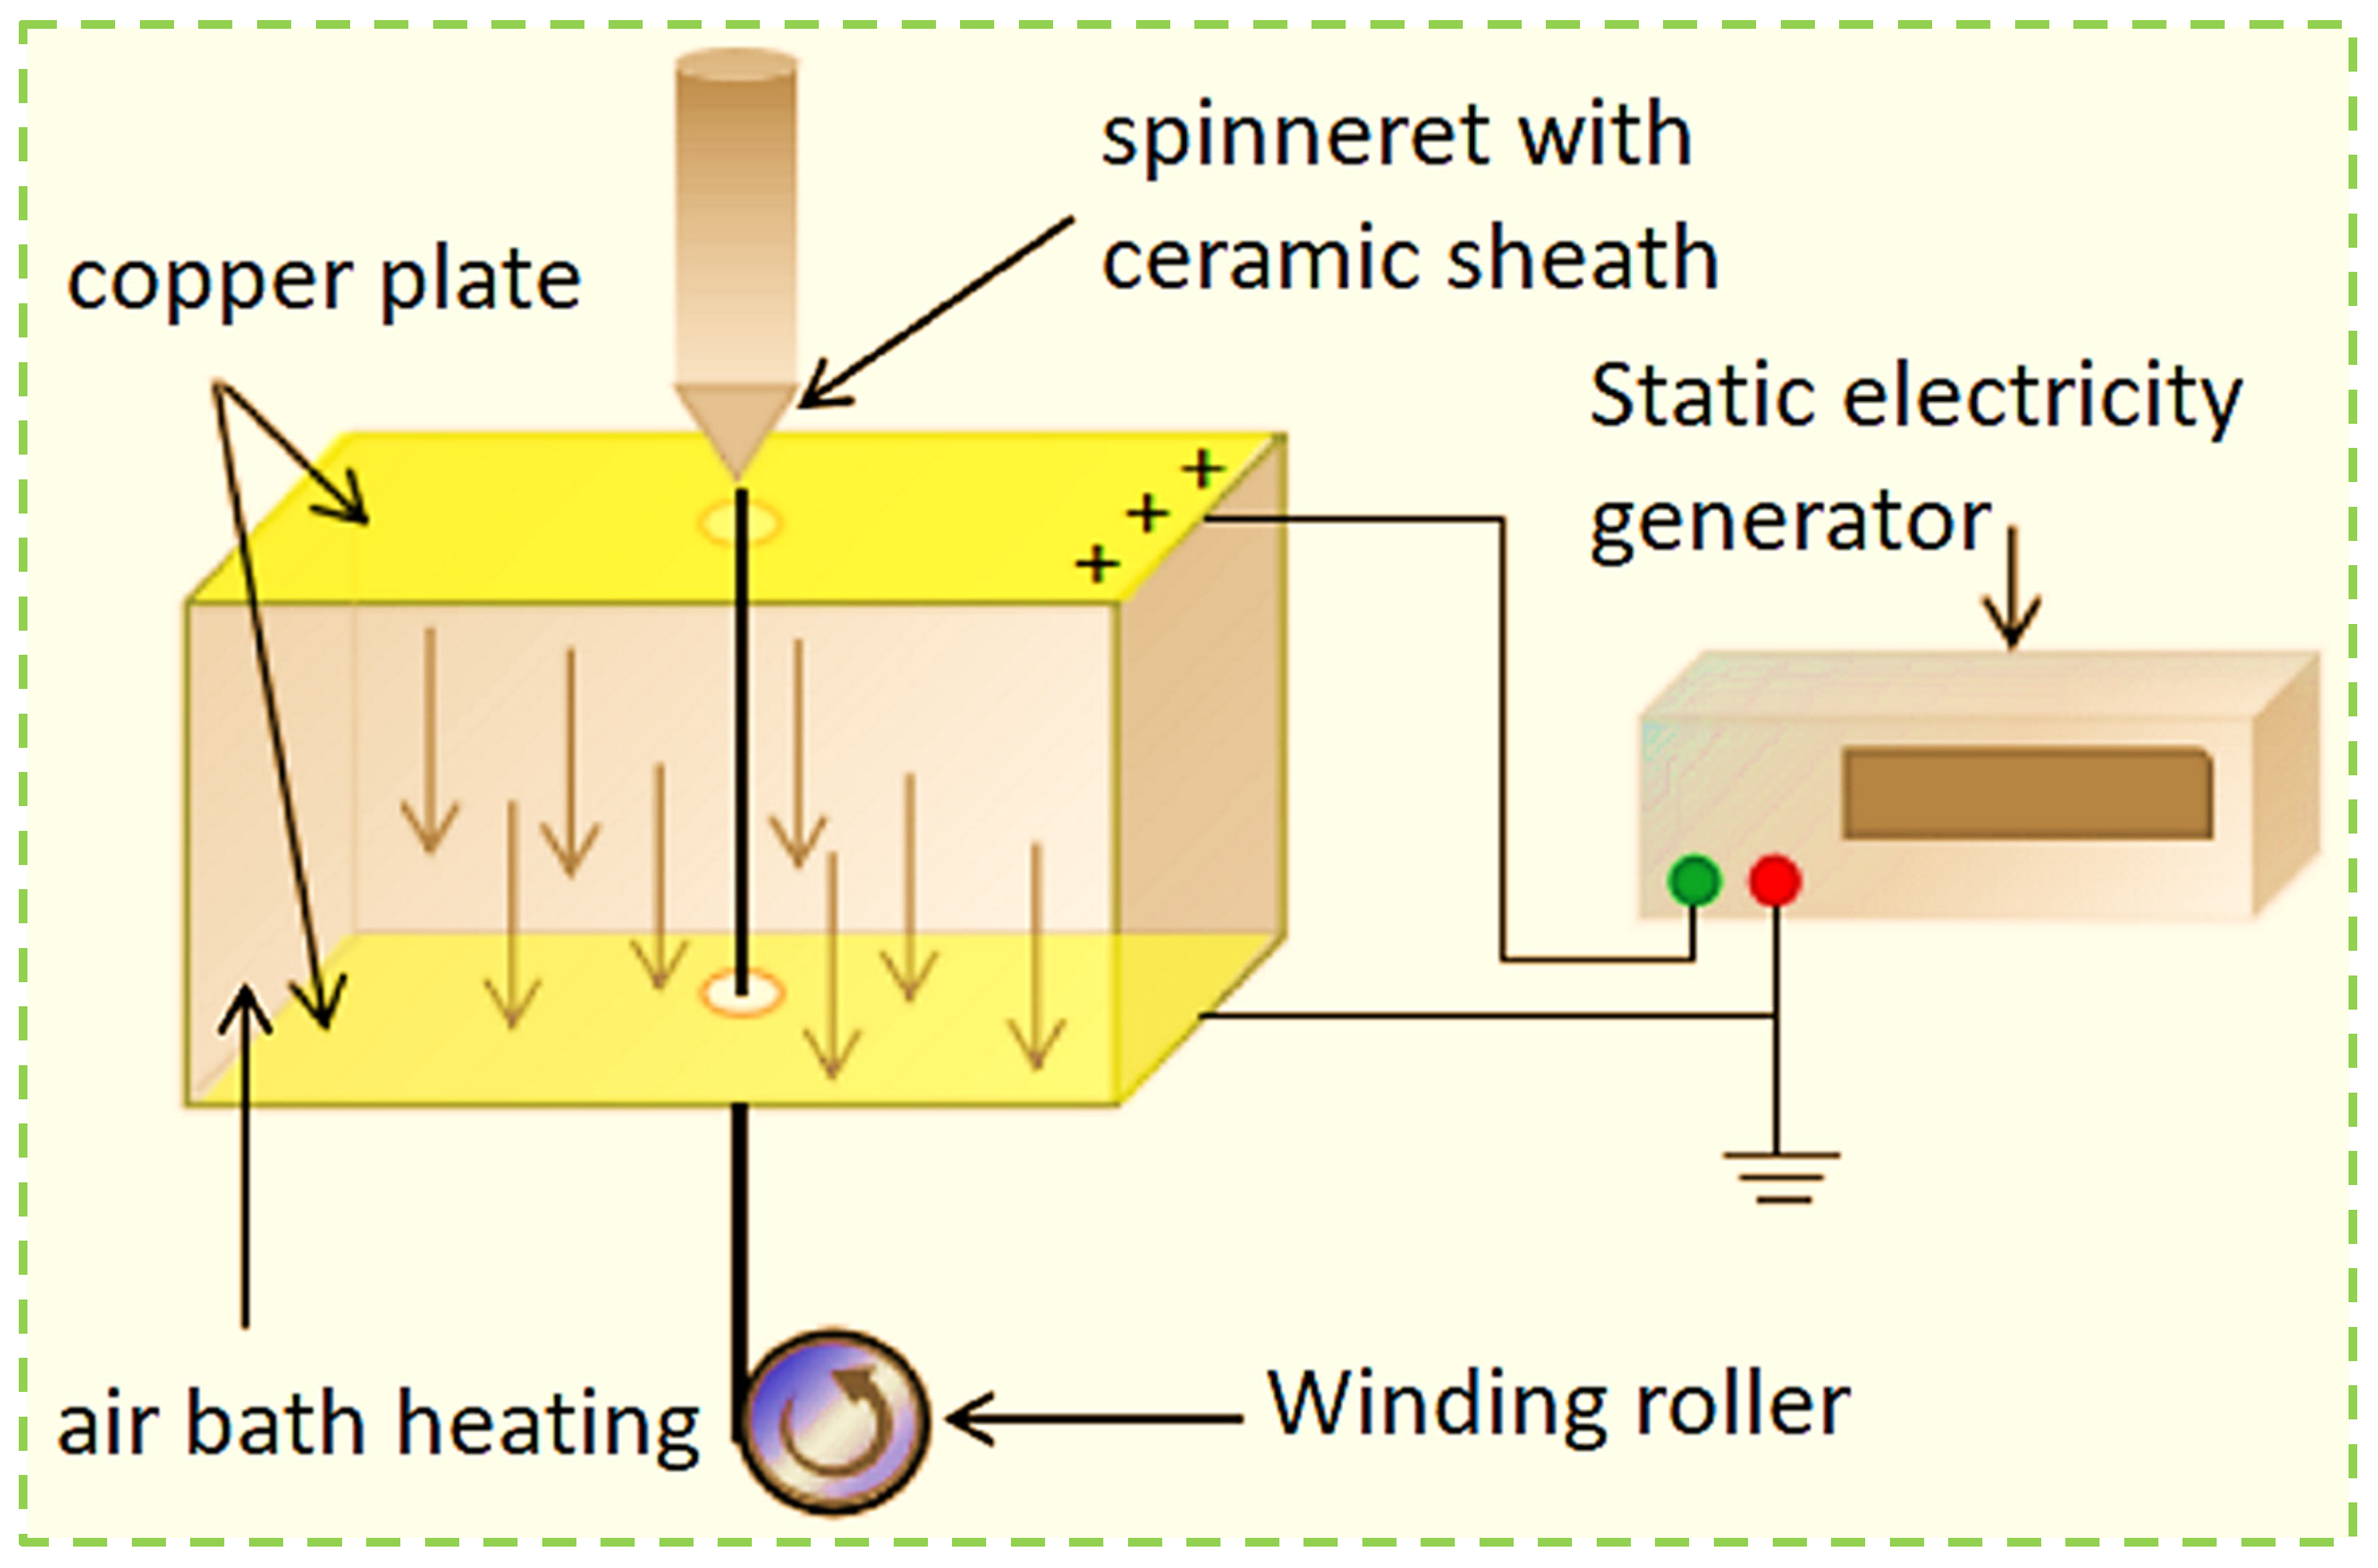
The applied voltage of 18 kV over an electrode distance of 12 cm corresponds to a nominal electric field of 1.5 kV/cm (E = V/d = 18 kV/12 cm). This field strength is within the typical poling range for PVDF (0.5–2 kV/cm) reported in the literature [
19,
24] and was sufficient to orient the –CF
2 dipoles, as confirmed by the high β-phase content (95.5%) at 18 kV and the plateau observed beyond 18 kV (
Figure 6a).
It should be noted that for the fiber diameters in this study (approximately 50–150 µm after thermal drawing), the applied electric field of 18 kV/12 cm was sufficient for effective dipole orientation. For significantly larger diameter fibers (millimeter scale), a higher field would likely be required to maintain the same poling efficiency, as the electric field strength E = V/d scales inversely with diameter.