
Multiscale Interfacial Structure and Organization of sII Gas Hydrate Interfaces Using Molecular Dynamics


Abstract
:
1. Introduction
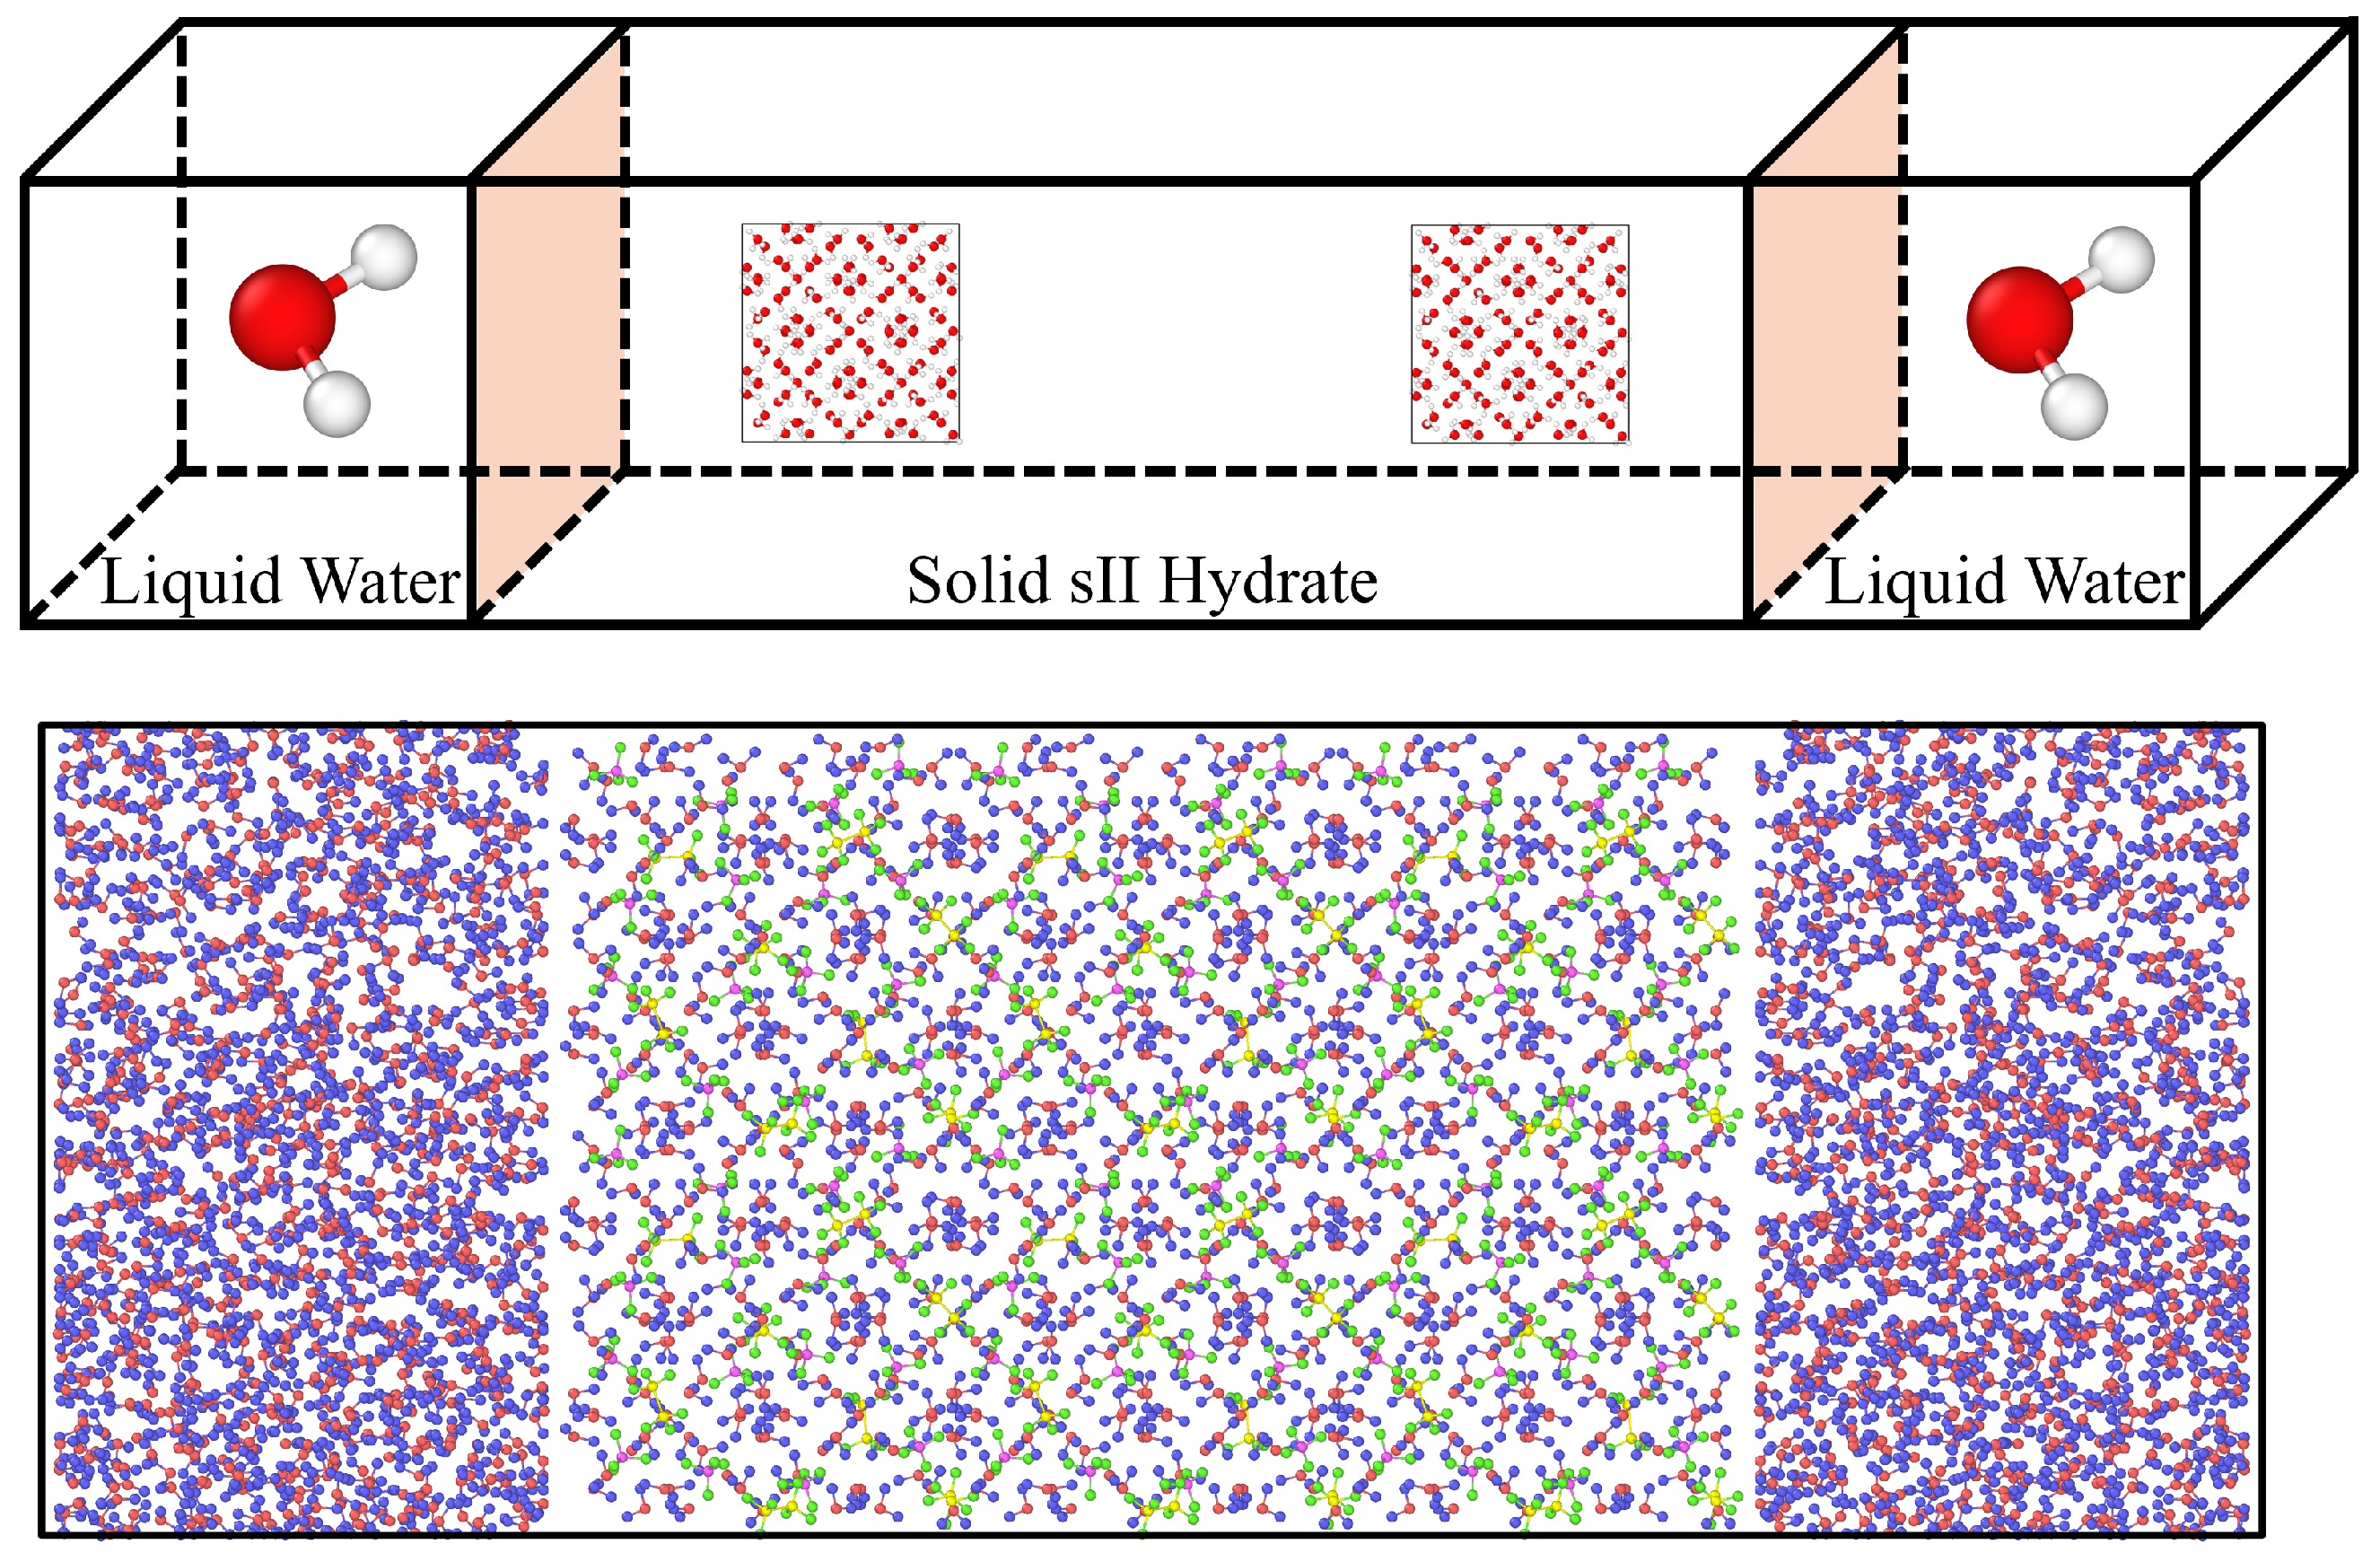
2. Materials and Methods
3. Results
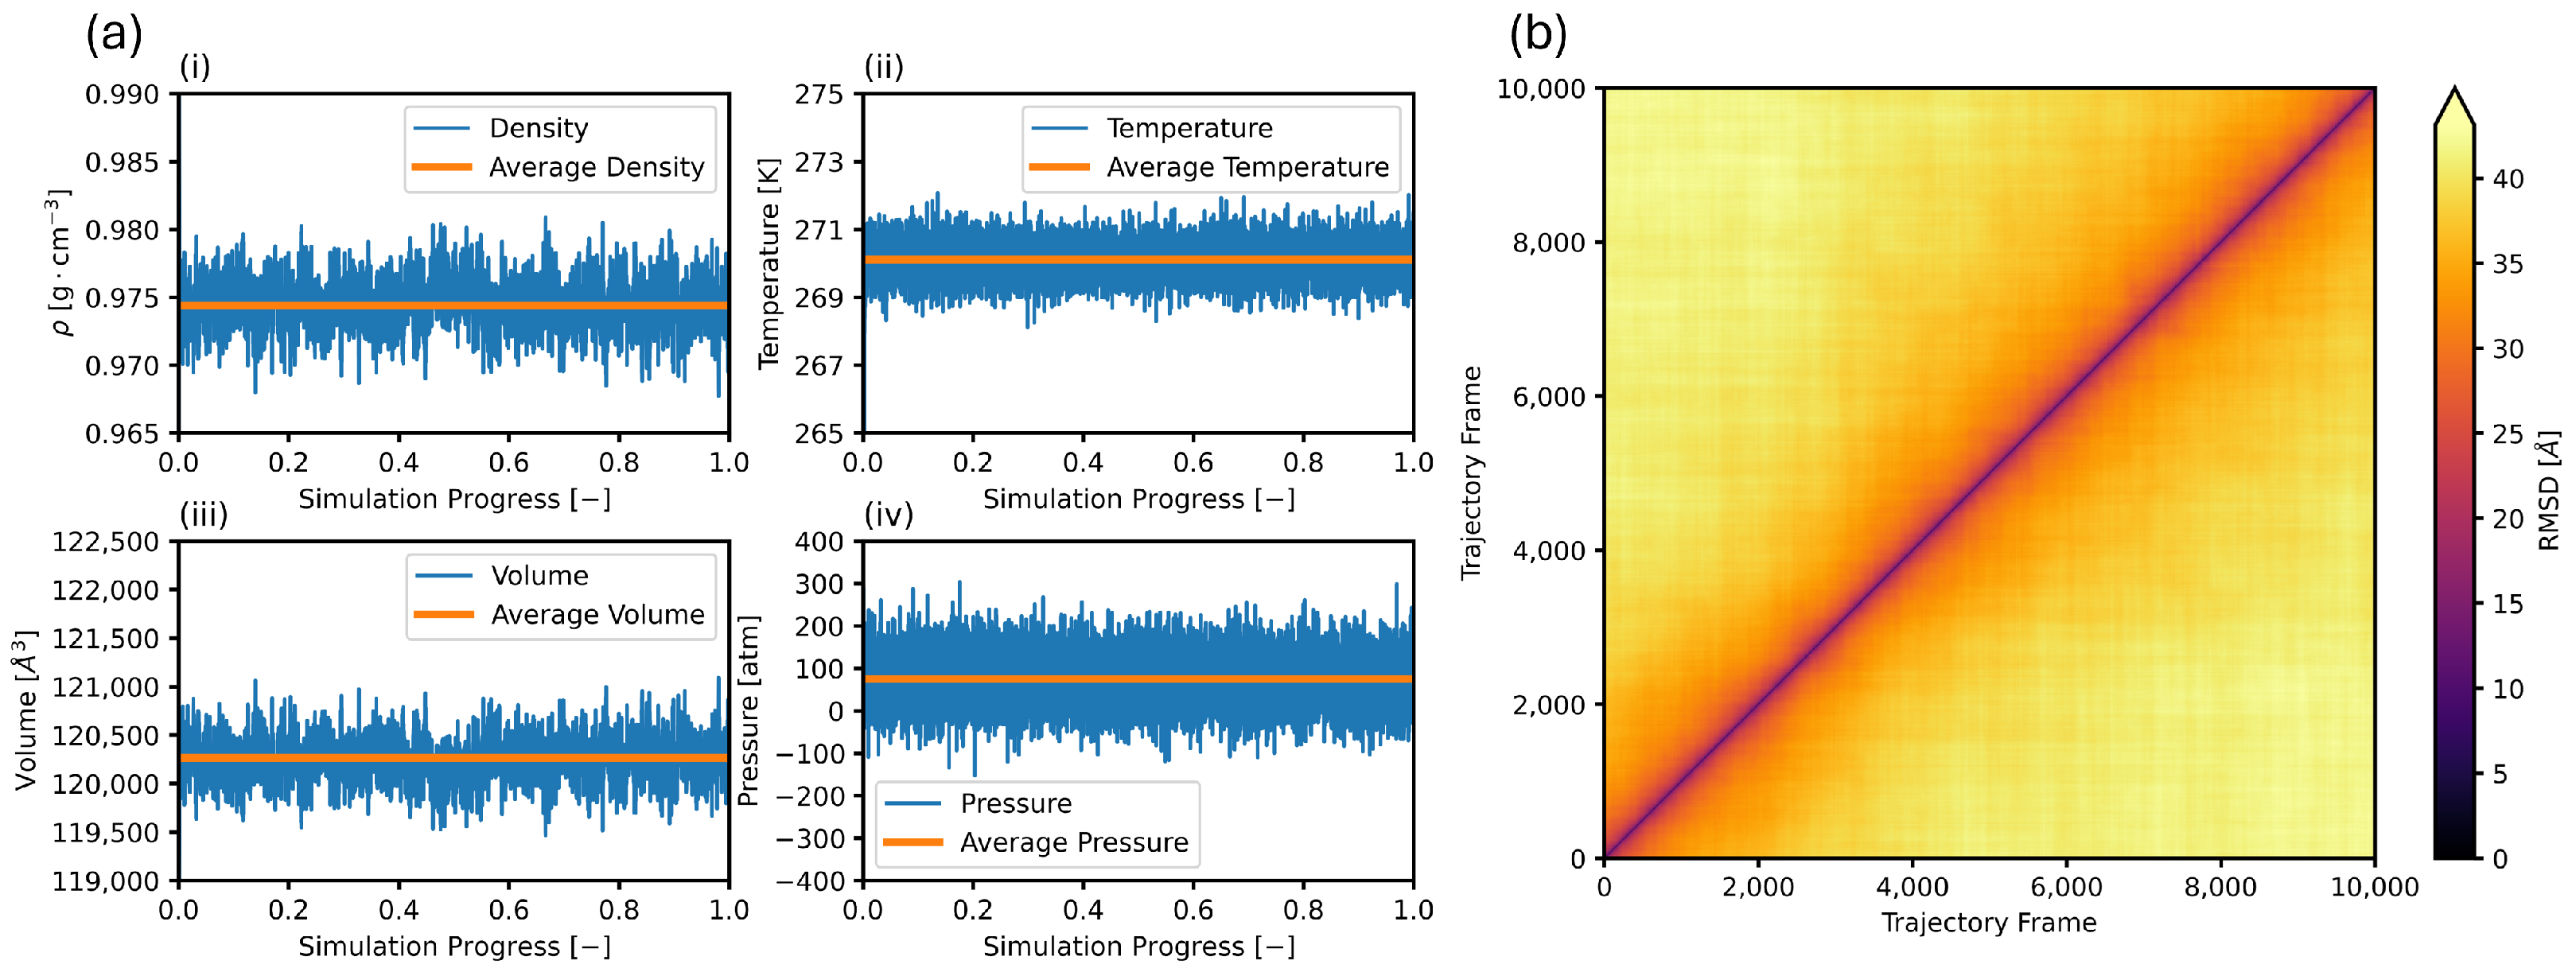
3.1. Equilibration
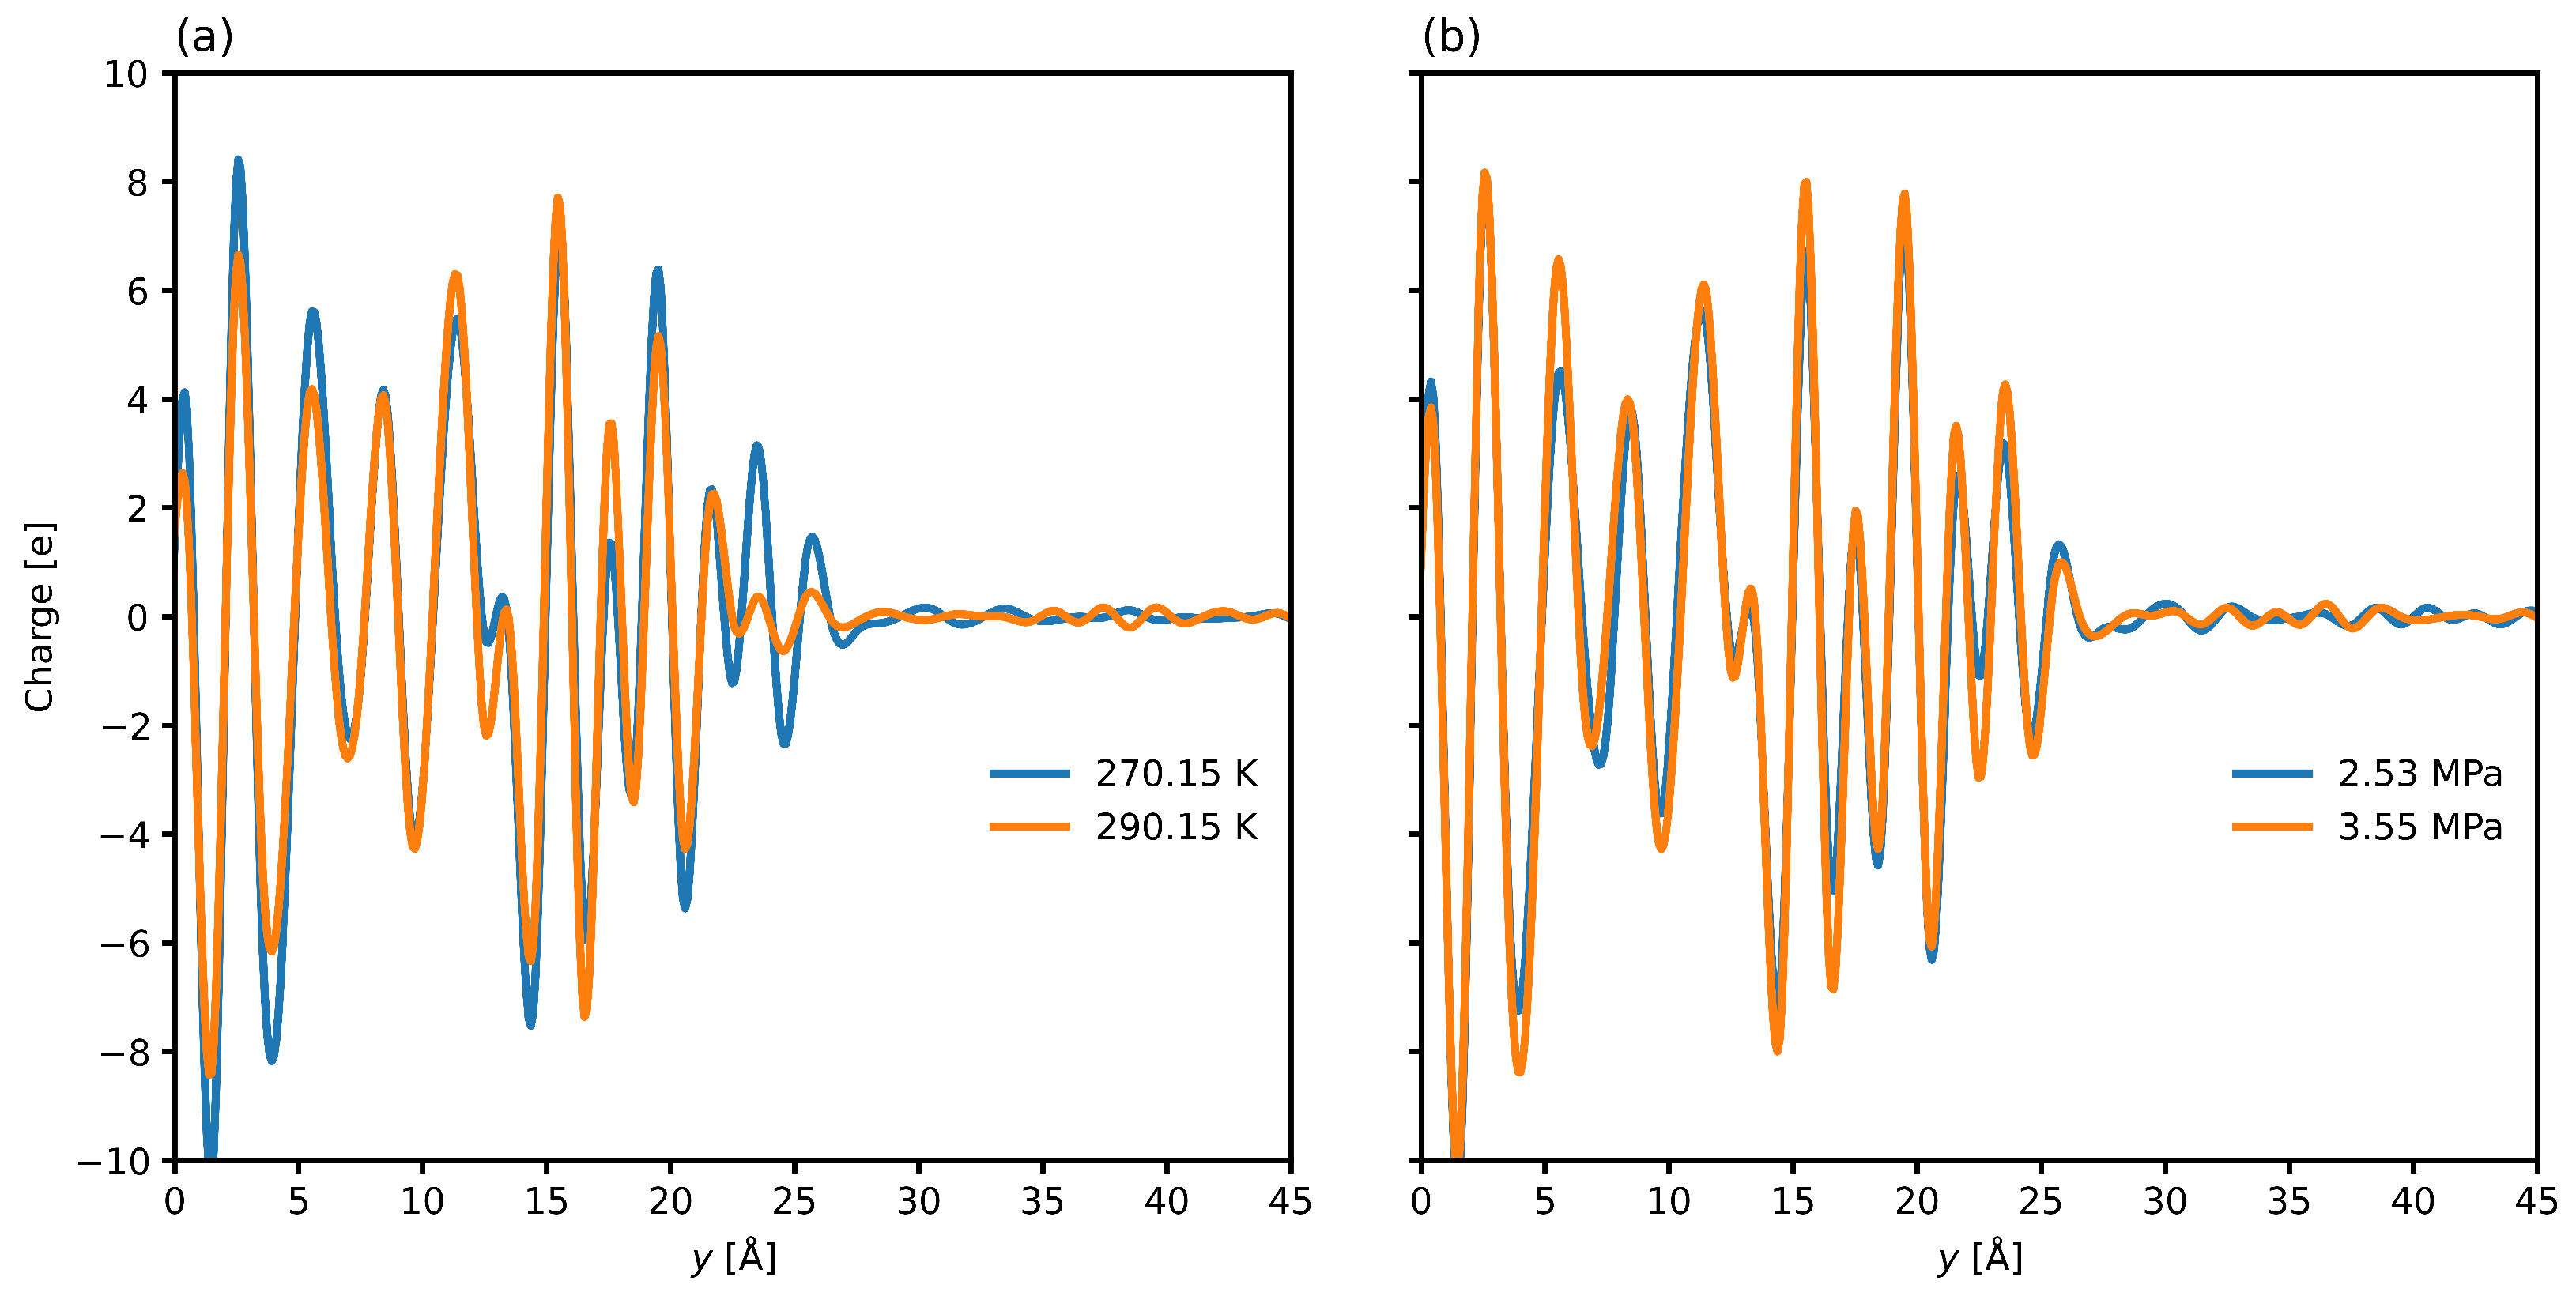
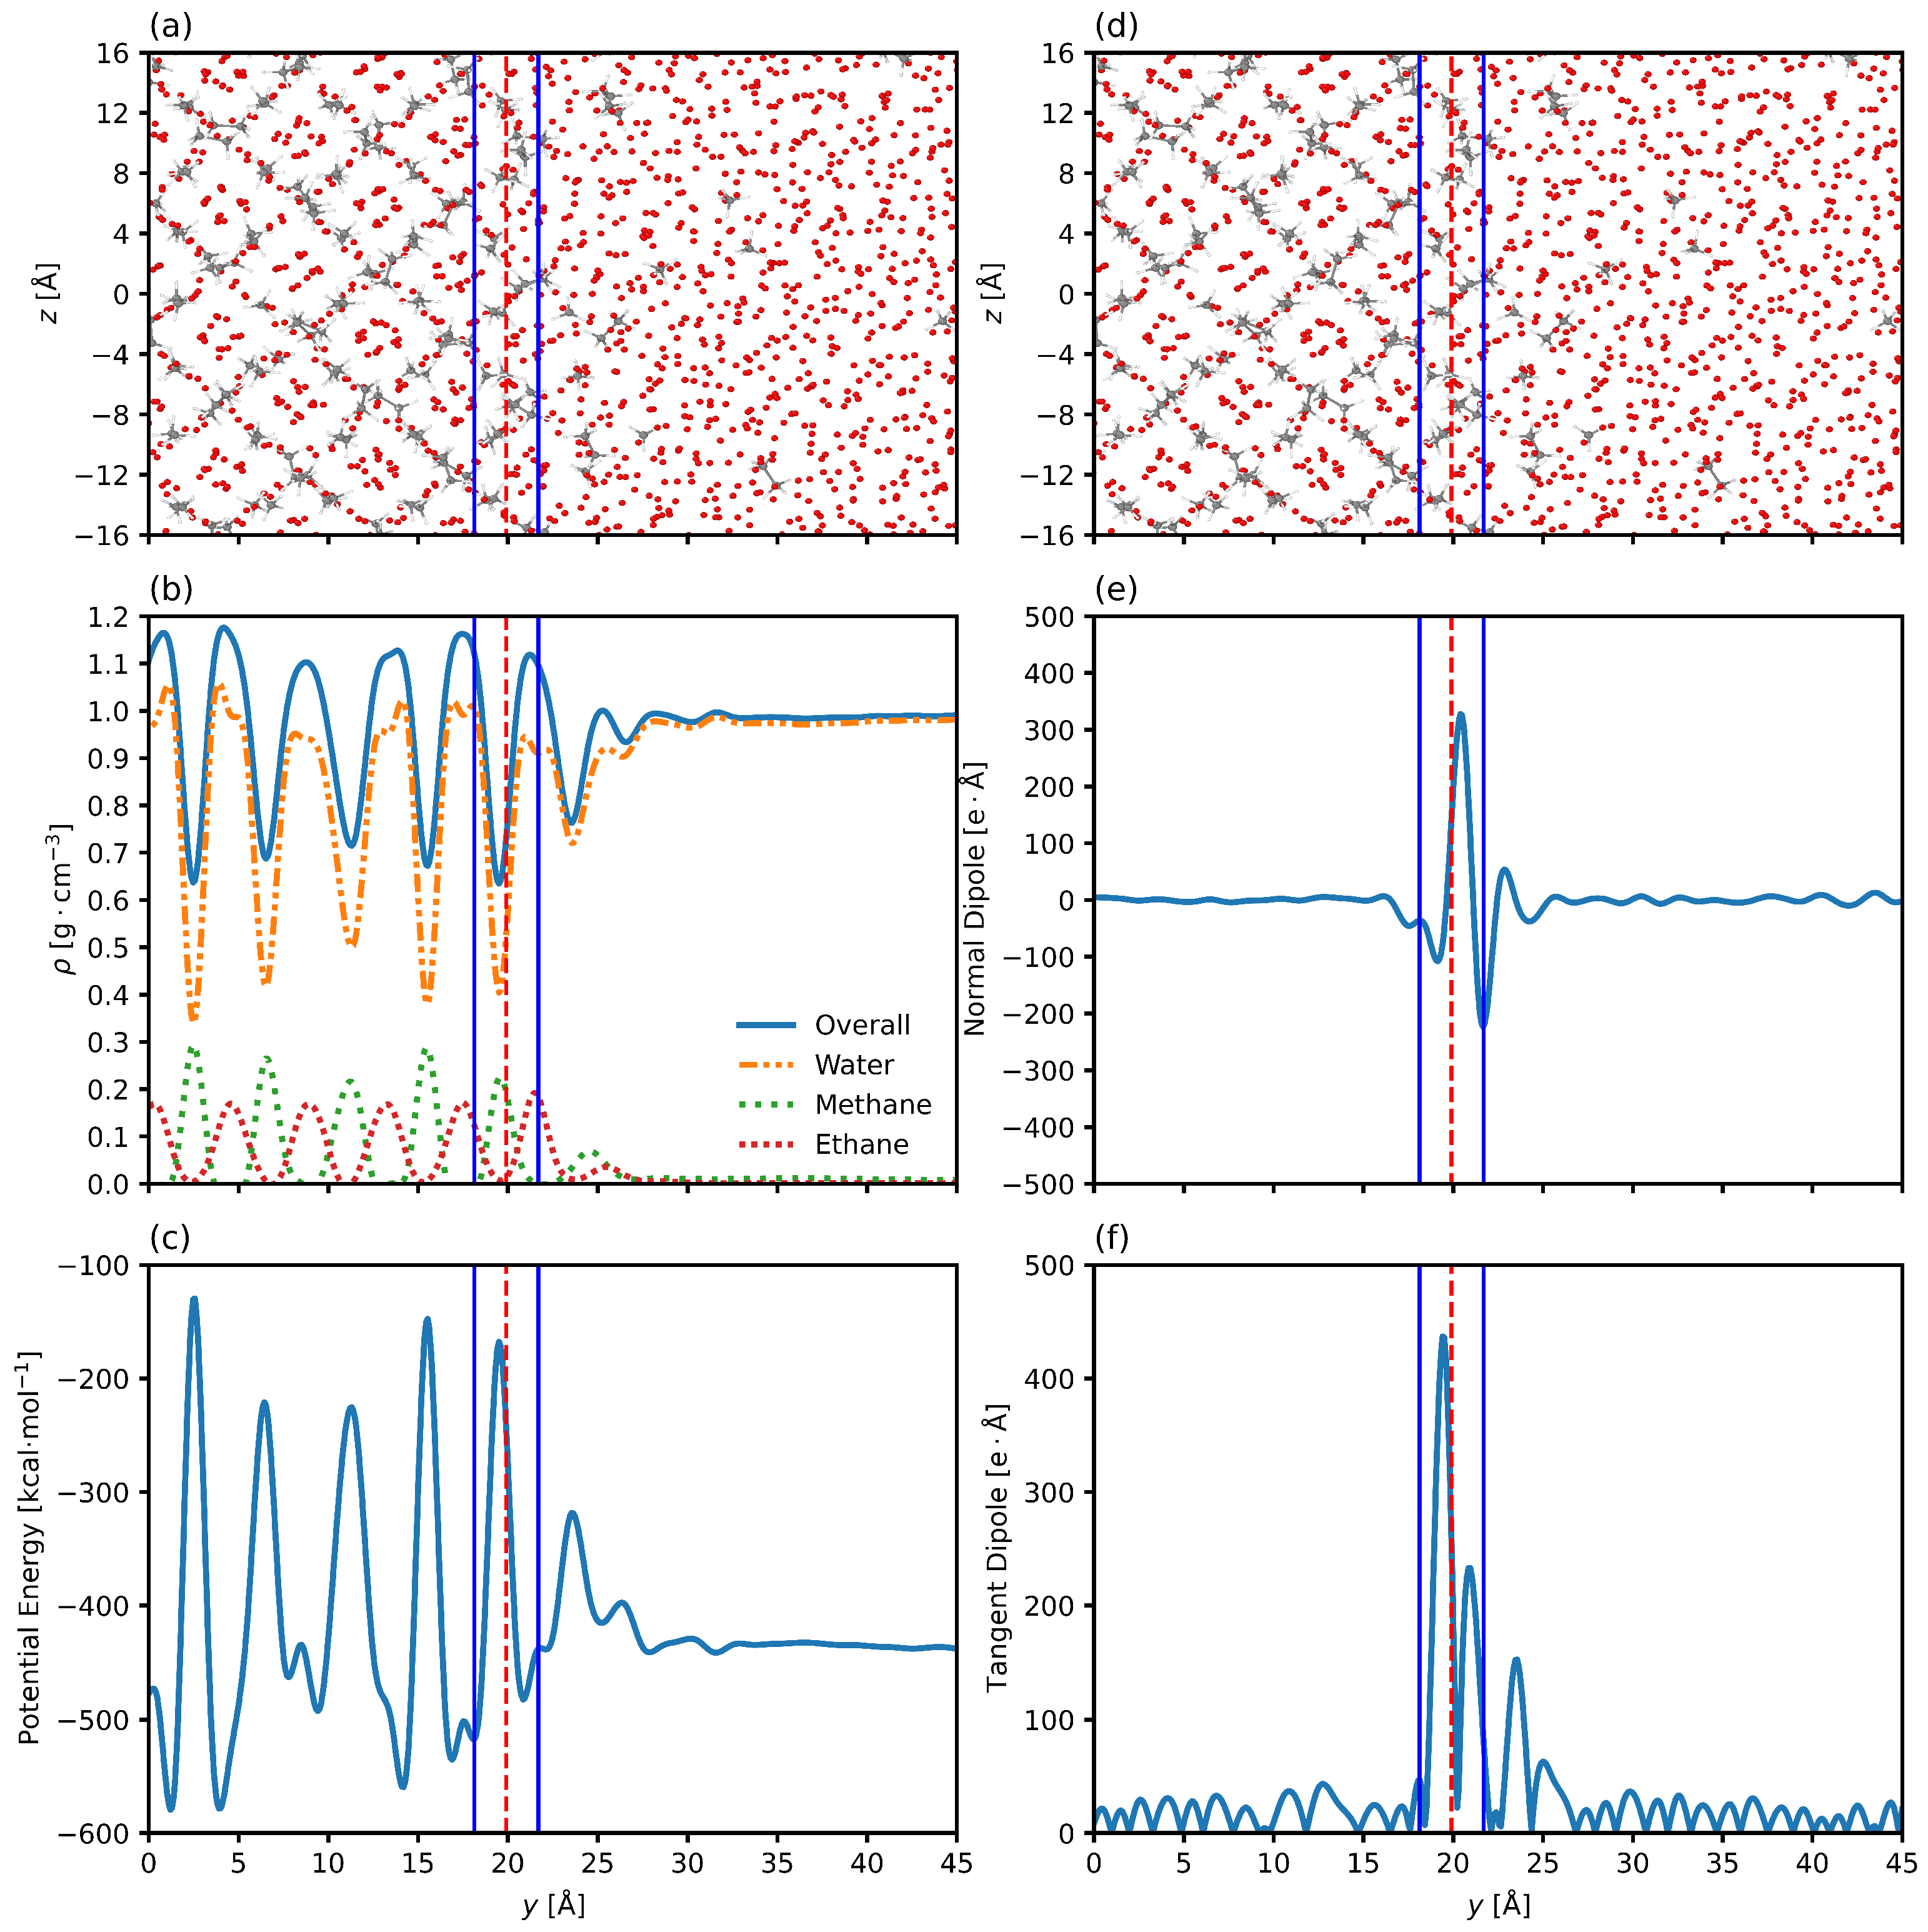
3.2. Interfacial Structure
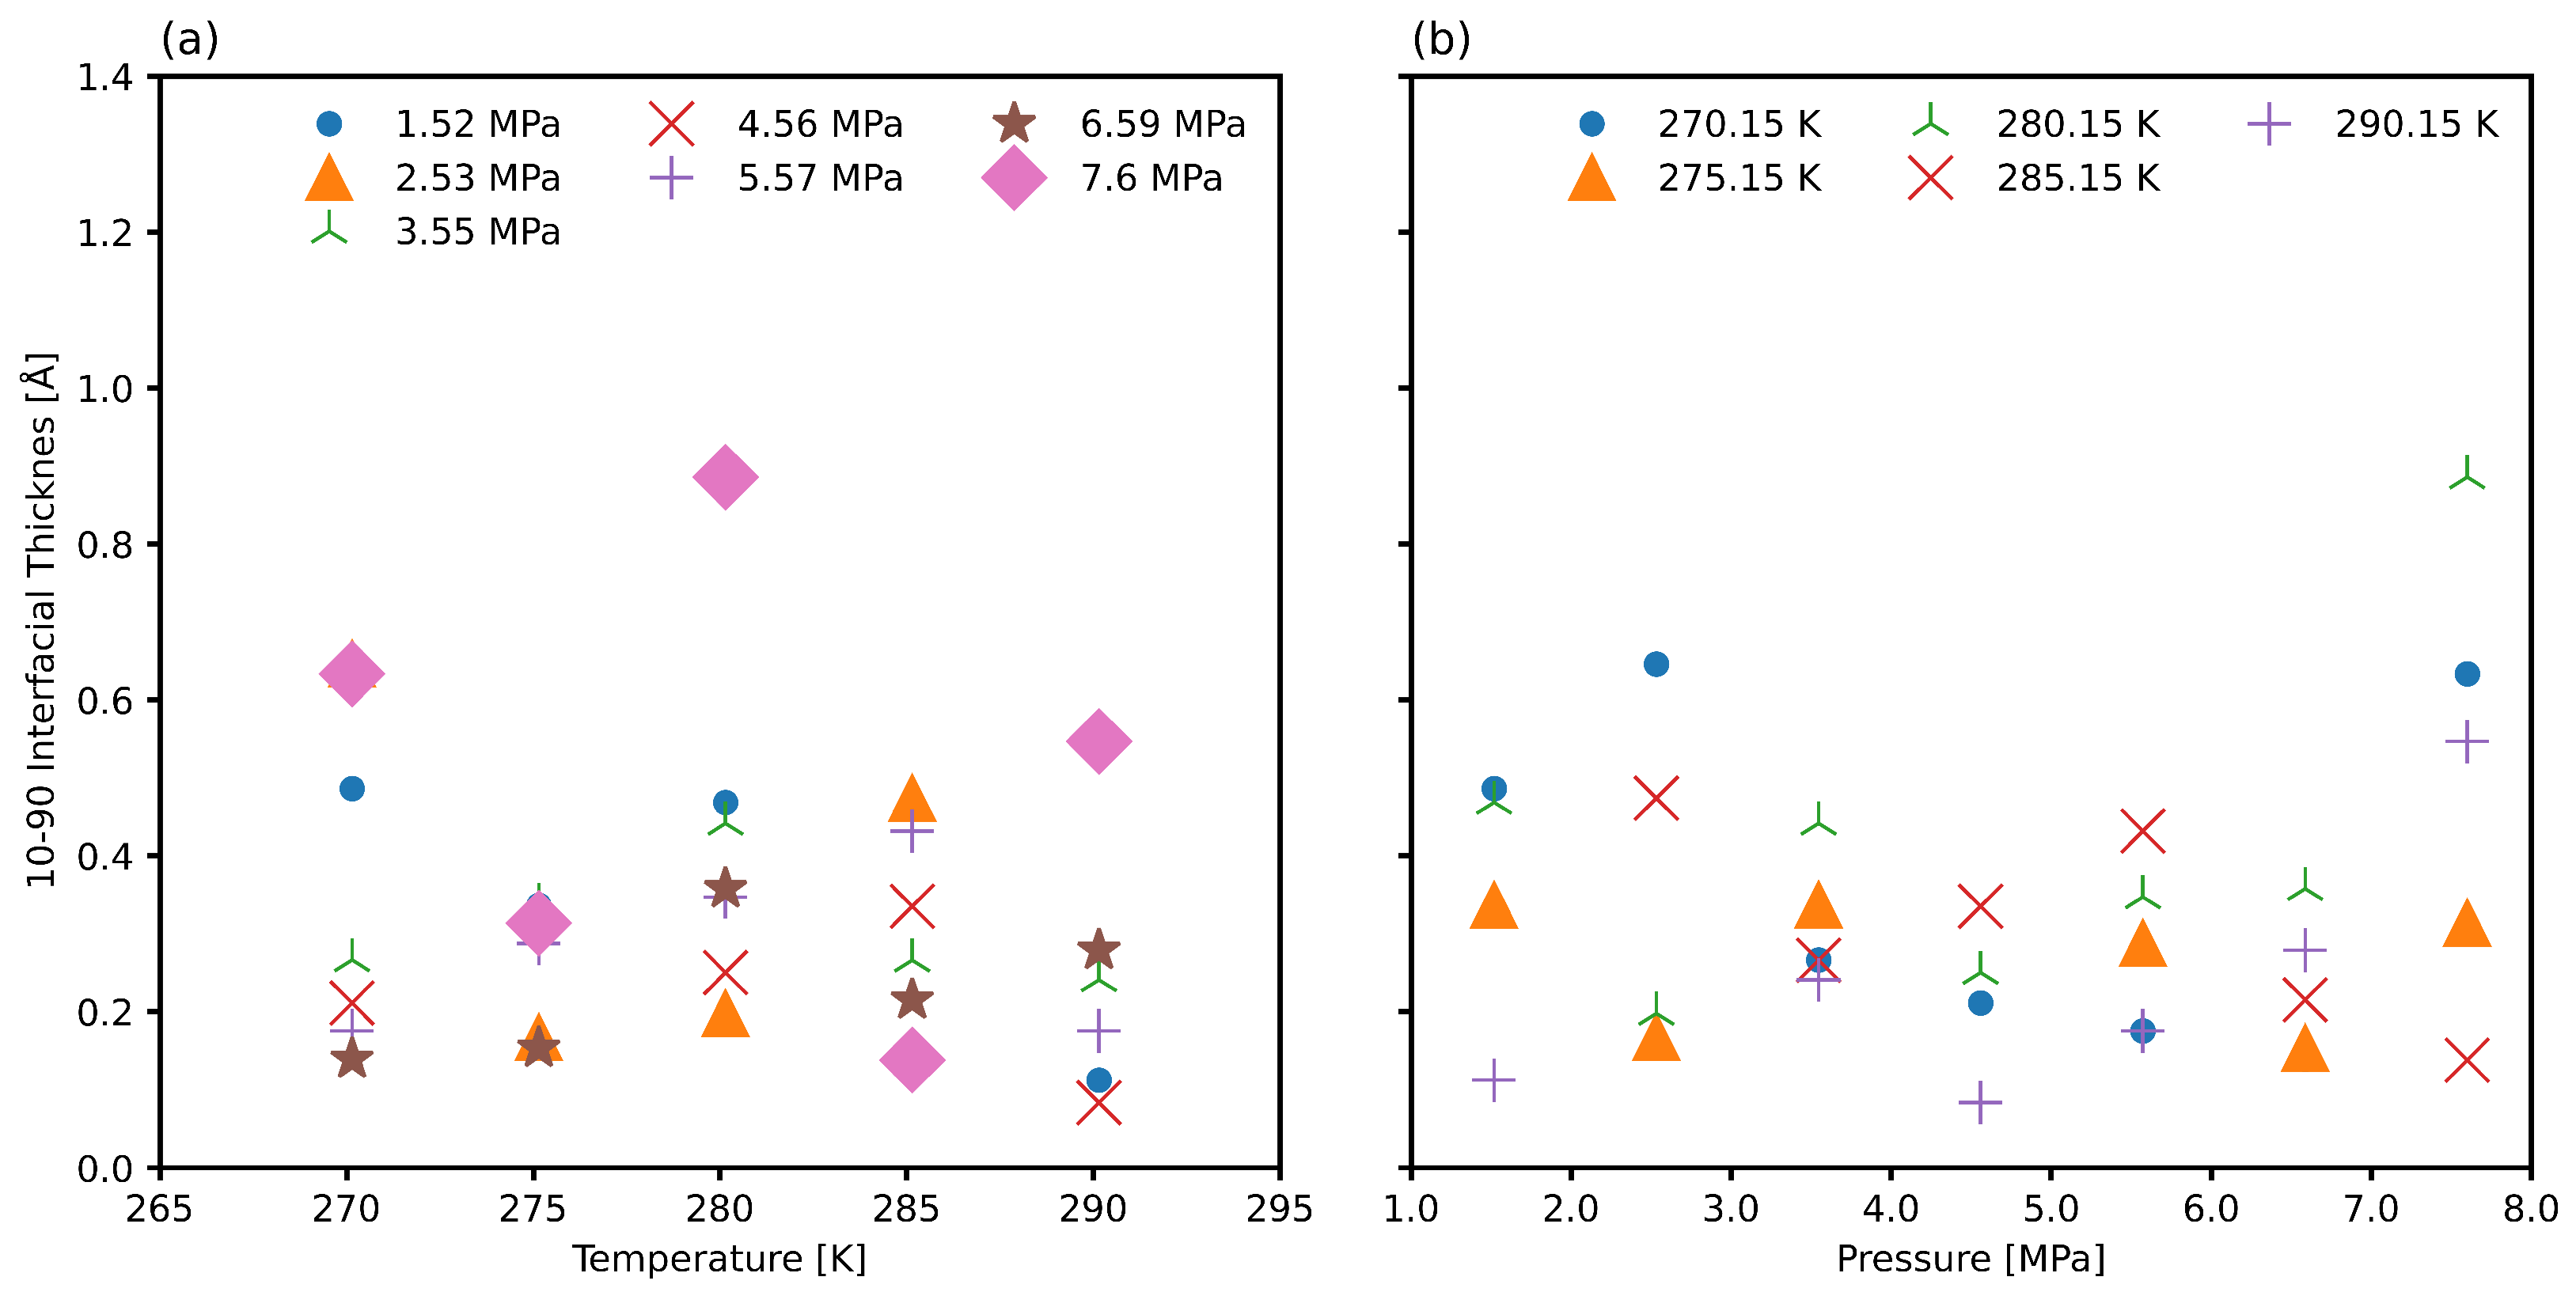
3.3. Interfacial Position and Thickness
3.4. Improved Measurements
4. Conclusions
Author Contributions
Funding
Data Availability Statement
Acknowledgments
Conflicts of Interest
References
- Carroll, J. Natural Gas Hydrates: A Guide for Engineers, 3rd ed.; Gulf Professional Publishing: Houston, TX, USA, 2014. [Google Scholar]
- Mathews, S.; Daghash, S.; Rey, A.; Servio, P. Recent Advances in Density Functional Theory and Molecular Dynamics Simulation of Mechanical, Interfacial, and Thermal Properties of Natural Gas Hydrates in Canada. Can. J. Chem. Eng. 2022, 100, 2557–2571. [Google Scholar] [CrossRef]
- Cannone, S.F.; Lanzini, A.; Santarelli, M. A Review on CO2 Capture Technologies with Focus on CO2-Enhanced Methane Recovery from Hydrates. Energies 2021, 14, 387. [Google Scholar] [CrossRef]
- Cheng, C.; Wang, F.; Tian, Y.; Wu, X.; Zheng, J.; Zhang, J.; Li, L.; Yang, P.; Zhao, J. Review and Prospects of Hydrate Cold Storage Technology. Renew. Sustain. Energy Rev. 2020, 117, 109492. [Google Scholar] [CrossRef]
- Das, S.; Tadepalli, K.M.; Roy, S.; Kumar, R. A Review of Clathrate Hydrate Nucleation, Growth and Decomposition Studied Using Molecular Dynamics Simulation. J. Mol. Liq. 2022, 348, 118025. [Google Scholar] [CrossRef]
- Gambelli, A.M.; Presciutti, A.; Rossi, F. Review on the Characteristics and Advantages Related to the Use of Flue-Gas as CO2/N2 Mixture for Gas Hydrate Production. Fluid Phase Equilibria 2021, 541, 113077. [Google Scholar] [CrossRef]
- Sayani, J.K.S.; Lal, B.; Pedapati, S.R. Comprehensive Review on Various Gas Hydrate Modelling Techniques: Prospects and Challenges. Arch. Comput. Methods Eng. 2022, 29, 2171–2207. [Google Scholar] [CrossRef]
- Koh, C.A.; Sloan, E.D.; Sum, A.K.; Wu, D.T. Fundamentals and Applications of Gas Hydrates. Annu. Rev. Chem. Biomol. Eng. 2011, 2, 237–257. [Google Scholar] [CrossRef]
- Sloan, E.D. Fundamental Principles and Applications of Natural Gas Hydrates. Nature 2003, 426, 353–359. [Google Scholar] [CrossRef]
- Vlasic, T.M.; Servio, P.D.; Rey, A.D. THF Hydrates as Model Systems for Natural Gas Hydrates: Comparing Their Mechanical and Vibrational Properties. Ind. Eng. Chem. Res. 2019, 58, 16588–16596. [Google Scholar] [CrossRef]
- Alavi, S.; Ohmura, R.; Ripmeester, J.A. A Molecular Dynamics Study of Ethanol–Water Hydrogen Bonding in Binary Structure I Clathrate Hydrate with CO2. J. Chem. Phys. 2011, 134, 054702. [Google Scholar] [CrossRef]
- Naeiji, P.; Woo, T.K.; Ohmura, R.; Alavi, S. Molecular Dynamics Simulations of Interfacial Structure, Dynamics, and Interfacial Tension of Tetrabutylammonium Bromide Aqueous Solution in the Presence of Methane and Carbon Dioxide. J. Chem. Phys. 2022, 157, 154702. [Google Scholar] [CrossRef] [PubMed]
- Jafari Daghalian Sofla, S.; Servio, P.; Rey, A.D. Atomistic–Geometric–Continuum Relations of Hydrogen Structure II Hydrates under Triaxial Strains. Energy Fuels 2024, 38, 17054–17063. [Google Scholar] [CrossRef]
- Daghash, S.M.; Servio, P.; Rey, A.D. Structural Properties of sH Hydrate: A DFT Study of Anisotropy and Equation of State. Mol. Simul. 2019, 45, 1524–1537. [Google Scholar] [CrossRef]
- Demirbas, A. Methane Gas Hydrate; Springer Science & Business Media: Berlin/Heidelberg, Germany, 2010. [Google Scholar]
- Sun, Z.; Wang, H.; Yao, J.; Sun, Z.; Bongole, K.; Zhu, X.; Liu, L.; Wang, J. Effect of Cage-Specific Occupancy on the Dissociation Rate of a Three-Phase Coexistence Methane Hydrate System: A Molecular Dynamics Simulation Study. J. Nat. Gas Sci. Eng. 2018, 55, 235–242. [Google Scholar] [CrossRef]
- Sloan, D.; Koh, C.; Sum, A.K.; Ballard, A.L.; Creek, J.; Eaton, M.; Lachance, J.; McMullen, N.; Palermo, T.; Shoup, G.; et al. Natural Gas Hydrates in Flow Assurance, 1st ed.; Gulf Professional Publishing: Houston, TX, USA, 2010. [Google Scholar]
- Ballard, A.L.; Sloan, E.D. Optimizing Thermodynamic Parameters to Match Methane and Ethane Structural Transition in Natural Gas Hydrate Equilibria. Ann. N. Y. Acad. Sci. 2000, 912, 702–712. [Google Scholar] [CrossRef]
- Li, M.; Xu, Z.; Zhang, Q.; Li, W.; Zhang, Y.; Han, Y. Polymorphic Crystalline Layer at the Crystallization Front. Phys. Rev. Lett. 2024, 133, 248202. [Google Scholar] [CrossRef]
- Christiansen, R.L.; Sloan, E.D.J. A Compact Model for Hydrate Formation; Gas Processors Association: Tulsa, OK, USA, 1995. [Google Scholar]
- Sloan, E.D.; Koh, C.A. Clathrate Hydrates of Natural Gases, 3rd ed.; Chemical Industries; 119; CRC Press: Boca Raton, FL, USA, 2008. [Google Scholar]
- Mirzaeifard, S.; Servio, P.; Rey, A.D. Multiscale Modeling and Simulation of Water and Methane Hydrate Crystal Interface. Cryst. Growth Des. 2019, 19, 5142–5151. [Google Scholar] [CrossRef]
- Mirzaeifard, S.; Servio, P.; Rey, A.D. Characterization of Nucleation of Methane Hydrate Crystals: Interfacial Theory and Molecular Simulation. J. Colloid Interface Sci. 2019, 557, 556–567. [Google Scholar] [CrossRef]
- Hu, S.; Koh, C.A. Interfacial Properties and Mechanisms Dominating Gas Hydrate Cohesion and Adhesion in Liquid and Vapor Hydrocarbon Phases. Langmuir 2017, 33, 11299–11309. [Google Scholar] [CrossRef]
- Bassani, C.L.; Engel, M.; Sum, A.K. Mesomorphology of Clathrate Hydrates from Molecular Ordering. J. Chem. Phys. 2024, 160, 190901. [Google Scholar] [CrossRef]
- Kashchiev, D. (Ed.) Nucleation: Basic Theory with Applications; Butterworth-Heinemann: Oxford, UK, 2000. [Google Scholar]
- Aman, Z.M.; Koh, C.A. Interfacial Phenomena in Gas Hydrate Systems. Chem. Soc. Rev. 2016, 45, 1678–1690. [Google Scholar] [CrossRef] [PubMed]
- Mulpuri, N.; Bratko, D. Polarity-Dependence of the Nonlinear Dielectric Response in Interfacial Water. J. Chem. Phys. 2023, 158, 134716. [Google Scholar] [CrossRef] [PubMed]
- Mirzaeifard, S.; Servio, P.; Rey, A.D. Molecular Dynamics Characterization of the Water-Methane, Ethane, and Propane Gas Mixture Interfaces. Chem. Eng. Sci. 2019, 208, 114769. [Google Scholar] [CrossRef]
- Rizzi, F.; Najm, H.N.; Debusschere, B.J.; Sargsyan, K.; Salloum, M.; Adalsteinsson, H.; Knio, O.M. Uncertainty Quantification in MD Simulations. Part I: Forward Propagation. Multiscale Model. Simul. 2012, 10, 1428–1459. [Google Scholar] [CrossRef]
- Zhu, X.; Rey, A.D.; Servio, P. Multiscale Piezoelasticity of Methane Gas Hydrates: From Bonds to Cages to Lattices. Energy Fuels 2022, 36, 10591–10600. [Google Scholar] [CrossRef]
- Tanaka, R.; Sakemoto, R.; Ohmura, R. Crystal Growth of Clathrate Hydrates Formed at the Interface of Liquid Water and Gaseous Methane, Ethane, or Propane: Variations in Crystal Morphology. Cryst. Growth Des. 2009, 9, 2529–2536. [Google Scholar] [CrossRef]
- Asserson, R.B.; Hoffmann, A.C.; Hø iland, S.; Asvik, K.M. Interfacial Tension Measurement of Freon Hydrates by Droplet Deposition and Contact Angle Measurements. J. Pet. Sci. Eng. 2009, 68, 209–217. [Google Scholar] [CrossRef]
- Sun, C.Y.; Peng, B.Z.; Dandekar, A.; Ma, Q.L.; Chen, G.J. Studies on Hydrate Film Growth. Annu. Rep. Sect. C 2010, 106, 77–100. [Google Scholar] [CrossRef]
- Blas, F.J.; MacDowell, L.G.; de Miguel, E.; Jackson, G. Vapor-Liquid Interfacial Properties of Fully Flexible Lennard-Jones Chains. J. Chem. Phys. 2008, 129, 144703. [Google Scholar] [CrossRef]
- Kuo, I.F.W.; Mundy, C.J.; Eggimann, B.L.; McGrath, M.J.; Siepmann, J.I.; Chen, B.; Vieceli, J.; Tobias, D.J. Structure and Dynamics of the Aqueous Liquid-Vapor Interface: A Comprehensive Particle-Based Simulation Study. J. Phys. Chem. B 2006, 110, 3738–3746. [Google Scholar] [CrossRef]
- Shi, R. The Structural Order of Protein Hydration Water. Commun. Theor. Phys. 2022, 74, 095602. [Google Scholar] [CrossRef]
- Mönch, W. Semiconductor Surfaces and Interfaces; Springer Series in Surface Sciences; Springer: Berlin/Heidelberg, Germany, 2001; Volume 26. [Google Scholar]
- Mönch, W. Electronic Properties of Semiconductor Interfaces; Springer Series in Surface Sciences; Springer: Berlin/Heidelberg, Germany, 2004; Volume 43. [Google Scholar]
- Cahn, J.W.; Hilliard, J.E. Free Energy of a Nonuniform System. I. Interfacial Free Energy. J. Chem. Phys. 1958, 28, 258–267. [Google Scholar] [CrossRef]
- Davis, S.H. (Ed.) 11—Phase-Field Models. In Theory of Solidification; Cambridge Monographs on Mechanics; Cambridge University Press: Cambridge, UK, 2001; pp. 366–378. [Google Scholar]
- Zeneli, M.; Nikolopoulos, A.; Karellas, S.; Nikolopoulos, N. 7—Numerical Methods for Solid-Liquid Phase-Change Problems. In Ultra-High Temperature Thermal Energy Storage, Transfer and Conversion; Datas, A., Ed.; Woodhead Publishing Series in Energy; Woodhead Publishing: Cambridge, UK, 2021; pp. 165–199. [Google Scholar]
- Nix, W.D. Interface Stresses. In Encyclopedia of Materials: Science and Technology; Buschow, K.H.J., Cahn, R.W., Flemings, M.C., Ilschner, B., Kramer, E.J., Mahajan, S., Veyssière, P., Eds.; Elsevier: Amsterdam, The Netherlands, 2001; pp. 4136–4141. [Google Scholar]
- Meyer, R.J.; Zhang, Q.; Kryczka, A.; Gomez, C.; Todorovic, R. Perturbation of Reactivity with Geometry: How Far Can We Go? ACS Catal. 2018, 8, 566–570. [Google Scholar] [CrossRef]
- Williamson, M.; Majumdar, A. Effect of Surface Deformations on Contact Conductance. J. Heat Transfer. 1992, 114, 802–810. [Google Scholar] [CrossRef]
- Griffith, A.A.; Taylor, G.I., VI. The Phenomena of Rupture and Flow in Solids. Philos. Trans. R. Soc. Lond. 1921, 221, 163–198. [Google Scholar] [CrossRef]
- Ciuperca, I.S. A Navier-Stokes Problem with Free Boundary. Appl. Math. Lett. 1996, 9, 39–43. [Google Scholar] [CrossRef]
- Mathews, S.L.; Servio, P.D.; Rey, A.D. Heat Capacity, Thermal Expansion Coefficient, and Grüneisen Parameter of CH4, CO2, and C2H6 Hydrates and Ice Ih via Density Functional Theory and Phonon Calculations. Cryst. Growth Des. 2020, 20, 5947–5955. [Google Scholar] [CrossRef]
- Mathews, S.; Guerra, A.; Servio, P.; Rey, A. Molecular Dynamics Characterization of the Interfacial Structure and Forces of the Methane-Ethane sII Gas Hydrate Interface. Colloid Interface Sci. Commun. 2024, 62, 100800. [Google Scholar] [CrossRef]
- Dash, J.G.; Rempel, A.W.; Wettlaufer, J.S. The Physics of Premelted Ice and Its Geophysical Consequences. Rev. Mod. Phys. 2006, 78, 695–741. [Google Scholar] [CrossRef]
- Qiu, Y.; Molinero, V. Why Is It So Difficult to Identify the Onset of Ice Premelting? J. Phys. Chem. Lett. 2018, 9, 5179–5182. [Google Scholar] [CrossRef]
- Varghese, B.; Sathian, S.P. Nanoscale Gas Accumulation at Solid–Liquid Interfaces: A Molecular Dynamics Study. Phys. Chem. Chem. Phys. 2022, 24, 22298–22308. [Google Scholar] [CrossRef]
- Luzar, A.; Bratko, D. Gas Solubility in Hydrophobic Confinement. J. Phys. Chem. B 2005, 109, 22545–22552. [Google Scholar] [CrossRef] [PubMed]
- Dammer, S.M.; Lohse, D. Gas Enrichment at Liquid-Wall Interfaces. Phys. Rev. Lett. 2006, 96, 206101. [Google Scholar] [CrossRef] [PubMed]
- Thompson, A.P.; Aktulga, H.M.; Berger, R.; Bolintineanu, D.S.; Brown, W.M.; Crozier, P.S.; in’t Veld, P.J.; Kohlmeyer, A.; Moore, S.G.; Nguyen, T.D.; et al. LAMMPS—A Flexible Simulation Tool for Particle-Based Materials Modeling at the Atomic, Meso, and Continuum Scales. Comput. Phys. Commun. 2022, 271, 108171. [Google Scholar] [CrossRef]
- Kirkwood, J.G.; Buff, F.P. The Statistical Mechanical Theory of Surface Tension. J. Chem. Phys. 1949, 17, 338–343. [Google Scholar] [CrossRef]
- Tolman, R.C. Consideration of the Gibbs Theory of Surface Tension. J. Chem. Phys. 1948, 16, 758–774. [Google Scholar] [CrossRef]
- Naeiji, P.; Woo, T.K.; Alavi, S.; Varaminian, F.; Ohmura, R. Interfacial Properties of Hydrocarbon/Water Systems Predicted by Molecular Dynamic Simulations. J. Chem. Phys. 2019, 150, 114703. [Google Scholar] [CrossRef]
- Ceriotti, M.; Fang, W.; Kusalik, P.G.; McKenzie, R.H.; Michaelides, A.; Morales, M.A.; Markland, T.E. Nuclear Quantum Effects in Water and Aqueous Systems: Experiment, Theory, and Current Challenges. Chem. Rev. 2016, 116, 7529–7550. [Google Scholar] [CrossRef]
- Kainai, D.; Bai, D. Effect of Cage Occupancy on Stability and Decomposition of Methane Hydrate. J. Phys. Chem. B 2022, 126, 492–502. [Google Scholar] [CrossRef]
- Bernal, J.D.; Fowler, R.H. A Theory of Water and Ionic Solution, with Particular Reference to Hydrogen and Hydroxyl Ions. J. Chem. Phys. 1933, 1, 515–548. [Google Scholar] [CrossRef]
- Takeuchi, F.; Hiratsuka, M.; Ohmura, R.; Alavi, S.; Sum, A.K.; Yasuoka, K. Water Proton Configurations in Structures I, II, and H Clathrate Hydrate Unit Cells. J. Chem. Phys. 2013, 138, 124504. [Google Scholar] [CrossRef] [PubMed]
- Martínez, J.M.; Martínez, L. Packing Optimization for Automated Generation of Complex System’s Initial Configurations for Molecular Dynamics and Docking. J. Comput. Chem. 2003, 24, 819–825. [Google Scholar] [CrossRef] [PubMed]
- Martínez, L.; Andrade, R.; Birgin, E.G.; Martínez, J.M. PACKMOL: A Package for Building Initial Configurations for Molecular Dynamics Simulations. J. Comput. Chem. 2009, 30, 2157–2164. [Google Scholar] [CrossRef]
- Jewett, A.I.; Stelter, D.; Lambert, J.; Saladi, S.M.; Roscioni, O.M.; Ricci, M.; Autin, L.; Maritan, M.; Bashusqeh, S.M.; Keyes, T.; et al. Moltemplate: A Tool for Coarse-Grained Modeling of Complex Biological Matter and Soft Condensed Matter Physics. J. Mol. Biol. 2021, 433, 166841. [Google Scholar] [CrossRef]
- Jorgensen, W.L.; Maxwell, D.S.; Tirado-Rives, J. Development and Testing of the OPLS All-Atom Force Field on Conformational Energetics and Properties of Organic Liquids. J. Am. Chem. Soc. 1996, 118, 11225–11236. [Google Scholar] [CrossRef]
- Jorgensen, W.L.; Madura, J.D.; Swenson, C.J. Optimized Intermolecular Potential Functions for Liquid Hydrocarbons. J. Am. Chem. Soc. 1984, 106, 6638–6646. [Google Scholar] [CrossRef]
- Horn, H.W.; Swope, W.C.; Pitera, J.W.; Madura, J.D.; Dick, T.J.; Hura, G.L.; Head-Gordon, T. Development of an Improved Four-Site Water Model for Biomolecular Simulations: TIP4P-Ew. J. Chem. Phys. 2004, 120, 9665–9678. [Google Scholar] [CrossRef]
- Mirzaeifard, S.; Servio, P.; Rey, A.D. Molecular Dynamics Characterization of Temperature and Pressure Effects on the Water-Methane Interface. Colloid Interface Sci. Commun. 2018, 24, 75–81. [Google Scholar] [CrossRef]
- Hockney, R.W.; Eastwood, J.W. Computer Simulation Using Particles; CRC Press: Boca Raton, FL, USA, 1988. [Google Scholar]
- Isele-Holder, R.E.; Mitchell, W.; Ismail, A.E. Development and Application of a Particle-Particle Particle-Mesh Ewald Method for Dispersion Interactions. J. Chem. Phys. 2012, 137, 174107. [Google Scholar] [CrossRef]
- Michaud-Agrawal, N.; Denning, E.J.; Woolf, T.B.; Beckstein, O. MDAnalysis: A Toolkit for the Analysis of Molecular Dynamics Simulations. J. Comput. Chem. 2011, 32, 2319–2327. [Google Scholar] [CrossRef]
- Gowers, R.J.; Linke, M.; Barnoud, J.; Reddy, T.J.E.; Melo, M.N.; Seyler, S.L.; Domański, J.; Dotson, D.L.; Buchoux, S.; Kenney, I.M.; et al. MDAnalysis: A Python Package for the Rapid Analysis of Molecular Dynamics Simulations. In Proceedings of the 15th Python in Science Conference, Austin, TX, USA, 11–17 July 2016; Benthall, S., Rostrup, S., Eds.; pp. 98–105. [Google Scholar] [CrossRef]
- Theobald, D.L. Rapid Calculation of RMSDs Using a Quaternion-Based Characteristic Polynomial. Found. Crystallogr. 2005, 61, 478–480. [Google Scholar] [CrossRef] [PubMed]
- Ghadar, Y.; Clark, A. Intermolecular Network Analysis of the Liquid and Vapor Interfaces of Pentane and Water: Microsolvation Does Not Trend with Interfacial Properties. Phys. Chem. Chem. Phys. 2014, 16, 12475–12487. [Google Scholar] [CrossRef]
- Biscay, F.; Ghoufi, A.; Lachet, V.; Malfreyt, P. Monte Carlo Calculation of the Methane-Water Interfacial Tension at High Pressures. J. Chem. Phys. 2009, 131, 124707. [Google Scholar] [CrossRef] [PubMed]
- Grossfield, A.; Patrone, P.N.; Roe, D.R.; Schultz, A.J.; Siderius, D.; Zuckerman, D.M. Best Practices for Quantification of Uncertainty and Sampling Quality in Molecular Simulations [Article v1.0]. Living J. Comput. Mol. Sci. 2018, 1, 5067. [Google Scholar] [CrossRef] [PubMed]
- Guerra, A.; Mathews, S.; Marić, M.; Servio, P.; Rey, A.D. All-Atom Molecular Dynamics of Pure Water–Methane Gas Hydrate Systems under Pre-Nucleation Conditions: A Direct Comparison between Experiments and Simulations of Transport Properties for the Tip4p/Ice Water Model. Molecules 2022, 27, 5019. [Google Scholar] [CrossRef]
- Guerra, A.; Mathews, S.; Su, J.T.; Marić, M.; Servio, P.; Rey, A.D. Molecular Dynamics Predictions of Transport Properties for Carbon Dioxide Hydrates under Pre-Nucleation Conditions Using TIP4P/Ice Water and EPM2, TraPPE, and Zhang Carbon Dioxide Potentials. J. Mol. Liq. 2023, 379, 121674. [Google Scholar] [CrossRef]
- Matus Rivas, O.M.; Rey, A.D. Molecular Dynamics on the Self-Assembly of Mesogenic Graphene Precursors. Carbon 2016, 110, 189–199. [Google Scholar] [CrossRef]
- Horstmann, R.; Hecht, L.; Kloth, S.; Vogel, M. Structural and Dynamical Properties of Liquids in Confinements: A Review of Molecular Dynamics Simulation Studies. Langmuir 2022, 38, 6506–6522. [Google Scholar] [CrossRef]
- Chen, W.; Sanders, S.E.; Özdamar, B.; Louaas, D.; Brigiano, F.S.; Pezzotti, S.; Petersen, P.B.; Gaigeot, M.P. On the Trail of Molecular Hydrophilicity and Hydrophobicity at Aqueous Interfaces. J. Phys. Chem. Lett. 2023, 14, 1301–1309. [Google Scholar] [CrossRef]
- Hovick, J.W.; Poler, J.C. Misconceptions in Sign Conventions: Flipping the Electric Dipole Moment. J. Chem. Educ. 2005, 82, 889. [Google Scholar] [CrossRef]
- Daigle, H. Structure of the Electrical Double Layer at the Ice–Water Interface. J. Chem. Phys. 2021, 154, 214703. [Google Scholar] [CrossRef] [PubMed]
- Zhao, Y.; Chen, J.; Huang, D.; Su, J. The Role of Interface Ions in the Control of Water Transport through a Carbon Nanotube. Langmuir 2019, 35, 13442–13451. [Google Scholar] [CrossRef] [PubMed]
- Fernandes, P.A.; Cordeiro, M.N.D.S.; Gomes, J.A.N.F. Molecular Dynamics Simulation of the Water/2-Heptanone Liquid-Liquid Interface. J. Phys. Chem. B 1999, 103, 6290–6299. [Google Scholar] [CrossRef]
- Jiménez-Ángeles, F.; Firoozabadi, A. Induced Charge Density and Thin Liquid Film at Hydrate/Methane Gas Interfaces. J. Phys. Chem. C 2014, 118, 26041–26048. [Google Scholar] [CrossRef]
- Alejandre, J.; Tildesley, D.J.; Chapela, G.A. Molecular Dynamics Simulation of the Orthobaric Densities and Surface Tension of Water. J. Chem. Phys. 1995, 102, 4574–4583. [Google Scholar] [CrossRef]
- Reed, S.K.; Westacott, R.E. The Interface between Water and a Hydrophobic Gas. Phys. Chem. Chem. Phys. 2008, 10, 4614–4622. [Google Scholar] [CrossRef]
- Rowlinson, J.S.; Widom, B. 1—Mechanical Molecular Models. In Molecular Theory of Capillarity; Dover Publications: Mineola, NY, USA, 1982. [Google Scholar]
- Cai, W.; Huang, X.; Lu, H. Instrumental Methods for Cage Occupancy Estimation of Gas Hydrate. Energies 2022, 15, 485. [Google Scholar] [CrossRef]
- Biscay, F.; Ghoufi, A.; Malfreyt, P. Adsorption of N-Alkane Vapours at the Water Surface. Phys. Chem. Chem. Phys. 2011, 13, 11308–11316. [Google Scholar] [CrossRef]
- McGrath, M.J.; Siepmann, J.I.; Kuo, I.F.W.; Mundy, C.J. Spatial Correlation of Dipole Fluctuations in Liquid Water. Mol. Phys. 2007, 105, 1411–1417. [Google Scholar] [CrossRef]
- Vlasic, T.M.; Servio, P.; Rey, A.D. Atomistic Modeling of Structure II Gas Hydrate Mechanics: Compressibility and Equations of State. AIP Adv. 2016, 6, 085317. [Google Scholar] [CrossRef]
- Maréchal, Y. 8—The H2O Molecule in Water Vapour and Ice. In The Hydrogen Bond and the Water Molecule; Maréchal, Y., Ed.; Elsevier: Amsterdam, The Netherlands, 2007; pp. 195–213. [Google Scholar]
- Mukherjee, S.; Bagchi, B. Entropic Origin of the Attenuated Width of the Ice–Water Interface. J. Phys. Chem. C 2020, 124, 7334–7340. [Google Scholar] [CrossRef]
- Benet, J.; MacDowell, L.G.; Sanz, E. A Study of the Ice–Water Interface Using the TIP4P/2005 Water Model. Phys. Chem. Chem. Phys. 2014, 16, 22159–22166. [Google Scholar] [CrossRef]


| Molecule | Quantity [Units] | Value |
|---|---|---|
| CH4/C2H6 | C mass [g·mol−1] | 12.011 |
| H mass [g·mol−1] | 1.008 | |
| CC [kcal·mol−1] | 0.066 | |
| CH [kcal·mol−1] | 0.03 | |
| CC [Å] | 3.5 | |
| CH [Å] | 2.5 | |
| H2O | O mass [g·mol−1] | 15.999 |
| H mass [g·mol−1] | 1.008 | |
| O charge [e] | −1.04844 | |
| H charge [e] | 0.52422 | |
| OO [kcal·mol−1] | 0.16275 | |
| OH, HH [kcal·mol−1] | 0.0 | |
| OO [Å] | 3.16435 | |
| OH, HH [Å] | 1.0 | |
| OH r0 [Å] | 0.9572 | |
| HOH θ0 [°] | 104.52 |
Disclaimer/Publisher’s Note: The statements, opinions and data contained in all publications are solely those of the individual author(s) and contributor(s) and not of MDPI and/or the editor(s). MDPI and/or the editor(s) disclaim responsibility for any injury to people or property resulting from any ideas, methods, instructions or products referred to in the content. |
© 2025 by the authors. Licensee MDPI, Basel, Switzerland. This article is an open access article distributed under the terms and conditions of the Creative Commons Attribution (CC BY) license (https://creativecommons.org/licenses/by/4.0/).
Share and Cite
Mathews, S.; Servio, P.; Rey, A. Multiscale Interfacial Structure and Organization of sII Gas Hydrate Interfaces Using Molecular Dynamics. Nanomaterials 2025, 15, 464. https://doi.org/10.3390/nano15060464
Mathews S, Servio P, Rey A. Multiscale Interfacial Structure and Organization of sII Gas Hydrate Interfaces Using Molecular Dynamics. Nanomaterials. 2025; 15(6):464. https://doi.org/10.3390/nano15060464
Chicago/Turabian StyleMathews, Samuel, Phillip Servio, and Alejandro Rey. 2025. "Multiscale Interfacial Structure and Organization of sII Gas Hydrate Interfaces Using Molecular Dynamics" Nanomaterials 15, no. 6: 464. https://doi.org/10.3390/nano15060464
APA StyleMathews, S., Servio, P., & Rey, A. (2025). Multiscale Interfacial Structure and Organization of sII Gas Hydrate Interfaces Using Molecular Dynamics. Nanomaterials, 15(6), 464. https://doi.org/10.3390/nano15060464