Improving the Detection Accuracy of Subsurface Damage in Optical Materials by Exploiting the Fluorescence Polarization Properties of Quantum Dots


Abstract
1. Introduction
2. Principles
3. Experiments
3.1. QD-Tagged SSD in Optical Materials
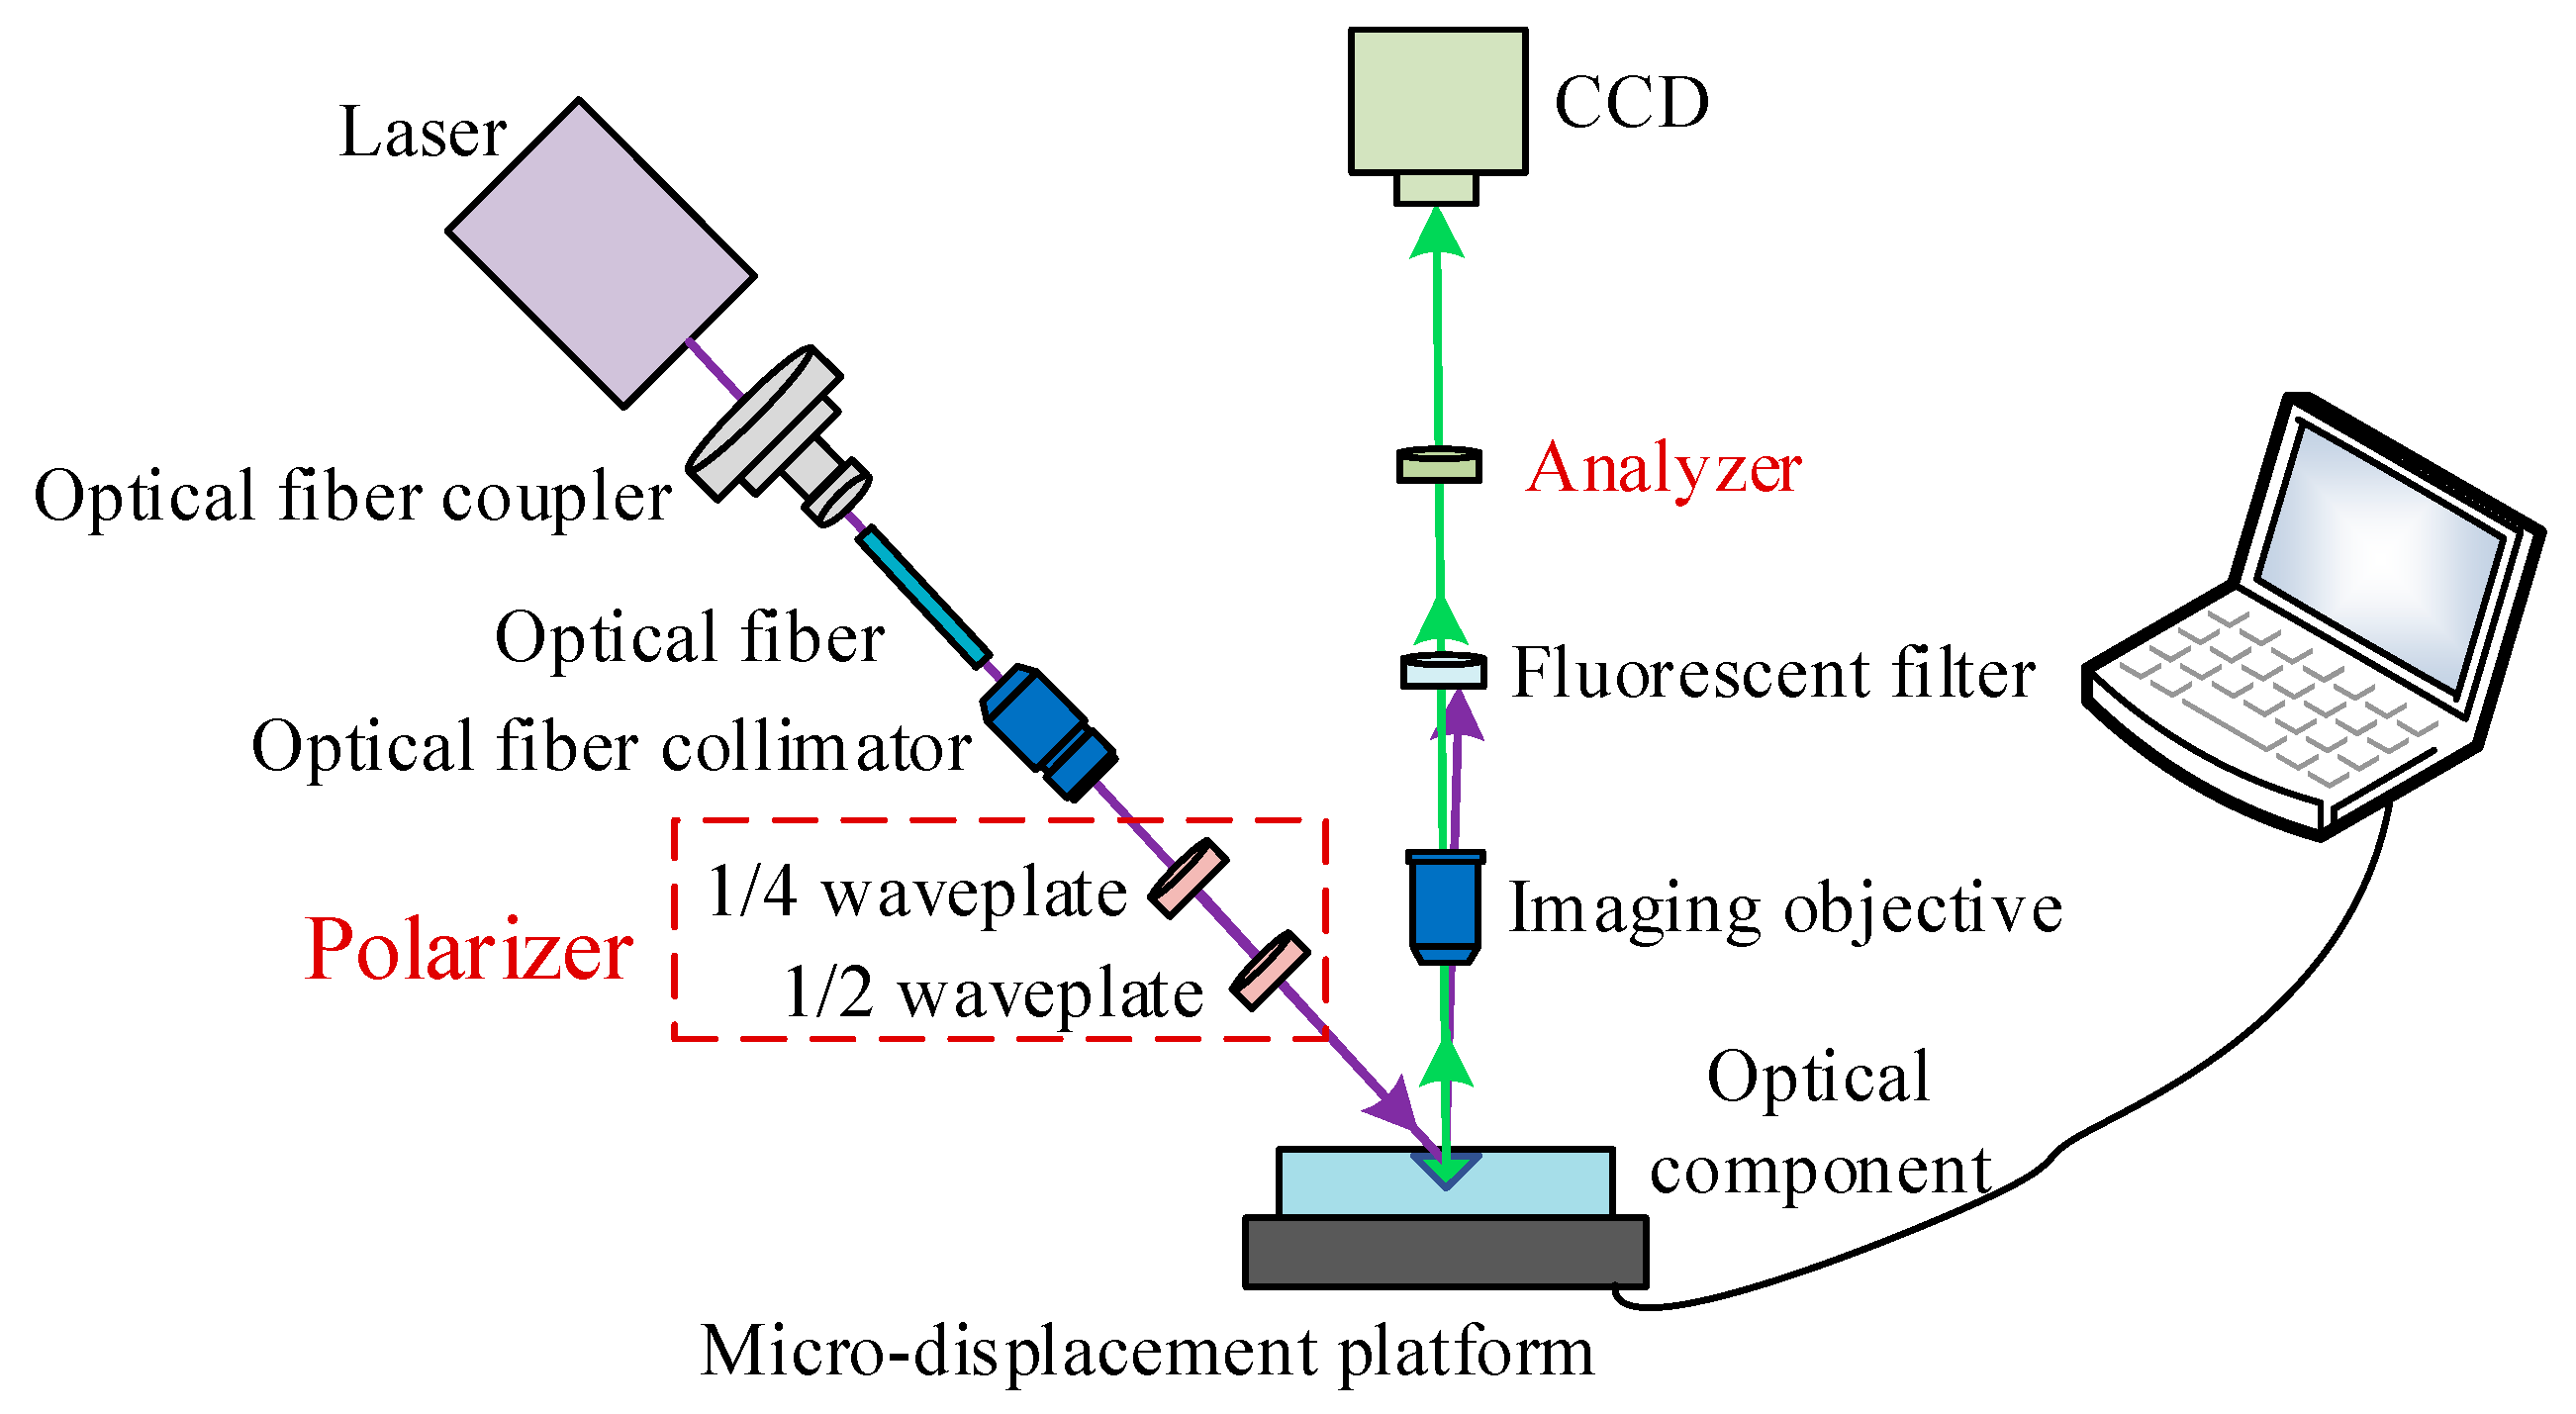
3.2. Fluorescence Polarization Detection System for the SSD of Optical Materials
4. Results and Discussion
4.1. Characterization of Fluorescence Polarization Properties of the QDs in SSD
4.1.1. Characterization of Excitation Polarization Properties
- (1)
- Remove the 1/4 waveplate, 1/2 waveplate, and analyzer in the system shown in Figure 4, keep other devices unchanged, and collect the initial fluorescence image J0 of the SSD without considering the fluorescence polarization characteristics, and extract its initial fluorescence intensity I0 as the initial reference value. At this time, the elliptically polarized light generated by the laser is directly applied to the fused silica optical materials without an analyzer.
- (2)
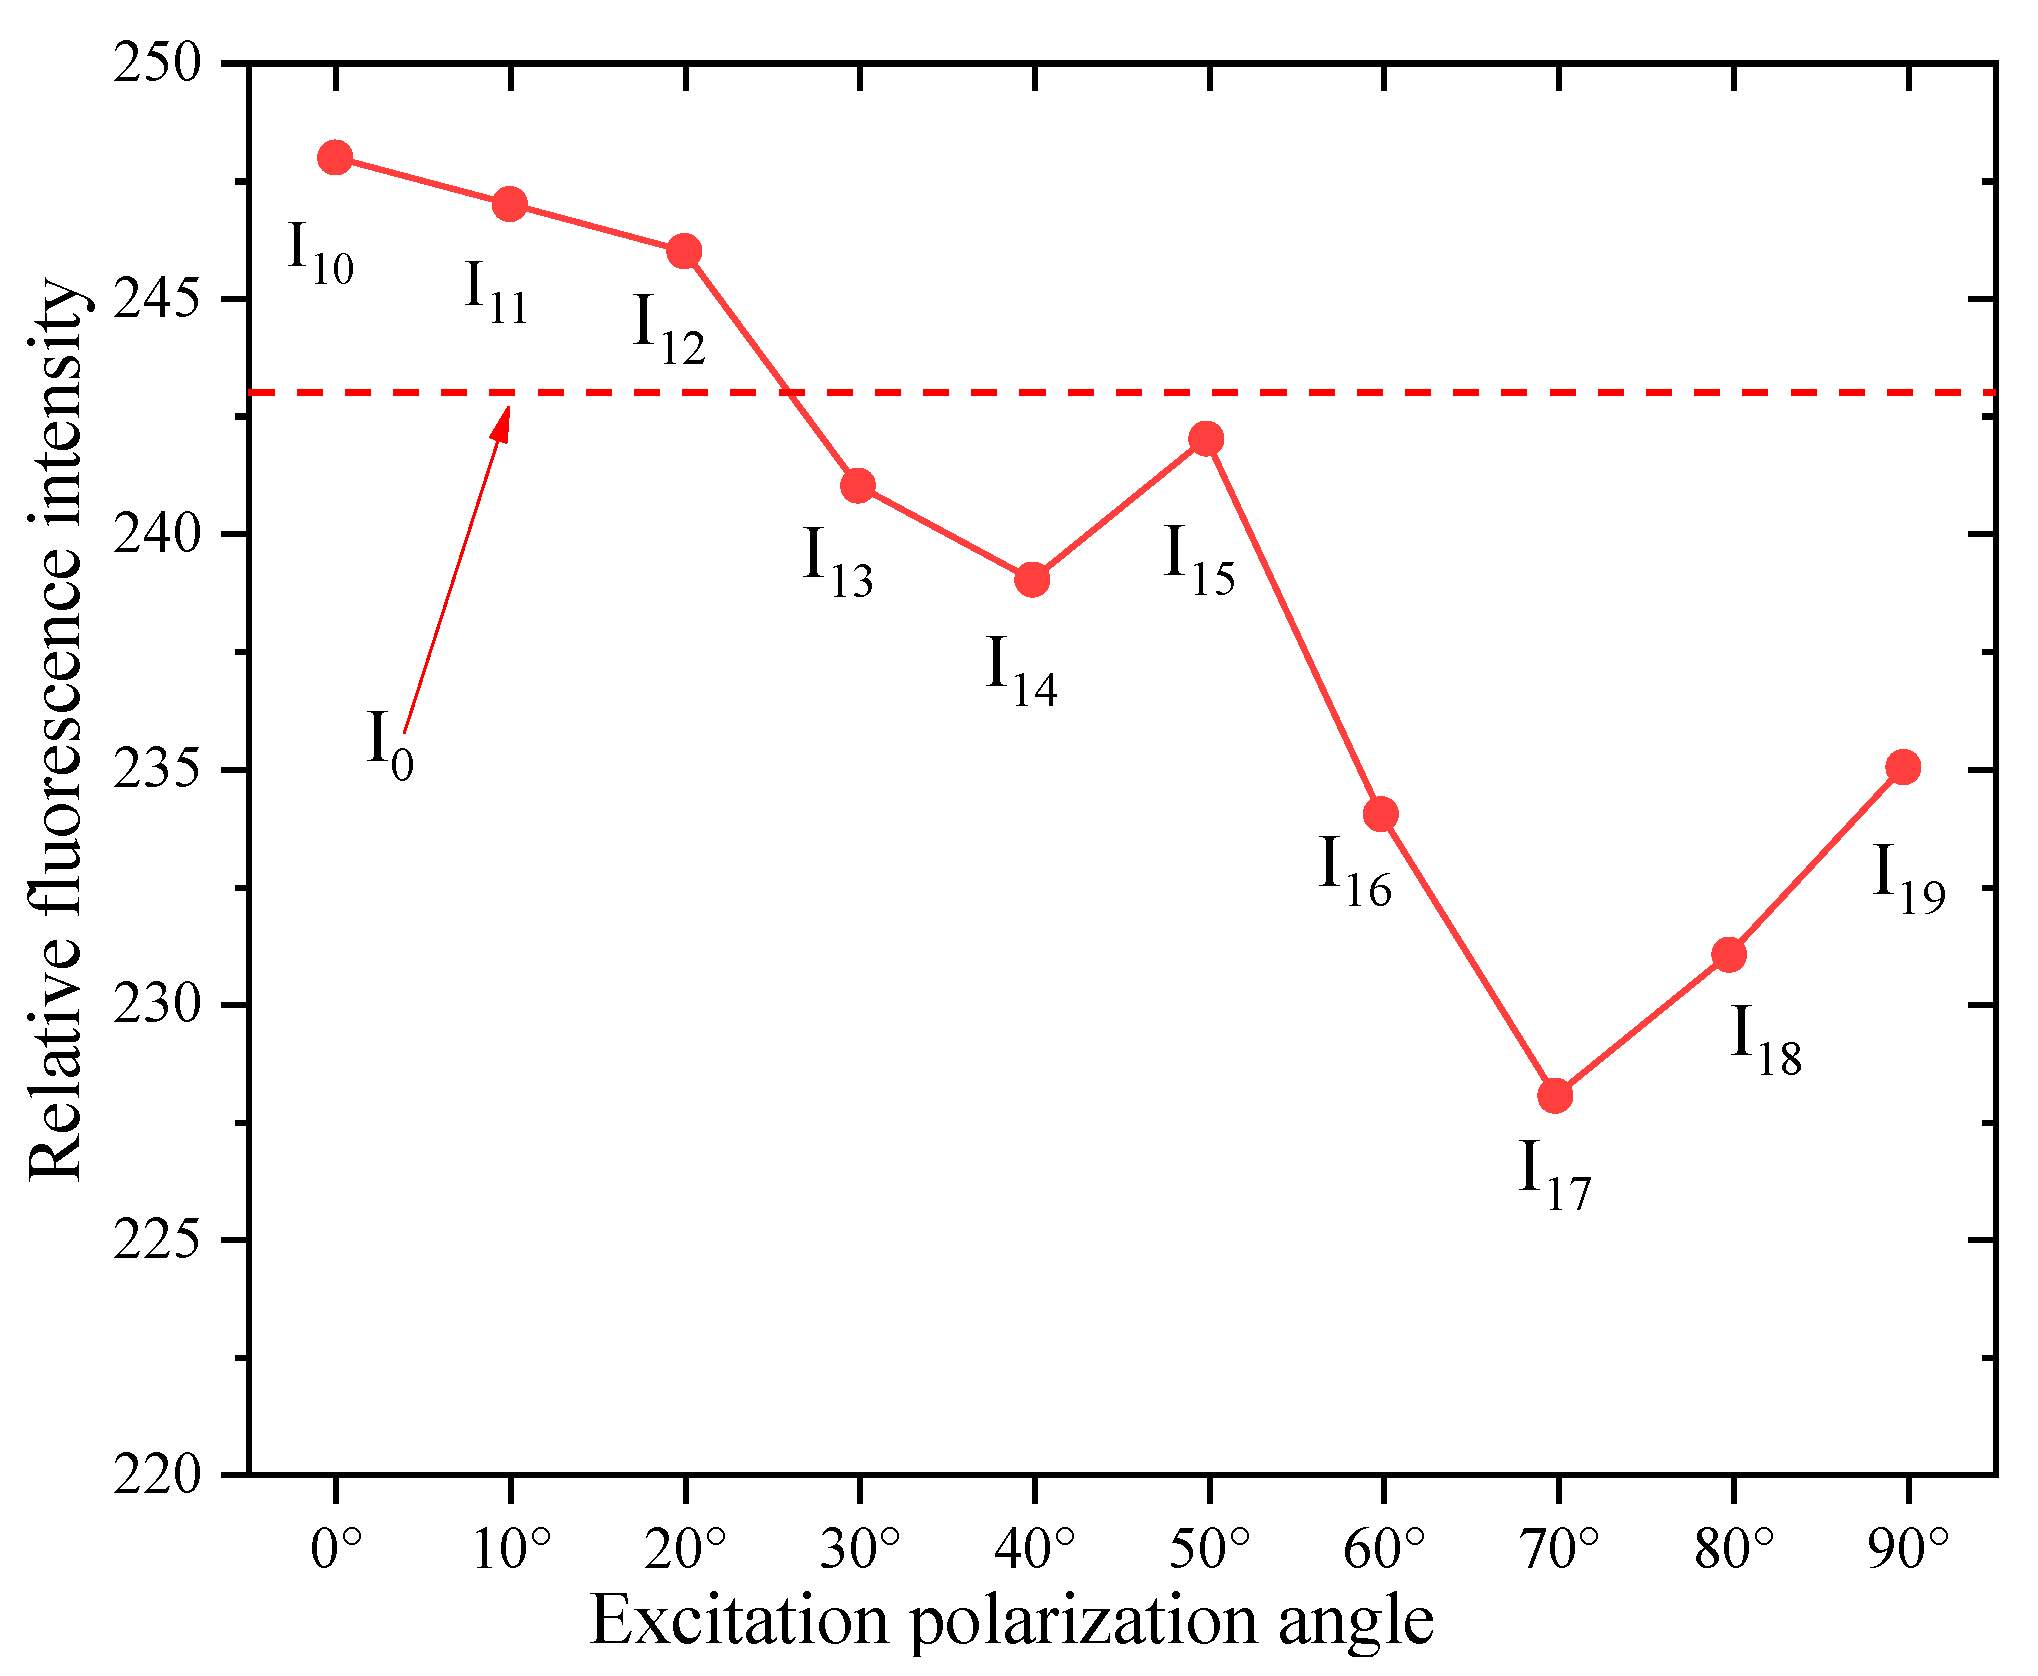
- Remove only the analyzer in the system shown in Figure 4, leaving the other devices unchanged, and adjust the excitation light (elliptically polarized light) to linearly polarized light using a 1/4 waveplate, and then adjust the 1/2 waveplate to obtain different polarization angles. The polarization angle of the linearly polarized light was adjusted from 0° to 90°, and the fluorescence polarization image of the SSD was acquired every 10°. The fluorescence polarization images acquired at excitation polarization angles of 0°, 10°, 20°, …, 90° were noted as J10, J11, J12, …, J19, and the corresponding fluorescence intensities I10, I11, I12, …, I19 were extracted, respectively.
4.1.2. Characterization of Radiation Polarization Properties
4.2. The Detection of SSD in the Optical Materials Based on the Fluorescence Polarization Properties of QDs
5. Conclusions
Author Contributions
Funding
Data Availability Statement
Conflicts of Interest
References
- Zhang, J.P.; Cao, Z.C.; Yang, Z.; Bin, L. Investigation on surface evolution and subsurface damage in abrasive lapping of hard and brittle materials using a novel fixed lapping tool. J. Manuf. Process. 2022, 75, 729–738. [Google Scholar] [CrossRef]
- Zhong, Y.Y.; Dai, Y.F.; Xiao, H.; Shi, F. Experimental study on surface integrity and subsurface damage of fused silica in ultra-precision grinding. Int. J. Adv. Manuf. Technol. 2021, 115, 4021–4033. [Google Scholar] [CrossRef]
- Neauport, J.; Ambard, C.; Cormont, P.; Darbois, N.; Rondeau, O. Subsurface damage measurement of ground fused silica parts by HF etching techniques. Opt. Express 2009, 17, 20448–20456. [Google Scholar] [CrossRef] [PubMed]
- Zhang, B.; Howes, T.D. Material-Removal Mechanisms in Grinding Ceramics. CIRP Ann. Manuf. Technol. 1994, 43, 305–308. [Google Scholar] [CrossRef]
- Li, S.; Wang, Z.; Wu, Y. Relationship between subsurface damage and surface roughness of optical materials in grinding and lapping processes. J. Mater. Process. Technol. 2008, 205, 34–41. [Google Scholar] [CrossRef]
- Zhou, H.; Jiang, W.; Ji, J.; Ren, X.P.; Zhu, Z.Y.; Zhang, C.W. Prediction and experimental investigation of depth of subsurface damage in semi-consolidated abrasive grinding of cleavable gallium oxide crystals. Int. J. Adv. Manuf. Technol. 2022, 119, 855–864. [Google Scholar] [CrossRef]
- Wang, J.A.; Li, Y.G.; Han, J.H.; Xu, Q.A.; Guo, Y.B. Evaluating subsurface damage in optical glasses. J. Eur. Opt. Soc. Rapid Publ. 2011, 6, 11001. [Google Scholar] [CrossRef]
- Temple, P.A. Total Internal Reflection Microscopy: A Surface Inspection Technique. Appl. Opt. 1981, 20, 2656–2664. [Google Scholar] [CrossRef]
- Bertussi, B.; Cormont, P.; Palmier, S.; Legros, P.; Rullier, J.L. Initiation of laser-induced damage sites in fused silica optical components. Opt. Express 2009, 17, 11469–11479. [Google Scholar] [CrossRef]
- Duncan, M.; Bashkansky, M.; Reintjes, J. Subsurface defect detection in materials using optical coherence tomography. Opt. Express 1998, 2, 540–545. [Google Scholar] [CrossRef]
- Bismayer, U.; Brinksmeier, E.; Güttler, B.; Seibt, H.; Menz, C. Measurement of subsurface damage in silicon wafers. Precis. Eng. J. Int. Soc. Precis. Eng. 1994, 16, 139–144. [Google Scholar] [CrossRef]
- Rossetti, R.; Nakahara, S.; Brus, L.E. Quantum size effects in the redox potentials, resonance Raman spectra, and electronic spectra of CdS crystallites in aqueous solution. J. Chem. Phys. 1983, 79, 1086–1088. [Google Scholar] [CrossRef]
- Klar, T.A.; Jakobs, S.; Dyba, M.; Egner, A.; Hell, S.W. Fluorescence microscopy with diffraction resolution barrier broken by stimulated emission. Proc. Natl. Acad. Sci. USA 2000, 97, 8206–8210. [Google Scholar] [CrossRef]
- Stephan, T.; Roesch, A.; Riedel, D.; Jakobs, S. Live-cell STED microscopy of mitochondrial cristae. Sci. Rep. 2019, 9, 12419. [Google Scholar] [CrossRef]
- Williams, W.B.; Mullany, B.A.; Parker, W.C.; Moyer, P.J.; Randles, M.H. Using quantum dots to tag subsurface damage in lapped and polished glass samples. Appl. Opt. 2009, 48, 5155–5163. [Google Scholar] [CrossRef] [PubMed]
- Williams, W.; Mullany, B.; Parker, W.; Moyer, P.; Randles, M. Using quantum dots to evaluate subsurface damage depths and formation mechanisms in glass. CIRP Ann. Manuf. Technol. 2010, 59, 569–572. [Google Scholar] [CrossRef]
- Williams, W.B. A Novel Fluorescence Based Method of Assessing Subsurface Damage in Optical Materials; The University of North Carolina: Charlotte, NC, USA, 2009. [Google Scholar]
- Williams, W.B.; Mullany, B.A.; Moyer, P.J.; Parker, W.C.; Randles, M.H. Characterizing quantum dots for use in detecting subsurface damage. In Proceedings of the 23rd Annual Meeting of the American Society for Precision Engineering 2008, Portland, OR, USA, 19–24 October 2008; pp. 440–443. [Google Scholar]
- Williams, W.B.; Mullany, B.A.; Moyer, P.J.; Parker, W.C.; Randles, M.H. Testing quantum dots as a means of assessing subsurface damage in polished glass. In Proceedings of the 24th Annual Meeting of the American Society for Precision Engineering 2009, Monterey, CA, USA, 4–9 October 2009. [Google Scholar]
- Williams, W.; Mullany, B.; Parker, W.; Moyer, P. Evaluating Subsurface Damage with Quantum Dots. In Proceedings of the International Optical Design Conference and Optical Fabrication and Testing, Jackson Hole, WY, USA, 13–17 June 2010. [Google Scholar]
- Wang, H.-X.; Hou, J.; Wang, J.-H.; Zhu, B.-W.; Zhang, Y.-H. Experimental investigation of subsurface damage depth of lapped optics by fluorescent method. J. Cent. South Univ. 2018, 25, 1678–1689. [Google Scholar] [CrossRef]
- Cui, Y.; Wang, C.; Liu, X.; Gao, R.; Li, T. Subsurface damage detection of optical elements by analyzing the photobleaching properties of quantum dots. Precis. Eng. 2022, 77, 24–32. [Google Scholar] [CrossRef]
- Xiao, B.; Liu, X.; Cui, Y.; Wang, C.; Li, T. Three-dimensional reconstruction of subsurface defects in fused silica optical components using cadmium selenide/zinc sulphide quantum dots. J. Opt. 2022, 52, 648–657. [Google Scholar] [CrossRef]
- Chavez-Pirson, A.; Chu, S.T. Polarization effects in near-field excitation—Collection probe optical microscopy of a single quantum dot. J. Microsc. 1999, 194, 421–425. [Google Scholar] [CrossRef]
- Rathi, K.; Gupta, S.K.; Kumar, J.; Negi, C.M.S. Polarization-dependent intervalence band absorption in quantum dots. Phys. B-Condens. Matter 2023, 658, 414846. [Google Scholar] [CrossRef]
- Yang, F. Super-Resolution Microscopic Imaging via Polarization Modulation. Master’s Thesis, Nanjing University of Aeronautics and Astronautics, Nanjing, China, 2019. [Google Scholar]
- Xu, J.; Wang, Z. Fluorescence Analysis, 3rd ed.; China Science Publishing & Media Ltd.: Beijing, China, 2006. [Google Scholar]
- Yao, L.; Segala, J.; Bucci, A.; Andreev, G.; Reshetnyak, Y.; Andreev, O. Fluorescence anisotropy imaging microscopy. In Microscopy: Science, Technology, Applications And Education; Mendez-Vilas, A., Diaz, J., Eds.; Formatex Research Center: Norristown, PA, USA, 2010. [Google Scholar]
- Fournier, J.; Neauport, J.; Grua, P.; Fargin, E.; Jubera, V.; Talaga, D.; Jouannigot, S. Green luminescence in silica glass: A possible indicator of subsurface fracture. Appl. Phys. Lett. 2012, 100, 114103. [Google Scholar] [CrossRef]


| Steps | Processing Steps and Parameters |
|---|---|
| 1 | D30 water-based diamond abrasive; lapping time = 5 min; lapping speed = 54 rad/min |
| 2 | D6 water-based diamond abrasive; lapping time = 3 min; lapping speed = 54 rad/min |
| 3 | Ultrasonically cleaned using an ethanol solution; cleaning time = 5 min. (Adequately removing impurities and residual quantum dots from the surface of optical materials) |
| Number | Instruments | Key Parameters |
|---|---|---|
| 1 | Fiber-coupled laser | Wavelength: 405 nm; Output power: 50 mw. |
| 2 | 1/4 waveplate | Wavelength: 405 nm; Delay accuracy: λ/300. |
| 3 | 1/2 waveplate | Wavelength: 405 nm; Delay accuracy: λ/300. |
| 4 | Imaging objective | Magnification: 10×; Numerical aperture: 0.28; Working distance: 33.4 mm; Focal length: 200 mm. |
| 5 | Fluorescence filter | Center wavelength: 544 nm; Transmissivity: >96%; Cut off depth: OD6. |
| 6 | Analyzer | Wavelength range: 475–625 nm; Transmissivity: >55–81%; Extinction ratio: >1000:1. |
| 7 | CCD | Sensor model: IMX178; Spectral response: 400~1100 nm. |
| Parameters | Positions | ||||||
|---|---|---|---|---|---|---|---|
| P1 | P2 | P3 | P4 | P5 | P6 | ||
| Fluorescence intensity | IHV | 67 | 136 | 74 | 119 | 84 | 87 |
| IHH | 66 | 132 | 73 | 125 | 83 | 87 | |
| IVH | 62 | 146 | 74 | 119 | 66 | 82 | |
| IVV | 64 | 151 | 84 | 121 | 73 | 88 | |
| Correction factor | GH | 1.015 | 1.030 | 1.014 | 0.952 | 1.012 | 1 |
| GV | 0.969 | 0.967 | 0.881 | 0.983 | 0.904 | 0.932 | |
| G | 1.015 | 1.030 | 1.014 | 0.952 | 1.012 | 1 | |
| Anisotropy | RH | −0.010 | −0.020 | −0.009 | 0.033 | −0.008 | 0 |
| RV | 0.021 | 0.023 | 0.088 | 0.011 | 0.069 | 0.048 | |
| R | 0.006 | 0.001 | 0.038 | 0.022 | 0.030 | 0.024 | |
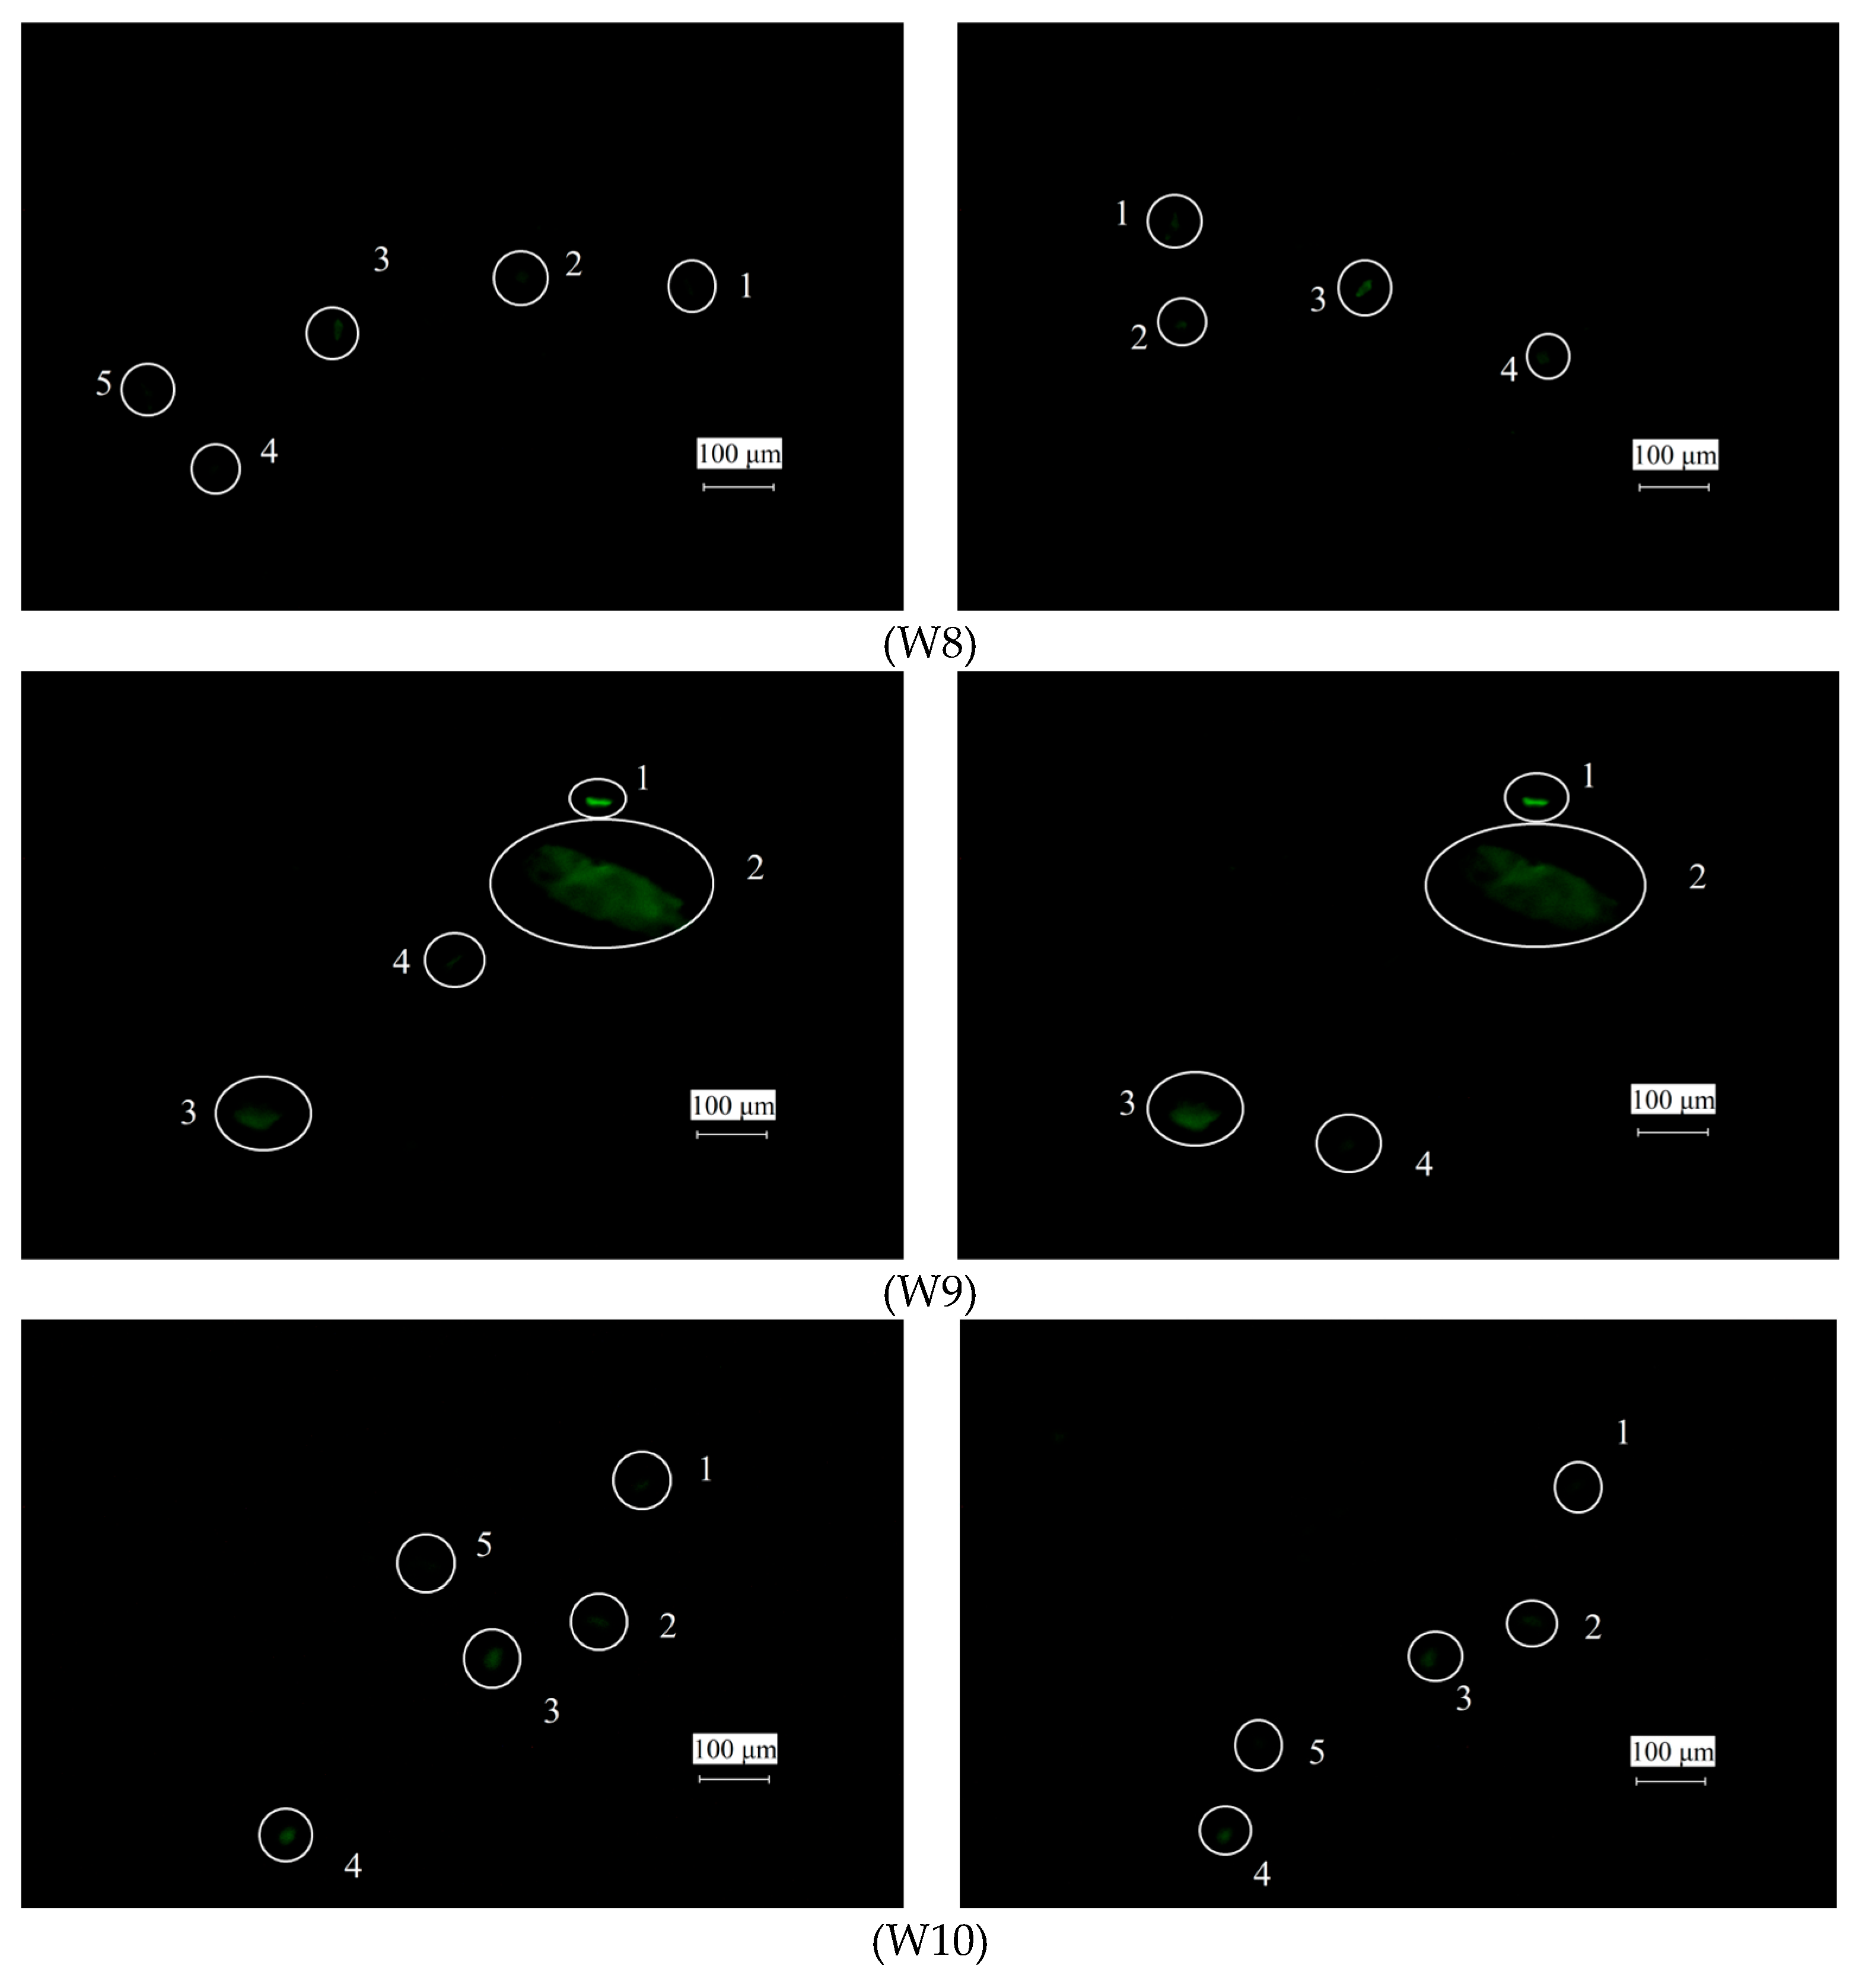
| Positions | Fluorescence Initial Image | Fluorescence Polarization Images |
|---|---|---|
| W1 | 1 | 1 |
| W2 | 2 | 3 |
| W3 | 5 | 5 |
| W4 | 4 | 6 |
| W5 | 5 | 6 |
| W6 | 3 | 2 |
| W7 | 4 | 5 |
| W8 | 4 | 4 |
| W9 | 4 | 4 |
| W10 | 5 | 5 |
| Sum | 37 | 41 |
Disclaimer/Publisher’s Note: The statements, opinions and data contained in all publications are solely those of the individual author(s) and contributor(s) and not of MDPI and/or the editor(s). MDPI and/or the editor(s) disclaim responsibility for any injury to people or property resulting from any ideas, methods, instructions or products referred to in the content. |
© 2025 by the authors. Licensee MDPI, Basel, Switzerland. This article is an open access article distributed under the terms and conditions of the Creative Commons Attribution (CC BY) license (https://creativecommons.org/licenses/by/4.0/).
Share and Cite
Cui, Y.; Liu, X.; Xiao, B.; Wu, Y.; Wang, C. Improving the Detection Accuracy of Subsurface Damage in Optical Materials by Exploiting the Fluorescence Polarization Properties of Quantum Dots. Nanomaterials 2025, 15, 1182. https://doi.org/10.3390/nano15151182
Cui Y, Liu X, Xiao B, Wu Y, Wang C. Improving the Detection Accuracy of Subsurface Damage in Optical Materials by Exploiting the Fluorescence Polarization Properties of Quantum Dots. Nanomaterials. 2025; 15(15):1182. https://doi.org/10.3390/nano15151182
Chicago/Turabian StyleCui, Yana, Xuelian Liu, Bo Xiao, Yajie Wu, and Chunyang Wang. 2025. "Improving the Detection Accuracy of Subsurface Damage in Optical Materials by Exploiting the Fluorescence Polarization Properties of Quantum Dots" Nanomaterials 15, no. 15: 1182. https://doi.org/10.3390/nano15151182
APA StyleCui, Y., Liu, X., Xiao, B., Wu, Y., & Wang, C. (2025). Improving the Detection Accuracy of Subsurface Damage in Optical Materials by Exploiting the Fluorescence Polarization Properties of Quantum Dots. Nanomaterials, 15(15), 1182. https://doi.org/10.3390/nano15151182