1. Introduction
Due to rapid advancements in emerging technologies and the globalization of economic and trade activities, global industrial output has grown significantly. As a result, countries around the world face challenges such as energy shortages and environmental pollution [
1]. Among various solution approaches, nanoscale oxide semiconductor photocatalytic materials have attracted considerable attention [
2,
3]. These materials can absorb solar energy and induce photoelectrochemical reactions to degrade organic contaminants and pollutants, making them a key technology for addressing energy shortages and promoting environmental sustainability [
4,
5]. The development and applications of such material systems have gained widespread interest.
The optical bandgap energy, microstructural morphology, specific surface area, and the separation and recombination characteristics of photogenerated charge carriers are critical factors influencing the photocatalytic performance of oxide semiconducting materials [
6]. These properties play key roles in the selection of practical and promising oxide photocatalysts. In addition to physical characteristics, factors such as cost efficiency, environmental friendliness, and reusability are also important considerations when selecting suitable material systems. Semiconductor photocatalytic nanomaterials, such as TiO
2, ZnO, WO
2, MnO
2, Mo
2O
3, CuO, Cu
2O, and SnO
2, have been widely utilized for the photodegradation of organic contaminants by harnessing solar energy to initiate photoelectrochemical reactions [
7,
8]. Among these contaminants, organic dyes are particularly significant, representing a major source of industrial wastewater pollution, and pose serious environmental threats by severely contaminating rivers and the surrounding soil.
Several strategies have been used to enhance the photocatalytic activity of semiconductor photocatalysts by improving the generation efficiency of photocarriers, suppressing the recombination of electron-hole pairs, and increasing the mobility of charge carriers [
2]. These approaches include improving crystal quality, inducing phase transitions, modifying chemical composition through impurity doping, controlling the microstructure, regulating the bandgap, applying surface sensitization, and coupling with other semiconductors to form heterojunction composites [
9].
Zinc oxide (ZnO) is an n-type semiconductor and a promising photocatalyst candidate due to its superior photocatalytic degradation performance in organic compounds compared to typical titanium dioxide (TiO
2) [
8]. ZnO has a wide bandgap energy of approximately 3.35 eV, enabling the excitation of photoinduced charge carriers under near-UV light irradiation. However, it suffers from a high recombination rate of photogenerated electron-hole pairs, which could reduce its photocatalytic efficiency and limit its application in photoelectrochemical processes [
10,
11]. Tungsten trioxide (WO
3) is also an n-type semiconductor, exhibiting excellent photoelectrochemical properties, and has high chemical stability [
12]. With a narrower optical bandgap ranging from 2.4 to 2.8 eV, WO
3 can absorb visible light to improve optoelectronic properties, making it more effective in utilizing solar energy for photoelectrochemical applications [
13]. Numerous previous studies demonstrated that the combination of ZnO and WO
3 to form heterostructure nanocomposites not only improves visible-light absorption but also enhances the separation of photogenerated charge carriers while suppressing their recombination [
14,
15,
16]. Therefore, this feature leads to a significant improvement in photocatalytic degradation efficiency under visible-light irradiation.
For example, Lam et al. investigated various loadings of WO
3 nanoparticles coated with ZnO nanorods, synthesized using a combination of hydrothermal and chemical solution processes, for applications in photocatalytic degradation [
17]. Their study demonstrated that WO
3–ZnO nanocomposites exhibited higher photocatalytic activity compared to pure ZnO nanorods and commercial P25. This enhancement was attributed to the formation of a heterostructure that promotes the separation of photoinduced charge carriers and improves the surface properties of the oxide semiconductor photocatalyst. Zheng et al. fabricated composite structures consisting of WO
3 nanorod arrays and ZnO nanosheet arrays on FTO substrates [
14]. They investigated the influence of the ZnO hydrothermal growth time on the physical properties and methylene blue (MB) photodegradation performance. Their results showed that the WO
3/ZnO composite structures exhibited significantly better photodegradation efficiency compared to individual WO
3 nanorod arrays and ZnO nanosheet arrays. Furthermore, Lei et al. reported the fabrication of ZnO nanoparticles deposited on WO
3 nanosheet arrays, which were grown on a 316 L stainless steel substrate through a hydrothermal process followed by thermal treatment, for the photocatalytic degradation of the organic dye methylene blue (MB) under solar light irradiation [
18]. They investigated the effects of hydrothermal reaction time (1–5 h) at 120 °C for WO
3 nanosheet arrays (NSAs) and varying concentrations of ZnO precursor solution (10–50 mM, in 10 mM increments) on the structural and photochemical properties of WO
3/ZnO NSAs. The results showed that the WO
3/ZnO heterojunction, when loaded with an optimal amount of ZnO nanoparticles, exhibited significantly enhanced photocatalytic activity compared to the pristine WO
3 nanosheet arrays. This improvement was attributed to the favorable energy band alignment of the heterojunction, enhanced light absorption, and efficient separation of photogenerated electron-hole pairs, all of which contribute to the improved photocatalytic performance and stability.
Typical nanopowder photocatalysts require inconvenient separation and drying for reuse, often leading to material loss. Depositing nanostructured photocatalysts on FTO glass substrates offers a more convenient and reusable alternative. Furthermore, the FTO bottom layer improves light absorption and improves photocatalytic performance. In the present study, the authors prepared both WO3 nanosheet arrays and WO3/ZnO nanocomposites on transparent conducting FTO glass substrates using a low-temperature hydrothermal method. The aim is to develop photocatalysts with high degradation efficiency under visible light and easy reusability potential. The effects of hydrothermal growth time on the structural properties, optical characteristics, and organic dye photodegradation efficiency of the WO3 nanosheet arrays and WO3/ZnO nanocomposites were systematically investigated. Additionally, the oxide semiconductor photocatalyst that exhibited the highest degradation performance was subjected to a cycling test to evaluate its reusability.
3. Results and Discussion
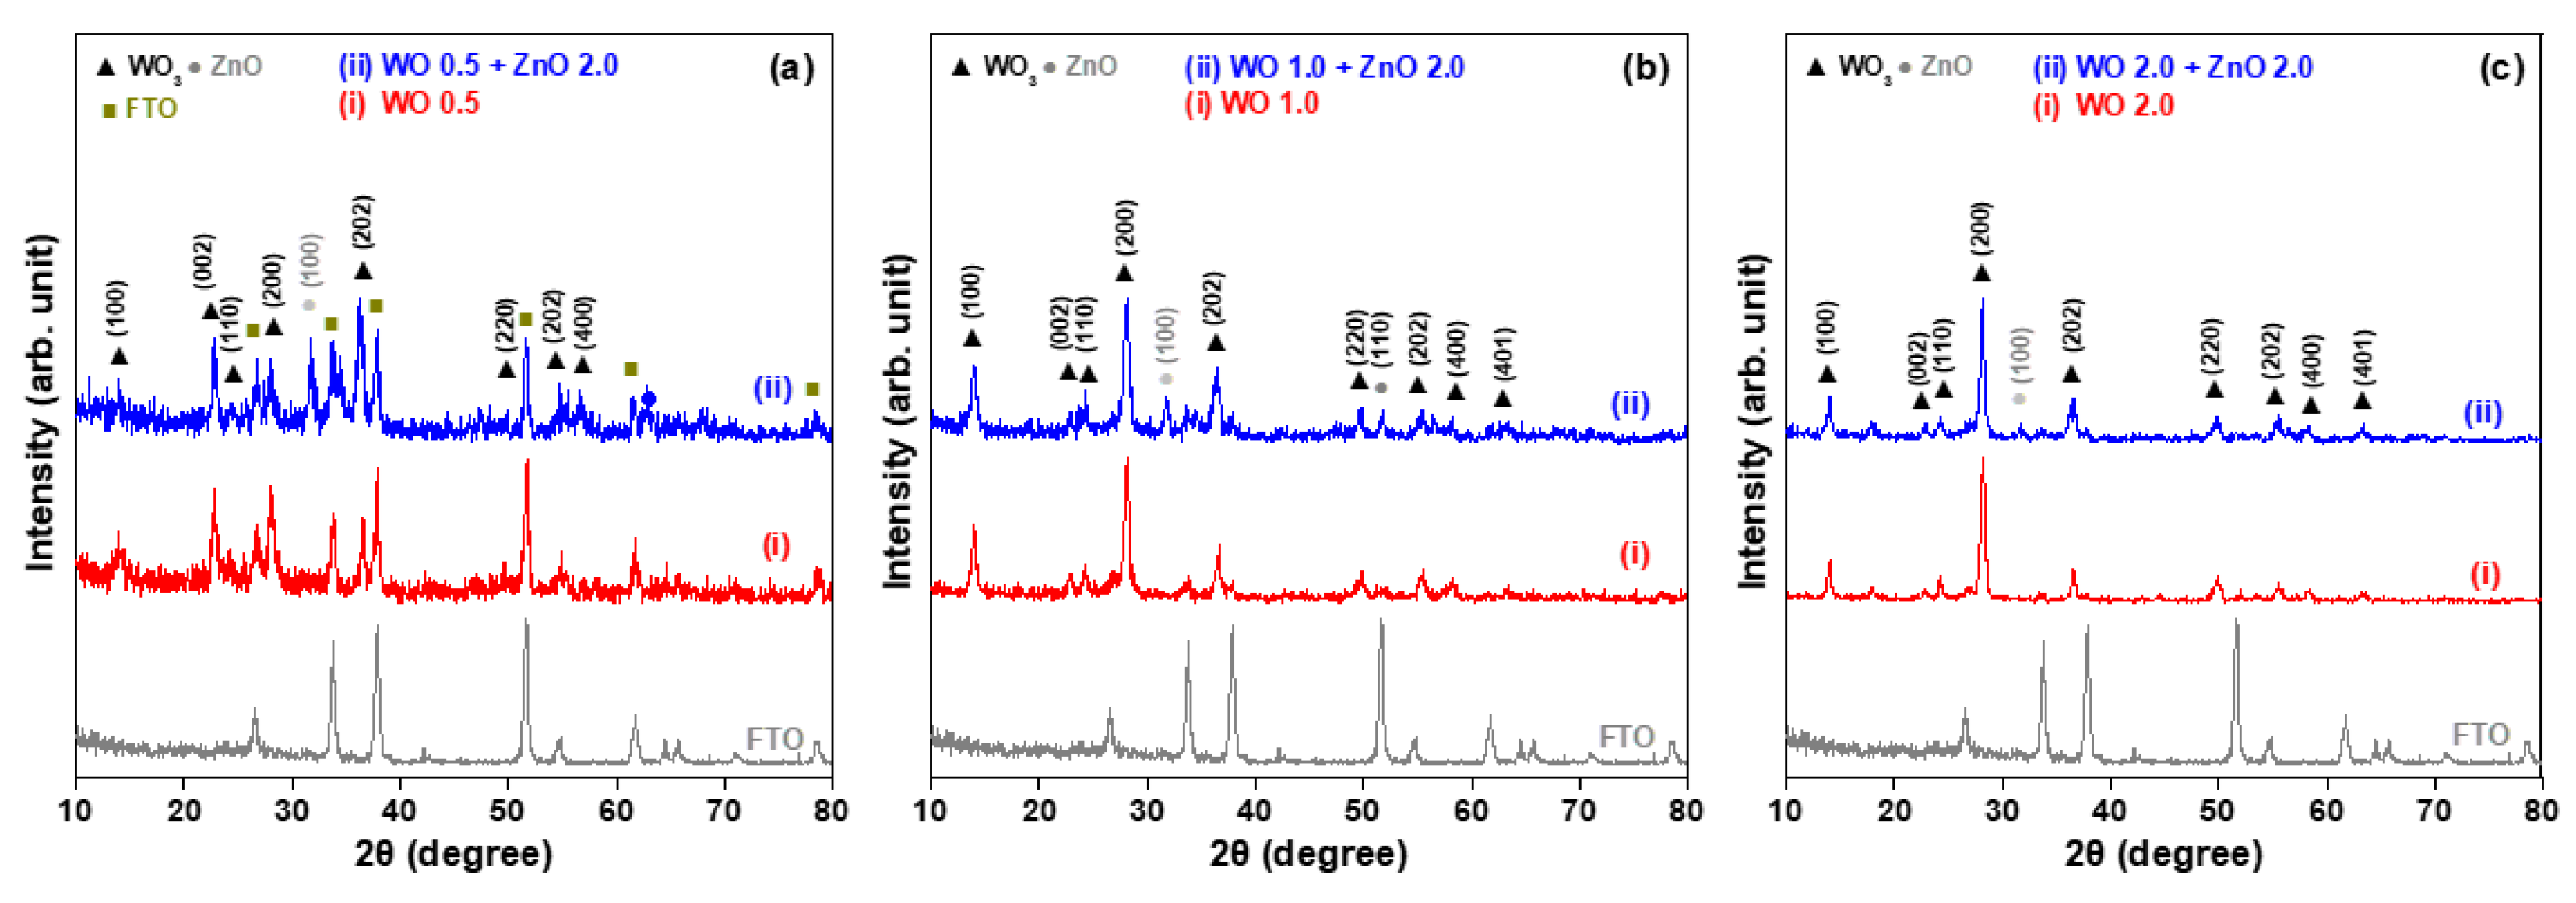
Figure 1 shows the XRD patterns of WO
3 nanosheet arrays grown on FTO glass substrates using a hydrothermal method at 170 °C for 0.5, 1, and 2 h. The eight X-ray diffraction peaks correspond to the crystal planes (100), (002), (110), (200), (202), (220), (222), and (400) of WO
3, as indexed in JCPDS card No. 33-1378 [
15]. These results confirm that the hydrothermally synthesized WO
3 nanostructures are hexagonal in nature. In addition to detecting signals from the WO
3 crystal phase, diffraction peaks from the FTO film are also detected. This is because, with a short growth duration of 0.5 h, the thickness of the WO
3 nanosheet array is less than the penetration depth of the Cu Kα radiation used in XRD examination, allowing the diffraction signals of the underlying FTO film to be observed. These XRD patterns also indicate that as the growth time increases, the intensity of the diffraction peaks becomes stronger and the peak shapes sharper. This suggests not only an increase in the thickness of the WO
3 nanosheet arrays, but also an improvement in their crystallinity.
Figure 1 also presents the XRD patterns of WO
3/ZnO nanocomposites, which were prepared by first growing WO
3 nanosheet arrays on FTO glass substrates by hydrothermal synthesis with varying durations, followed by a second hydrothermal step to deposit ZnO nanostructures on the WO
3 arrays. The three WO
3/ZnO samples show diffraction peaks corresponding to the crystalline phases of both WO
3 and ZnO. These peaks align well with standard JCPDS No. 33-1378 for the WO
3 phase and No. 36-1451 for the ZnO phase [
15], confirming the successful formation of WO
3/ZnO heterostructured nanocomposites. For the WO 0.5 + ZnO 2.0 sample (pattern (ii) of
Figure 1a), the XRD pattern reveals diffraction signals from three distinct phases: FTO, WO
3, and ZnO. In particular, the diffraction peaks (002) and (200) of WO
3 are prominent. As the hydrothermal growth time of the WO
3 nanosheets increases, the intensity of the (002) peak decreases significantly, while the (200) peak becomes dominant. This trend suggests a gradual shift in the preferred growth orientation of the WO
3 nanosheets from the [002] to the [200] direction. The hexagonal phase of the WO 2.0 + ZnO 2.0 sample is well-matched to the 2θ positions and relative intensities listed on JCPDS card No. 33-1378 (pattern (ii) of
Figure 1c). Furthermore, the intensity of ZnO-related XRD peaks, specifically (100) and (110), decreases with increasing WO
3 growth time. Since the duration of ZnO growth remained constant for all samples, the strongest ZnO diffraction peaks appear in the sample where the WO
3 nanosheets were grown for only 0.5 h. As the thickness and size of the WO
3 nanosheets increase, the corresponding ZnO XRD peaks become weaker, indicating a reduced contribution of the ZnO phase to the overall structure.
In the present study, WO
3 nanostructures were grown directly on FTO glass substrates, using the polycrystalline nature of FTO as a temporary seed layer.
Figure 2a–c presents top-view FE-SEM micrographs of WO
3 nanosheet arrays synthesized at various durations of the hydrothermal reaction. After 0.5 h of growth (
Figure 2a), only irregularly shaped WO
3 nanocrystalline particles were observed on the surface. When the hydrothermal reaction time was extended to 1 h (
Figure 2b), these initial nanocrystalline particles, formed during the early stage of growth, acted as nucleation sites for the development of nanosheet structures. This FE-SEM image shows that each nanosheet exhibits a rough and porous surface morphology, which is advantageous for enhancing light absorption and providing active sites for photocatalytic reactions. Furthermore, in the absence of a pre-deposited WO
3 seed layer, the growth orientation of the nanosheet arrays was not aligned vertically with the substrate, but rather occurred in random and irregular directions. When the reaction time increased further to 2 h (
Figure 2c), the WO
3 nanosheets became larger and thicker, and their surfaces became smoother and denser. The thickness of WO
3 nanosheets grown for different hydrothermal durations was estimated using cross-sectional FE-SEM micrographs. The average thicknesses of the W 0.5, W 1.0, and W 2.0 samples were determined to be approximately 525 nm, 890 nm, and 1050 nm, respectively.
Figure 2d–f shows FE-SEM micrographs of WO
3/ZnO heterostructure composites synthesized with different hydrothermal growth of the WO
3 nanostructures. As the growth time increases, the FE-SEM images reveal that the nanosheets in the WO
3/ZnO heterostructures become progressively larger and thicker. The estimated average thickness and length of the WO
3/ZnO nanoflakes are approximately 36 and 357 nm, 72 and 536 nm, and 89 and 895 nm for the composites WO 0.5 + ZnO 2.0, WO 1.0 + ZnO 2.0, and WO 2.0 + ZnO 2.0, respectively. These values were obtained from the corresponding FE-SEM micrographs of WO
3/ZnO nanoflake samples. Moreover, the surfaces of these nanosheets are not smooth, but decorated with numerous nanoparticles, forming a hierarchical structure. This hierarchical architecture effectively increases the specific surface area and provides a greater number of active sites for photocatalytic reactions. Compared to flat nanosheet surfaces, the rough morphology composed of surface-bound nanoparticles enhances the absorption of incident light energy. Furthermore, compared to the WO
3 nanosheet arrays shown in
Figure 2a–c, the WO
3/ZnO nanocomposite exhibits more densely packed nanosheet structures. This compact heterostructure is anticipated to improve photoelectrochemical performance, thereby enhancing the efficiency of photocatalytic degradation.
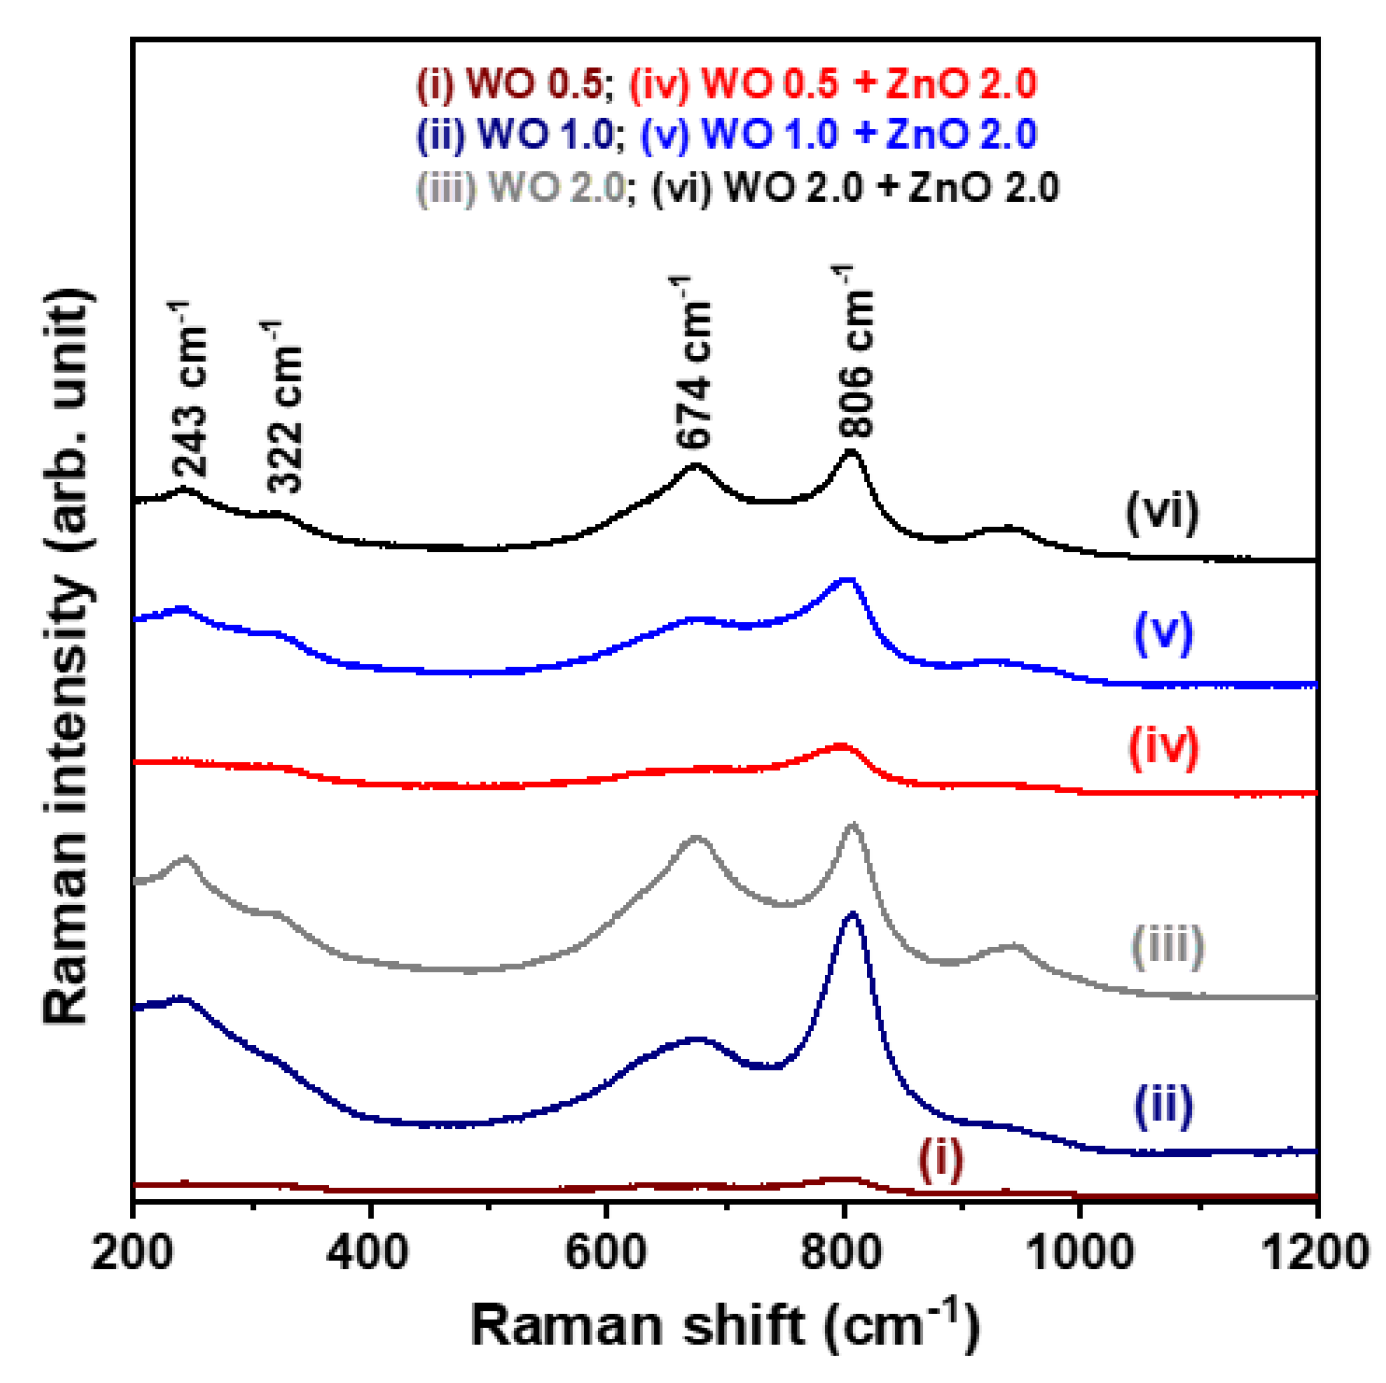
Figure 3 presents the Raman spectra of the WO
3 nanosheet arrays and the WO
3/ZnO nanocomposites, measured at room temperature in the range of 200–1200 cm
−1. As shown in the figure, characteristic Raman signals appear at 674 and 809 cm
−1, corresponding to the stretching and bending vibrations of W–O–W bonds in the WO
3 nanocrystals [
19]. However, no Raman peaks associated with ZnO nanocrystals are detected in the spectra of the WO
3/ZnO nanocomposite samples. Despite this, the previous XRD analysis confirmed the presence of the ZnO phase by identifying diffraction peaks corresponding to the (100) and (110) planes. Furthermore, the SEM-EDS spectra confirm the presence of W, O, and Zn elements in the synthesized WO
3/ZnO nanocomposites, verifying the successful incorporation of ZnO into the composite structure. The absence of ZnO-related Raman signals is likely due to the relatively low ZnO concentration in the WO
3/ZnO nanocomposites. This interpretation is supported by the XRD results, where the ZnO (100) and (110) diffraction peaks are much weaker than those of the WO
3 phase, suggesting that the ZnO content is insufficient to generate detectable Raman signals under the measurement conditions used.
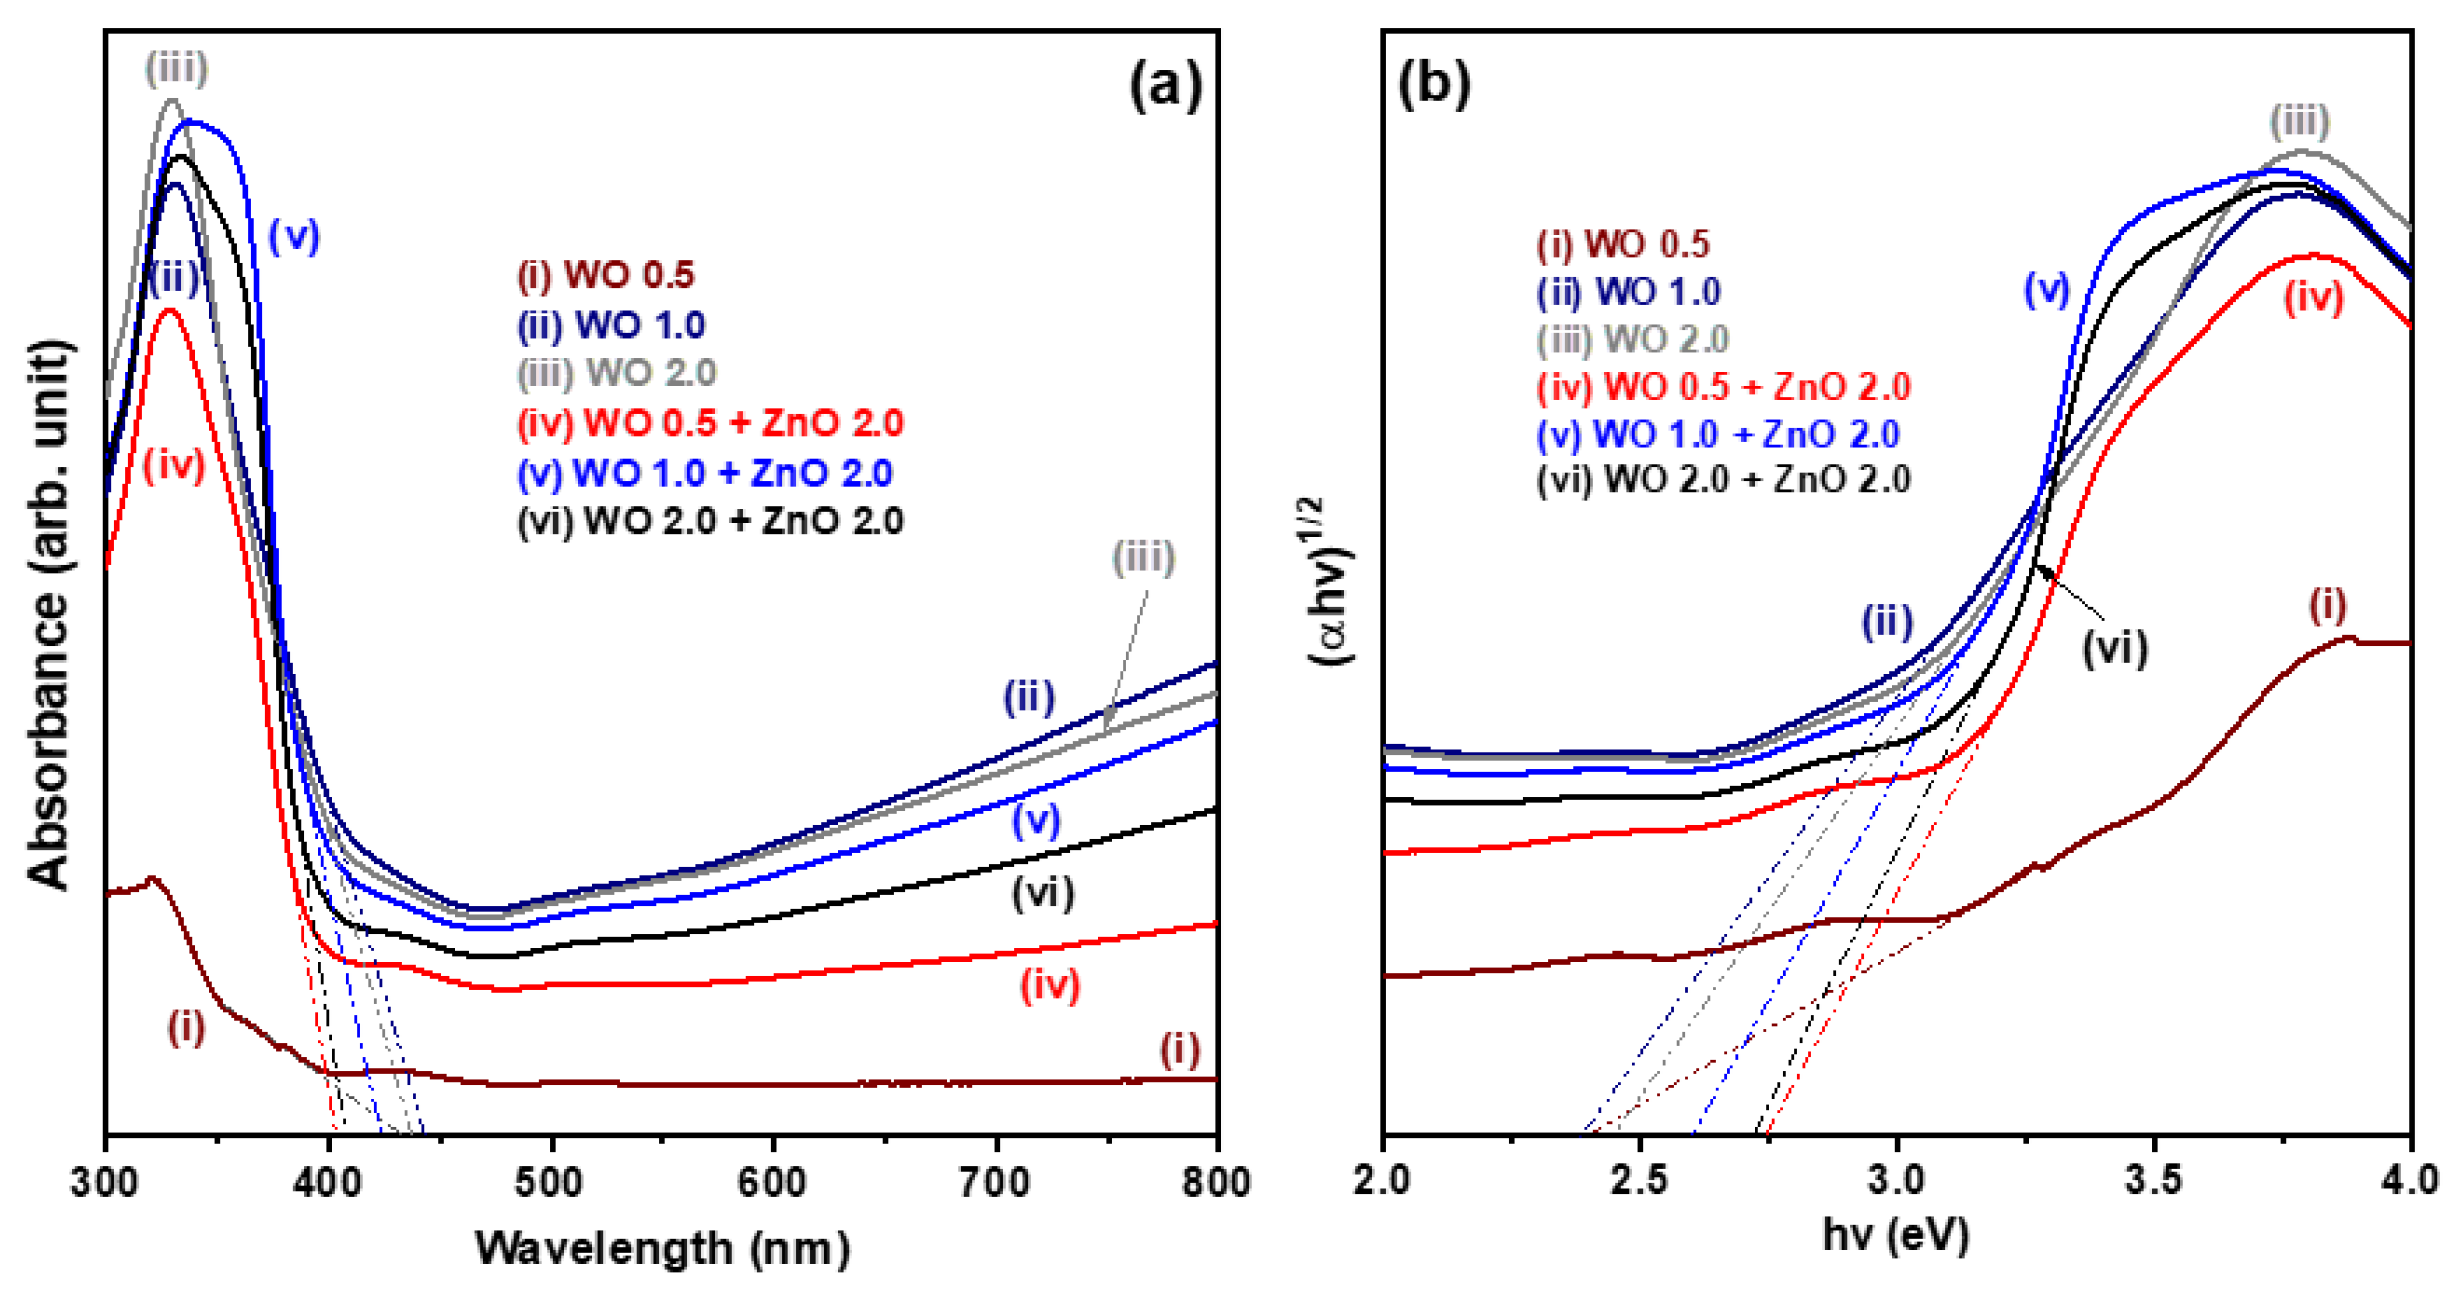
Figure 4a shows the UV-Vis absorption spectra of both pure WO
3 nanosheet array samples and WO
3/ZnO nanocomposite samples. The absorption edges of the three pure WO
3 nanosheet samples lie within the range of 430–445 nm. This characteristic absorption corresponds to electronic transitions from the valence band to the conduction band of the WO
3 nanosheets, indicating its optical bandgap energy. In comparison, the WO
3/ZnO nanocomposite samples exhibit absorption edges between 400–425 nm. This noticeable blue shift relative to the pure WO
3 samples is attributed to the influence of the ZnO nanostructures. Additionally, the WO 1.0 and WO 2.0 samples show stronger visible-light absorption than the three WO
3/ZnO nanocomposites. However, as the hydrothermal reaction time increases, the visible-light absorption of the WO
3/ZnO nanocomposites improves significantly. This enhancement is likely due to the increased thickness of the WO
3 nanosheet arrays in the WO
3/ZnO nanocomposites, which enhances the light-harvesting capability in the visible region.
Figure 4b displays the corresponding Tauc plots, illustrating the relationship between (αhν)
1/2 and the photon energy (hν), based on the UV-Vis diffuse reflectance data recorded. The optical bandgap energy (Eg) of the oxide nanostructures is estimated using the following Tauc equation:
where A is a constant, h is Planck’s constant, ν is the frequency of incident light, α is the absorption coefficient, and Eg is the optical bandgap energy of the oxide semiconductor. By extrapolating the linear portion of each curve in
Figure 4b to the
X-axis (photon energy), the Eg values were determined. The estimated optical bandgap energies for the six oxide nanostructure samples are approximately 2.40, 2.40, 2.44, 2.77, 2.63, and 2.71 eV, respectively.
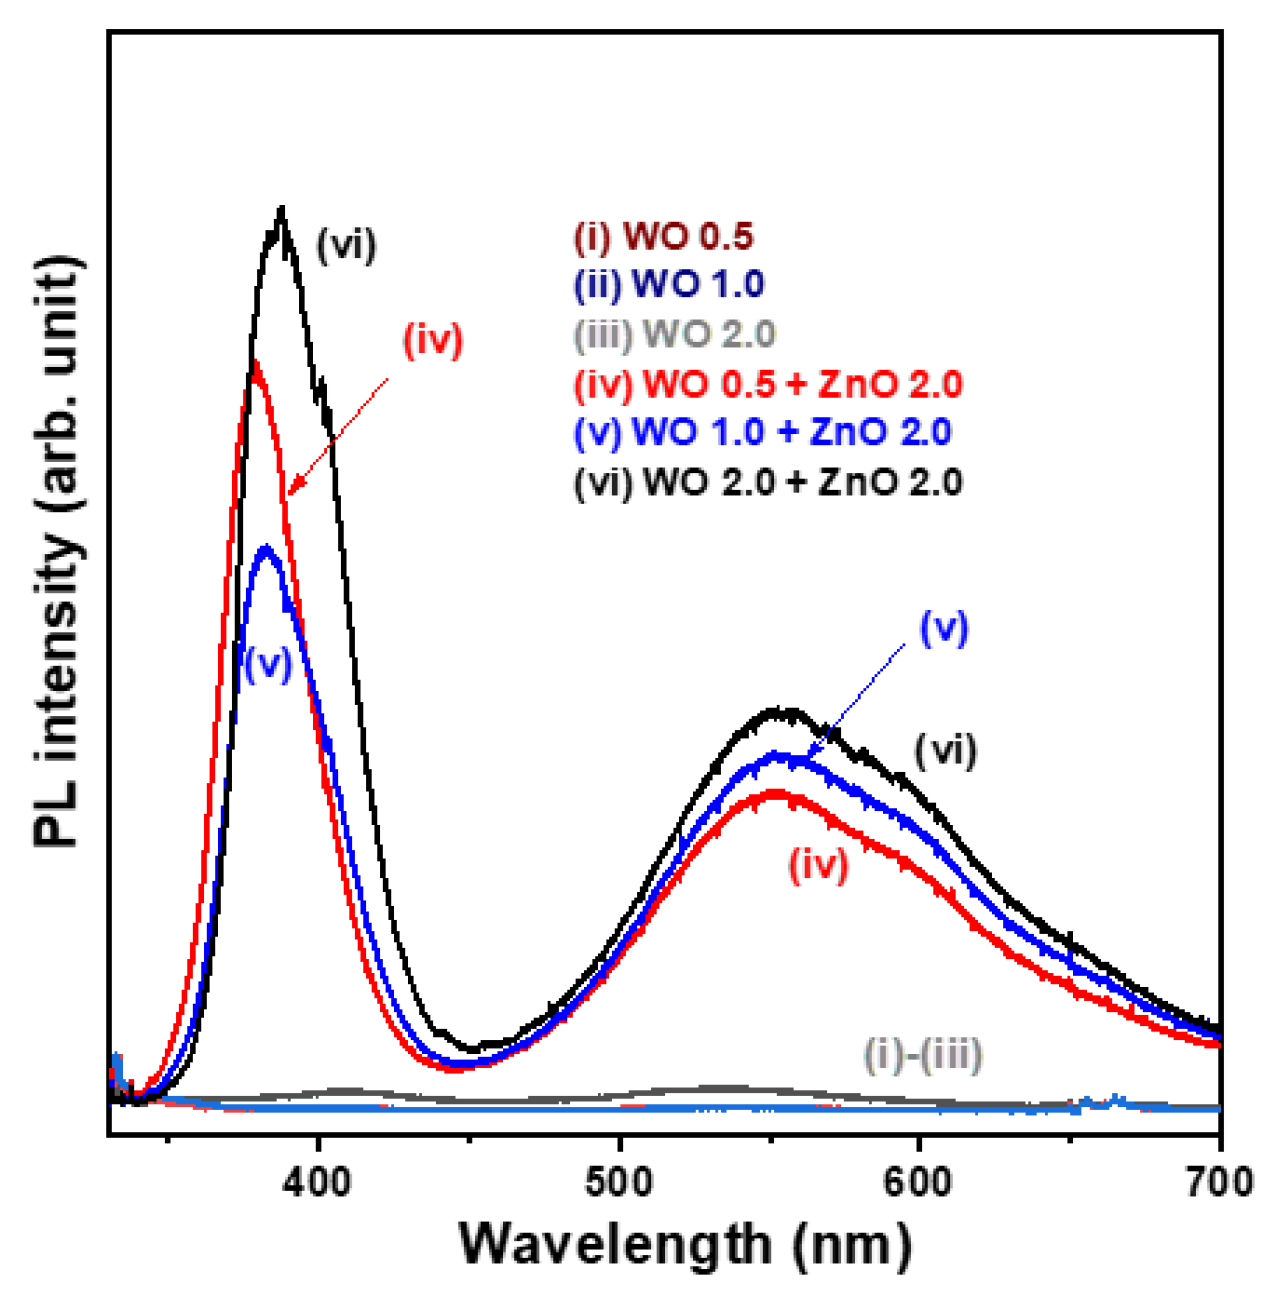
The photoluminescence (PL) spectra of the nanostructural oxide samples measured at room temperature are shown in
Figure 5. The WO
3 nanosheet array samples exhibit very weak PL signals (spectra (i)–(iii)). On the contrary, all WO
3/ZnO nanocomposite samples display two prominent emission peaks, including a near-ultraviolet emission peak at approximately 355.4 nm, attributed to near-band edge transitions, and a broad, intense visible emission band ranging from 450 to 650 nm, which is generally associated with crystal defects (spectra (iv)–(vi)). The significantly enhanced PL emission intensity observed in the WO
3/ZnO heterostructure samples can be attributed to the direct optical bandgap nature of ZnO, which facilitates the generation of electron-hole pairs upon photoexcitation. The broad visible emission band in the 450–650 nm range (yellow-green light region) is likely due to oxygen vacancies and tungsten interstitials. As the growth time of the WO
3 nanosheet arrays in the WO
3/ZnO nanocomposite samples increased from 0.5 to 2.0 h, the near-UV PL emission peak exhibited a slight redshift. Furthermore, the intensity of the defect-related visible emission band increased markedly, indicating a higher rate of photogenerated electron-hole pairs with an increased WO
3 content. This suggests that the WO 0.5 + ZnO 2.0 sample exhibits (spectrum (iv)) the lowest electron-hole recombination rate among the tested samples.
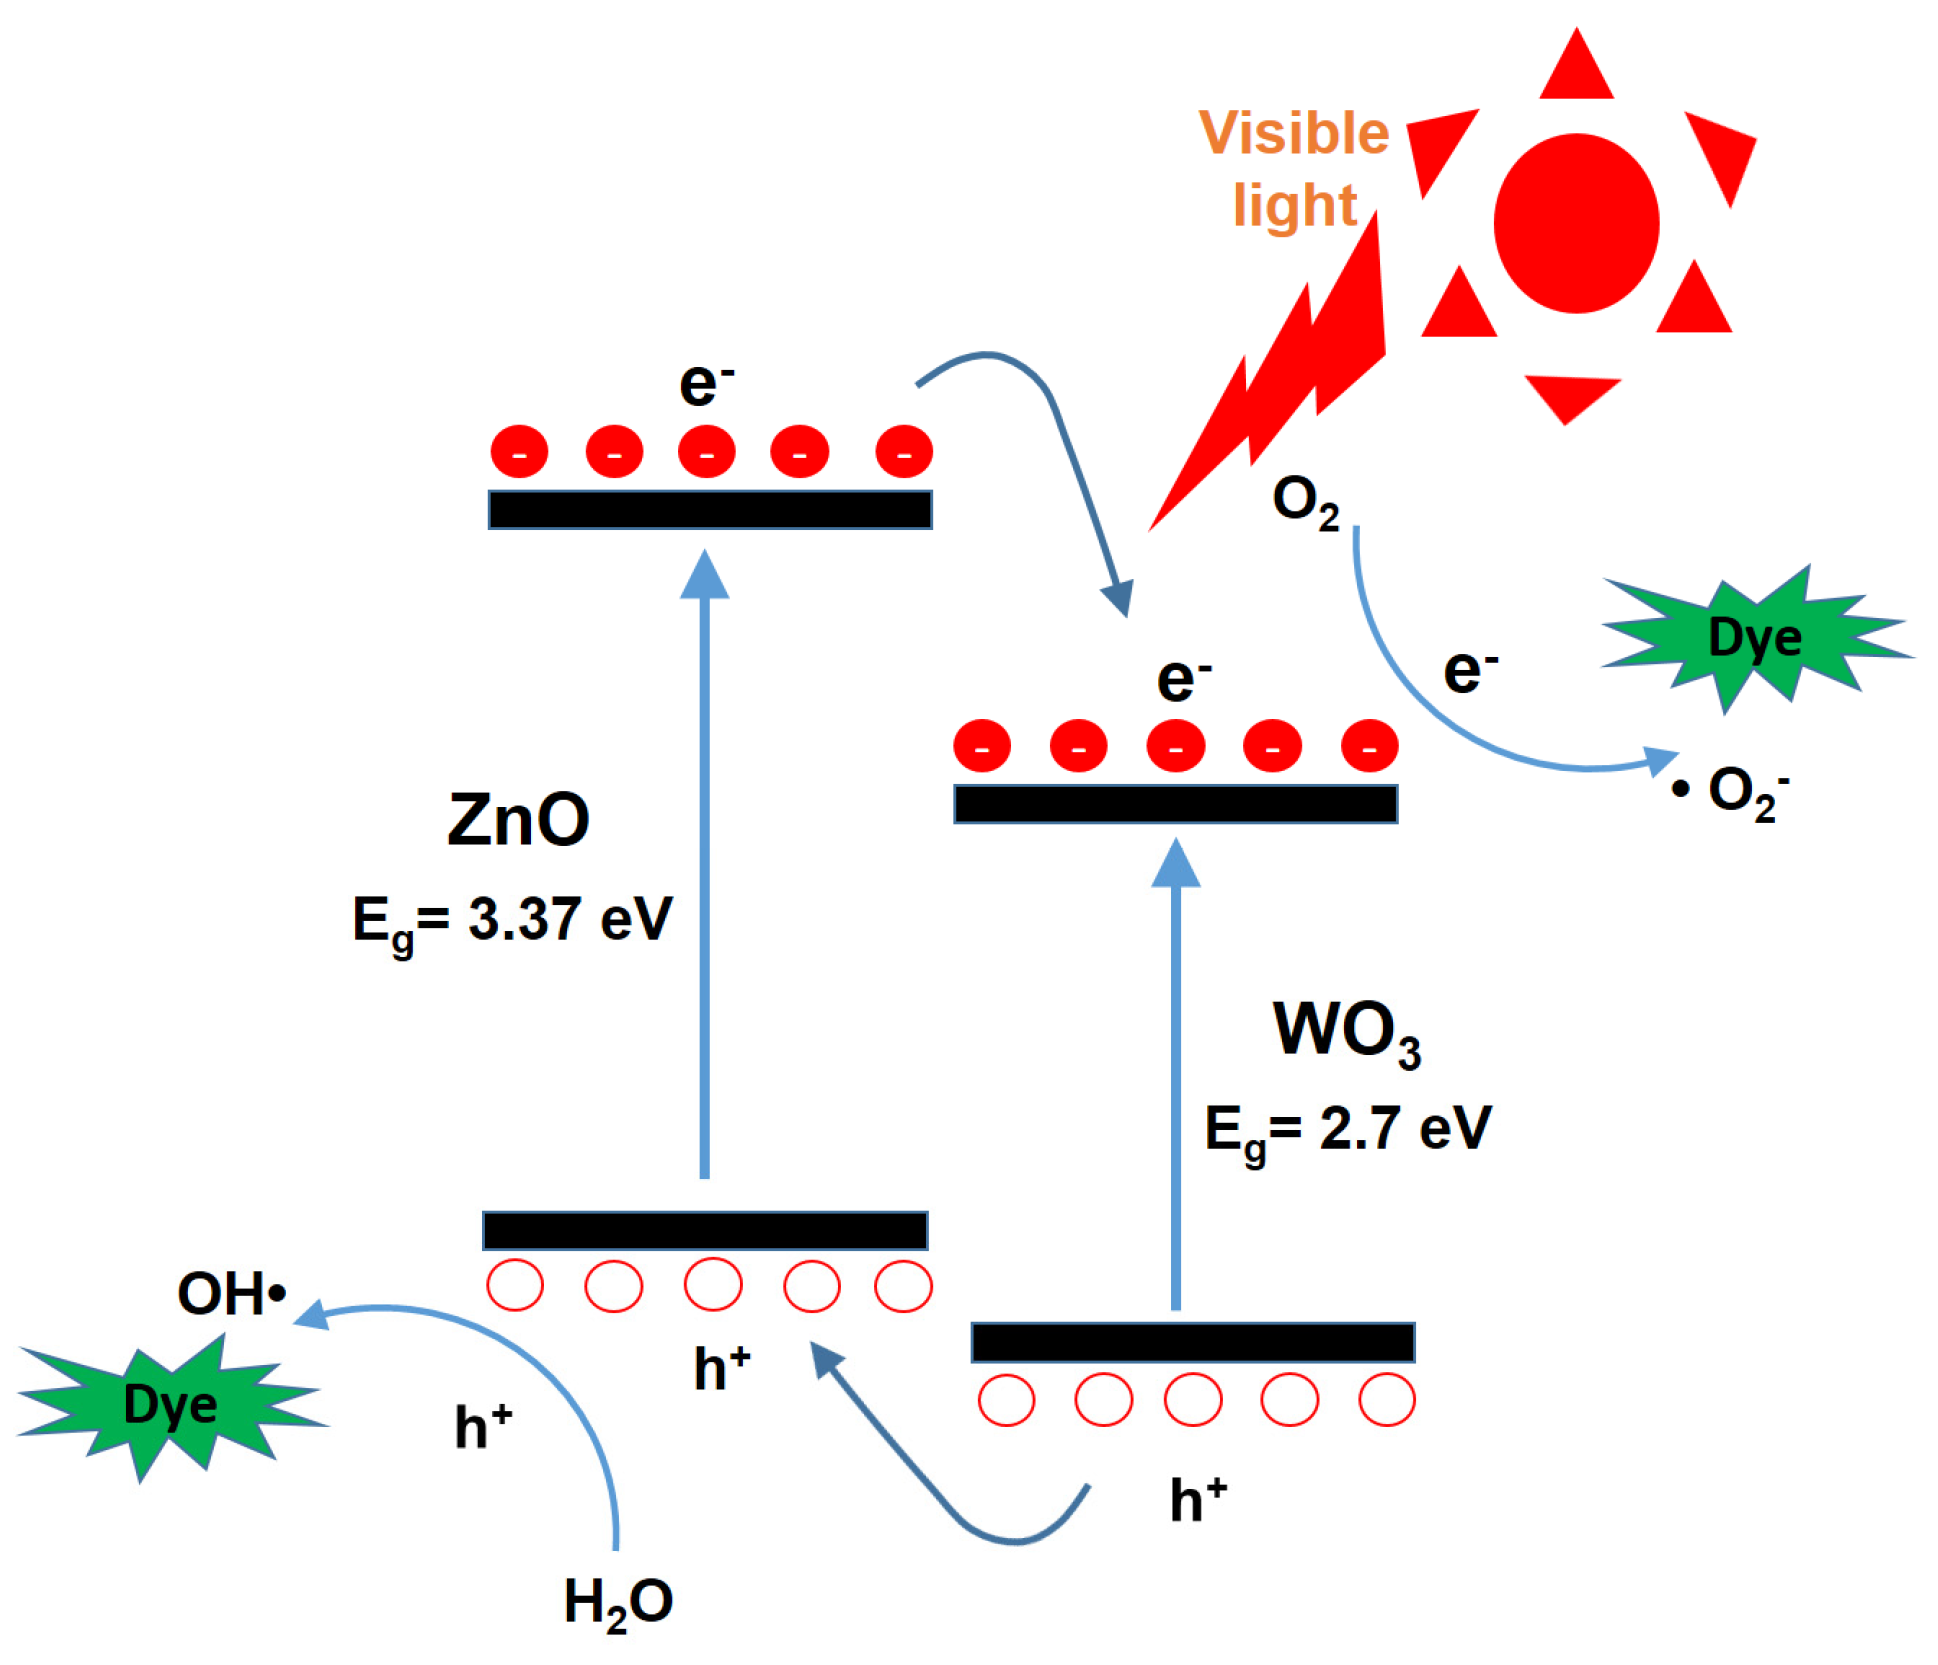
Figure 6 presents a schematic energy band diagram of the ZnO/WO
3 heterojunction, illustrating the charge transfer process and the reactions of photogenerated electrons and holes with surface-adsorbed oxygen and water molecules on the nanocatalysts, respectively. It is well-known that photogenerated electrons in the conduction band (CB) of ZnO can rapidly transfer to the CB of WO
3, while the corresponding photogenerated holes in the valence band (VB) of WO
3 migrate to the VB of ZnO due to the favorable band alignment of the heterojunction [
8,
15]. Electrons react with oxygen molecules adsorbed on the nanocatalyst surface to generate superoxide anion radicals (•O
2−), while holes oxidize water molecules to produce hydroxyl radicals (•OH) [
20]. These reactive oxygen species possess strong oxidative capabilities, enabling the degradation of organic dyes into smaller, nontoxic molecules such as carbon dioxide and water [
21]. This charge separation and reactive radical generation mechanism is considered a key factor contributing to the enhanced photocatalytic performance of heterojunction-based composite photocatalysts.
Wastewater from industries such as textiles, food processing, papermaking, printing, leather, and cosmetics often contains azo dyes. The direct discharge of such untreated wastewater into rivers poses a serious threat to aquatic ecosystems and human health, due to the potential for biological mutations and carcinogenic effects. Consequently, photocatalytic degradation studies frequently employ model pollutants such as methylene blue (MB), methyl orange (MO), and rhodamine B (RhB) [
22].
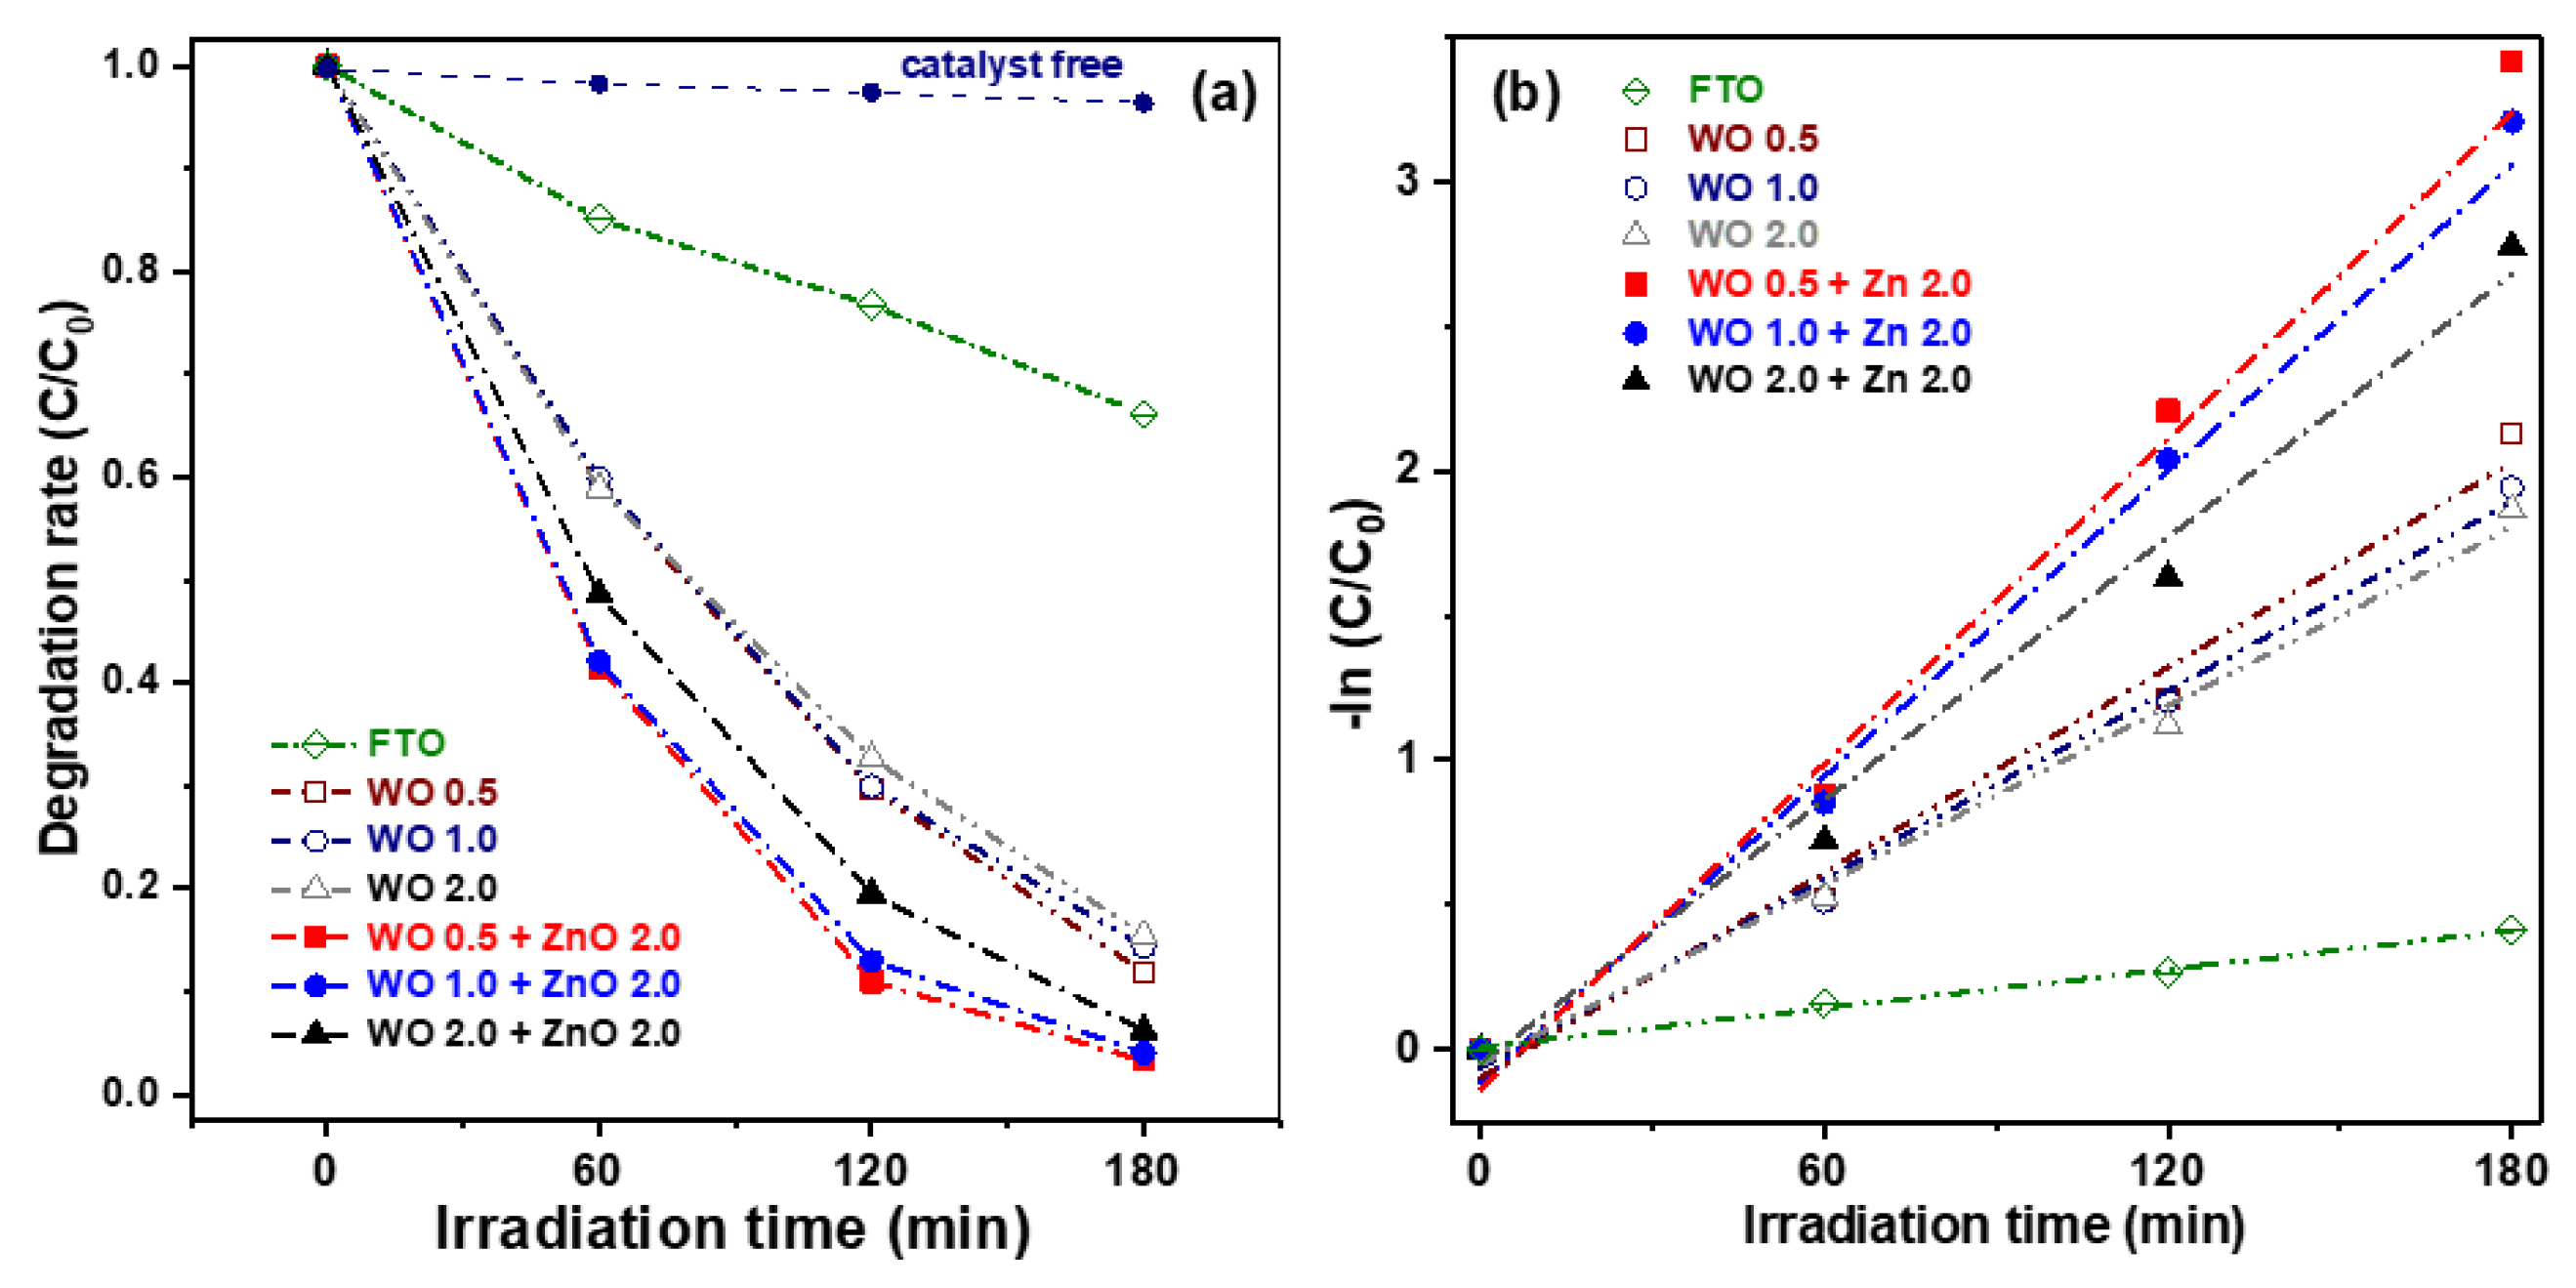
Figure 7a illustrates the degradation rate of aqueous MB solutions under visible-light irradiation using WO
3 nanosheets and WO
3/ZnO nanocomposites, plotted as a function of the irradiation time. To evaluate the effect of photocatalysts on the degradation of MB dye, an experiment without any photocatalyst was performed. In the absence of a photocatalyst, the degradation rate of MB dye was negligible, reaching only about 3.6% after 180 min of illumination. For comparison, the photocatalytic performance of FTO glass was also measured as a reference. After 180 min of visible-light illumination, the FTO glass exhibited a degradation rate of only approximately 20%. The three pure WO
3 nanosheet samples showed similar photocatalytic performance, with degradation efficiencies ranging from 84.5% to 86.0%, indicating minimal variation among them. In contrast, the WO
3/ZnO nanocomposite samples exhibited significantly enhanced degradation efficiency compared to the pure WO
3 samples. This improvement can be attributed to the higher specific surface area of the nanocomposites, which provides more active sites during the photoelectrochemical reactions. Additionally, the formation of WO
3/ZnO heterojunctions effectively suppresses the recombination of photogenerated electron-hole pairs, a key factor contributing to improved photocatalytic activity. Among those oxide semiconductor photocatalysts, the WO 0.5 + ZnO 2.0 nanocomposite exhibited the highest photocatalytic performance, achieving an MB degradation efficiency of 96.7% after 180 min of visible-light irradiation.
Figure 7b presents the photocatalytic kinetics of the six samples, plotted as –ln(C/C
0) versus illumination time. The data were fitted using a pseudo-first-order kinetic model, described by the following equation:
where
K is the reaction rate constant,
C0 is the initial concentration of MB,
C is the concentration of MB at time
t (in minutes), and
t is the irradiation time. The calculated
K values for the three pure WO
3 samples were 0.0118, 0.0109, and 0.0103 min
−1, respectively. Meanwhile, the K values for the WO
3/ZnO nanocomposites were significantly higher, at 0.0193, 0.0182, and 0.0154 min
−1. In particular, the WO 0.5 + ZnO 2.0 sample exhibited the highest rate constant, representing an approximate 63.6% increase compared to the WO 0.5 sample alone. Based on these results, the WO 0.5 + ZnO 2.0 nanocomposite was selected for photocatalytic repeatability tests due to its superior degradation performance.
Table 1 summarizes a comparison of key experimental parameters and results between this study and several published articles, highlighting the relatively low dye concentration used in this work and the achievement of the highest degradation rate after 3 h of photocatalytic treatment. Investigating the reusability of the developed oxide photocatalyst is a key focus of this study.
Figure 8 shows the photocatalytic degradation rate of the WO 0.5 + Zn 2.0 sample under visible-light irradiation over multiple cycles of use to degrade MB in an aqueous solution. After each photodegradation test, the sample was rinsed with DI water, dried on a hot plate at 50 °C for 10 min, and then reused. After two reuse cycles, the degradation efficiency showed a slight decrease from 96.7% to 93.4%, corresponding to a reduction of approximately 3.3%. This minor reduction in performance may be due to residual organic dye remaining on the photocatalyst surfaces or to the partial detachment of the oxide nanocomposite film during use. Therefore, enhancing the adhesion characteristics between the oxide nanocomposite film and the FTO layer is essential before this material can be advanced toward practical engineering applications.


 ,
, 


