
Inverse Identification of Single-Crystal Plasticity Parameters of HCP Zinc from Nanoindentation Curves and Residual Topographies


 ,
,
Abstract
:1. Introduction
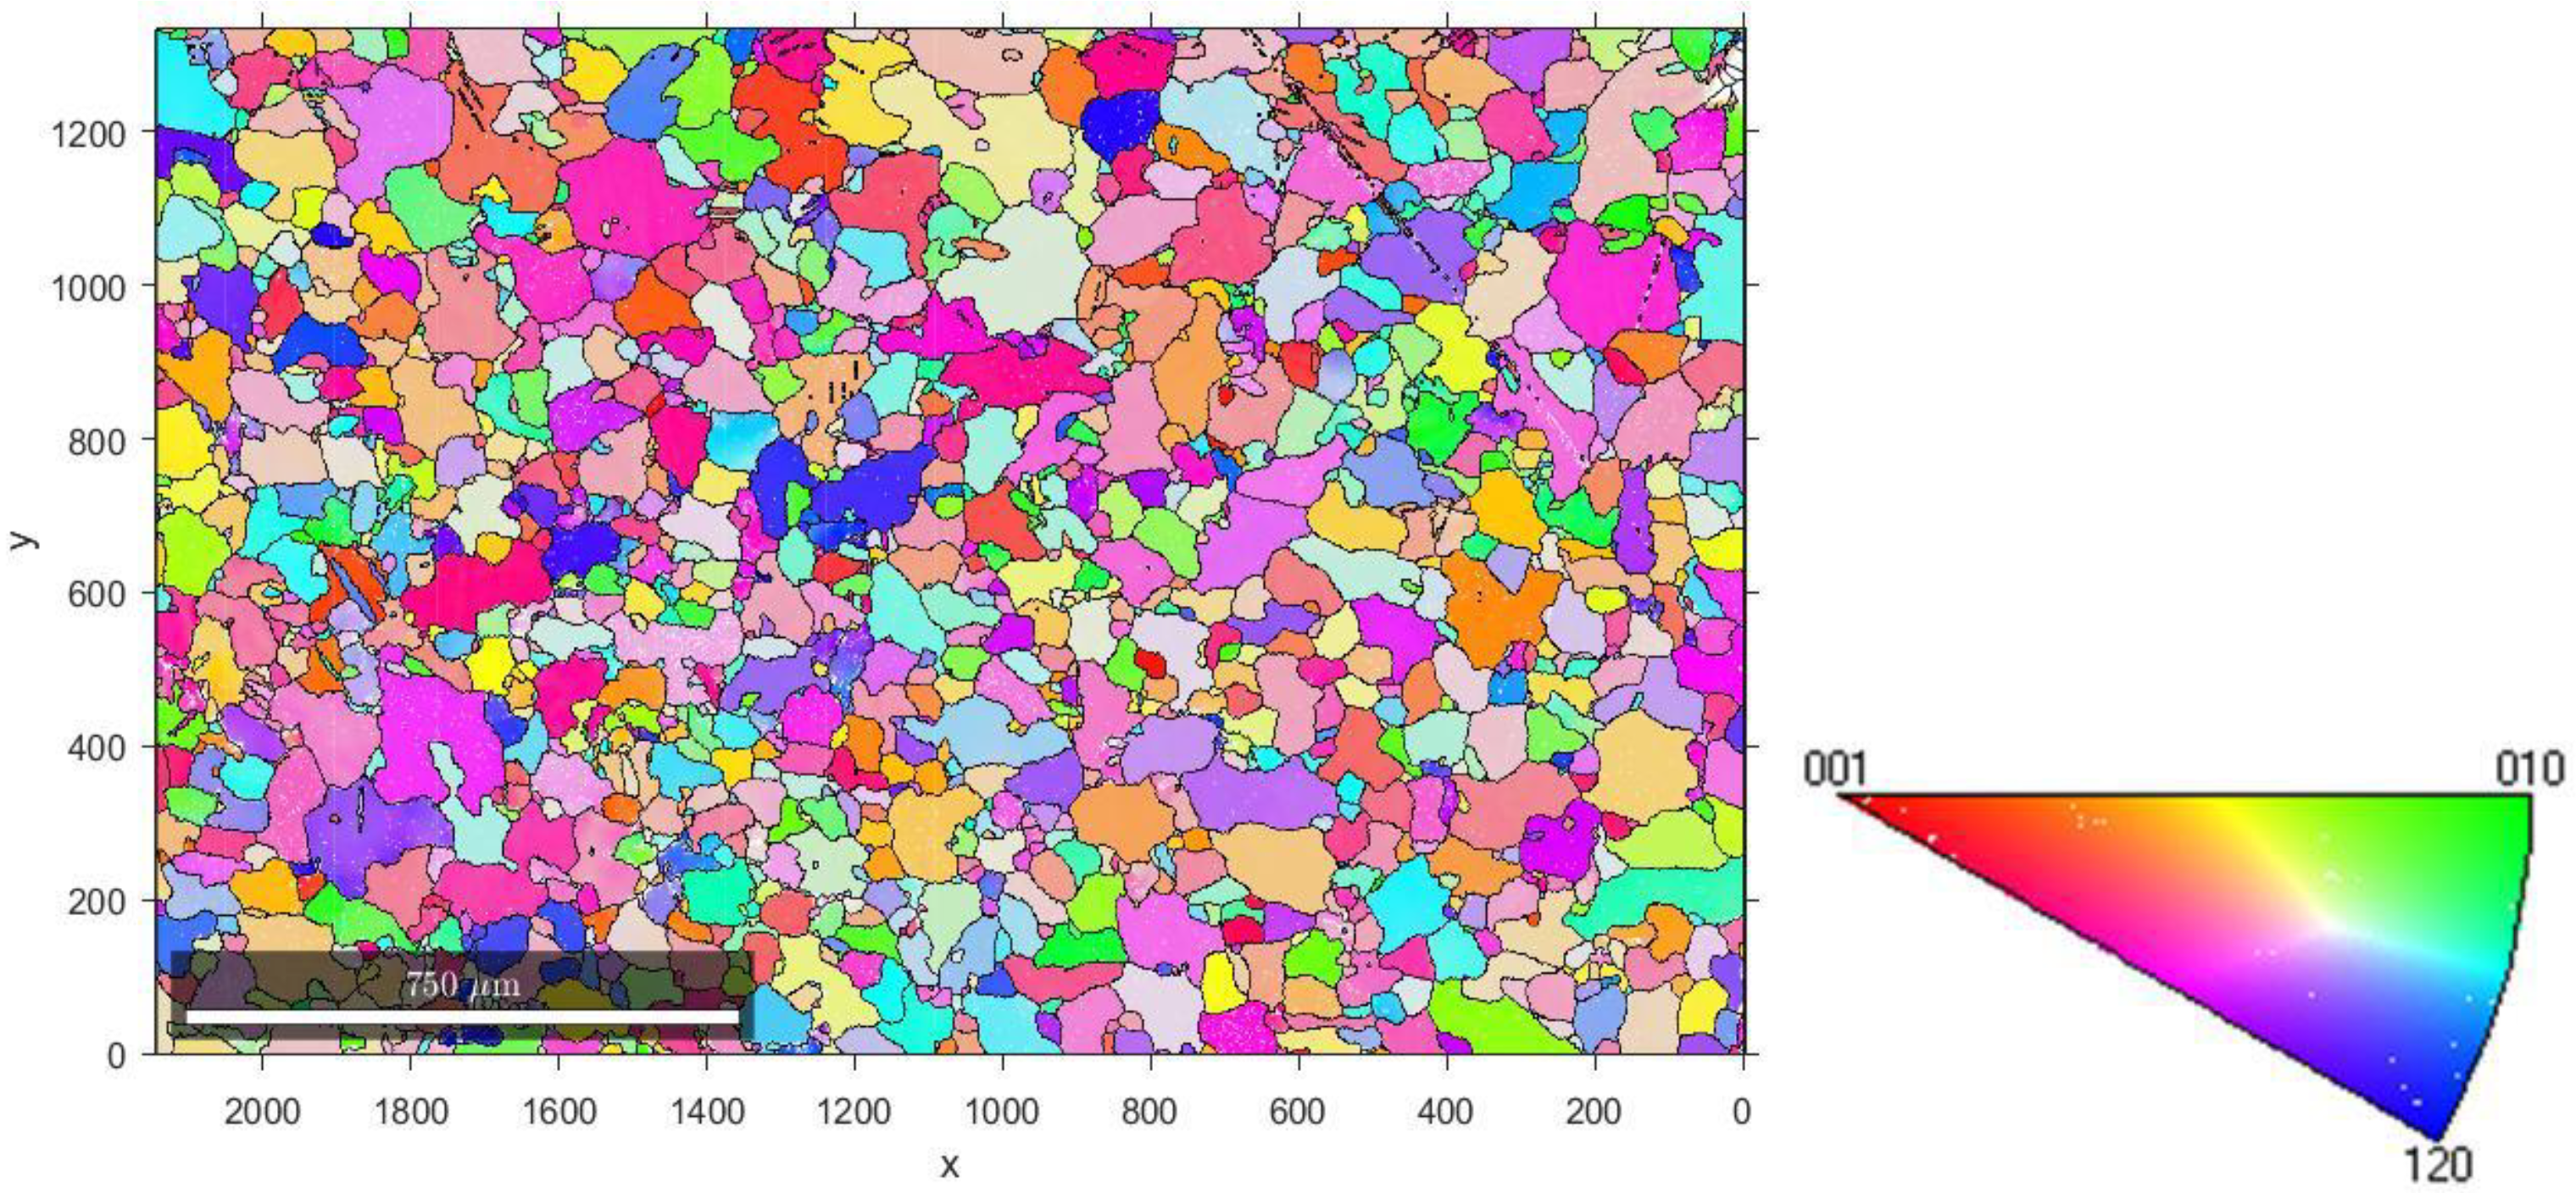
2. Experiments
3. Modeling
3.1. Crystal Plasticity Constitutive Equations
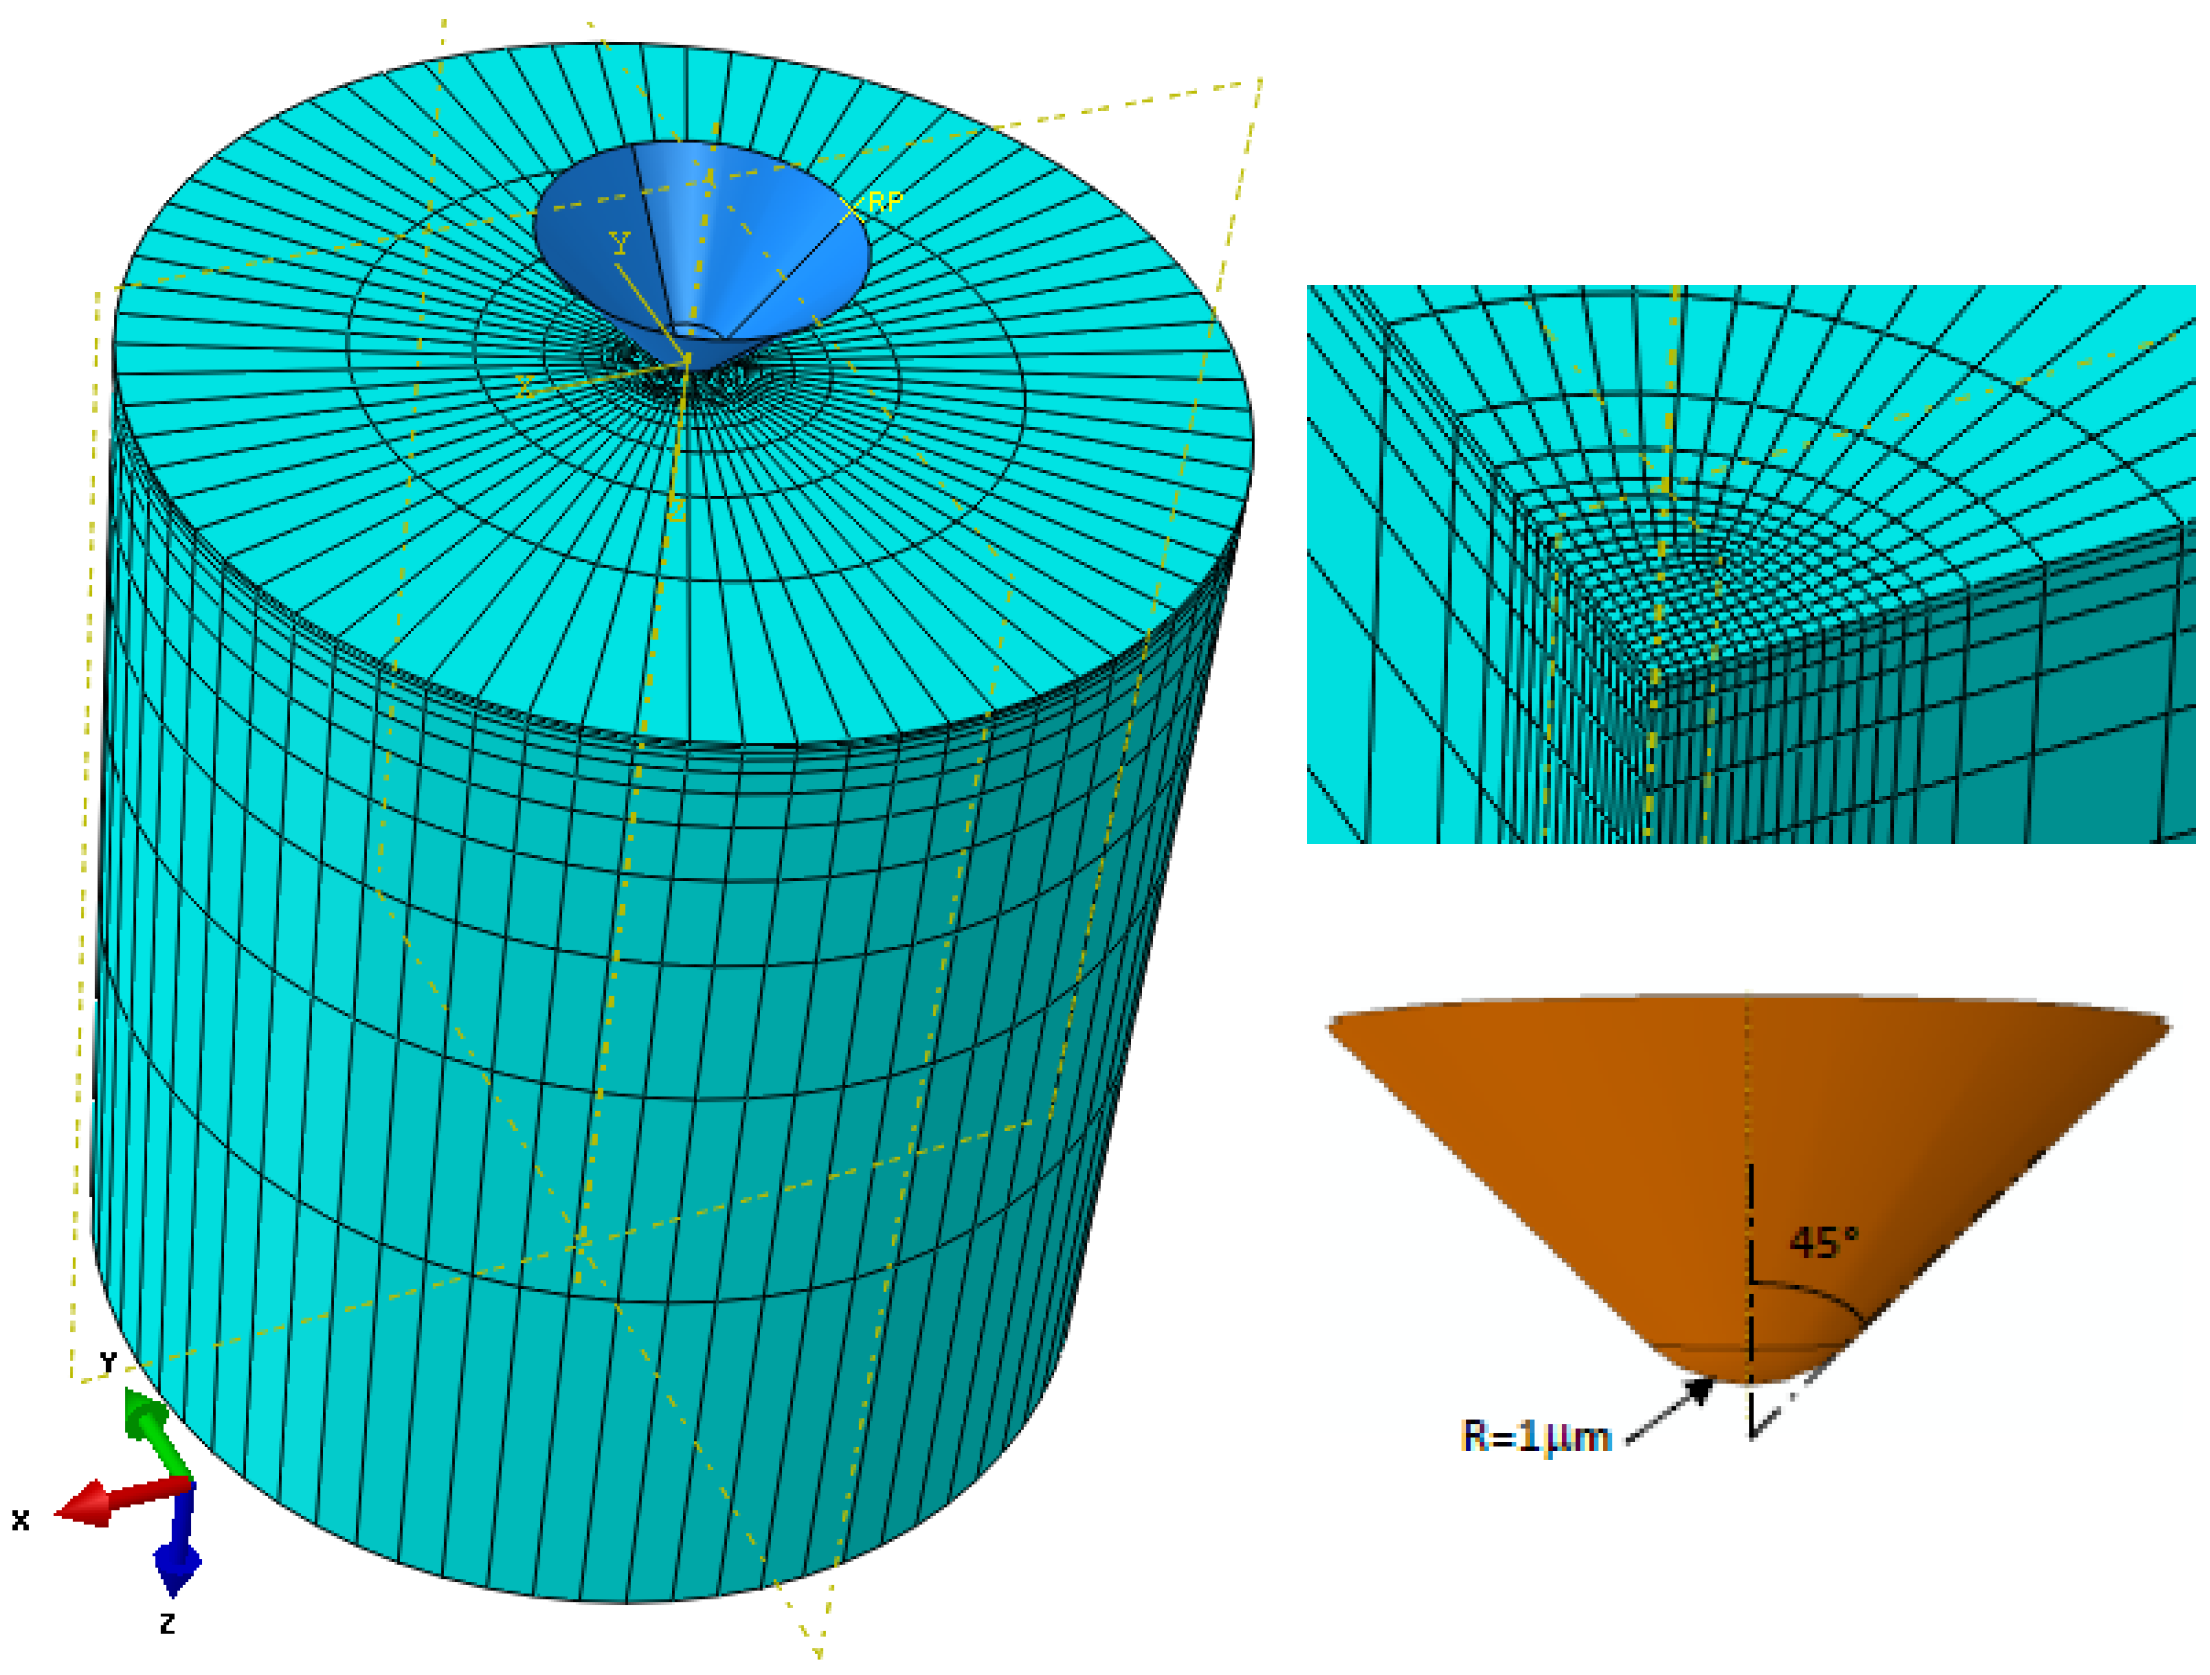
3.2. Crystal Plasticity Finite Element Simulation of the Nanoindentation Experiment
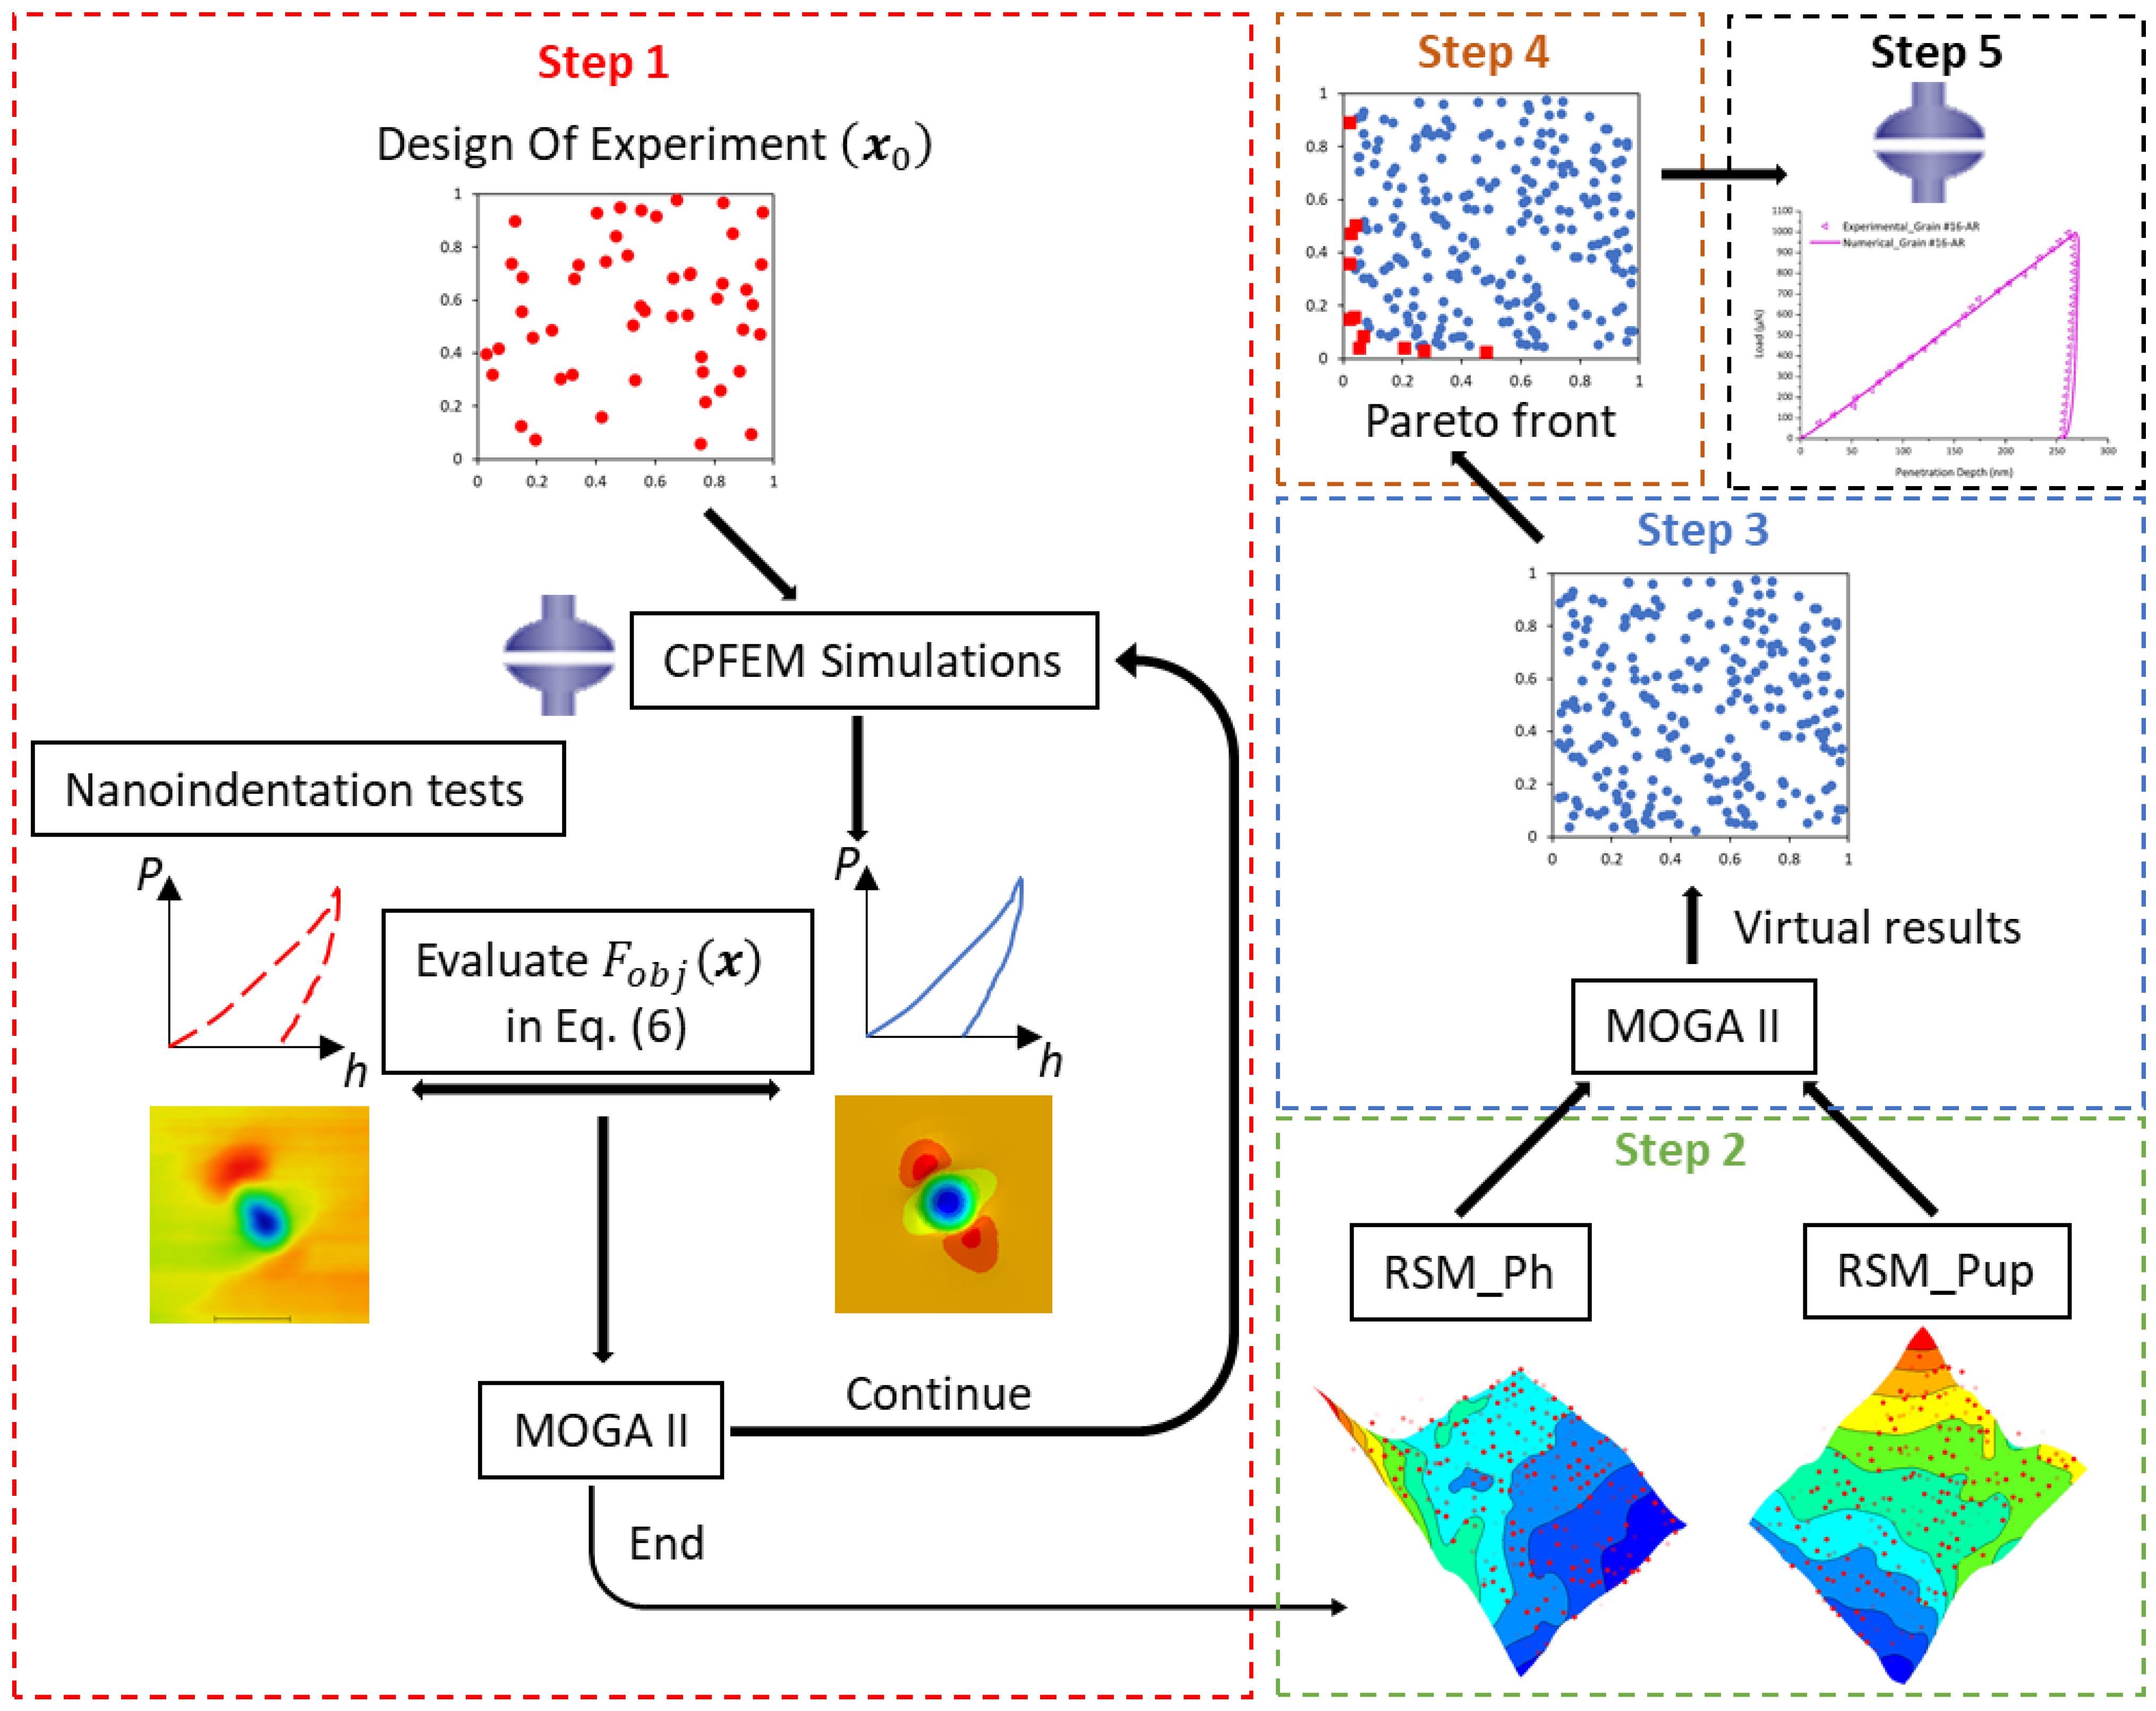
3.3. Inverse Identification Procedure of Crystal Plasticity Model Parameters
- Step 1: Develop an optimization strategy by coupling between a finite element analysis and optimization algorithm.
- Select and extract the experimental indentation data of the load-penetration depth curve and the penetration depth profile after unloading.
- Run the CPFEM simulation using ABAQUS software.
- Extract the load-penetration depth and penetration depth profile after unloading from the CPFEM results using Python script.
- Evaluate the objective function given by Equation (6).
- Update the set of crystal plasticity model parameters using the MOGA-II genetic algorithm.
- Repeat steps 2–5 until a large enough population is obtained from the MOGA-II genetic algorithm.
- Step 2: Build surrogate models.
- Step 3: Optimization process using metamodels.
- Step 4: Selection of the best designs.
- Step 5: Find the optimal solution.
4. Results
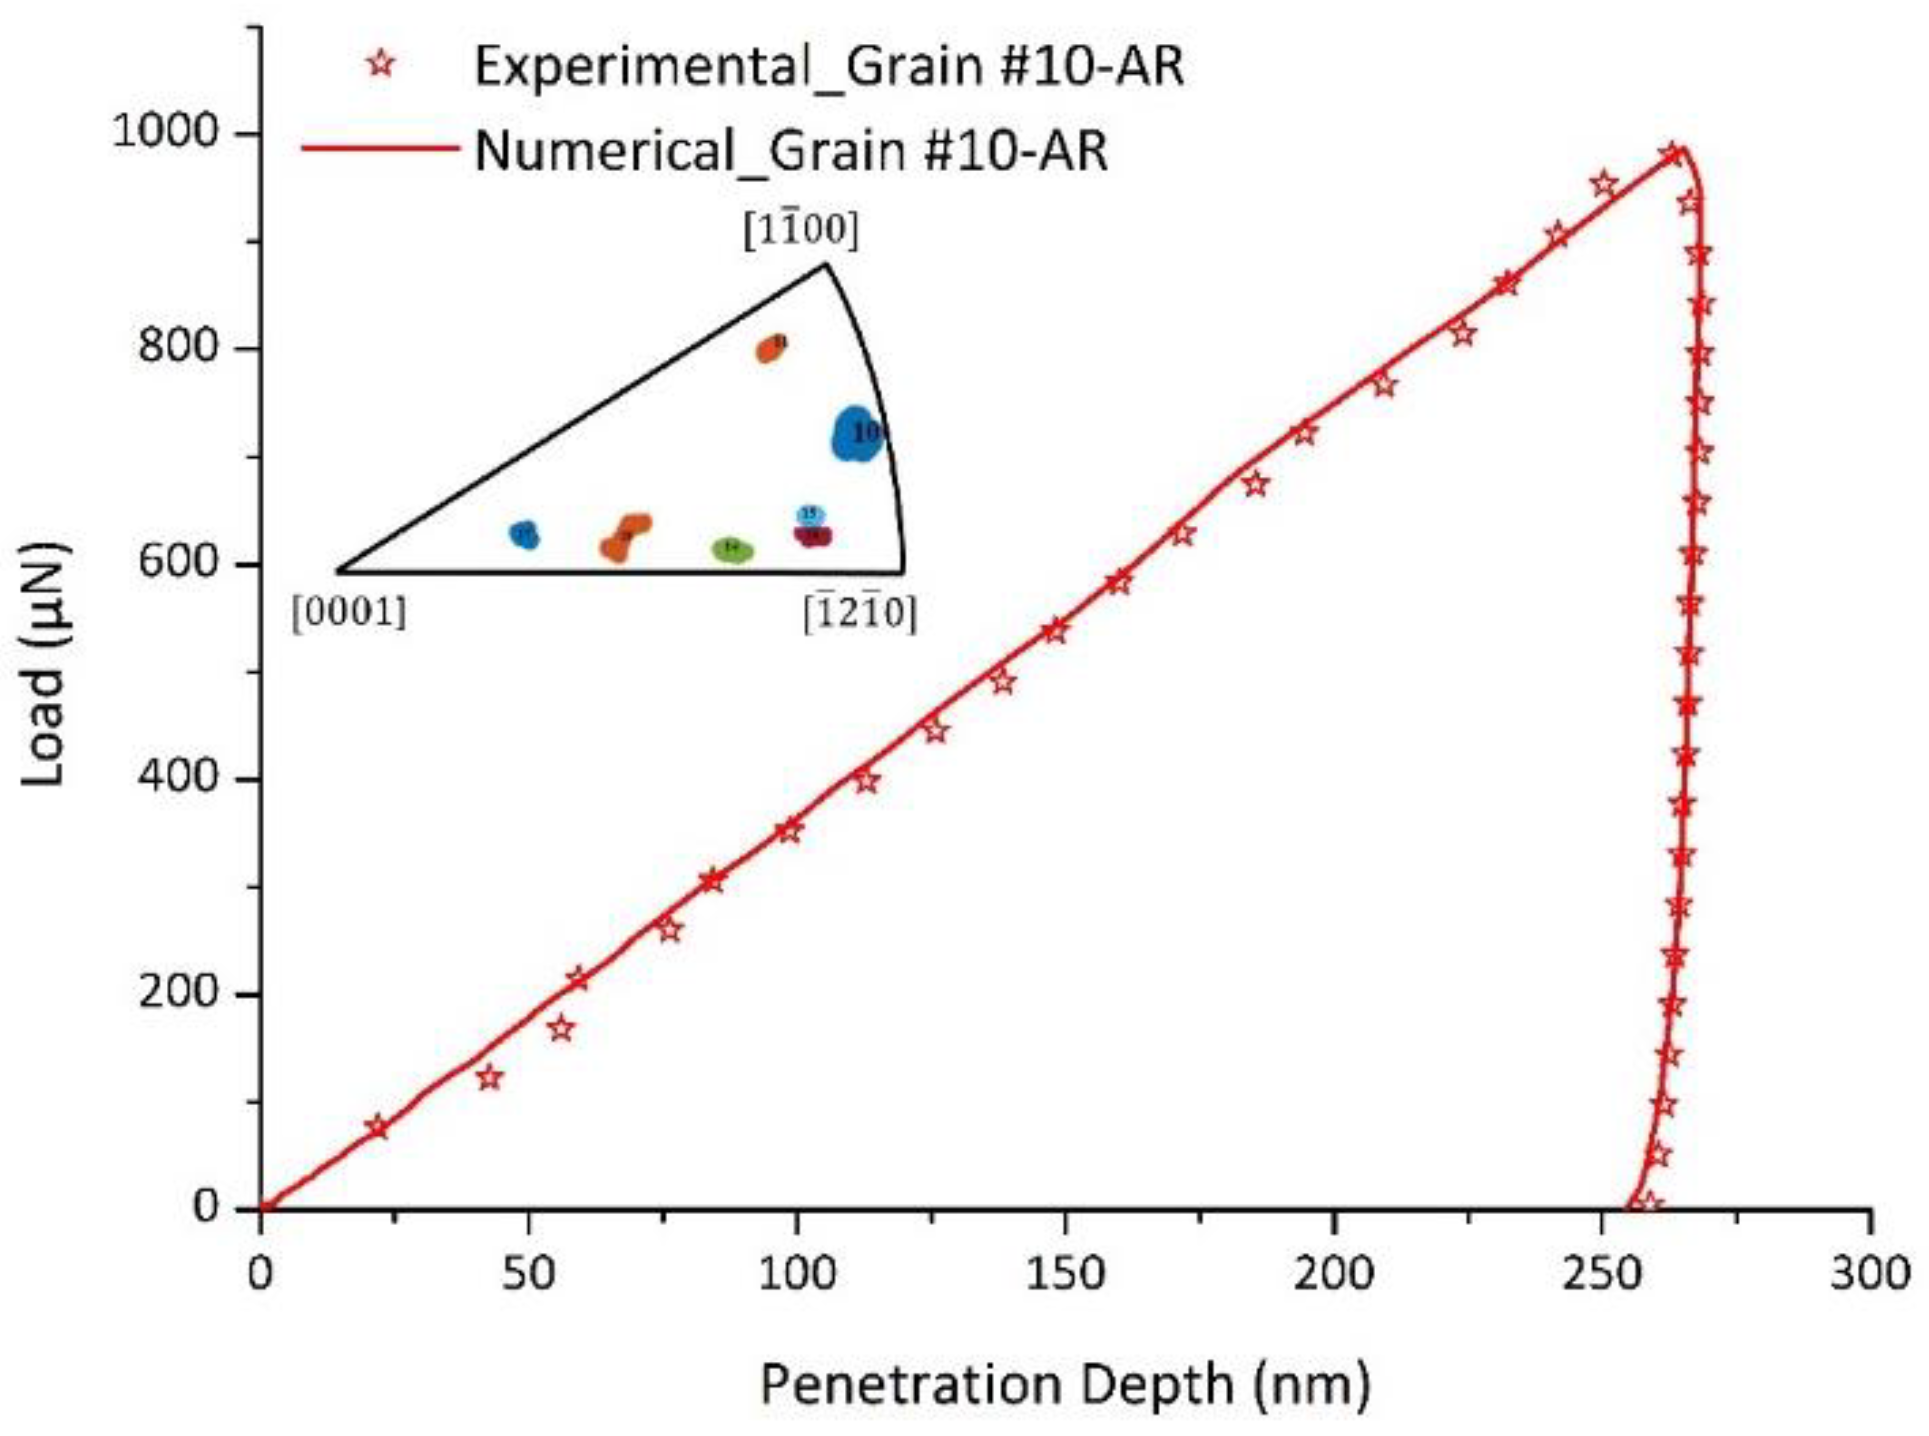
4.1. Results of Inverse Identification of Model Parameters
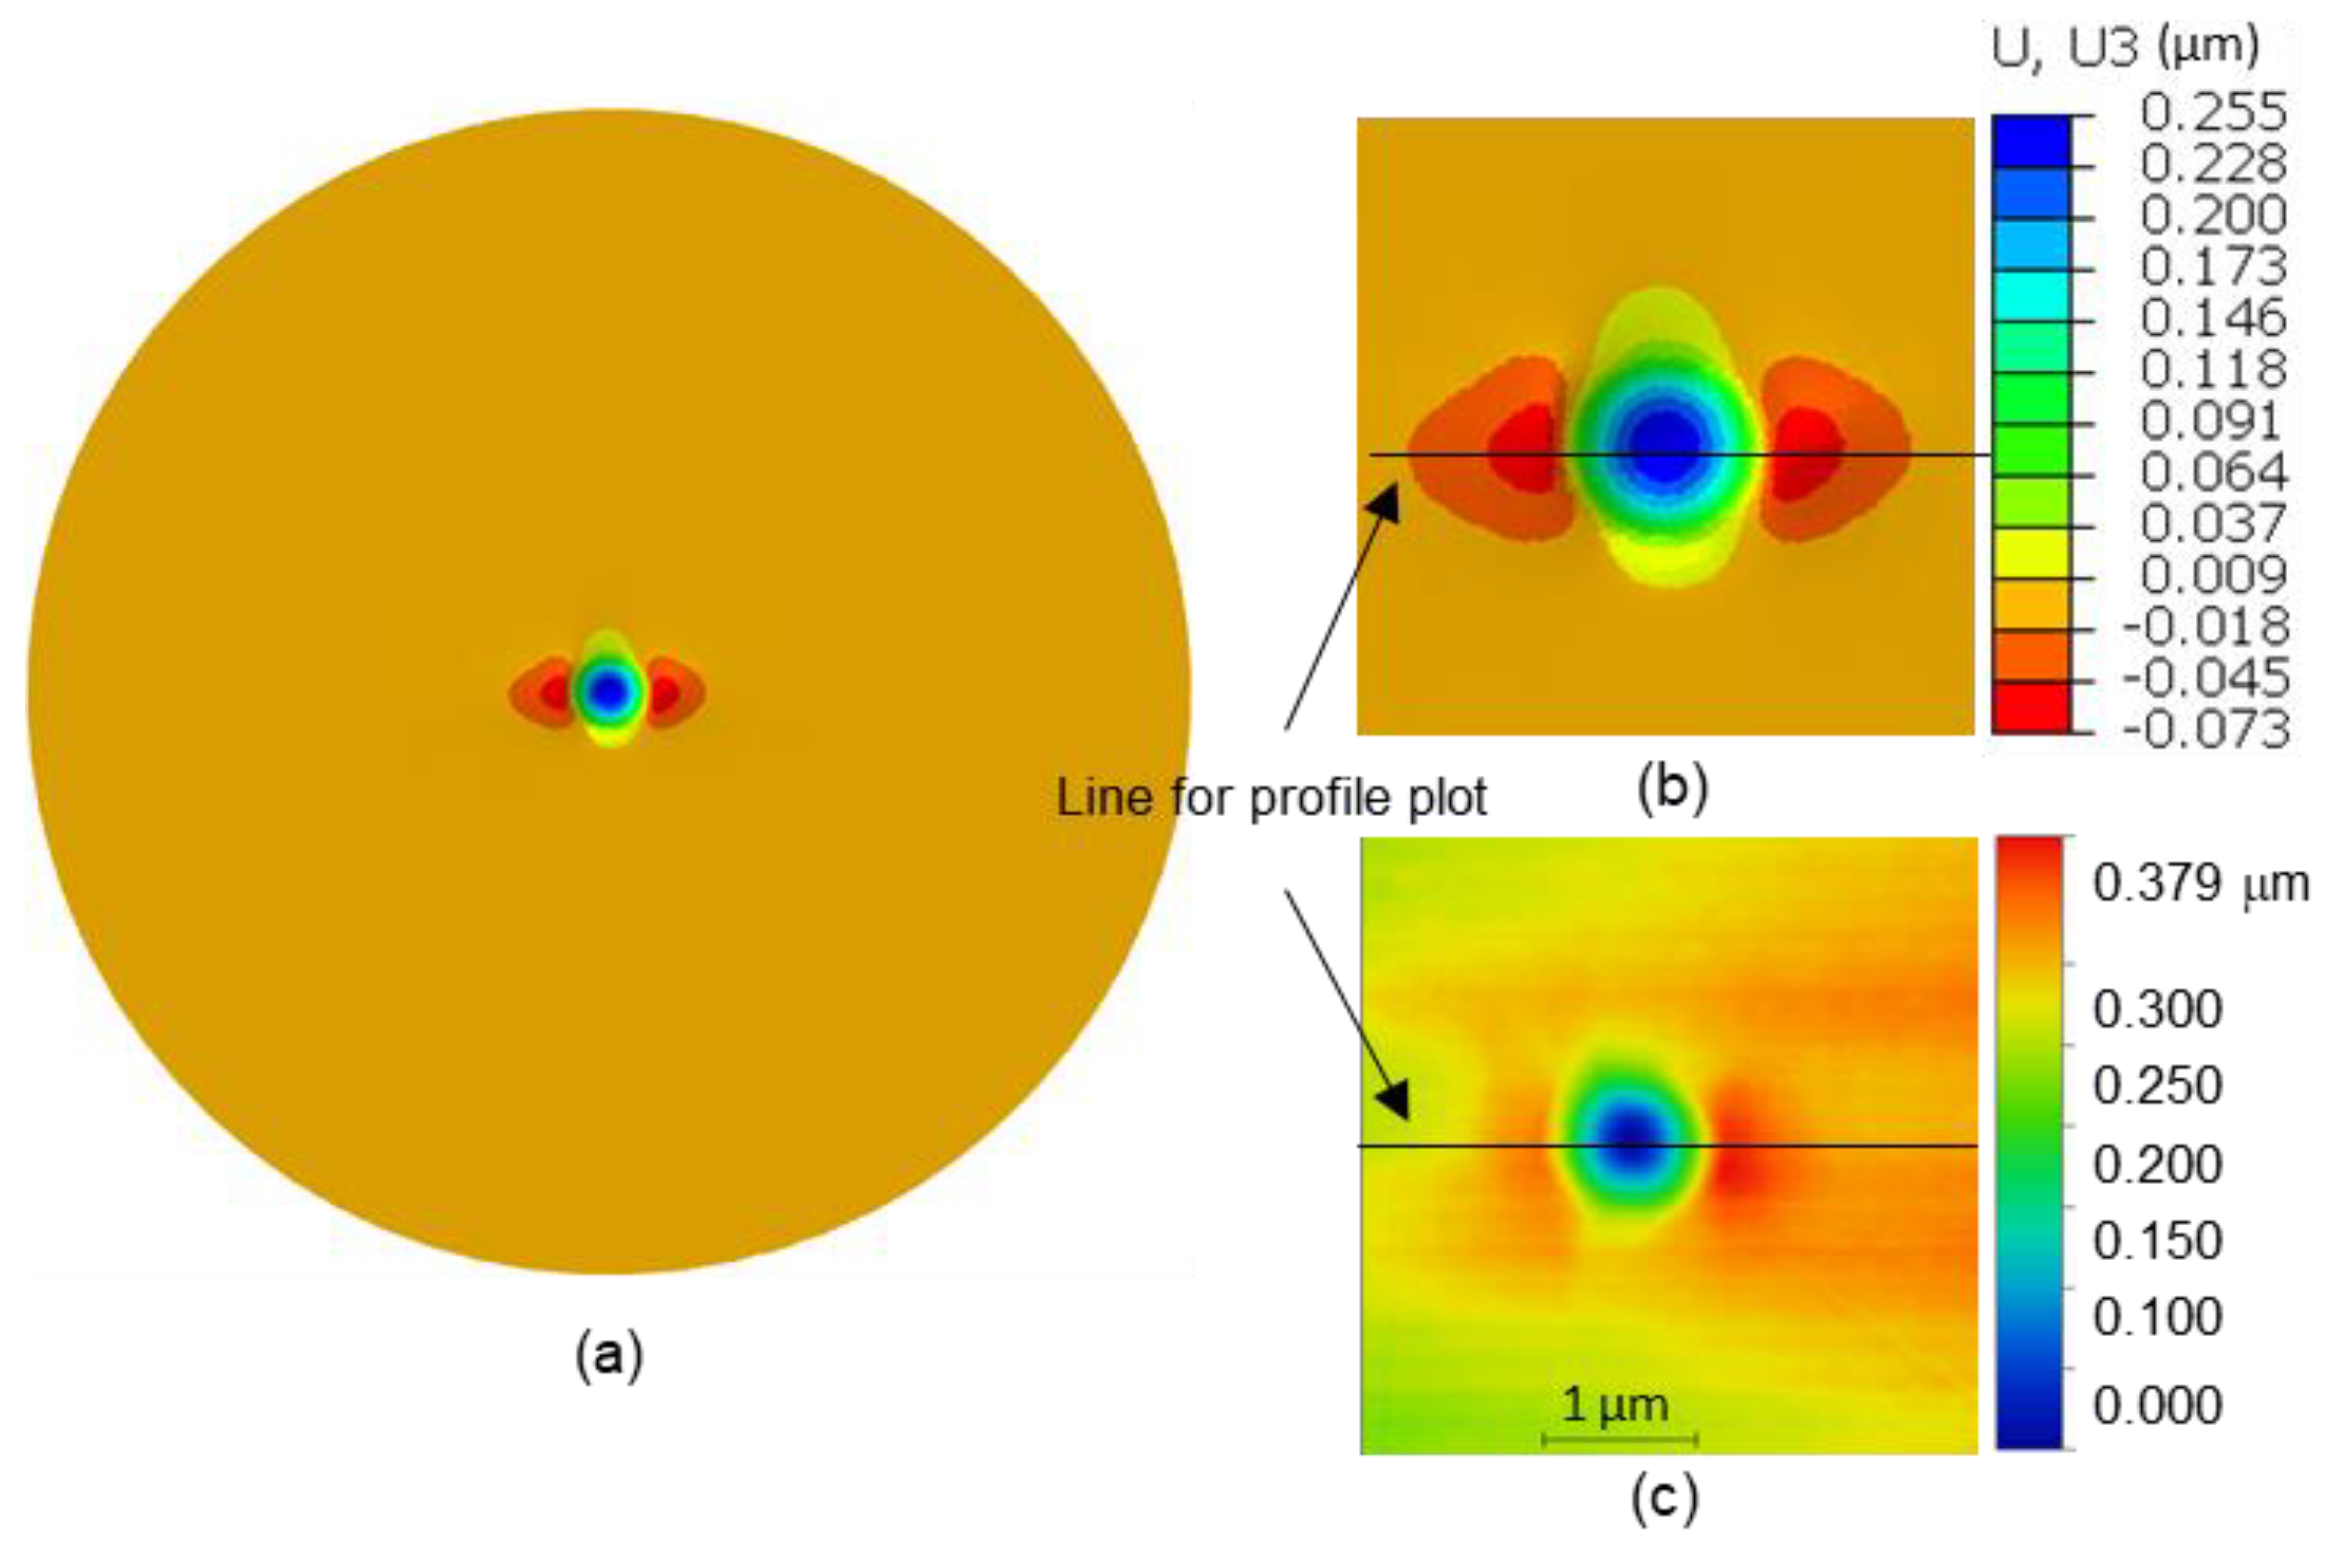
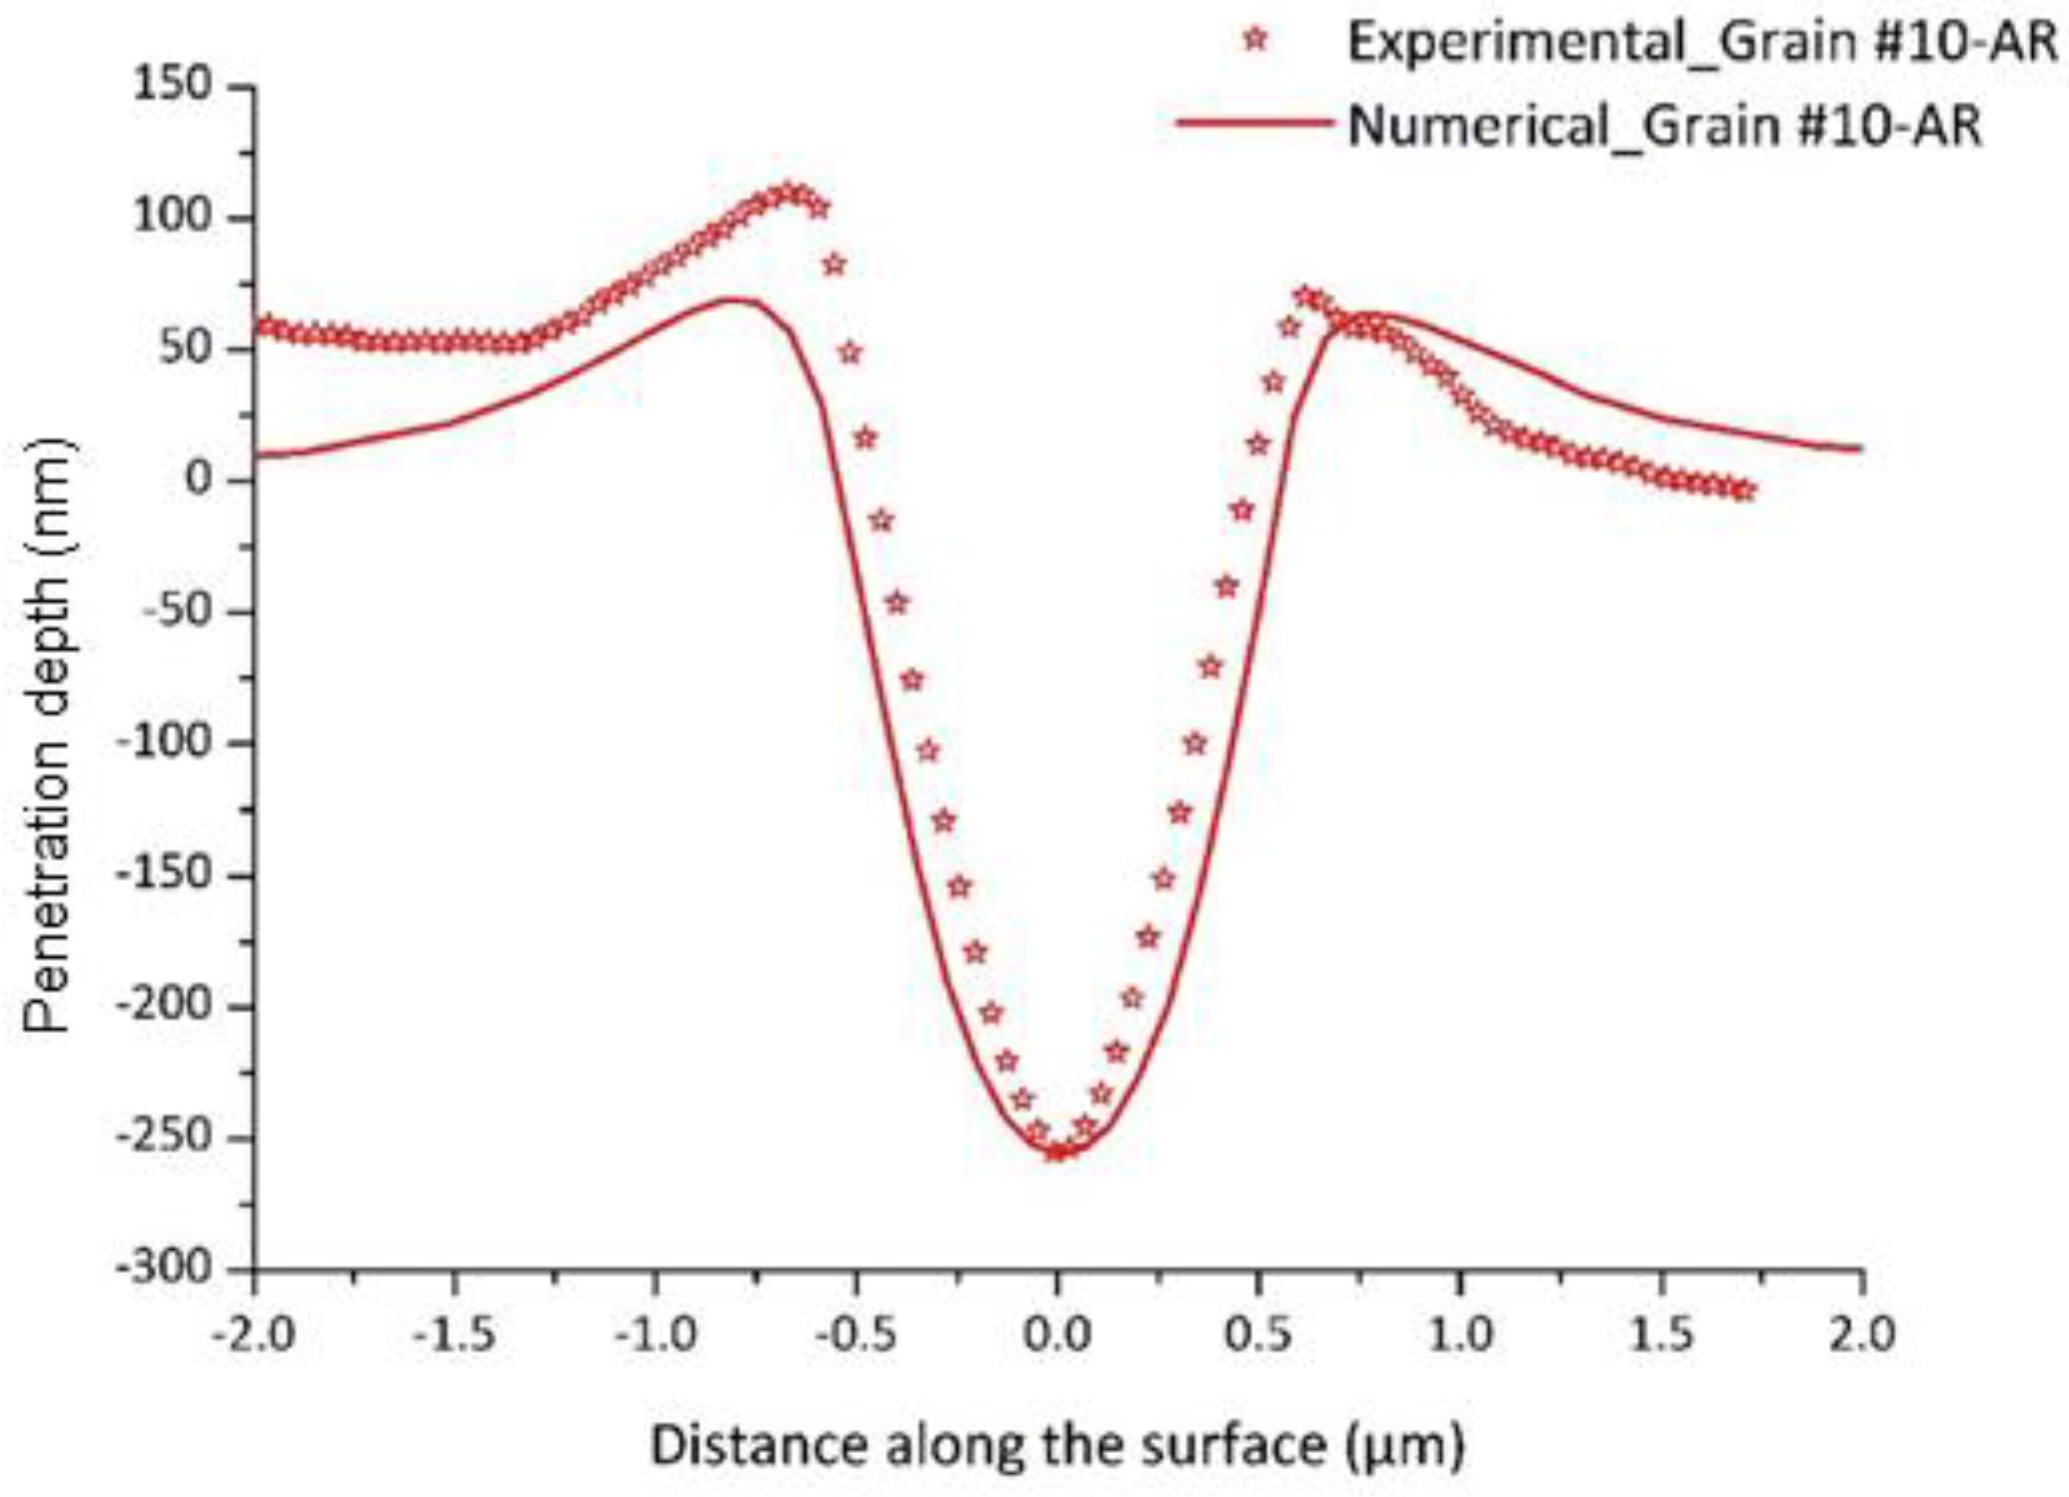
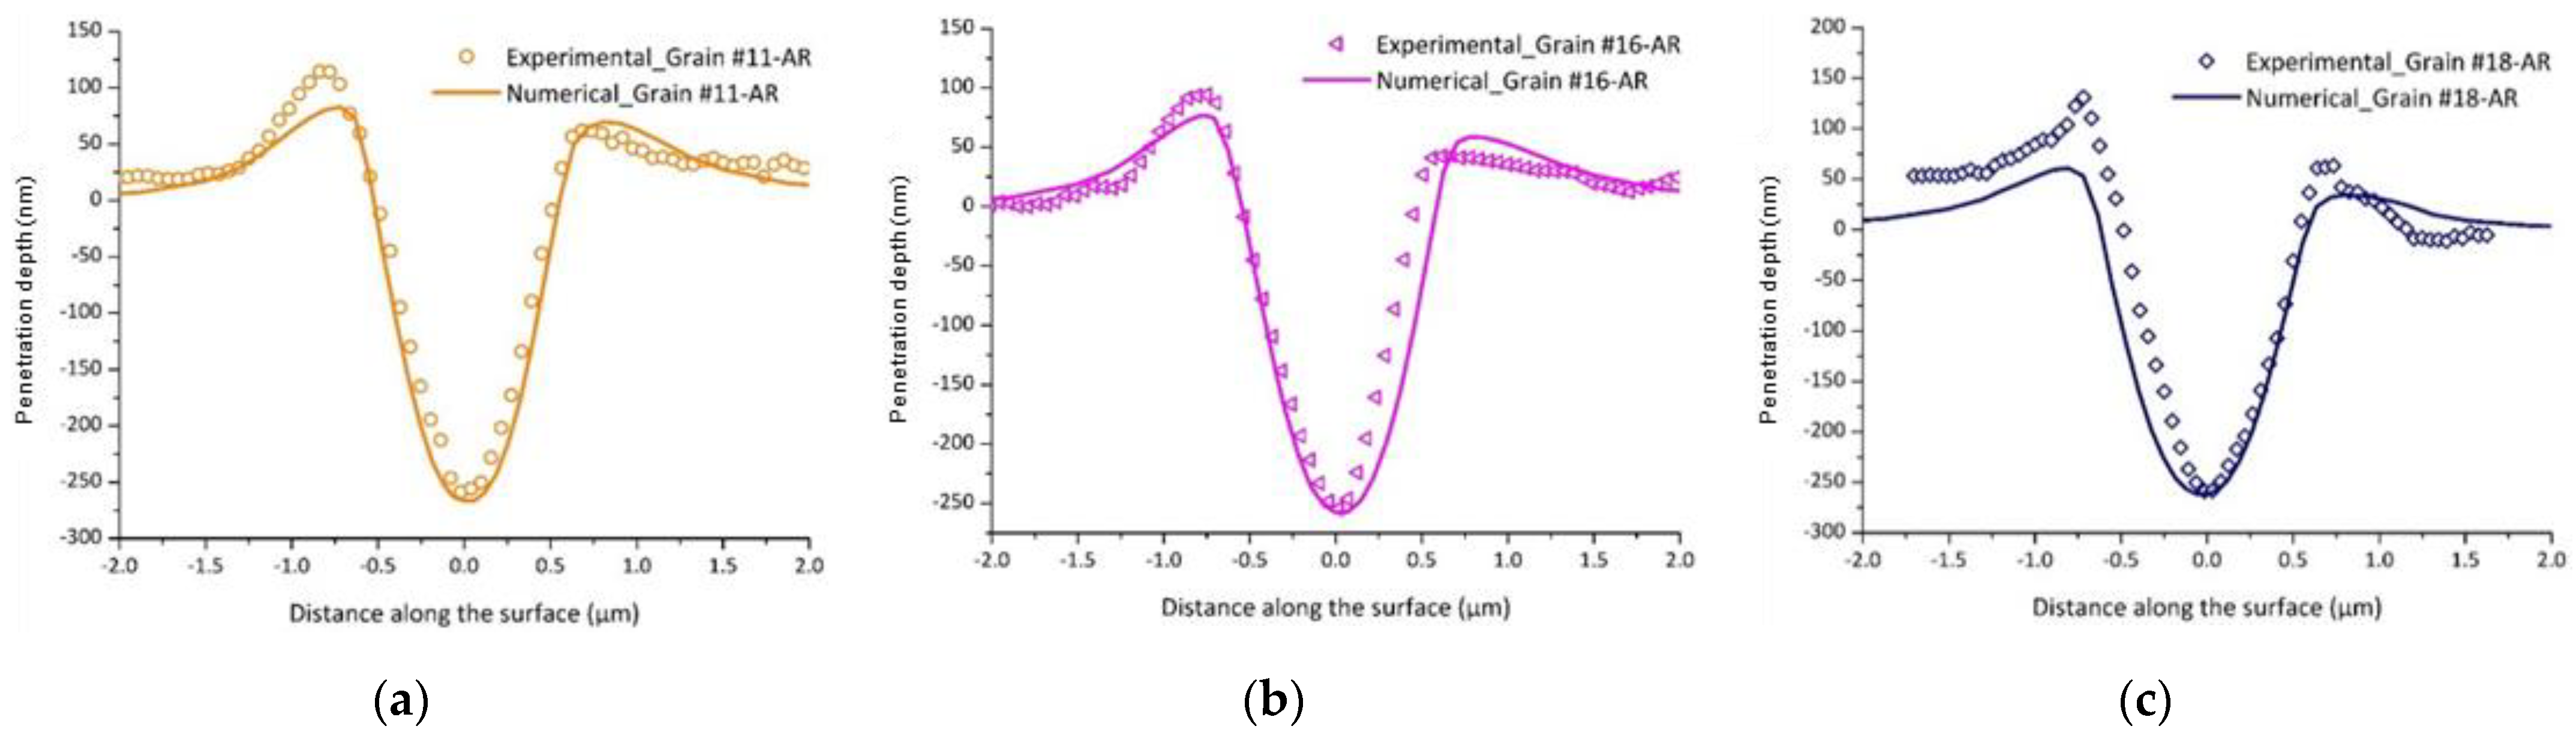
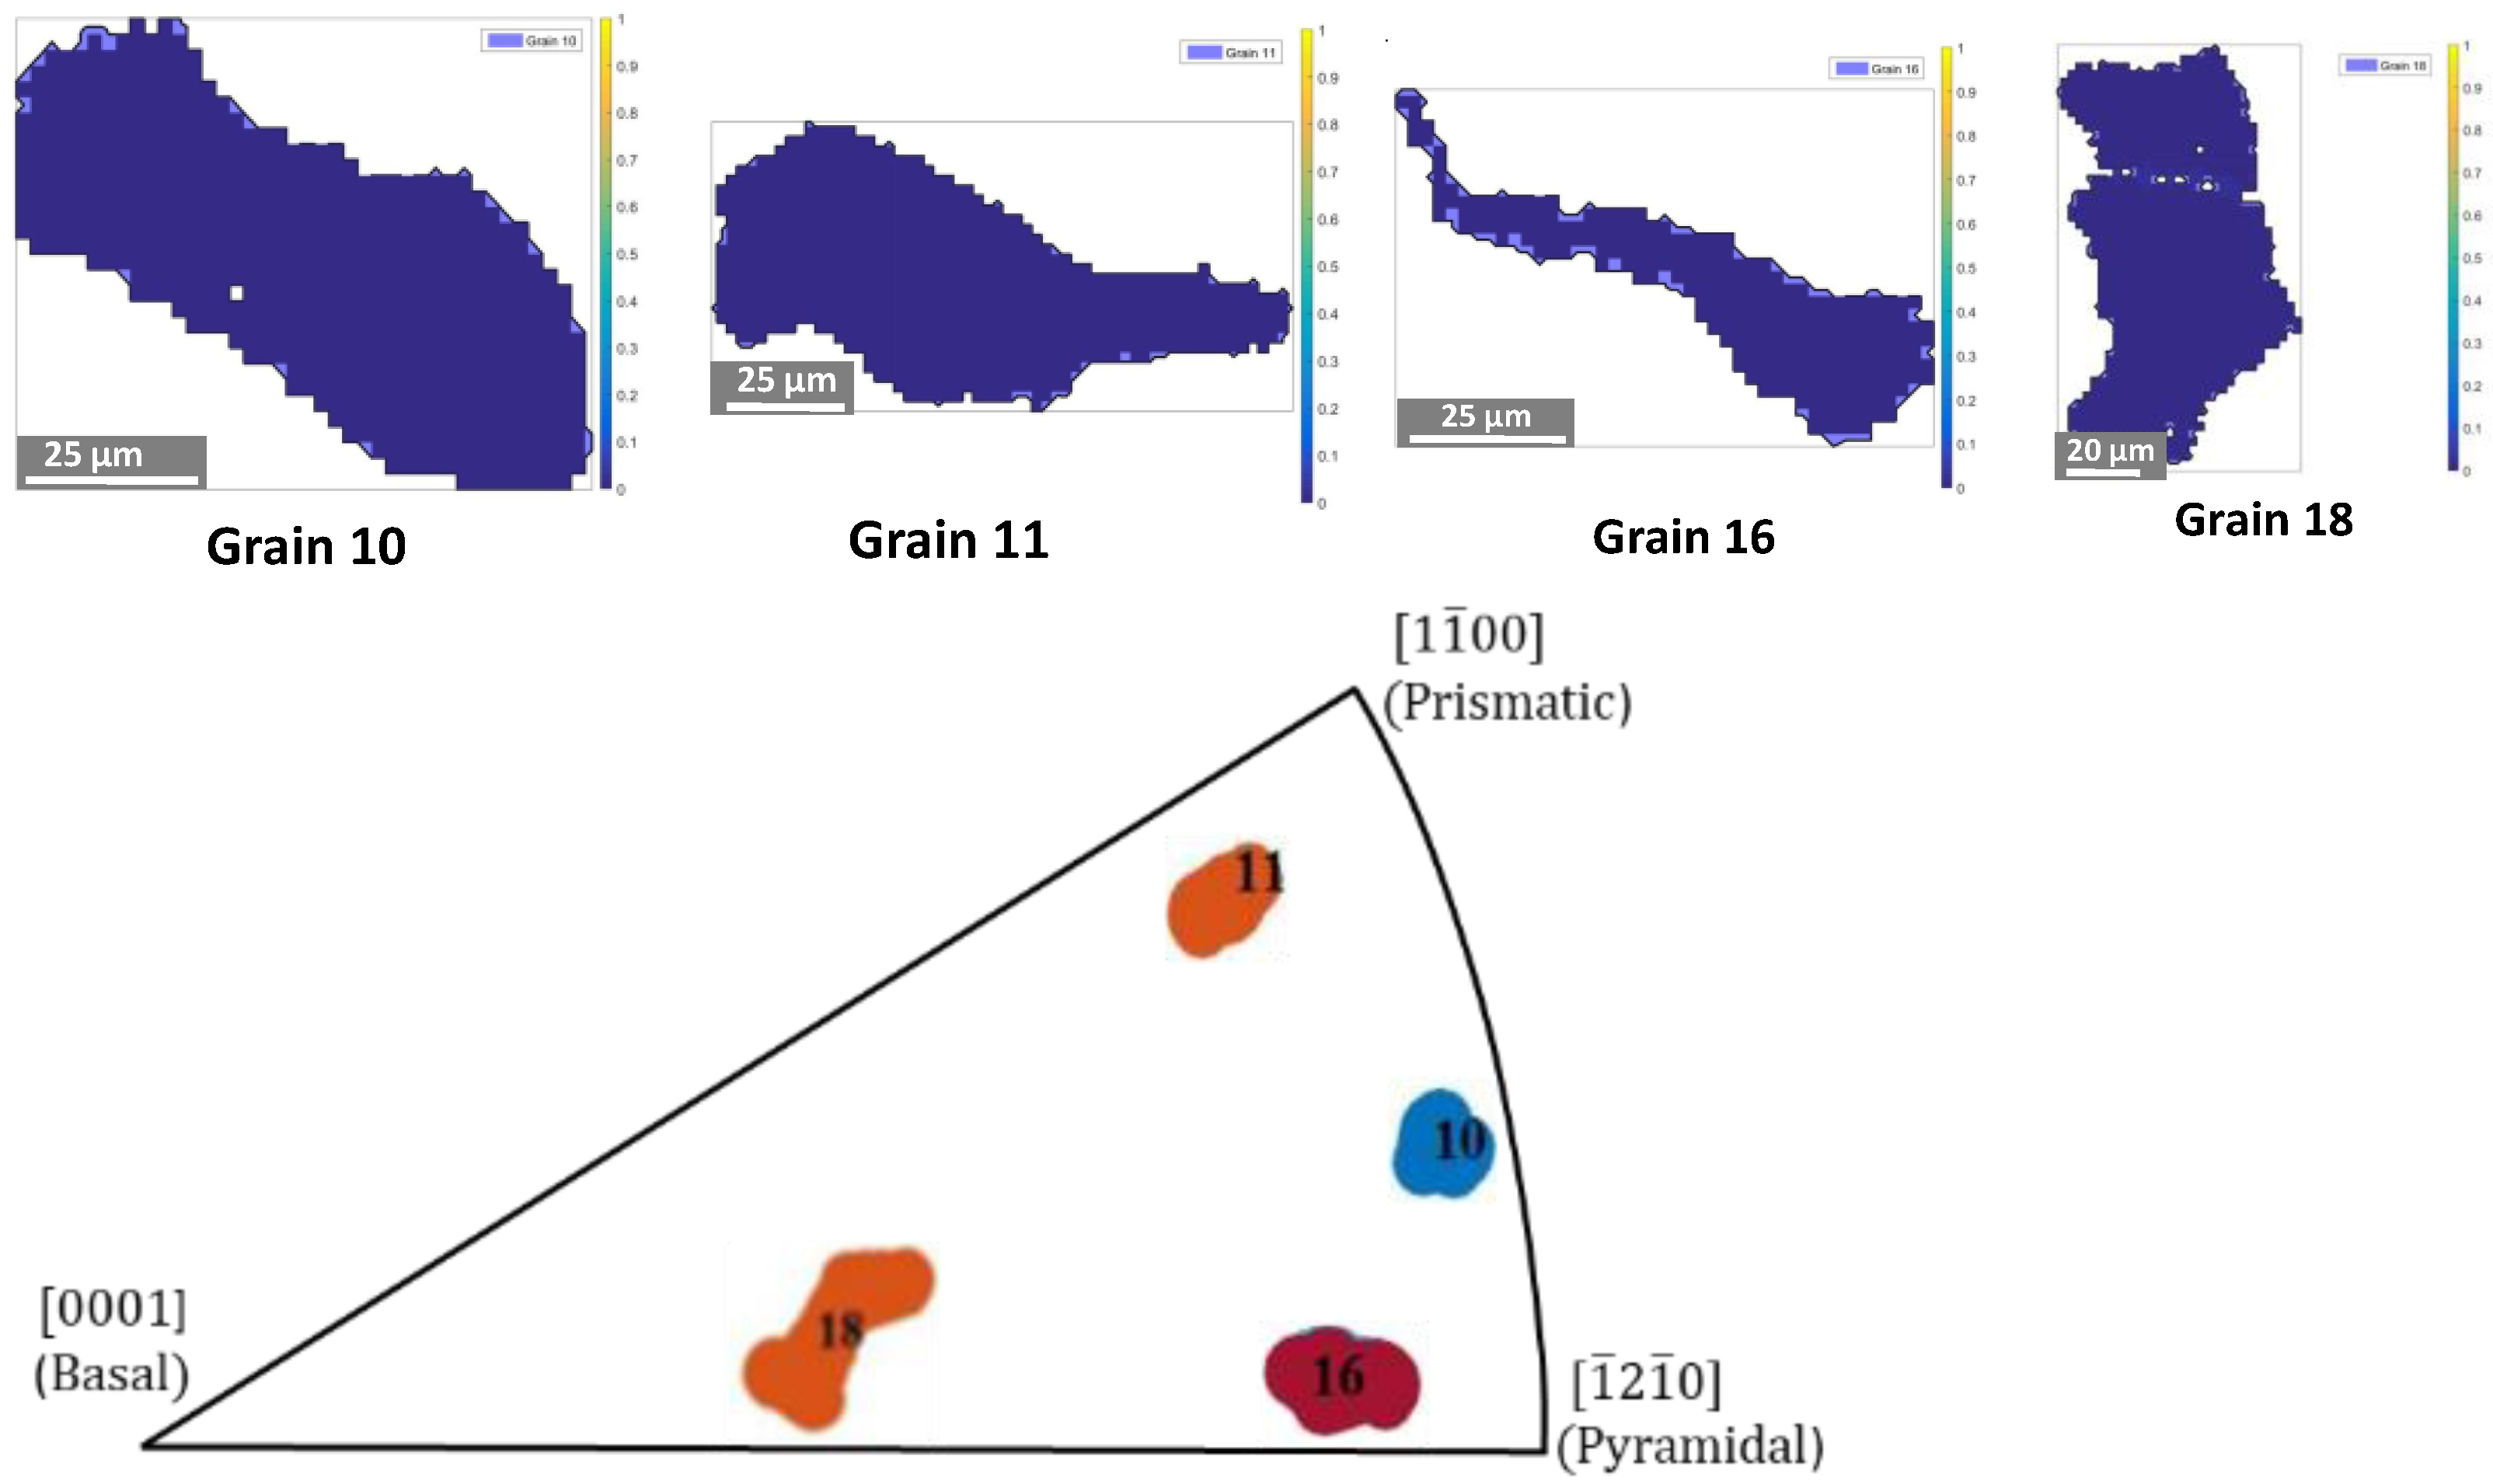
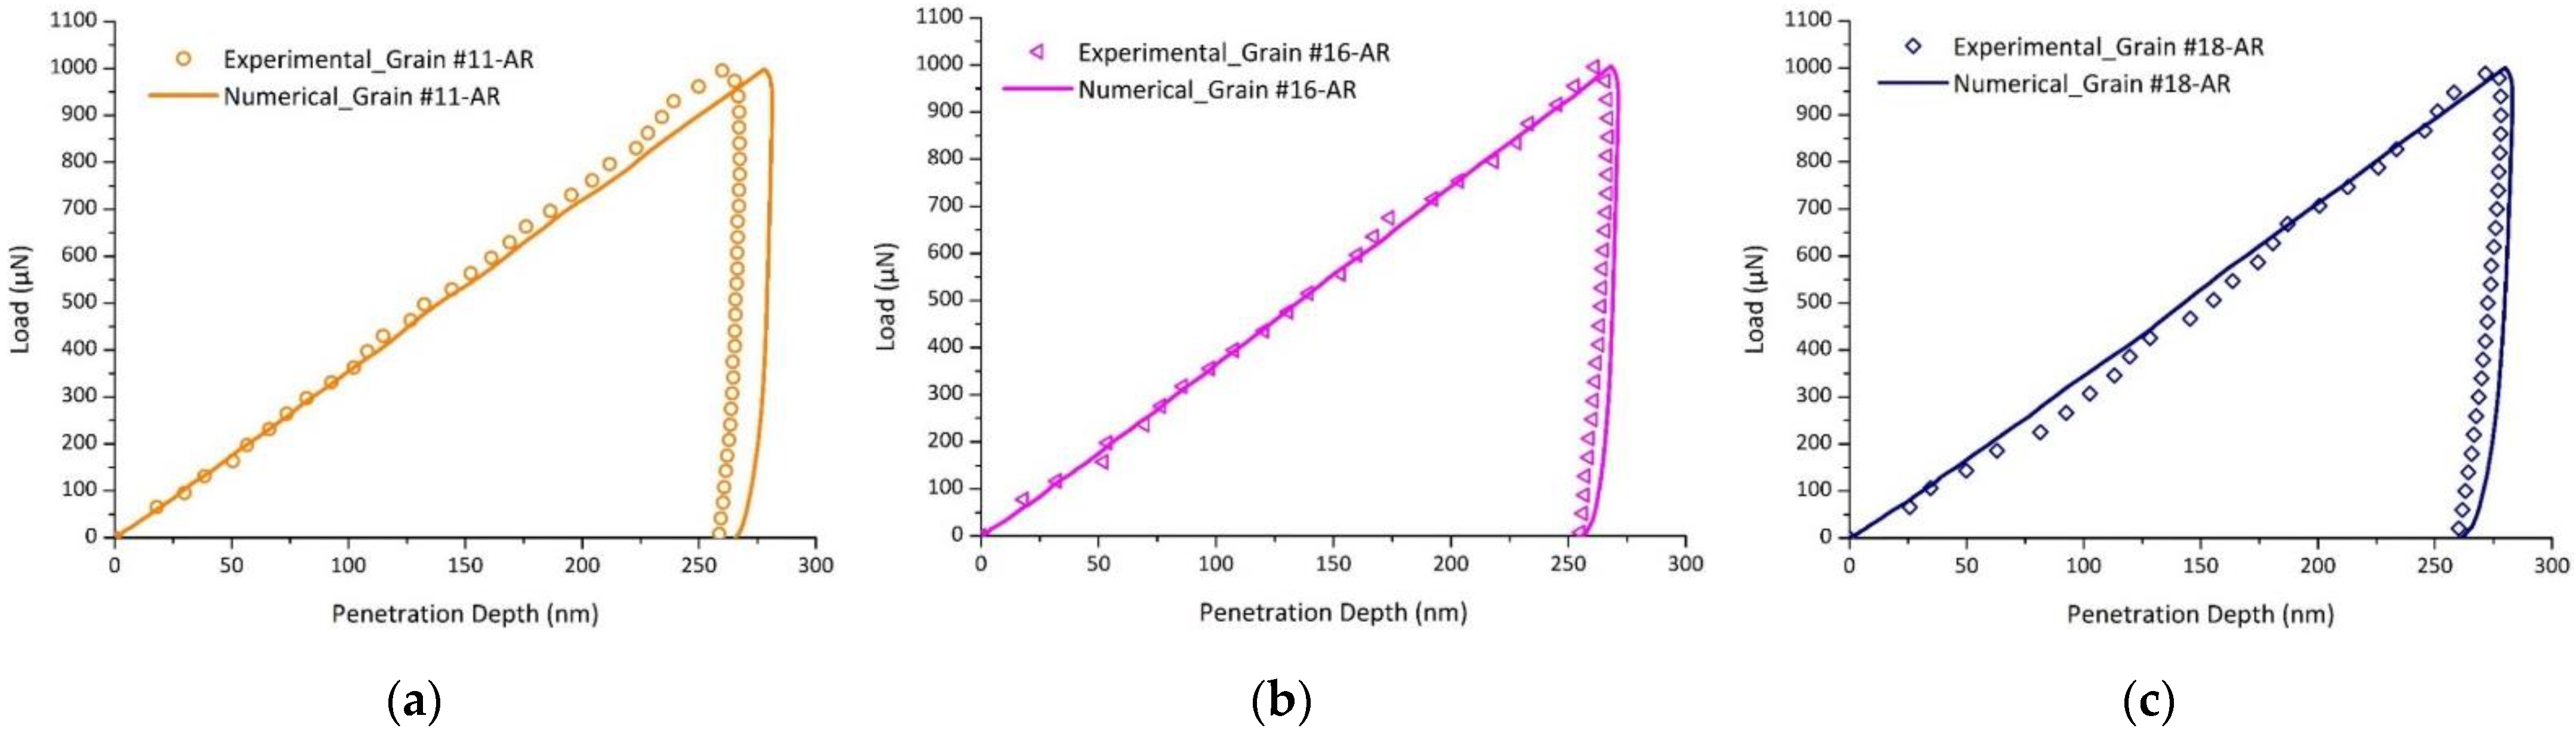
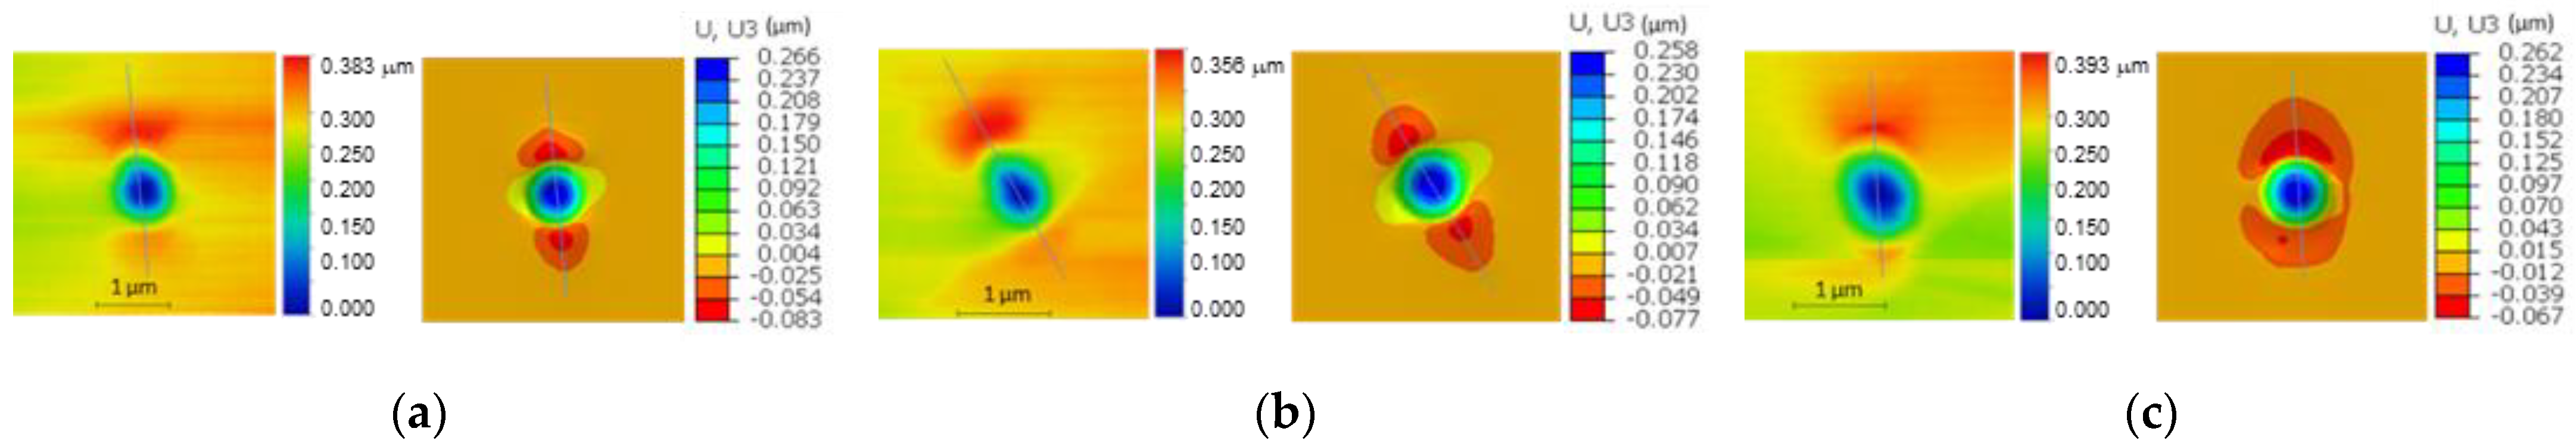
4.2. Validation of the Identified Model on Different Grain Orientations
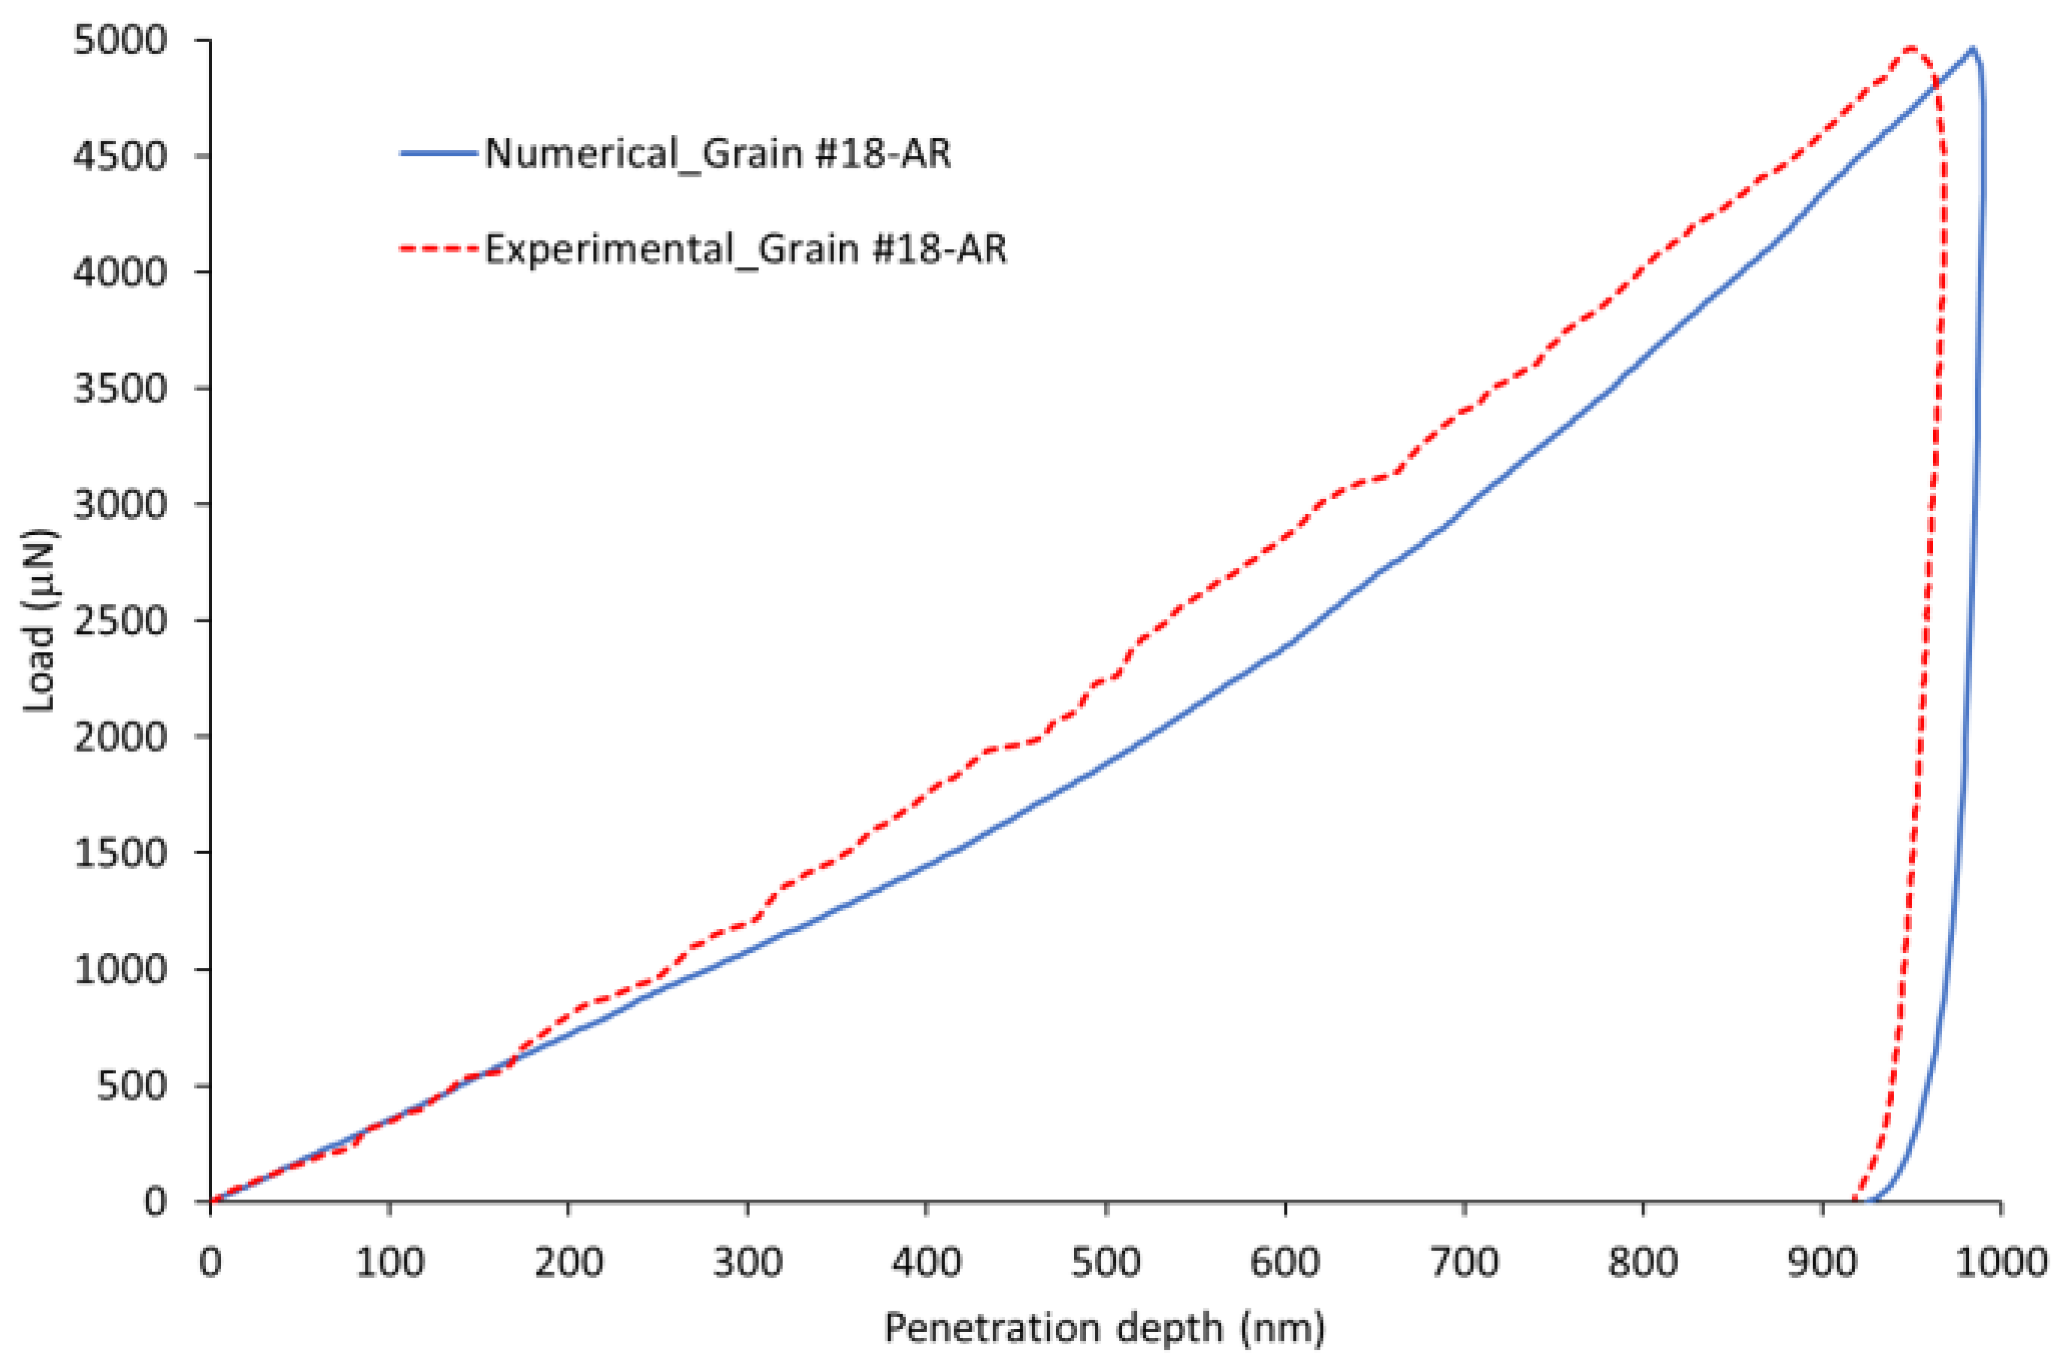
4.3. Validation of the Identified Model with a Higher Load Level
5. Discussion
5.1. Identifiability Results
5.2. Crystal Resolved Shear Stress (CRSS)
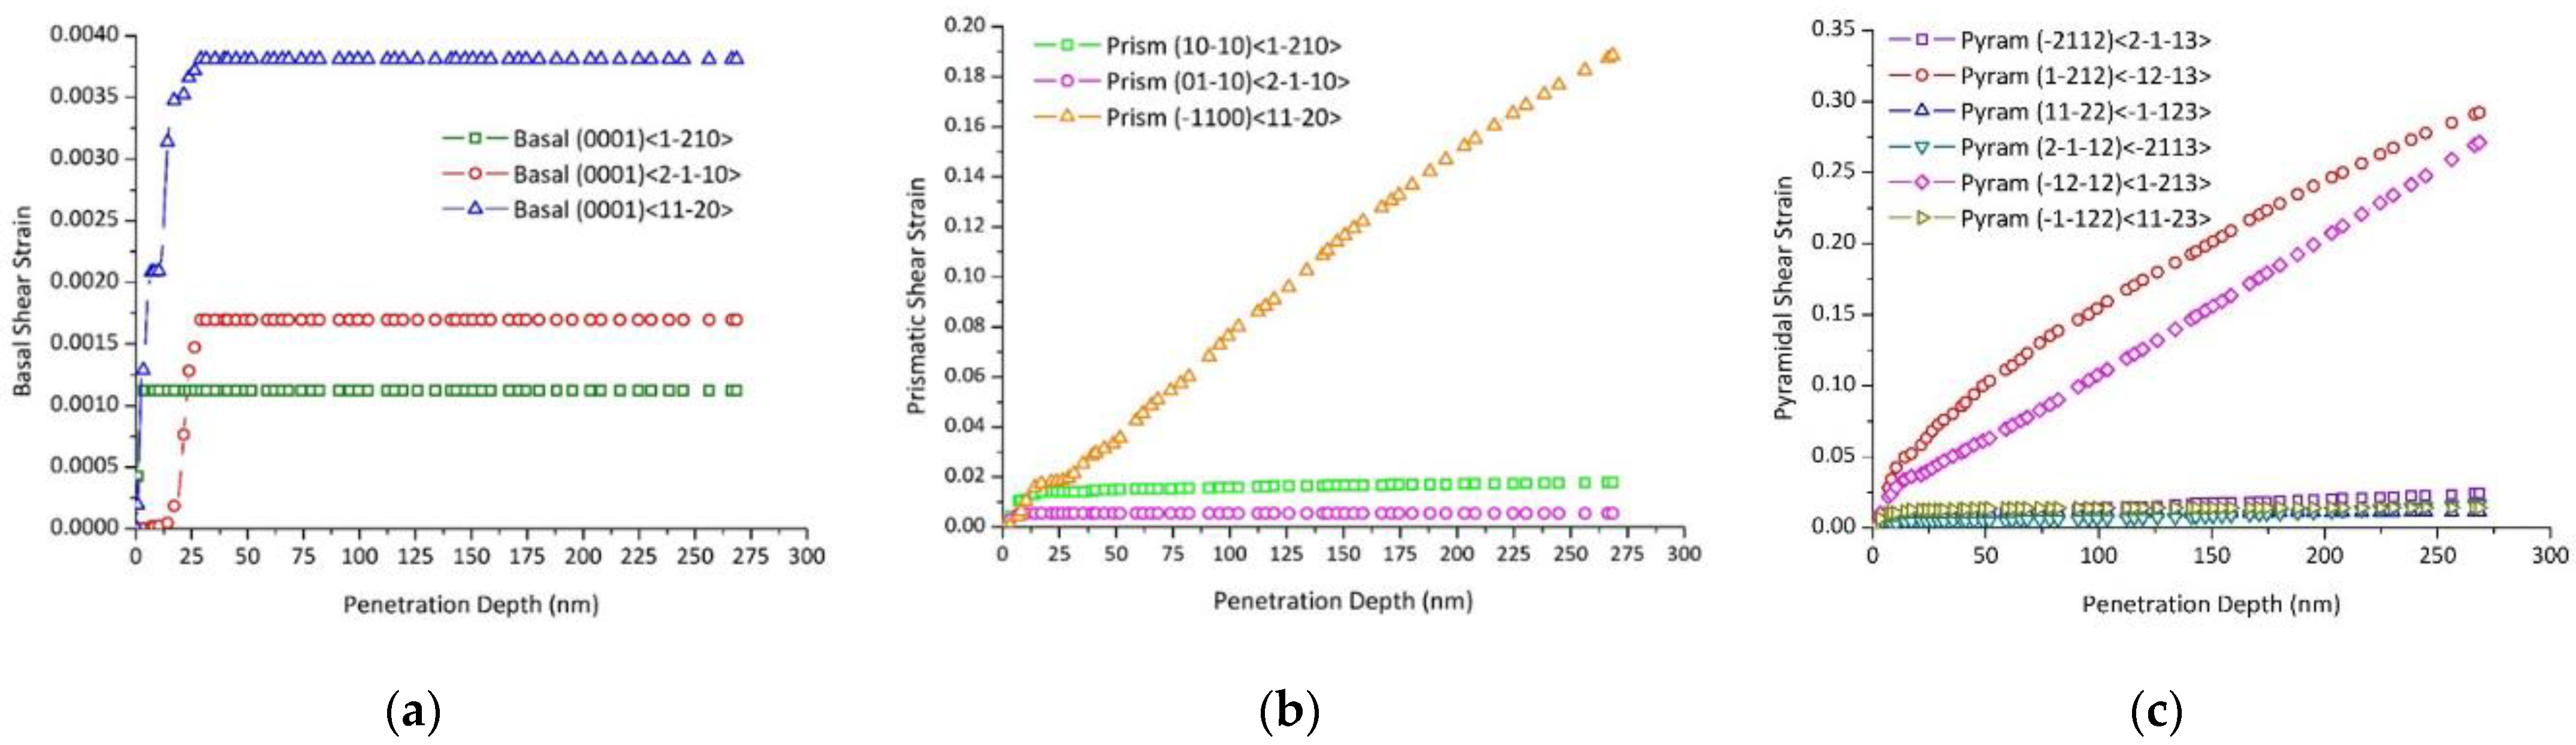
5.3. Grain Slip Activities
5.4. Orientation-Dependent Indent Topography
6. Conclusions
Author Contributions
Funding
Institutional Review Board Statement
Informed Consent Statement
Data Availability Statement
Conflicts of Interest
References
- Marder, A.R. The metallurgy of zinc-coated steel. Prog. Mater. Sci. 2000, 45, 191–271. [Google Scholar] [CrossRef]
- Diler, E.; Rouvellou, B.; Rioual, S.; Lescop, B.; Nguyen Vien, G.; Thierry, D. Characterization of corrosion products of Zn and Zn Mg–Al coated steel in a marine atmosphere. Corros. Sci. 2014, 87, 111–117. [Google Scholar] [CrossRef]
- Li, J.; Wang, Q.; Gao, N.; Nwokolo, I.K.; Zhang, W.; Ma, L.; Liu, F.; Han, E.-H. Interface Characteristics and Anticorrosion Performances of Cold Galvanizing Coatings Incorporated with γ-chloropropyl Triethoxysilane on Hot-Dip Galvanized Steel. Coatings 2021, 11, 402. [Google Scholar] [CrossRef]
- Liu, Y.W.; Wang, Z.Y.; Cao, G.W.; Cao, Y.; Huo, Y. Study on corrosion behavior of zinc exposed in coastal-industrial atmospheric environment. Mater. Chem. Phys. 2017, 198, 243–249. [Google Scholar] [CrossRef]
- Yuan, Y.; Liu, X.; Pu, G.; Wang, T.; Guo, Q. Corrosion features and time-dependent corrosion model of Galfan coating of high strength steel wires. Constr. Build. Mater. 2021, 313, 125534. [Google Scholar] [CrossRef]
- Khezrloo, A.; Rezazadeh, F.; Rajaee, M.; Tayebi, M.; Aghaie, E.; Behnamian, Y. Effect of coating parameters on microstructure, corrosion behavior, hardness and formability of hot-dip Galfan and galvanized coatings. Int. J. Mater. Res. 2021, 112, 321–332. [Google Scholar] [CrossRef]
- Zhang, X.; Odnevall Wallinder, I.; Leygraf, C. Atmospheric corrosion of Zn–Al coatings in a simulated automotive environment. Surf. Eng. 2018, 34, 641–648. [Google Scholar] [CrossRef]
- Bell, R.L.; Cahn, R.W. The Dynamics of Twinning and the Interrelation of Slip and Twinning in Zinc Crystals. Proc. R. Soc. A Math. Phys. Sci. 1957, 239, 494–521. [Google Scholar] [CrossRef]
- Antonopoulos, J.G.; Karakostas, T.; Komninou, P.; Delavignette, P. Dislocation Movements and Deformation Twinning in Zinc. Acta Metall. 1988, 36, 2493–2502. [Google Scholar] [CrossRef]
- Philippe, M.J.; Wagner, F.; Mellab, F.E.; Esling, C.; Wegria, J. Modelling of texture evolution for materials of hexagonal symmetry—I. Application to zinc alloys. Acta Metall. Et Mater. 1994, 42, 239–250. [Google Scholar] [CrossRef]
- Hagihara, K.; Mayama, T.; Honnami, M.; Yamasaki, M.; Izuno, H.; Okamoto, T.; Ohashi, T.; Nakano, T.; Kawamura, Y. Orientation dependence of the deformation kink band formation behavior in Zn single crystal. Int. J. Plast. 2016, 77, 174–191. [Google Scholar] [CrossRef]
- Cauvin, L.; Raghavan, B.; Bouvier, S.; Wang, X.; Meraghni, F. Multi-scale investigation of highly anisotropic zinc alloys using crystal plasticity and inverse analysis. Mater. Sci. Eng. A 2018, 729, 106–118. [Google Scholar] [CrossRef] [Green Version]
- Barendreght, J.A.; Sharpe, W.N. The effect of biaxial loading on the critical resolved shear stress of zinc single crystals. J. Mech. Phys. Solids 1973, 21, 113–123. [Google Scholar] [CrossRef]
- Fundenberger, J.J.; Philippe, M.J.; Wagner, F.; Esling, C. Modelling and prediction of mechanical properties for materials with hexagonal symmetry (zinc, titanium and zirconium alloys). Acta Mater. 1997, 45, 4041–4055. [Google Scholar] [CrossRef]
- Turner, P.A.; Tomé, C.N. A study of residual stresses in Zircaloy-2 with rod texture. Acta Metall. Mater. 1994, 42, 4143–4153. [Google Scholar] [CrossRef]
- Lebensohn, R.A.; Tomé, C.N. A self-consistent anisotropic approach for the simulation of plastic deformation and texture development of polycrystals: Application to zirconium alloys. Acta Metall. Et Mater. 1993, 41, 2611–2624. [Google Scholar] [CrossRef]
- Britton, T.B.; Liang, H.; Dunne, F.P.E.; Wilkinson, A.J. The effect of crystal orientation on the indentation response of commercially pure titanium: Experiments and simulations. Proc. R. Soc. A Math. Phys. Eng. Sci. 2010, 466, 695–719. [Google Scholar] [CrossRef] [Green Version]
- Zambaldi, C.; Yang, Y.; Bieler, T.; Raabe, D. Orientation informed nanoindentation of α-titanium: Indentation pileup in hexagonal metals deforming by prismatic slip. J. Mater. Res. 2012, 27, 356–367. [Google Scholar] [CrossRef]
- Mikułowski, B.; Boczkal, G. Zn-Ti Single Crystals Deformed along the Basal Slip System. Arch. Metall. Mater. 2009, 54, 197–203. [Google Scholar]
- Boczkal, G.; Mikułowski, B. Precipitation hardening of Zn0.1 at.%Ti single crystals deformed on the (0001)<11–20> system. J. Alloys Compd. 2004, 378, 135–139. [Google Scholar] [CrossRef]
- Harper, S.; Cottrell, A.H. Surface Effects and the Plasticity of Zinc Crystals. Proc. Phys. Soc. Sect. B 1950, 63, 331–338. [Google Scholar] [CrossRef]
- Edwards, E.H.; Washburn, J. Strain Hardening of Latent Slip Systems in Zinc Crystals. JOM 1954, 6, 1239–1242. [Google Scholar] [CrossRef]
- Adams, K.H.; Vreeland, T.; Wood, D.S. Basal Dislocation Mobility in Zinc Single Crystals. Mater. Sci. Eng. 1967, 2, 37–47. [Google Scholar] [CrossRef]
- Rogers, D.H.; Roberts, W.T. Plastic Anisotropy of Titanium and Zinc Sheet—II. Int. J. Mech. Sci. 1968, 10, 221–229. [Google Scholar] [CrossRef]
- Diot, M.; Fundenberger, J.J.; Philippe, M.J.; Esling, C.; Wegria, J. Texture gradient in rolled zinc sheets. Scr. Mater. 1998, 39, 1623–1630. [Google Scholar] [CrossRef]
- Zhang, F.; Vincent, G.; Sha, Y.H.; Zuo, L.; Fundenberger, J.J.; Esling, C. Experimental and Simulation Textures in an Asymmetrically Rolled Zinc Alloy Sheet. Scr. Mater. 2004, 50, 1011–1015. [Google Scholar] [CrossRef]
- Parisot, R.; Forest, S.; Gourgues, A.F.; Pineau, A.; Mareuse, D. Modeling the Mechanical Behavior of a Multicrystalline Zinc Coating on a Hot-Dip Galvanized Steel Sheet. Comput. Mater. Sci. 2000, 19, 189–204. [Google Scholar] [CrossRef]
- Parisot, R.; Forest, S.; Pineau, A.; Grillon, F.; Demonet, X.; Mataigne, J.M. Deformation and Damage Mechanisms of Zinc Coatings on Hot-Dip Galvanized Steel Sheets: Part I. Deformation Modes. Metall. Mater. Trans. A 2004, 35, 797–811. [Google Scholar] [CrossRef]
- Vincent, G.; Zhang, F.; Fundenberger, J.J.; Esling, C. Experimental and Simulation Textures in an Asymmetrically Skin-Passed Zinc Galvanized Sheet. Scr. Mater. 2005, 53, 775–779. [Google Scholar] [CrossRef]
- Borodachenkova, M.; Wen, W.; Barlat, F.; Pereira, A.; Grácio, J. Modeling of the Mechanical Behavior and Texture Evolution in Zn Alloys during Reverse Shear Loading. J. Mater. Process. Technol. 2015, 224, 143–148. [Google Scholar] [CrossRef]
- Peirce, D.; Asaro, R.J.; Needleman, A. Material Rate Dependence and Localized Deformation in Crystalline Solids. Acta Metall. 1983, 31, 1951–1976. [Google Scholar] [CrossRef]
- Stofel, E.J. Plastic Flow and Fracture of Zinc Single Crystals. Ph.D. Thesis, California Institute of Technology, Pasadena, CA, USA, 1962. [Google Scholar] [CrossRef]
- Bosin, M.E.; Lavrentev, F.F.; Nikiforenko, V.N. Nonlinearity and Localization of Plastic Deformation in Zn Single Crystals with Forest Dislocation. Mater. Sci. Eng. A 1998, 252, 288–291. [Google Scholar] [CrossRef]
- Solas, D.E.; Tome, C.N.; Engler, O.; Wenk, H.R. Deformation and Recrystallization of Hexagonal Metals: Modeling and Experimental Results for Zinc. Acta Mater. 2001, 49, 3791–3801. [Google Scholar] [CrossRef]
- Lassila, D.H.; Leblanc, M.M.; Florando, J.N. Zinc Single Crystal Deformation Experiments Using a 6 Degrees of Freedom Apparatus. Metall. Mater. Trans. A 2007, 38, 2024–2032. [Google Scholar] [CrossRef] [Green Version]
- Casals, O.; Forest, S. Finite Element Crystal Plasticity Analysis of Spherical Indentation in Bulk Single Crystals and Coatings. Comput. Mater. Sci. 2009, 45, 774–782. [Google Scholar] [CrossRef]
- Zhu, W.; Hughes, J.J.; Bicanic, N.; Pearce, C.J. Nanoindentation Mapping of Mechanical Properties of Cement Paste and Natural Rocks. Mater. Charact. 2007, 58, 1189–1198. [Google Scholar] [CrossRef]
- Hu, C.; Li, Z. A Review on the Mechanical Properties of Cement-Based Materials Measured by Nanoindentation. Constr. Build. Mater. 2015, 90, 80–90. [Google Scholar] [CrossRef]
- Abbès, F.; Abbès, B.; Benkbou, R.; Asroun, A. A FEM Multiscale Homogenization Procedure using Nanoindentation for High Performance Concrete. J. Appl. Comput. Mech. 2020, 6, 493–504. [Google Scholar] [CrossRef]
- Li, H.; Vlassak, J.J. Determining the Elastic Modulus and Hardness of an Ultra-Thin Film on a Substrate Using Nanoindentation. J. Mater. Res. 2009, 24, 1114–1126. [Google Scholar] [CrossRef] [Green Version]
- Esqué-de los Ojos, D.; Očenášek, J.; Alcalá, J. Sharp indentation crystal plasticity finite element simulations: Assessment of crystallographic anisotropy effects on the mechanical response of thin FCC single crystalline films. Comput. Mater. Sci. 2014, 86, 186–192. [Google Scholar] [CrossRef]
- Jian, S.R.; Lee, Y.H. Nanoindentation-induced interfacial fracture of ZnO thin films deposited on Si (1 1 1) substrates by atomic layer deposition. J. Alloys Compd. 2014, 587, 313–317. [Google Scholar] [CrossRef]
- Li, X.; Bhushan, B.; Takashima, K.; Baek, C.W.; Kim, Y.K. Mechanical characterization of micro/nanoscale structures for MEMS/NEMS applications using nanoindentation techniques. Ultramicroscopy 2003, 97, 481–494. [Google Scholar] [CrossRef]
- Kim, J.H.; Yeon, S.C.; Jeon, Y.K.; Kim, J.G.; Kim, Y.H. Nano-indentation method for the measurement of the Poisson’s ratio of MEMS thin films. Sens. Actuators A Phys. 2003, 108, 20–27. [Google Scholar] [CrossRef]
- Palacio, M.L.; Bhushan, B. Depth-sensing indentation of nanomaterials and nanostructures. Mater. Charact. 2013, 78, 1–20. [Google Scholar] [CrossRef]
- Chiu, Y.L.; Ngan, A.H.W. Time-dependent characteristics of incipient plasticity in nanoindentation of a Ni3Al single crystal. Acta Mater. 2002, 50, 1599–1611. [Google Scholar] [CrossRef]
- Wang, Y.; Raabe, D.; Klüber, C.; Roters, F. Orientation dependence of nanoindentation pile-up patterns and of nanoindentation microtextures in copper single crystals. Acta Mater. 2004, 52, 2229–2238. [Google Scholar] [CrossRef] [Green Version]
- Liu, M.; Lin, J.Y.; Lu, C.; Tieu, K.A.; Zhou, K.; Koseki, T. Progress in indentation study of materials via both experimental and numerical methods. Crystals 2017, 7, 258. [Google Scholar] [CrossRef]
- Oliver, W.C.; Pharr, G.M. An Improved Technique for Determining Hardness and Elastic Modulus Using Load and Displacement Sensing Indentation Experiments. J. Mater. Res. 1992, 7, 1564–1583. [Google Scholar] [CrossRef]
- Campbell, J.E.; Thompson, R.P.; Dean, J.; Clyne, T.W. Experimental and computational issues for automated extraction of plasticity parameters from spherical indentation. Mech. Mater. 2018, 124, 118–131. [Google Scholar] [CrossRef]
- Li, Y.G.; Kanouté, P.; François, M.; Chen, D.; Wang, H.W. Inverse identification of constitutive parameters with instrumented indentation test considering the normalized loading and unloading P-h curves. Int. J. Solids Struct. 2019, 156–157, 163–178. [Google Scholar] [CrossRef]
- Pöhl, F. Determination of unique plastic properties from sharp indentation. Int. J. Solids Struct. 2019, 171, 174–180. [Google Scholar] [CrossRef]
- Long, X.; Jia, Q.P.; Li, Z.; Wen, S.X. Reverse analysis of constitutive properties of sintered silver particles from nanoindentations. Int. J. Solids Struct. 2020, 191–192, 351–362. [Google Scholar] [CrossRef]
- Long, X.; Jia, Q.P.; Shen, Z.; Liu, M.; Guan, C. Strain rate shift for constitutive behaviour of sintered silver nanoparticles under nanoindentation. Mech. Mater. 2021, 158, 103881. [Google Scholar] [CrossRef]
- Nguyen, N.P.T.; Abbès, F.; Abbès, B.; Li, Y. Orientation-dependent response of pure zinc grains under instrumented indentation: Micromechanical modeling. In International Conference on Advances in Computational Mechanics; Springer: Singapore, 2017; pp. 157–169. [Google Scholar] [CrossRef]
- Nguyen, N.P.T.; Abbès, F.; Abbès, B.; Lecomte, J.-S.; Schuman, C. Experimental Characterisation and Numerical Modelling of the Effect of Cold Rolling on the Nanoindentation Response of Pure Zinc Grains. IOP Conf. Ser. Mater. Sci. Eng. 2019, 540, 012011. [Google Scholar] [CrossRef]
- Tromans, D. Elastic Anisotropy of HCP Metal Crystals and Polycrystals. Int. J. Res. Rev. Appl. Sci. 2011, 6, 462–483. [Google Scholar]
- Asaro, R.J.; Needleman, A. Texture Development and Strain Hardening in Rate Dependent Polycrystals. Acta Metall. 1985, 33, 923–953. [Google Scholar] [CrossRef]
- Marin, E.B.; Dawson, P.R. Elastoplastic Finite Element Analyses of Metal Deformations Using Polycrystal Constitutive Models. Comput. Methods Appl. Mech. Eng. 1998, 165, 23–41. [Google Scholar] [CrossRef]
- Zhao, M.; Ogasawara, N.; Chiba, N.; Chen, X. A new approach to measure the elastic–plastic properties of bulk materials using spherical indentation. Acta Mater. 2006, 54, 23–32. [Google Scholar] [CrossRef]
- Bhattacharya, A.K.; Nix, W.D. Finite Element Simulation of Indentation Experiments. Int. J. Solids Struct. 1988, 24, 881–891. [Google Scholar] [CrossRef]
- Poloni, C.; Pediroda, V. GA coupled with computationally expensive simulations: Tools to improve efficiency. In Genetic Algorithms and Evolution Strategies in Engineering and Computer Science; Quagliarella, D., Périaux, J., Poloni, C., Winter, G., Eds.; John Wiley and Sons: West Sussex, UK, 1997; pp. 267–288. [Google Scholar]
- Bandyopadhyay, S.; Saha, S. Use of Multiobjective Optimization for Data Clustering. In Unsupervised Classification; Springer: Berlin/Heidelberg, Germany, 2013. [Google Scholar] [CrossRef]
- Sobol, I.M. On the distribution of points in a cube and the approximate evaluation of integrals. USSR Comput. Math. Math. Phys. 1967, 7, 86–112. [Google Scholar] [CrossRef]
- Myers, R.H.; Montgomery, D.C.; Anderson-Cook, C.M. Response Surface Methodology: Process and Product Optimization Using Designed Experiments, 3rd ed.; Wiley–Blackwell: Oxford, UK, 2009. [Google Scholar]
- MacKay, D.J. Introduction to Gaussian processes. NATO ASI Ser. F Comput. Syst. Sci. 1998, 168, 133–166. [Google Scholar]
- Xiao, G.; Li, Z.; Liu, E.; Qiao, L.; Shu, X.; Sun, R. Microscale mechanical properties dependent on the strain rate and temperature of cured isotropic conductive adhesive. Mech. Time-Depend. Mater. 2021, 25, 249–264. [Google Scholar] [CrossRef]
- Mao, J.; Liu, W.; Li, D.; Zhang, C.; Ma, Y. The Strain Rate Sensitivity and Creep Behavior for the Tripler Plane of Potassium Dihydrogen Phosphate Crystal by Nanoindentation. Micromachines 2021, 12, 369. [Google Scholar] [CrossRef]
- Abo Znemah, R.; Voyiadjis, G.Z.; Wood, P.; Akbari, E. Strain Rate and Temperature Effects in Nanoindentation Testing on Hardness in Selective Laser Melting IN718. ASME J. Eng. Mater. Technol. 2022, 144, 011010. [Google Scholar] [CrossRef]
- Giannakopoulos, A.E.; Larsson, P.L.; Vestergaard, R. Analysis of Vickers Indentation. Int. J. Solids Struct. 1994, 31, 2679–2708. [Google Scholar] [CrossRef]
- Bolzon, G.; Maier, G.; Panico, M. Material model calibration by indentation, imprint mapping and inverse analysis. Int. J. Solids Struct. 2004, 41, 2957–2975. [Google Scholar] [CrossRef]
- Renner, E.; Bourceret, A.; Gaillard, Y.; Amiot, F.; Delobelle, P.; Richard, F. Identifiability of single crystal plasticity parameters from residual topographies in Berkovich nanoindentation on FCC nickel. J. Mech. Phys. Solids 2020, 138, 103916. [Google Scholar] [CrossRef]
- Sedighiani, K.; Diehl, M.; Traka, K.; Roters, F.; Sietsma, J.; Raabe, D. An efficient and robust approach to determine material parameters of crystal plasticity constitutive laws from macro-scale stress–strain curves. Int. J. Plast. 2020, 137, 102779. [Google Scholar] [CrossRef]
- Savage, D.J.; Feng, X.; Knezevic, M. Identification of crystal plasticity model parameters by multi-objective optimization integrating microstructural evolution and mechanical data. Comput. Methods Appl. Mech. Eng. 2021, 379, 113747. [Google Scholar] [CrossRef]
- Nix, W.D. Elastic and plastic properties of thin films on substrates: Nanoindentation techniques. Mater. Sci. Eng. A 1997, 234–236, 37–44. [Google Scholar] [CrossRef]
- Chaudhri, M.M.; Winter, M. The load-bearing area of a hardness indentation. J. Phys. D Appl. Phys. 1988, 21, 370–374. [Google Scholar] [CrossRef]
- Kwon, J.; Brandes, M.C.; Sudharshan Phani, P.; Pilchak, A.P.; Gao, Y.F.; George, E.P.; Pharr, G.M.; Mills, M.J. Characterization of deformation anisotropies in an α-Ti alloy by nanoindentation and electron microscopy. Acta Mater. 2013, 61, 4743–4756. [Google Scholar] [CrossRef]
- Sarvesha, R.; Gokhale, A.; Kumar, K.; Sharma, N.K.; Jain, J.; Singh, S.S. Effect of crystal orientation on indentation-induced deformation behavior of zinc. Mater. Sci. Eng. A 2020, 776, 139064. [Google Scholar] [CrossRef]


| Material | (MPa) | (MPa) | (MPa) | (MPa) | Ref. | ||||
|---|---|---|---|---|---|---|---|---|---|
| Pure zinc | 0.28 | [22] | |||||||
| Pure zinc | 0.3 | 10–15 | [8] | ||||||
| Pure zinc | 0.14–0.28 | 0.7–1.9 | 30 | [32] | |||||
| Pure zinc | 0.7 | [13] | |||||||
| Pure zinc | 0.5–6 | [33] | |||||||
| Pure zinc | 1 | 10 | 5 | [34] | |||||
| Pure zinc | 0.4 | 6–15 | 4–10 | [35] | |||||
| Pure zinc | 1.5 | 22.5 | 15 | [36] | |||||
| Pure zinc | 5 | 20 | [11] | ||||||
| Zn-0.16%Cu-0.076%Ti | 15 | 10 | 30 | [10] | |||||
| Zn-0.165%Cu-0.07%Ti | 15 | 30 | 10 | [25] | |||||
| Zn-0.17%Cu-0.08%Ti | 15 | 2 | 30 | [26] | |||||
| Zn-0.1%Ti | 5–12.5 | [20] | |||||||
| Zn-0.2%Al | 15 | 10 | 10 | 8 | [29] | ||||
| Zn-0.001%Fe-0.2%Al | 1.5 | 22.5 | 15 | 25 | [27] | ||||
| Zn-0.08%Cu-0.1%Ti | 7 | 180 | 75 | 200 | [30] | ||||
| Zn-(0.1–0.2%)Cu-Ti | 1 | 47.94 | 106.25 | [12] |
| Ag | Cd | Ca | Cr | Cu | Cs | Fe | Mn | Ni | Pd | Pb | Rh | Ta | Tl | Ti |
|---|---|---|---|---|---|---|---|---|---|---|---|---|---|---|
| 0.36 | 3.4 | <0.1 | 0.55 | 4 | <0.1 | 4.9 | 0.18 | 0.66 | <1 | 12 | <0.5 | <10 | 5.1 | 4.5 |
| Grain # | Crystalline Orientation | Bunge Angles (°) | ||
|---|---|---|---|---|
| 10 | Pyramidal | 105.81 | 94.40 | 192.38 |
| 11 | Prismatic | 3.89 | 107.01 | 214.74 |
| 16 | Pyramidal | 158.75 | 72.58 | 184.56 |
| 18 | Basal | 0.04 | 137.10 | 233.02 |
| 165 | 61.8 | 39.6 | 31.1 | 50 |
| (MPa) | (MPa) | (MPa) | (MPa) | (MPa) | (MPa) | (MPa) |
|---|---|---|---|---|---|---|
| 107 | 188 | 85.9 | 2.01 | 18.5 | 104 | 42 |
Publisher’s Note: MDPI stays neutral with regard to jurisdictional claims in published maps and institutional affiliations. |
© 2022 by the authors. Licensee MDPI, Basel, Switzerland. This article is an open access article distributed under the terms and conditions of the Creative Commons Attribution (CC BY) license (https://creativecommons.org/licenses/by/4.0/).
Share and Cite
Nguyen, P.T.N.; Abbès, F.; Lecomte, J.-S.; Schuman, C.; Abbès, B. Inverse Identification of Single-Crystal Plasticity Parameters of HCP Zinc from Nanoindentation Curves and Residual Topographies. Nanomaterials 2022, 12, 300. https://doi.org/10.3390/nano12030300
Nguyen PTN, Abbès F, Lecomte J-S, Schuman C, Abbès B. Inverse Identification of Single-Crystal Plasticity Parameters of HCP Zinc from Nanoindentation Curves and Residual Topographies. Nanomaterials. 2022; 12(3):300. https://doi.org/10.3390/nano12030300
Chicago/Turabian StyleNguyen, Pham T. N., Fazilay Abbès, Jean-Sébastien Lecomte, Christophe Schuman, and Boussad Abbès. 2022. "Inverse Identification of Single-Crystal Plasticity Parameters of HCP Zinc from Nanoindentation Curves and Residual Topographies" Nanomaterials 12, no. 3: 300. https://doi.org/10.3390/nano12030300
APA StyleNguyen, P. T. N., Abbès, F., Lecomte, J.-S., Schuman, C., & Abbès, B. (2022). Inverse Identification of Single-Crystal Plasticity Parameters of HCP Zinc from Nanoindentation Curves and Residual Topographies. Nanomaterials, 12(3), 300. https://doi.org/10.3390/nano12030300