Article

Carbon Formation during Methane Dry Reforming over Ni-Containing Ceria-Zirconia Catalysts

Department of Heterogeneous Catalysis, Boreskov Institute of Catalysis, 630090 Novosibirsk, Russia
*
Author to whom correspondence should be addressed.
Nanomaterials 2022, 12(20), 3676; https://doi.org/10.3390/nano12203676
Submission received: 21 September 2022 / Revised: 14 October 2022 / Accepted: 17 October 2022 / Published: 19 October 2022
(This article belongs to the Special Issue Synthesis of Nanocomposites and Catalysis Applications II)

Abstract

:
Two series of Ni/Ce(Ti/Nb)ZrO2 catalysts were prepared using citrate route and original solvothermal continuous flow synthesis in supercritical isopropanol and studied in dry reforming of methane (DRM). TEM, XPS and FTIRS of adsorbed CO confirm influence of support composition and preparation method on the catalysts’ morphology and surface features. The oxygen mobility was studied by isotope heteroexchange with C18O2. After testing in DRM, carbon deposits after catalysts’ testing in DRM were investigated by temperature-programmed oxidation with thermo-gravimetric analysis. The lowest amounts of carbon deposits were obtained for unmodified Ni-CeZr and Ni-CeNbZr compositions. Ti addition lead to an increased amount of carbon, which was removed at higher temperatures. The use of supercritical supports also resulted in the formation of a higher amount of coke. Catalysts prepared by the supercritical synthesis were tested in DRM for 25 h. The highest activity drop was observed in the first three hours. For all compositions, close values of carbon deposits were revealed.

Graphical Abstract

1. Introduction

In recent years, dry reforming of methane (DRM) (Equation (1)) is widely investigated because it allows carrying out processes of biogas utilization, conversion of natural gas with a high CO2 content and utilization of such greenhouse gases as methane and carbon dioxide [1,2]. Stoichiometrically, it produces industrially important synthesis gas with a H2/CO = 1 ratio, which can be a feedstock for the production of valuable long-chain hydrocarbons by Fischer-Tropsch process [3,4]:
CH4 + CO2 → 2CO + 2H2      ΔH0298K = 260.5 kJ/mol
According to thermodynamic calculations, H2/CO ratio decreases with increasing either temperature or CO2/CH4 ratio [5]. In addition, the H2/CO ratio can be changed by simultaneous occurrence of side reactions. The reverse water–gas shift reaction leads to hydrogen consumption and CO formation and decreases the H2/CO ratio [6,7]:
CO2 + H2 → CO + H2O      ΔH0298K = 41.0 kJ/mol
Addition of such reagents as H2O, CO2 and O2 in different combinations can be used to control the H2/CO ratio [4].
Despite the above-mentioned benefits, dry reforming of methane has not yet found industrial application. The main disadvantage of this process is rapid catalyst deactivation due to carbon deposition on catalysts surface and sintering of both metal and support particles at high reaction temperatures [8].
The carbon formation can occur by reactions of methane decomposition (Equation (3)) and CO disproportionation (or Boudouard reaction) (Equation (4)) [9,10]:
CH4 → C + 2H2      ΔH0298K = 75.0 kJ/mol
2CO → C + CO2      ΔH0298K = −172.0 kJ/mol
The reaction of methane cracking is endothermic and can proceed at a significant rate above 557 °C, while the Boudouard reaction is exothermic, occurring below 700 °C. So, carbon can be formed by both these reactions in the temperature range of 557–700 °C [11,12]. In the work [13], the operating conditions required to prevent carbon deposition at different pressures (0.6, 1, 10 atm) and gas feed ratios (CO2/CH4) were determined by thermodynamic analysis. It was shown that when a reaction was carried out at 1 atm and CO2/CH4 = 1, carbon formation was possible at temperatures lower than 870 °C.
Different types of carbon can be formed during the methane dry reforming depending on the reaction conditions and catalyst composition [14]. In general, amorphous carbon is known to be more reactive and easily gasified, while graphitic carbon is oxidized at higher temperatures [15,16,17,18].
Formation of different types of carbon with different reactivity were demonstrated in several works [8,19,20,21].
At least two types of carbon deposits were identified on Ni/SiO2 in [19]: the first type of carbon was formed at the beginning of the catalytic test and oxidized at low temperature; the second type of carbon was more stable towards oxidation and its accumulation results in catalyst deactivation.
For Ni/Al2O3 catalyst, three types of carbonaceous species were observed being oxidized at 150–220 °C (Cα), 530–600 °C (Cβ) and > 650 °C (Cγ) [20]. The Cβ and Cγ were formed at low (500–600 °C) reaction temperatures. At reaction temperatures above 750 °C the main form was Cα. The active Cα species were assumed to take part in CO formation, while the less active Cβ and Cγ participated in catalyst deactivation. At high reaction temperature Cβ and Cγ were removed that can be a reason for lower deactivation rate and higher catalyst stability. The similar correlations were also obtained in the following work. The temperature-programmed hydrogenation of Ni/MgO catalysts after DRM showed the presence of two carbonaceous forms being removed at 280–430 °C (Cα) and above 600 °C (Cβ), respectively [21]. The intensity of Cβ peak increased significantly with the time on stream. It also was suggested that Cα is the reaction intermediate, while Cβ formation leads to catalysts’ deactivation.
Catalytic activity and stability to carbonization depend on many factors, such as type of active metal, preparation method, nature of precursors, calcination temperature, reduction pretreatment and support nature [22]. Noble-metal catalysts provide high catalytic activity and stability to coke formation [23]. However, their industrial application is impossible due to their high cost. Ni-containing catalysts are a suitable alternative because they provide a high catalytic activity and have affordable price. The main drawback of such catalysts is their deactivation due to coke deposition [14].
A possible way to minimize carbon formation is utilization of oxide supports with a high oxygen storage capacity (OSC) [4,24]. Participation of support oxygen in the gasification of coke precursors should improve catalysts’ stability to coking. Ceria is widely investigated as a catalyst support due to its high OSC and Ce4+/Ce3+ redox potential. It is also known to resist sintering and exhibit strong metal–support interaction, leading to a high metal dispersion [1].
CeO2 modification by Zr leads to improved textural features, thermal stability, reducibility and oxygen storage/transport properties [16,25,26]. The introduction of other dopants such as W, La or Pr also enhances these ceria properties [8,27,28,29]. In our previous works [30,31,32], we have shown that the introduction of titanium and niobium increases the number of oxygen vacancies in the structure of ceria–zirconia.
The carbon formation by CH4 decomposition is a structure-sensitive reaction, so it can be influenced by modification of the catalyst surface [14]. A high dispersion of Ni particles should reduce the formation of carbon deposits [33,34], since the metal atom ensembles necessary for carbon formation are larger than those needed for CH4 reforming [35].
The preparation method as well as method of nickel addition has a strong influence on the catalysts’ morphology and surface features [36].
As an example, Ni-containing ceria–zirconia catalysts Ni/Ce0.83Zr0.17O2 were prepared by four different techniques including two impregnation methods—dry impregnation and strong electrostatic adsorption, and two one-pot routes—co-precipitation and combustion synthesis [37]. According to CO chemisorption data, Ni dispersion was the highest for sample prepared by the adsorption method. The same catalyst showed the highest initial methane conversion, while the other three samples demonstrated close results despite the different values of nickel dispersion. During TGA oxidation tests after reaction, the catalyst prepared by adsorption showed the highest weight loss.
A similar situation was shown by Makri et al. [8], when amount of carbon deposits was maximal for the most active composition 5%Ni/Ce0.8Pr0.2O2.
In our previous work [30], we have investigated Ni-containing catalysts based on ceria–zirconia (also doped by Ti and Nb cations) in methane dry reforming reaction. It was devoted to the study of textural and structural features and reducibility of supports and catalysts depending on preparation method and its effect on catalytic activity.
Catalysts’ supports were obtained by two preparation techniques—by traditional citrate route and by original solvothermal continuous flow synthesis in supercritical alcohols. Synthesis in supercritical isopropanol allows obtaining single-phased oxides with more uniform distribution of components. Ti and Nb incorporation leads to increased amounts of oxygen vacancies and to higher catalytic activity. Moreover, it was shown that catalytic activity depends on both support composition and preparation method.
In this article, we continue our research, and the purpose of this work was to find out how the modification of the support chemical composition affects the carbon formation in a methane dry reforming reaction and how formed carbon affects the catalytic activity. To achieve this goal, the surface features of the catalysts were investigated in detail using XPS and FTIR spectroscopy of the adsorbed CO. Long-term stability tests in DRM were carried out to check the catalysts’ stability and the amount of formed carbon was determined by TPO-TGA with mass-spectroscopic analysis. Since the coking stability of catalysts is strongly related to the support’s oxygen mobility, the oxygen diffusion coefficients were estimated using the temperature-programmed isotope exchange of oxygen with C18O2. The effect of titanium and niobium addition on the oxygen mobility and carbonization stability of Ni-containing ceria–zirconia catalysts was studied for the first time.

2. Materials and Methods

2.1. Catalysts’ Preparation

The first series of supports was prepared by citrate methods. Ce0.75Zr0.25O2 and Ce0.75Nb0.1Zr0.15O2 oxides were prepared by Pechini route [31] using citric acid (CA) and ethylene glycol (EG) as polyester complexing agents. The molar ratio of CA:EG:Me (metals) was 3.75:11.25:1. Citric acid was dissolved in ethylene glycol, then corresponding salts were added to this solution. The mixture was stirred for 2 h and then heated at 80 °C to evaporate water. The resulting dried gel was calcined at 700 °C for 2 h in air, obtaining oxide powder. Ce0.75Ti0.1Zr0.15O2 and Ce0.75Ti0.05Nb0.05Zr0.15O2 oxides were prepared by citrate method in which aqueous solution of citric acid was used; CA:(metals) ratio was 5:1. The further procedure is the same as described above.
The second series of supports with the same compositions was prepared by the continuous flow solvothermal synthesis using supercritical isopropanol by technique described earlier [30,31]. A detailed installation scheme is presented in [31]. The resulting precipitate was dried at 200 °C and calcined at 700 °C for 2 h in air.
Catalysts with 5 wt.% Ni were prepared by the incipient wetness impregnation of obtained oxides with water solution of Ni(NO3)2 followed by drying and calcination at 700 °C for 2 h. Catalysts’ compositions and abbreviations are presented in the Table 1.

2.2. Catalysts’ Characterization

Experiments of the low-temperature adsorption/desorption of nitrogen were carried out using a Quadrasorb evo (Quantachrome Instruments, Boynton Beach, Florida, USA) installation. Specific surface area of samples was determined by BET method. The desorption branch of isotherm was used to estimate the pore volumes by the BJH method.
A Bruker D8 Advance diffractometer (Bruker, Germany) with CuKα radiation and a position sensitive detector LynxEye was used to record XRD patterns with step 0.05° in 2θ scanning range 10–85°. Parameter calculations were performed by the Rietveld method using Bruker TOPAS software.
TEM (transmission electron microscopy) micrographs were obtained with Themis-Z 3.1 instrument (TFS, Waltham, MA, USA) equipped with X-FEG-monochromator and CS/S double corrector, accelerating voltage 200 kV and with JEM-2200FS transmission electron microscope (JEOL Ltd., Akishima, Tokyo, Japan, acceleration voltage 200 kV, lattice resolution~1Å) equipped with a Cs-corrector. Elemental analysis was performed with Super-X EDS detector (energy resolution about 120 eV) in HAADF-STEM mode.
A photoelectron spectrometer (SPECS Surface Nano Analysis GmbH, Berlin, Germany) with a hemispherical electron energy analyzer PHOIBOS-150 and X-ray source XR-50 with a double Al/Mg anode was used for recording XPS spectra. The spectra were obtained using the non-monochromatized AlKα radiation (hν = 1486.61 eV). The powders of catalysts were pressed into a pellet, which was fixed on a sample holder using a double-sided conductive adhesive tape. The binding energy (BE) scale was calibrated by the Ce3d3/2-u’’’ cerium line (BE = 916.7 eV). For estimation of relative elements concentrations in surface layers, XPS lines with the photoionization cross-sections of the corresponding terms were taken into account [38]. From each spectrum, a Shirley-type background was subtracted, then the experimental curve was deconvoluted into a number of lines corresponding to the photoemission of electrons from atoms in different chemical environments. The CasaXPS software was used for the curve fitting. The line shape was approximated by a symmetric function obtained by multiplying the Gauss and Lorentz functions. Before recording the spectra, the samples were pretreated in a high-pressure cell in a hydrogen atmosphere at 450 °C for 30 min.
A Shimadzu IRTracer-100 (Shimadzu, Kyoto, Japan) spectrometer was used for recording FTIR spectra. The spectra of adsorbed CO at −196 °C and at room temperature were obtained in the 400–6000 cm−1 range, accumulating 200 scans at 4 cm−1 resolution. The samples were pressed into pellets with size of 1 × 2 cm2. A sample placed into the IR cell was heated in a vacuum to 600 °C and then calcined in a hydrogen atmosphere (100 Torr of H2) for 1 h at this temperature. After that, the sample was evacuated to a residual gas pressure of at least 10−4 Torr and cooled to room temperature. CO was adsorbed at −196 °C and CO pressure from 0.1 to 10 Torr. After obtaining the spectra at liquid nitrogen temperature, the sample was heated to room temperature and corresponding spectra were recorded. The obtained spectra were normalized to the optical thickness of the pellets. To obtain differential spectra, the spectrum before CO adsorption was subtracted from the spectrum after adsorption. The analysis of IR spectra was carried out by decomposition of the corresponding IR bands into individual Gaussian components. The amount of surface sites of different types were estimated using the integral absorption coefficients from the integrated intensities of the characteristic absorption bands [39]. The error in measuring the sites amount was 20%.
The oxygen mobility of samples was investigated by temperature-programmed isotope exchange (TPIE) of oxygen with C18O2. The experiments were carried out with the sample weight of 50 mg placed into flow quartz tube reactor with the inner diameter of 3 mm. The samples were preliminarily pretreated in He + 1% O2 flow (flow rate 25 mL/min) at 700 °C for 30 min and cooled down to room temperature in He + 1% CO2 flow (flow rate 25 mL/min). After the steady state was reached, the feed gas mixture was switched to the mixture of the same composition but containing 18O label. The temperature was raised from 50 °C to 700 °C with a ramp of 5 °C/min. The effluent gases were analyzed by the UGA 200 mass spectrometer (Stanford Research Systems, Sunnyvale, CA, USA). The analysis of 18O atomic fraction (α) and C16O18O molecular fraction (f16-18) responses was made for calculating the values of the heteroexchange rate (R), oxygen tracer diffusion coefficient (D*) and their effective activation energies (Ea,R, Ea,D) using a mathematical model (Supplementary Materials) [40,41].
To estimate the amount of carbon formed during catalytic tests in DRM reaction, the temperature-programmed oxidation coupled with thermogravimetric analysis (TPO-TGA) with synchronous analysis of the gas phase was used. Thermal analysis was carried out using a STA 409 PC instrument (NETZSCH, Selb, Germany). The Ni/Ce-Zr samples after DRM reaction were placed into corundum crucibles. The weight of the sample was ca. 75 mg. The oxidizing mixture contains O2 (10% vol.)/He with the feeding rate 30 mL/min. Differential thermal analysis (DTA) curves were recorded in the temperature range from 50 to 800 °C with 10 °C/min heating rate. Effluent gases concentrations were measured by UGA 200 gas analyzer (Stanford research systems, Sunnyvale, CA, USA).

2.3. Catalysts’ Testing in Methane Dry Reforming

The catalysts’ activity in methane dry reforming reaction was investigated by tests in a tubular quartz plug flow reactor with the feed mixture of 15% CH4 + 15% CO2 + N2 balance in the temperature range 600–750 °C and contact time 10 ms. The catalyst weight was diluted with quartz in 1:1 ratio (grains size 0.5–0.25 mm). The variation of temperature was realized stepwise by 50 °C, analysis of products concentration at each step was recorded during 30 min. The preliminary reduction treatment of catalysts was made in a stream of 5% H2 in He at 600 °C for an hour. The gas analyzer with IR sensors for CO, CO2 and CH4, and electrochemical sensor for H2 (Boner LLC, Novosibirsk, Russia) was used for the reaction mixture analysis.
Long-term stability tests were carried out for 25 h at 700 °C with the same catalyst pretreatment and reaction feed of 15% CH4 + 15% CO2 + Ar.

3. Results and Discussion

3.1. Characterization of Fresh Catalysts

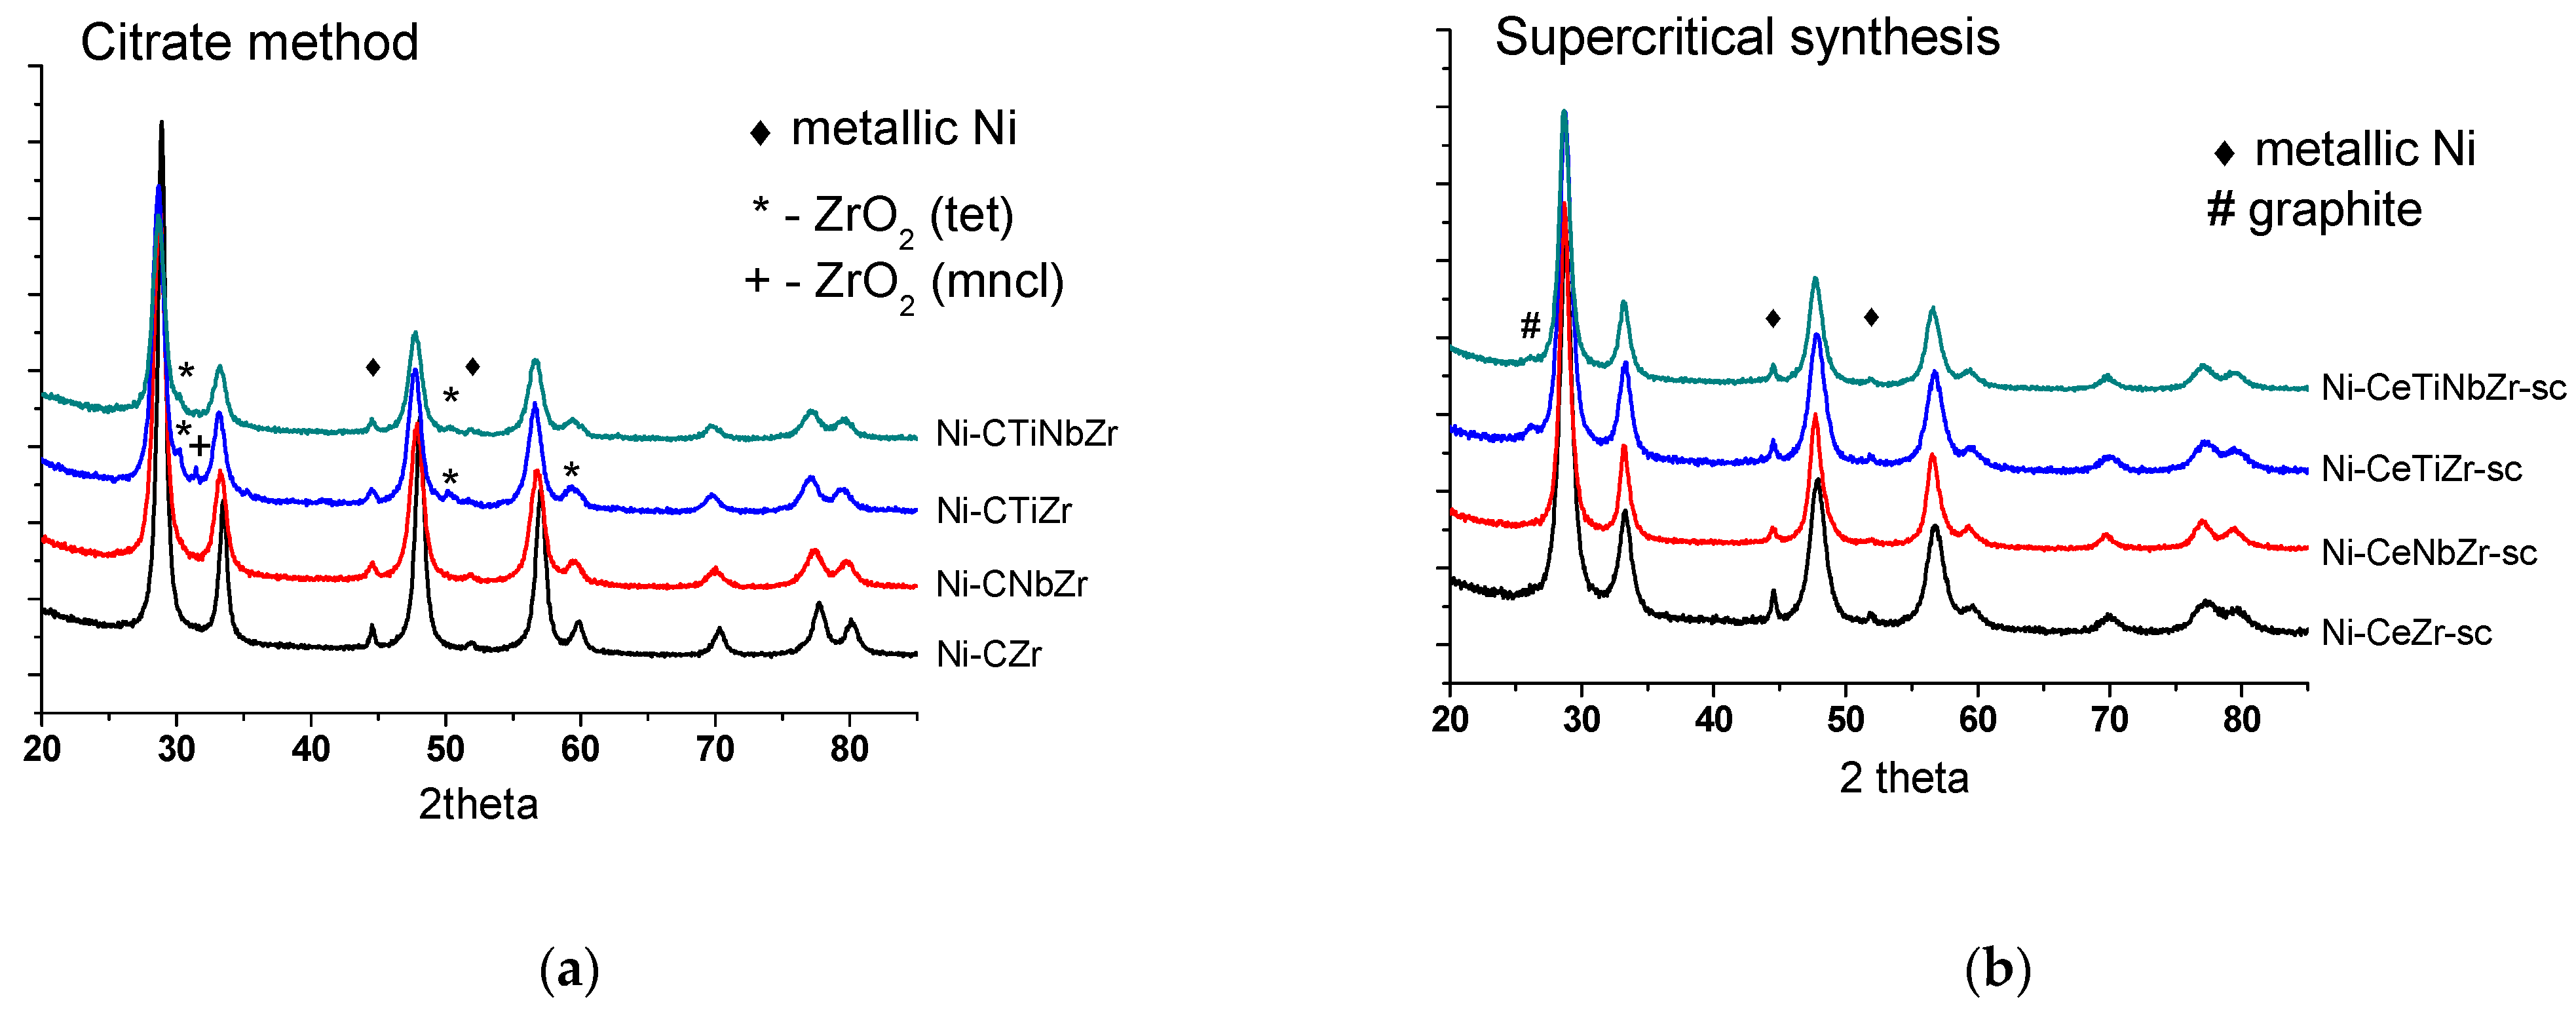
3.1.1. Study of Structure and Texture

According to XRD data, all mixed oxides are ceria–zirconia solid solutions with the cubic fluorite structure (PDF 81–0792). The absence of peaks corresponding to Ti or Nb oxides, as well as changing the lattice parameter of fluorite phase [30] after their addition, suggests the incorporation of doping cations into the ceria–zirconia mixed oxide structure. In the case of citrate samples, small amounts of zirconium oxide ZrO2 impurity are observed for samples doped by Ti since titanium cations can be incorporated into the fluorite lattice instead of zirconium and displace it. Synthesis in supercritical media provides more uniform distribution of components, and no ZrO2 impurities are observed for them. More detailed information and diffraction patters of obtained samples are given in our earlier work [30].
Table 2 presents catalyst’s textural characteristics and crystallite sizes calculated from XRD data. Crystallites size of fluorite phase of citrate samples is ~11 nm and does not depend on the sample’s chemical composition. Crystallites size of samples prepared by supercritical synthesis is more sensitive to the oxide composition and varies in the range of 9–15 nm.
Crystallites size of nickel oxide in the citrate series is in the range of 18–24 nm and in the supercritical series—within 20–30 nm. Apparently, a higher NiO dispersion in citrate samples is related to their higher specific surface area. Pore volume of samples slightly depends on the method of preparation and increases with the introduction of Ti and Nb.

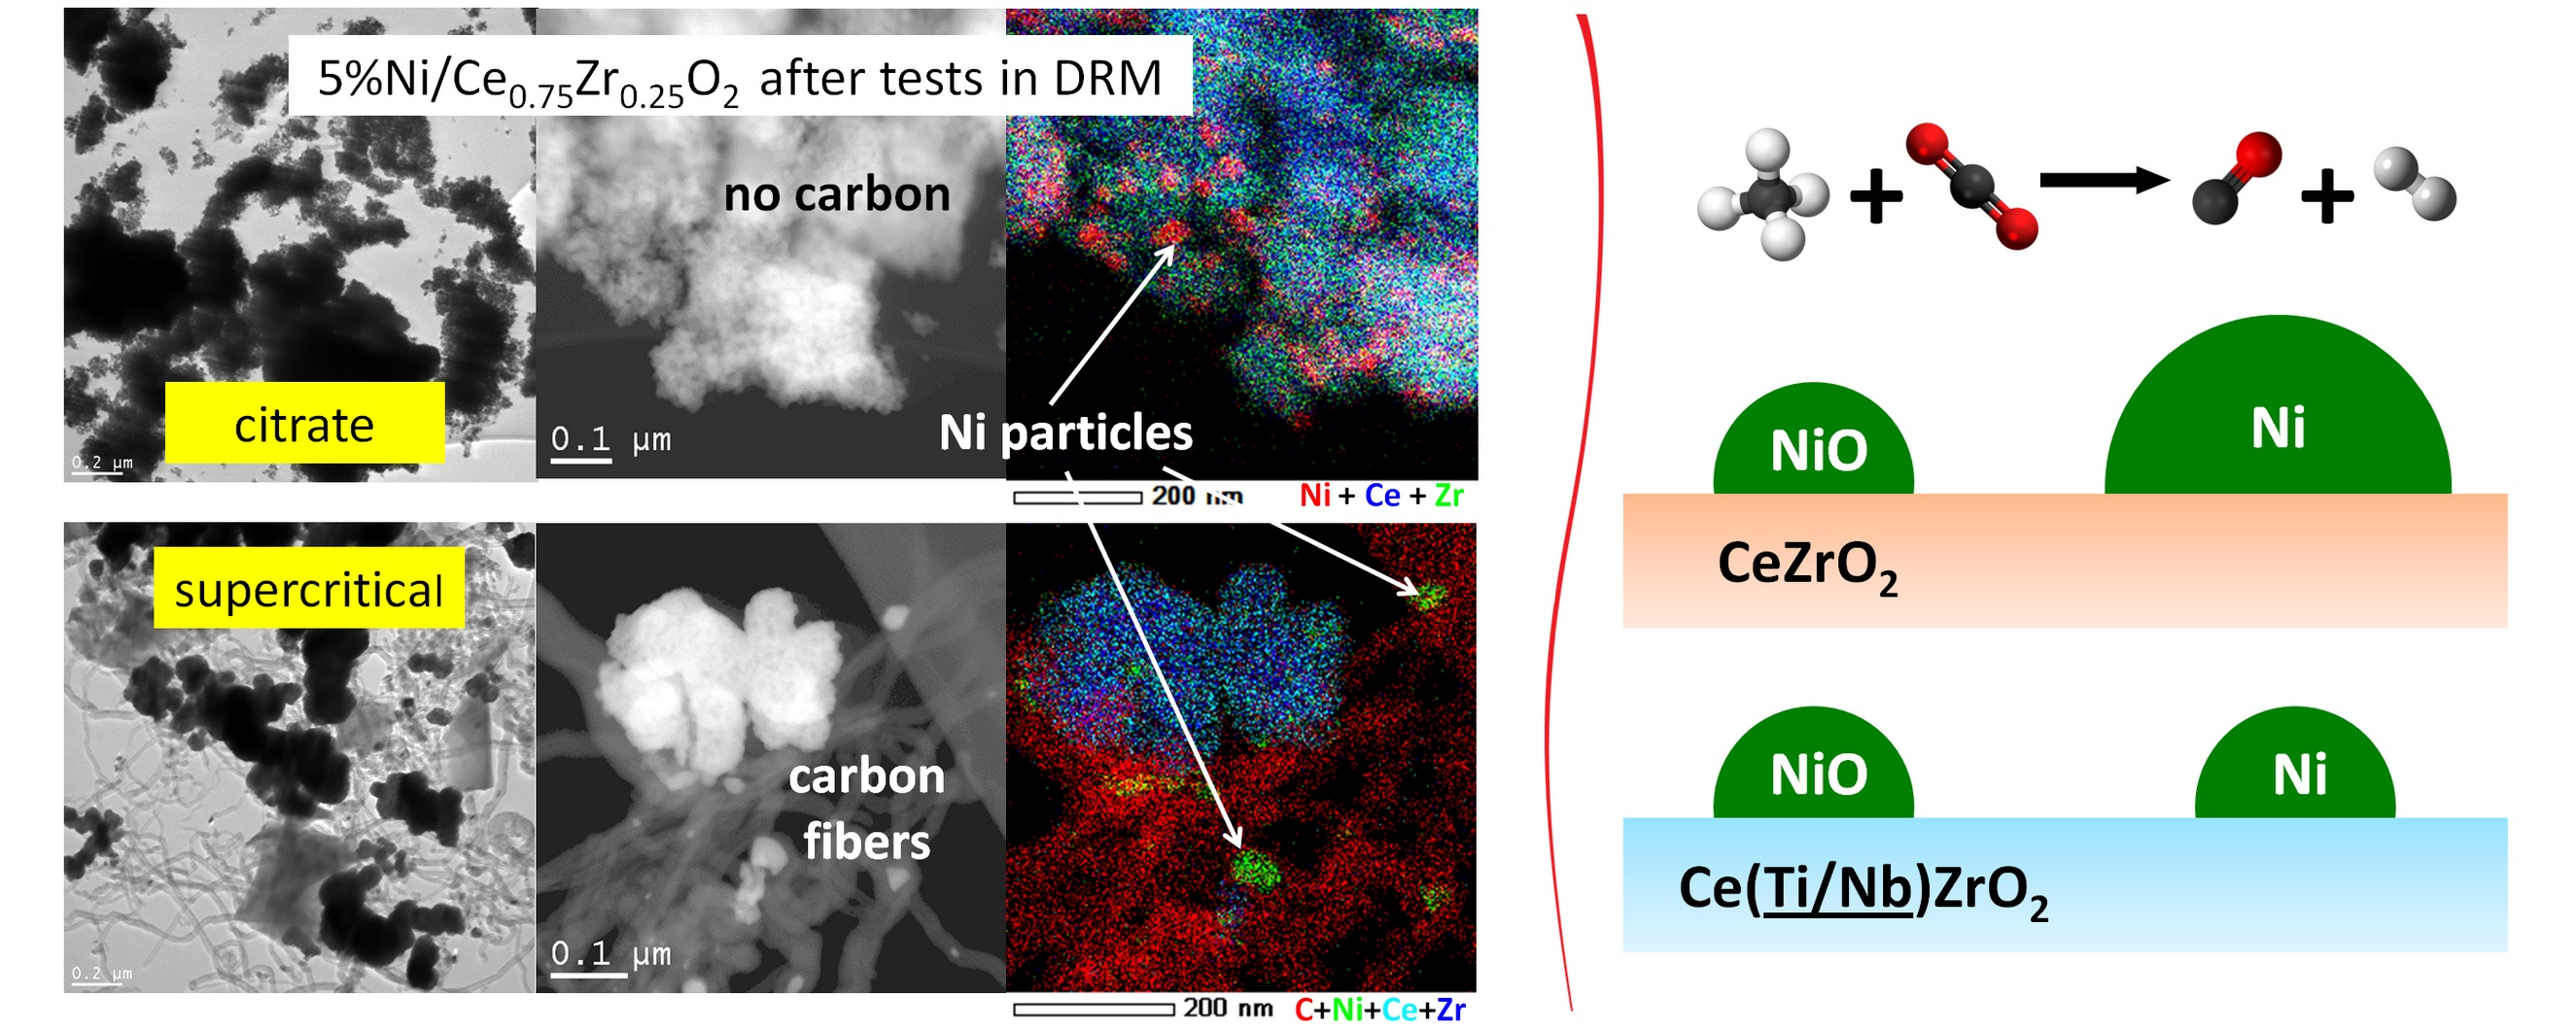
3.1.2. Study of Surface Properties by XPS

The chemical states and relative concentrations of elements in the (sub)surface layers of catalysts were studied by the X-ray photoelectron spectroscopy. To obtain the surface state close to that under reaction conditions, the samples were pretreated in a hydrogen atmosphere before recording the spectra.
Figure 1a shows the Ce3d spectra of catalysts prepared by supercritical synthesis. Cerium is in the Ce3+ and Ce4+ states. It is well known that Ce3d spectra have a complex shape. As a result of the spin–orbit interaction, the cerium 3d level splits into two sublevels Ce3d5/2 and Ce3d3/2, which leads to appearance in the XPS spectrum of doublet with integral line intensities in 3:2 ratio. Each component of the doublet splits into three lines in the case of CeO2 (v/u, v’’/u’’, v’’’/u’’’) or into two lines in the case of Ce2O3 (v’/u’, v0/u0). The fraction of Ce3+ ions can be estimated from relative intensities of these components [42]. In accordance with the results of spectra deconvolution into individual components, the proportion of Ce3+ ions is 60–70% for citrate samples and 50–60% for supercritical samples (Table 3).
The spectrum of Zr3d is a Zr3d5/2-Zr3d3/2 doublet with integral intensities of the components in ratio of 3:2 (Figure 1b). The spin–orbit splitting (the difference between the binding energies of Zr3d5/2 and Zr3d3/2) is 2.39 eV. All Zr3d spectra are well described by one doublet. The binding energy of Zr3d5/2 (181.8 eV) corresponds to zirconium in the Zr4+ state. For stoichiometric oxide ZrO2, the value of the binding energy Zr3d5/2 lies in the range of 182.2–183.3 eV [43,44].
The Ti2p spectra are shown in Figure 1c. The 2p level of titanium splits into two sublevels Ti2p3/2 and Ti2p1/2 due to spin–orbit interaction, the spin–orbit splitting is 5.66 eV. The Ti2p3/2 peak has a symmetric shape with the Ti2p3/2 binding energy being 458.2 eV, which corresponds to titanium in the Ti4+ state. In the literature, the values of the binding energy Ti2p3/2 for TiO2 are given in the range of 458.7–459.2 eV [45,46].
The spectrum of Nb3d is Nb3d5/2—Nb3d3/2 doublet with the integral intensities of the components in 3:2 ratio (Figure 1d). The spin–orbit splitting (the difference between the binding energies of Nb3d5/2 and Nb3d3/2) is 2.8 eV. All Nb3d spectra are well described by one doublet. The binding energy of Nb3d5/2 varies in the range of 206.8–206.9 eV, which corresponds to niobium in the Nb5+ state. For stoichiometric oxide Nb2O5, the binding energy of Nb3d5/2 lies in the range of 206.2–207.9 eV [47,48].
In the Ni2p3/2 spectra of all samples (Figure 1e), there is a main intense asymmetric peak with a binding energy in the region of 852.3–852.4 eV, which corresponds to nickel in the Ni0 state [49]. The spectra also show a low-intensity peak in the range of 854.3 eV, which indicates the presence of a small amount of nickel atoms (~10%) in the Ni2+ state. There are also shake-up satellites in the range of 858.5 and 855.9 eV which are determined by multi-electron processes [50].
Table 3 presents data of elements atomic ratios. The preparation method apparently has a strong influence on the surface composition. The nominal Ce content is 0.75. On the surface of citrate samples, cerium content is less than the stoichiometric one, while the surface of supercritical samples is enriched by cerium. The introduction of doping cations has an ambiguous effect on the total cerium content on the surface. However, doping results in an increase in the [Ce3+]/[Ce] ratio regardless of the preparation method. It is in a good agreement with a higher amount of oxygen vacancies estimated from the XRD data, as was shown earlier in [30], since it is known that Ce3+ fraction correlates with the amount of oxygen vacancies [51]. A higher percentage of Ce3+ for samples prepared by citrate method may be associated with a lower total cerium content in the (sub)surface layers of oxide.
In work [52], it was shown that the number of surface active sites, which are able to activate and transfer oxygen species, is proportional to Ce3+ content. Moreover, it can also increase Ni resistance to thermal sintering due to formation of [Oδ−, δ+] dipolar layer on the surface of Ni particles and concomitant repulsive electrostatic forces between particles [17].
The surface concentration of Ni species is higher for catalysts prepared by supercritical synthesis. For citrate samples, Ni amount is lower than the nominal one ([Ni]/[Ce] + [Zr] + [Ti] + [Nb] = 0.14) which can be explained by decoration of Ni nanoparticles by support oxide layer. For both series of catalysts, the surface Ni content increases with addition of Ti and Nb separately, but decreases with their co-doping.

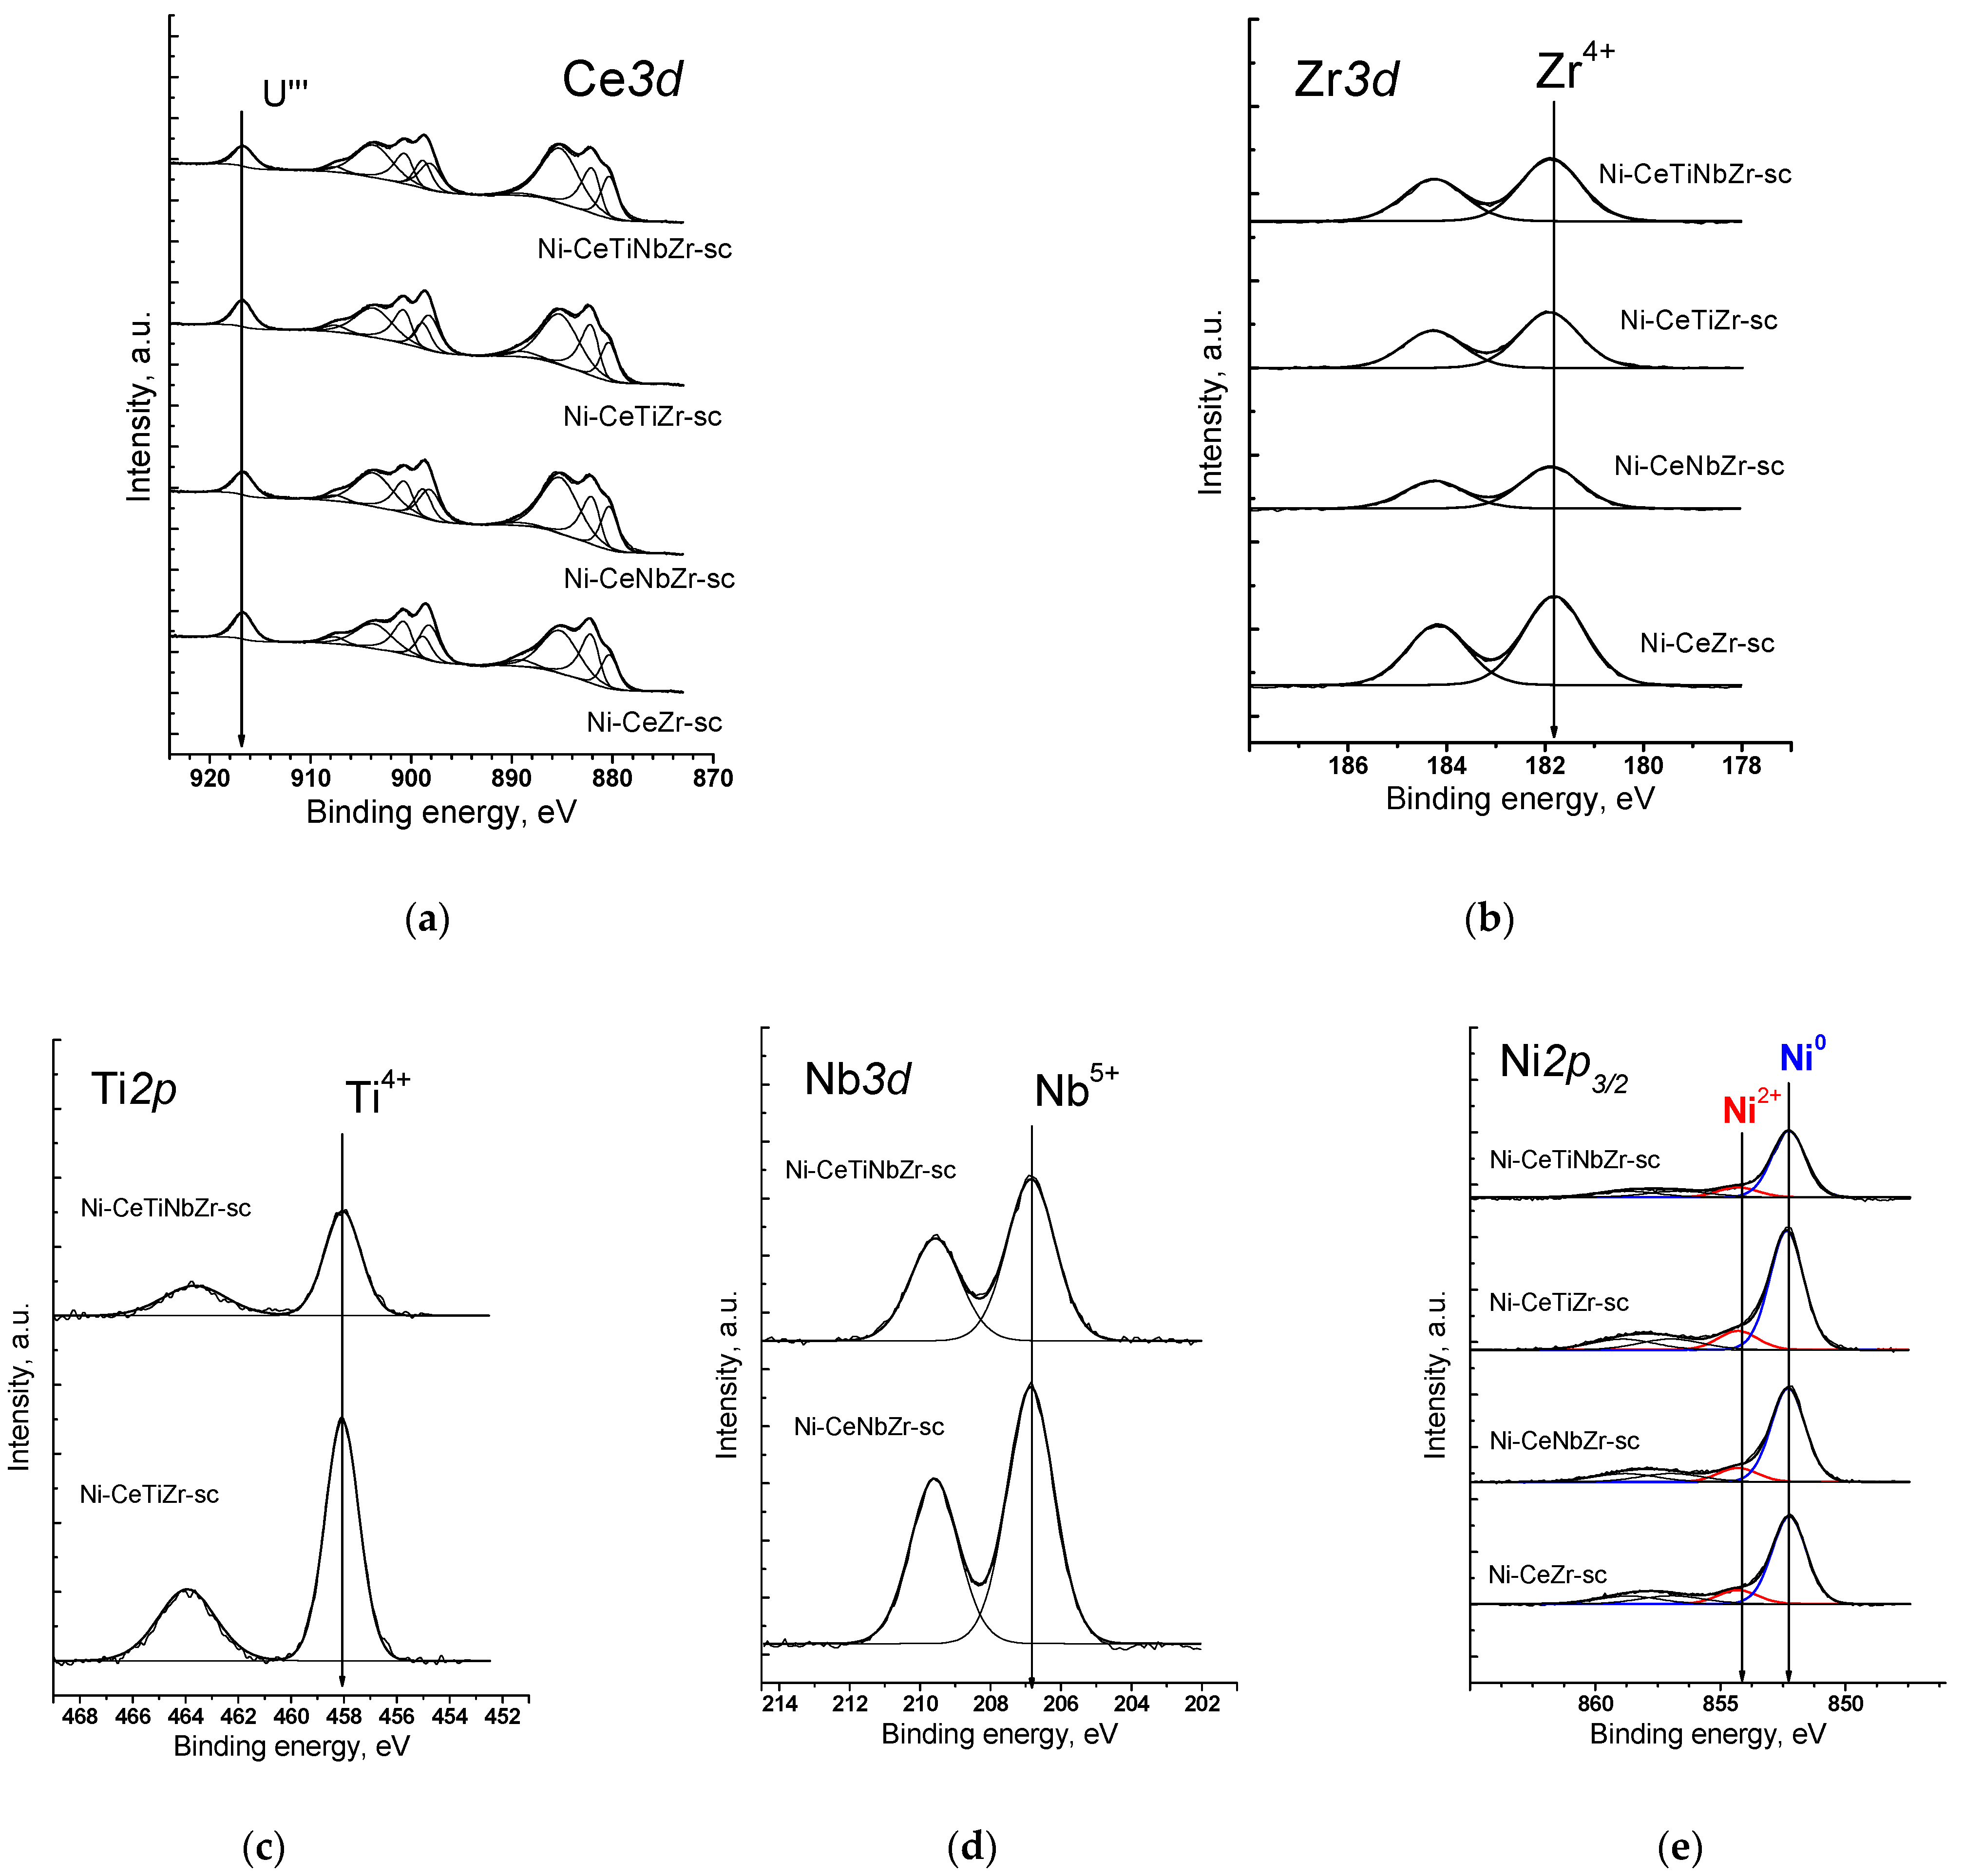
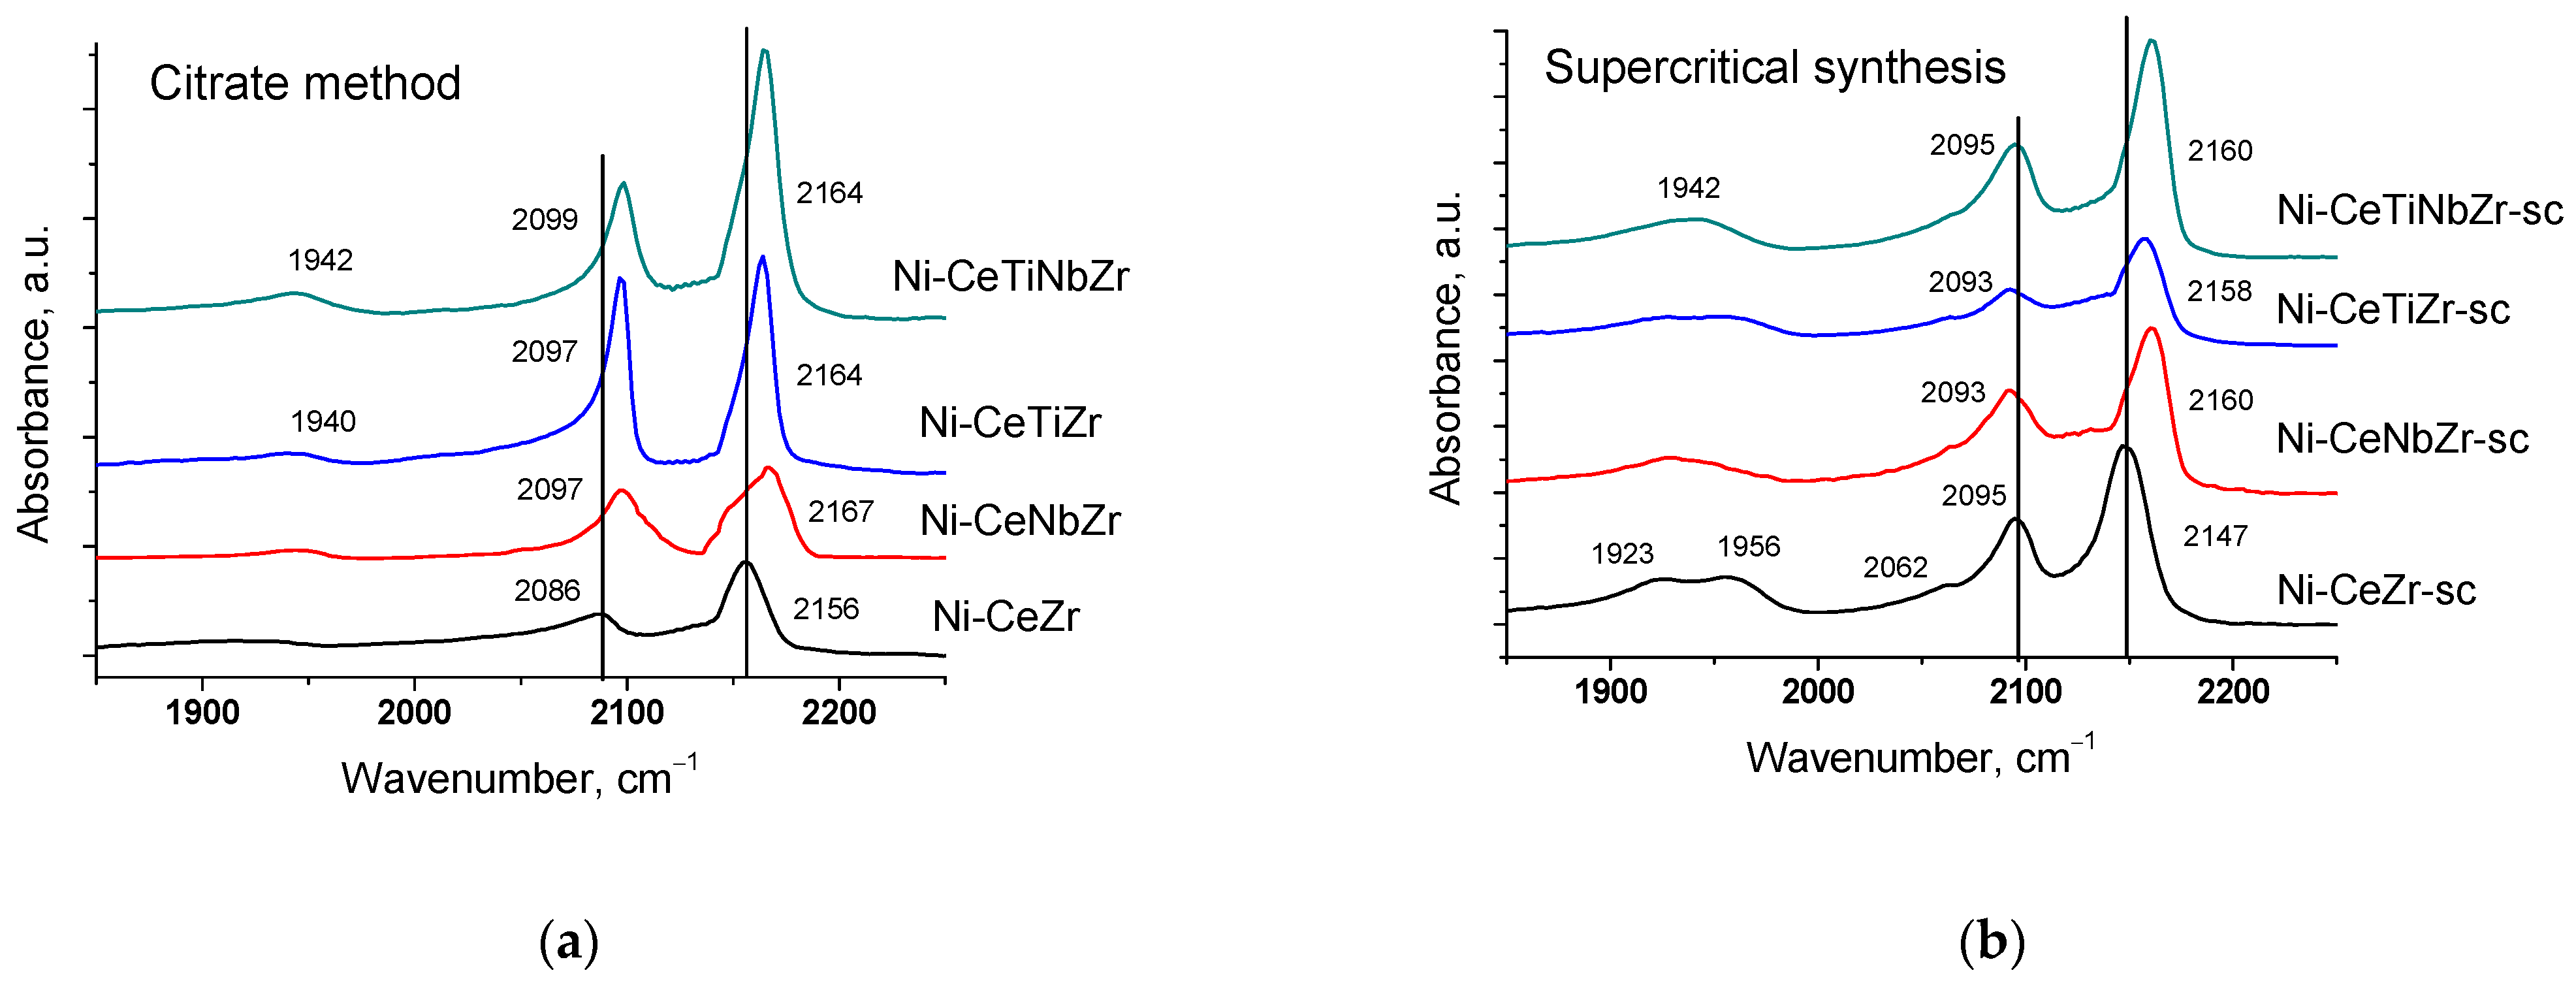
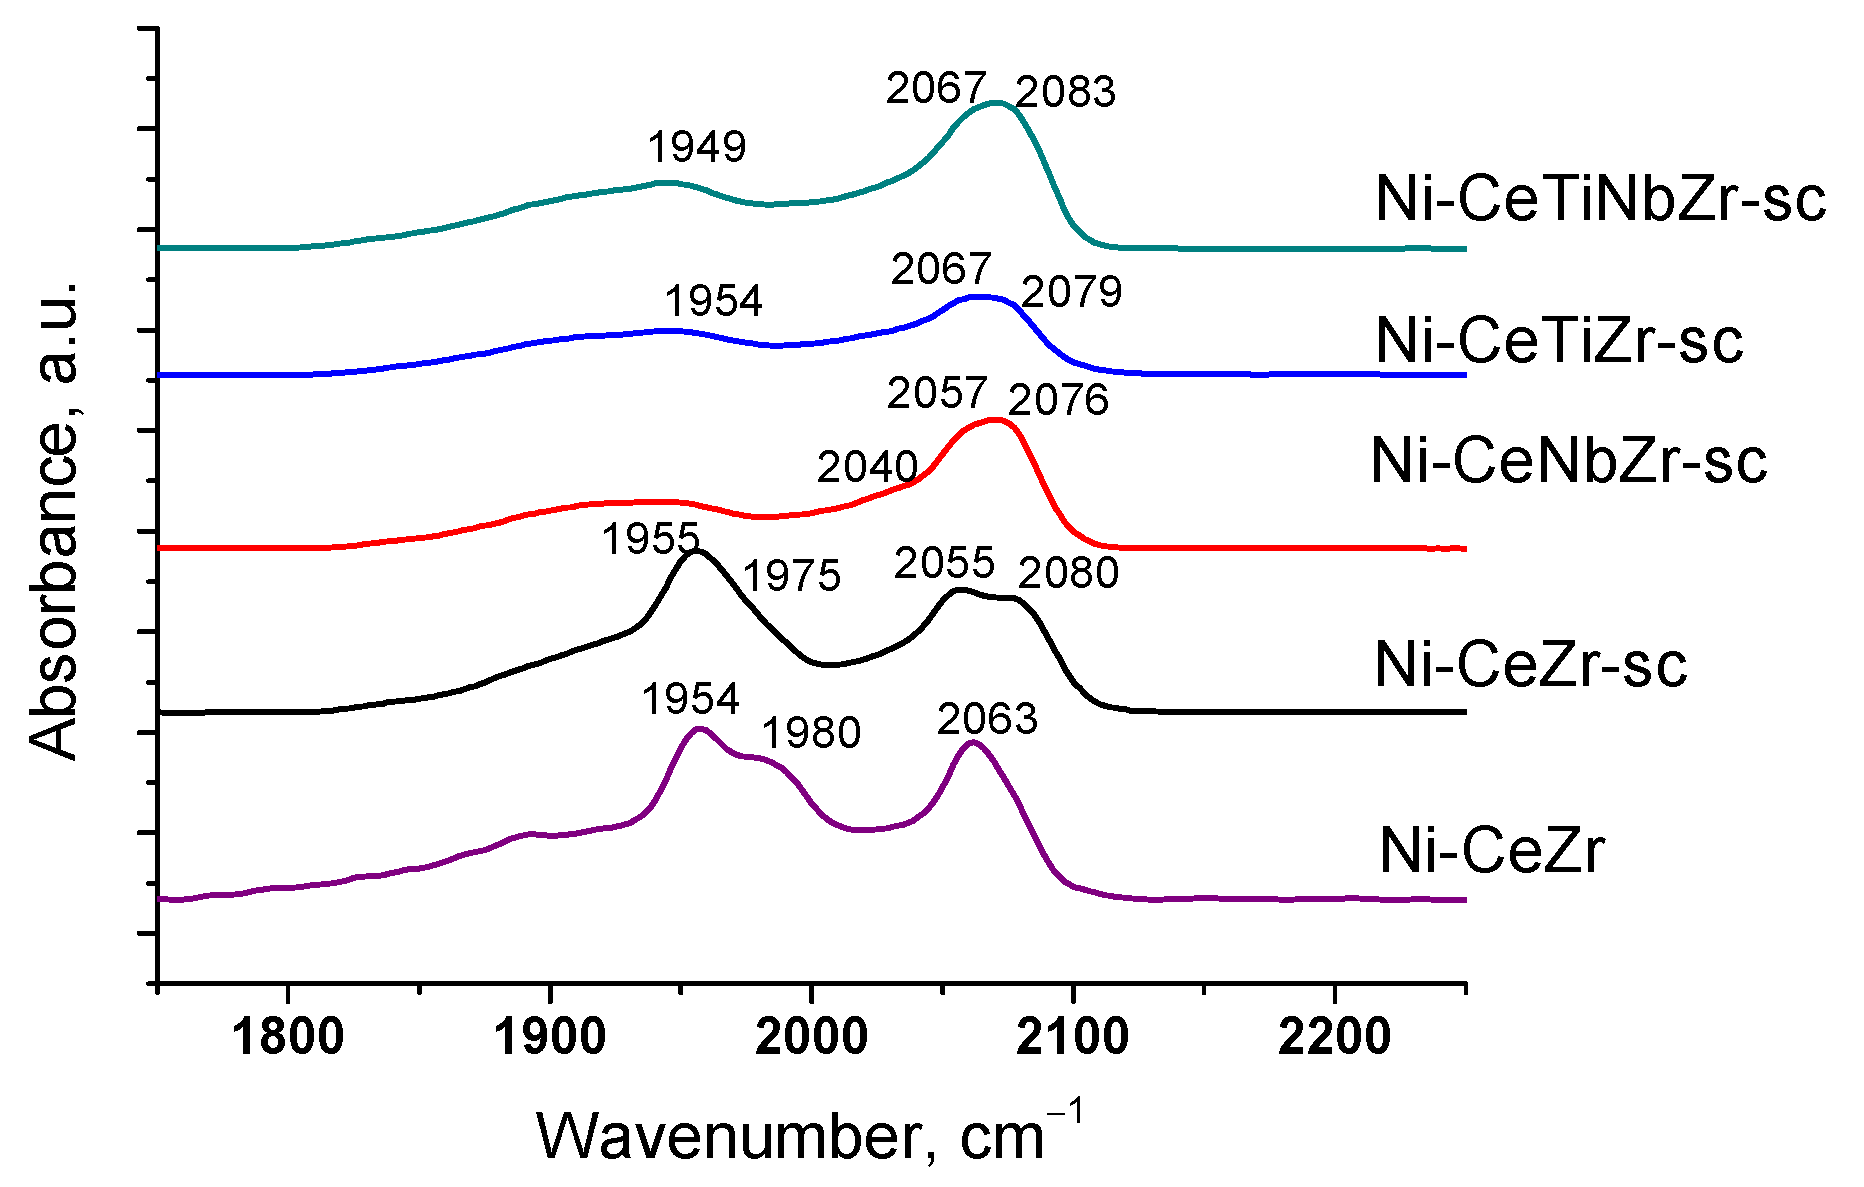
3.1.3. Study of Surface Sites by FTIR Spectroscopy of Adsorbed CO

The surface properties of catalysts preliminarily reduced in hydrogen were studied by IR spectroscopy of adsorbed CO. All spectra (Figure 2) contain absorption bands at ~2150–2160 cm−1 corresponding to OH-groups and carbonyl complexes of Ce4+ cations and a weak shoulder in the region ~2120–2130 cm−1 due to complexes with Ce3+ cations [53,54,55]. Such low intensity of Ce3+–CO bands suggests much lower surface concentration of adsorption sites of this type.
Incorporation of Ti and Nb cations into the ceria–zirconia lattice leads to a shift of the carbonyl band to higher frequency. It can be assigned to increase in the adsorption site strength, namely increasing Me4+–CO binding energy and at the same time decreasing the C-O bonding strength in the adsorbed species [8,56]. Low frequency bands at 2085–2095 and 1900–1957 cm−1 correspond to CO complexes with Ni0 sites [57,58].
After heating samples from −196 °C to room temperature (Figure 3), bands corresponding to CO complexes with support cations disappear due to a weak bonding strength of such complexes [55]. Absorption bands at 1839–1980 and 2027–2083 cm−1 are assigned to bridging and terminal carbonyls formed on the surface of Ni0 particles, respectively [57,58]. Concentrations of various types of surface carbonyls estimated from the spectra at room temperature are presented in the Table 4.
For undoped Ni-CeZr and Ni-CeZr-sc samples, high intensity bands of bridging carbonyls are observed. It is known that bridging carbonyls can be reactive in the Boudouard reaction, so existence of such sites can lead to carbon formation during dry reforming of methane [6]. In the case of supercritical series, introduction of Ti and Nb leads to decrease in amount of bridging carbonyls possibly due to decoration of metal particles by support fragments. For the doped citrate samples, no CO adsorption bands were observed in the spectra at room temperature, which may also be related to decoration of nickel particles by support oxide species.

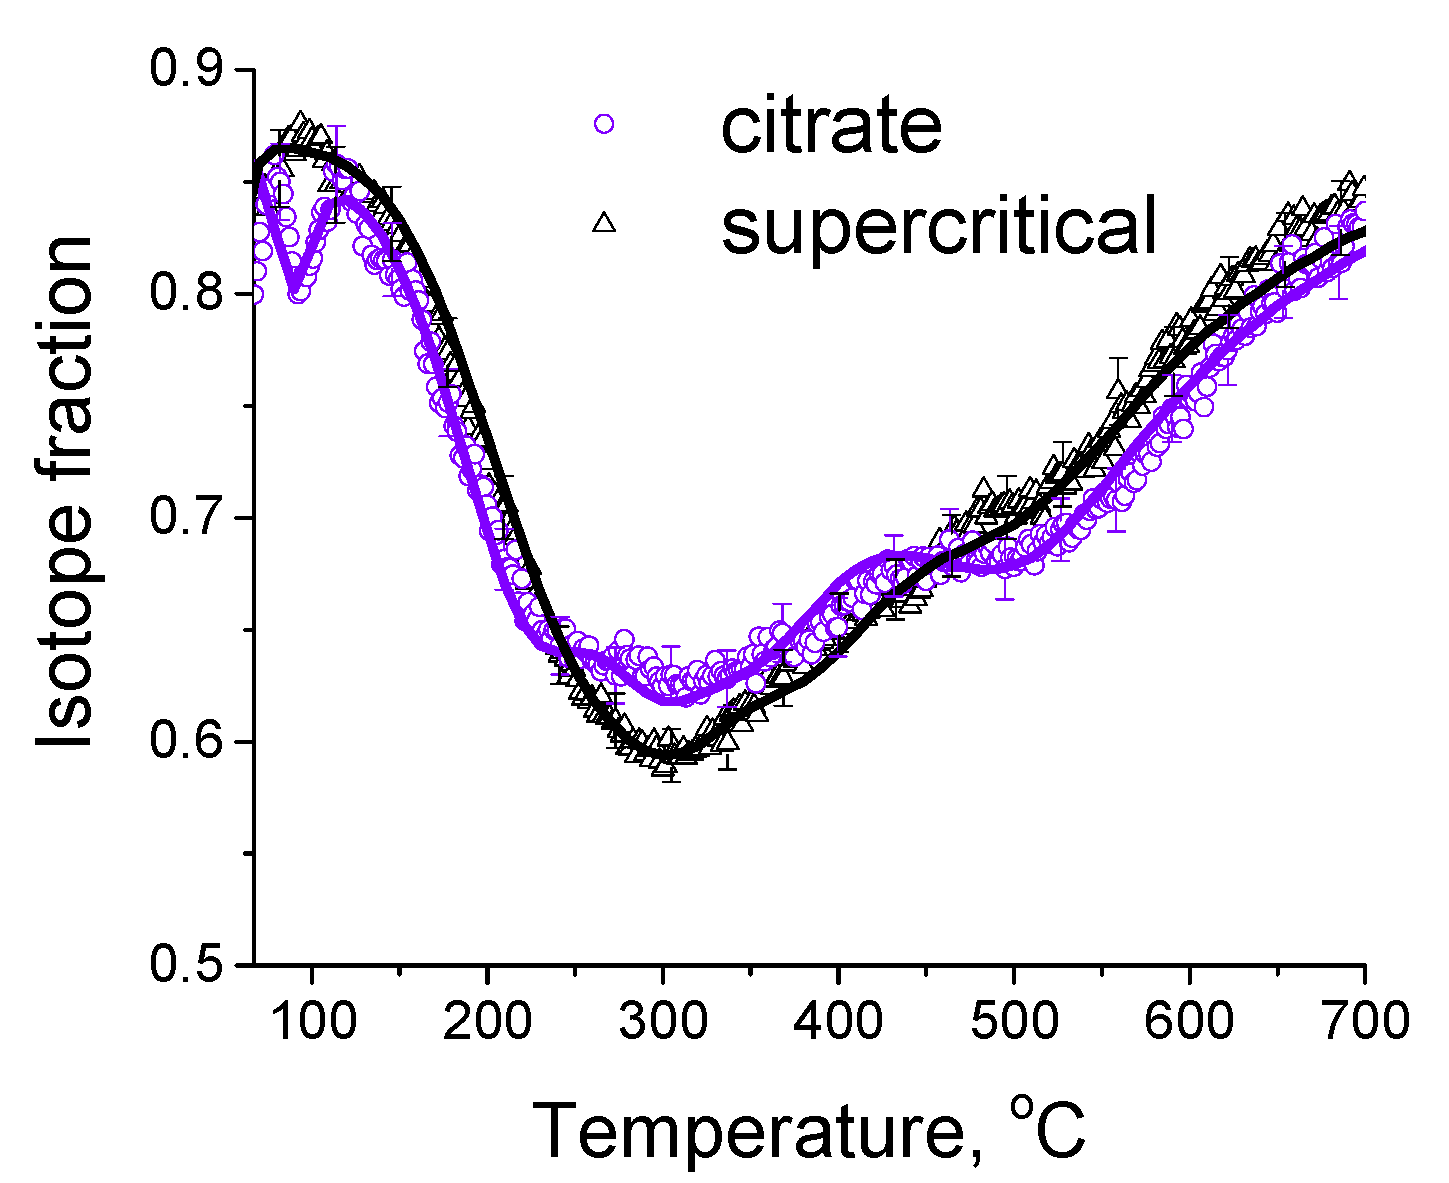
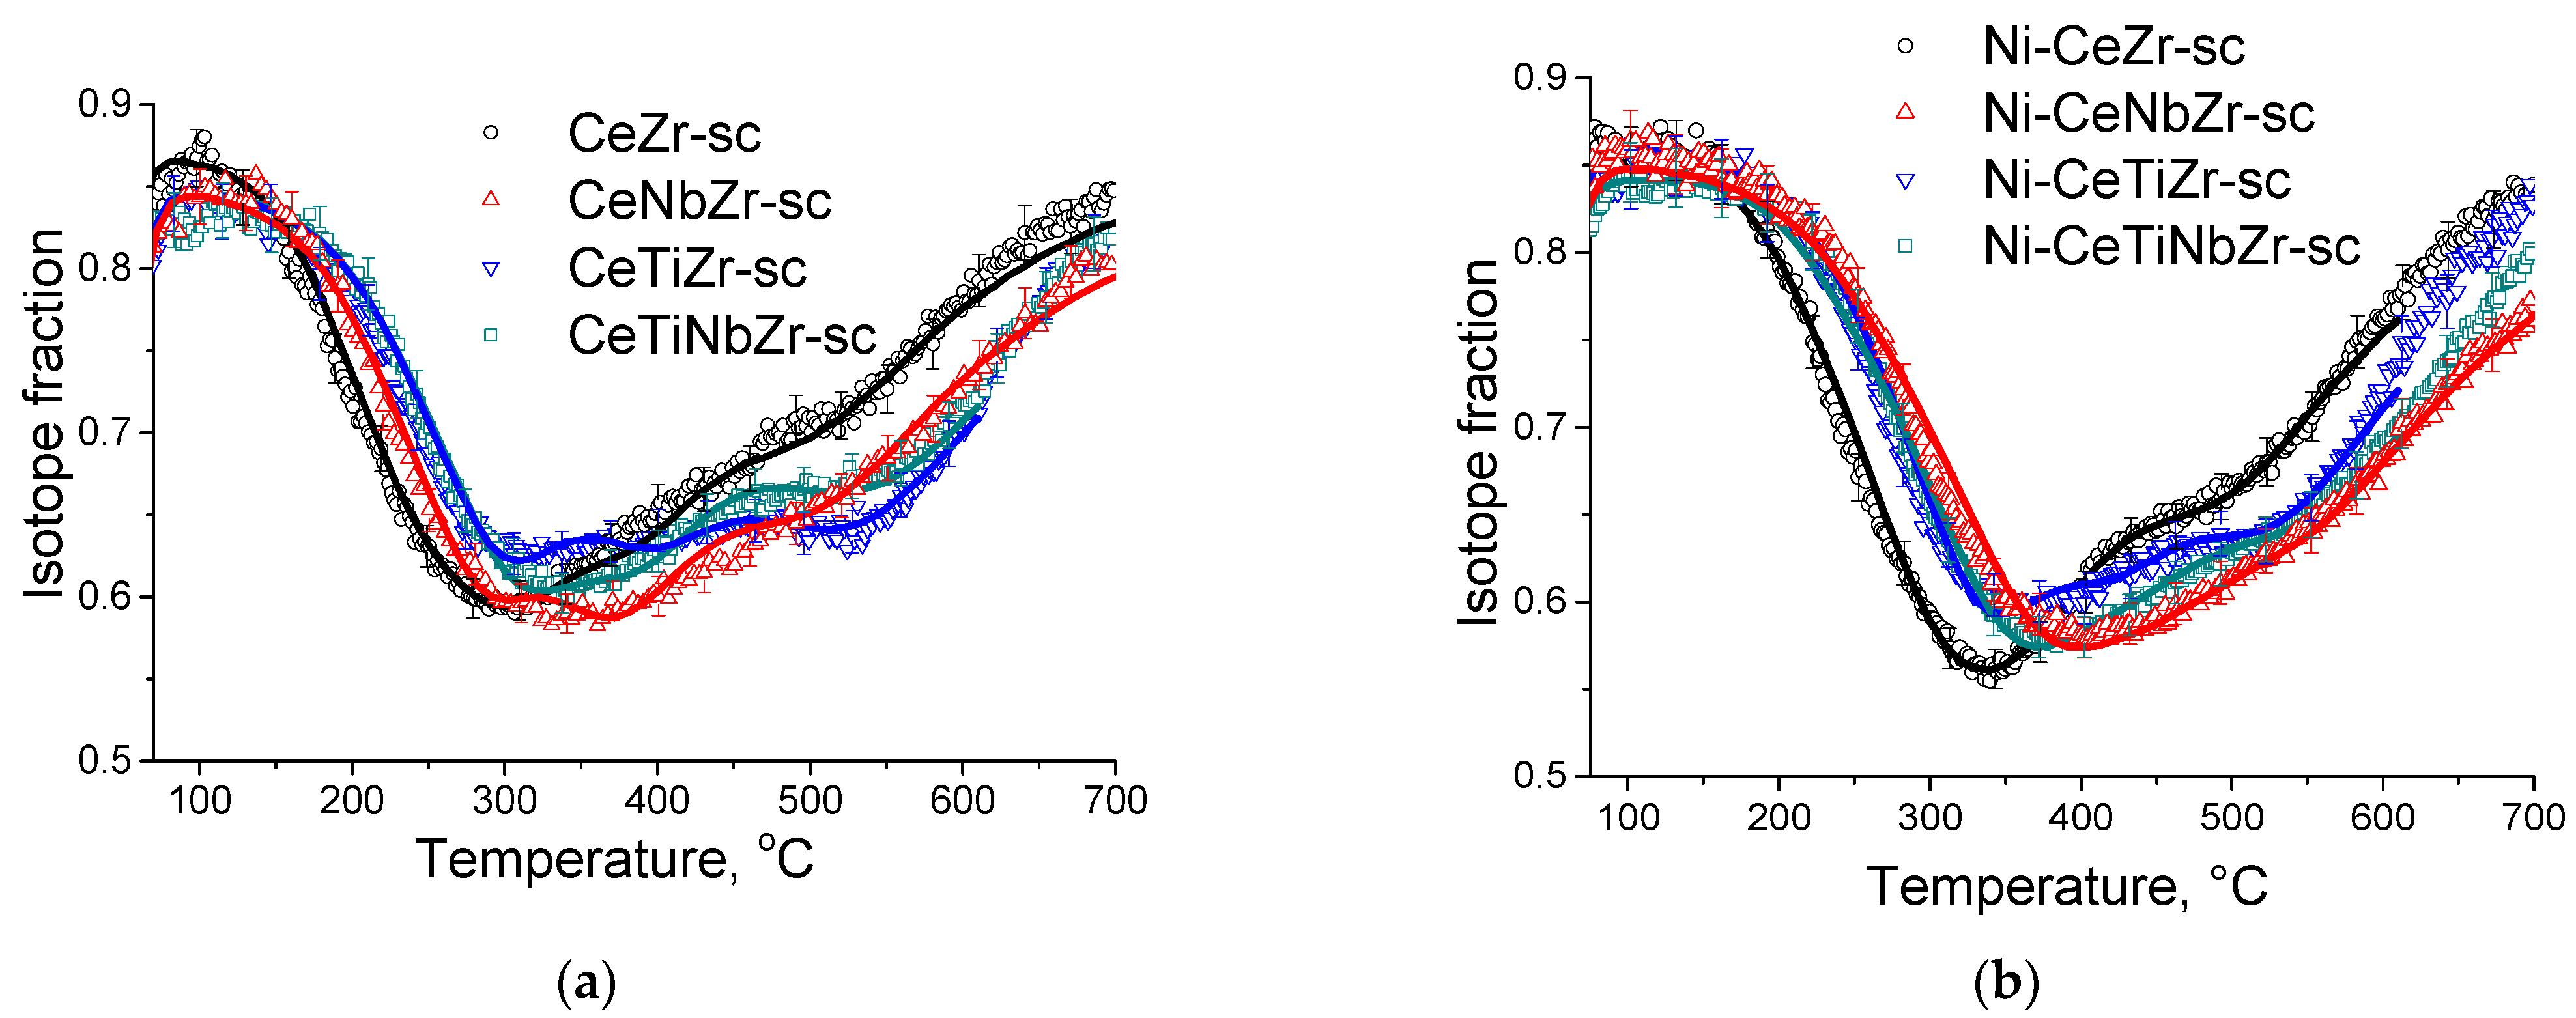
3.1.4. Study of Oxygen Mobility by Isotope Exchange with C18O2

In order to investigate the relationship between the catalytic activity and oxygen transport properties, the oxygen isotope exchange studies were carried out. To elucidate the effect of synthesis technique on oxygen transport properties, a comparison of initial oxide Ce0.75Zr0.25O2 samples synthesized by citrate route and by supercritical synthesis was carried out by the temperature-programmed isotope heteroexchange (TPIE) of oxygen with C18O2. The TPIE curves are presented in the Figure 4. The amount of oxygen substituted during TPIE run almost reached overall oxygen amount in the samples, i.e., almost all oxygen in oxide samples is involved in the isotope exchange. The small low-temperature (below 100 °C) minimum observed for the citrate sample is apparently related to the exchange of weakly bound surface oxygen. The rest part of TPIE curves is similar for both samples and can be characterized by a set of overlapping peaks, making evidence of non-uniformity of oxygen diffusivity in the sample bulk. Moreover, the oxygen is more non-uniform in the case of citrate sample, which is evidenced by two explicit peaks at 300 and 500 °C, while the second peak is weakly expressed for supercritical sample.
To describe non-uniform oxygen diffusivity in such fluorite samples, two parameters have been selected: weighted average tracer diffusion coefficient calculated according to the Equation (5):
(D/L2)over = Σ(θi *D/L2i)/100
θi is fraction of oxygen with tracer diffusion coefficient (D/L2i), along with a non-uniformity coefficient (β) determined as a ratio of the average tracer diffusion coefficient of 50% fraction of oxygen substituting relatively fast to the average tracer diffusion coefficient of the rest fraction of oxygen (Supplementary Materials).
In this case, (D/L2)over values were 5.2∙10−3 s−1 and 2.2∙10−3 s−1 at 600 °C, non-uniformity coefficient β values were 38 and 13 for citrate and supercritical samples, respectively. While recalculating Dover values assuming diffusion path length for spherical particles of L = 3V/S (where S is surface area, V is volume), these values almost match for both samples (Table 5). Hence, it can be concluded that using the technique of synthesis in supercritical media almost does not affect the average tracer diffusion coefficient, but leads to significant increase in uniformity of sample bulk oxygen diffusivity.
Based on these conclusions, samples prepared in supercritical synthesis are more engaging and were selected for further investigation by isotope exchange. Since oxygen mobility is provided by the support, both initial oxides and catalysts were investigated to determine the effect of supported nickel on oxygen mobility.
Figure 5a demonstrates temperature dependencies for 18O isotope fraction in CO2 observed during TPIE run for supports synthesized in supercritical media. TPIE curves for all samples are also characterized by a set of overlapping peaks. By using the method described above, the average weighted oxygen tracer diffusion coefficient and non-uniformity coefficient values were calculated. The estimations obtained are given in the Table 5. The following conclusions can be made based on the estimations obtained.
In contrast to expectations, while substituting 40% of Zr by Ti or by Ti + Nb, the bulk mean oxygen self-diffusion rate decreases by several times compared to Ce0.75Zr0.25O2. At the same time, non-uniformity of the sample bulk oxygen increases. It can be noted that the oxygen mobility, while substituting Zr by Ti + Nb, is higher compared to that for sample doped only by Ti. After substituting 40% of Zr by Nb, oxygen mobility and uniformity of oxygen diffusivity increase.
It should be noted that there is no unambiguous correlation between the number of oxygen vacancies estimated earlier in [30] and the coefficient of bulk oxygen mobility. This is not a contradiction since for mixed ceria–zirconia oxides the oxygen mobility is determined not only by the anion vacancies, but is defined by more complex set of defects and rearrangement of cations coordination spheres due to doping [59].
TPIE curves for the Ni-containing catalysts shift towards the higher temperature region compared to those for supports, which makes evidence of slowing the rate of oxygen isotope substitution in the samples (Figure 5b). Average weighted oxygen tracer diffusion coefficient Dover and non-uniformity coefficient β significantly decrease after Ni deposition. It is to be noted that for such a high specific surface area of the samples and, hence, small diffusion path length (1–2 nm), near-surface effects can significantly affect the rate of 18O isotope diffusion into the sample bulk. In this case, the nickel effect is probably related to decreasing the oxygen permeability of the near-surface layer in the support. As a result of limiting effect of the near-surface layer, the fastest component of diffusivity is blocked; hence, TPIE curves become smoother, indicating higher homogeneity of support oxygen.

3.2. Catalytic Studies in Methane Dry Reforming

Data of catalytic thermal cycles were published earlier in [30]. However, they are reproduced here for the convenience of the reader. Table 6 presents steady-state methane conversions in methane dry reforming during the thermal cycle at 600–750–600 °C. Graphical data of methane conversion variations are given in Supplementary Materials (Figure S1). Conversions of CH4 and CO2 (not shown) increase with the temperature. To check the thermal stability of catalysts, the maximum temperature during the reaction was selected to exceed their calcination temperature. The drop in catalyst activity during temperature decrease after overheating can be related to sintering of the active component or with the carbon formation on the catalyst surface and blocking of active sites.
In the series of citrate samples, the highest methane conversion at 750 °C is achieved over unmodified Ni-CeZr catalyst and reached 48%. According to the values of conversion at 750 °C, activity increases in the row: Ni-CeTiNbZr < Ni-CeTiZr = Ni-CeNbZr < Ni-CeZr. It should be noted that methane conversions on the Ni-CeTiNbZr sample at the cooling step are very close to those exhibited in the heating step, suggesting a high stability of this catalyst despite its low activity.
The highest activity among both series of samples was obtained for the supercritical Ni-CeTiNbZr-sc catalyst. The methane conversion over this catalyst at 750 °C reached 51%. The conversion at maximum temperature increases in the series Ni-CeNbZr-sc < Ni-CeTiZr-sc < Ni-CeZr-sc < Ni-CeTiNbZr-sc. The lowest activity drop during thermal cycle is observed for the Ni-CeTiZr-sc composition.
More detailed description of catalytic tests and kinetics is given in our earlier works [30,31].

3.3. Characterization of Spent Catalysts

3.3.1. Structural and Textural Studies of Spent Catalysts

Diffraction patterns of catalysts after tests in methane dry reforming are presented in Figure 6. The ceria–zirconia mixed oxide structure persists under reaction conditions. Trace amounts of zirconium oxide in citrate samples are due to preparation features and remained unchanged after reaction. The weak peak at 26° corresponding to graphitic carbon (PDF 075-0444) appeared for supercritical catalysts modified by Ti that may be due to a higher content of carbon deposits on their surface.
Fluorite particles size increased for the Ni-CeZr and practically did not change for other citrate samples (Table 2). Hence, it can be suggested that incorporation of titanium and niobium increases stability of oxide particles against sintering. The specific surface area change correlates with the crystallite sizes. It decreased significantly for the unmodified catalyst while remained almost the same for other catalysts or even increased for the sample doped by Ti, which may be due to formation of carbon deposits. Changes in fluorite particle size for all supercritical catalysts are minor.
Nickel oxide is reduced during hydrogen pretreatment with formation of metal particles. Peaks corresponding to Ni0 state are observed at 45 and 52°. Nickel metal particle size coincides with that of NiO for Ni-CeNbZr and Ni-CeTiZr compositions, while increased approximately threefold for Ni-CeZr and Ni-CeTiNbZr in both series of catalysts. It suggests that individual Nb or Ti addition prevents nickel particles from sintering. A higher Ni dispersion for samples doped with Ti or Nb correlates with a higher surface Ni content obtained from the XPS data (Section 3.1.2).
It is interesting that Ni particle sizes after the reaction are close in each pair of samples, regardless of the support preparation method and its specific surface area.

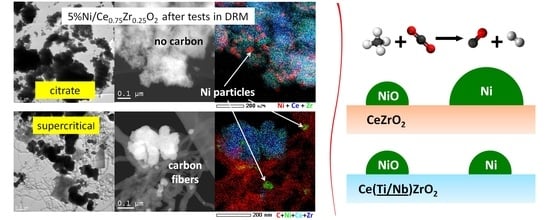
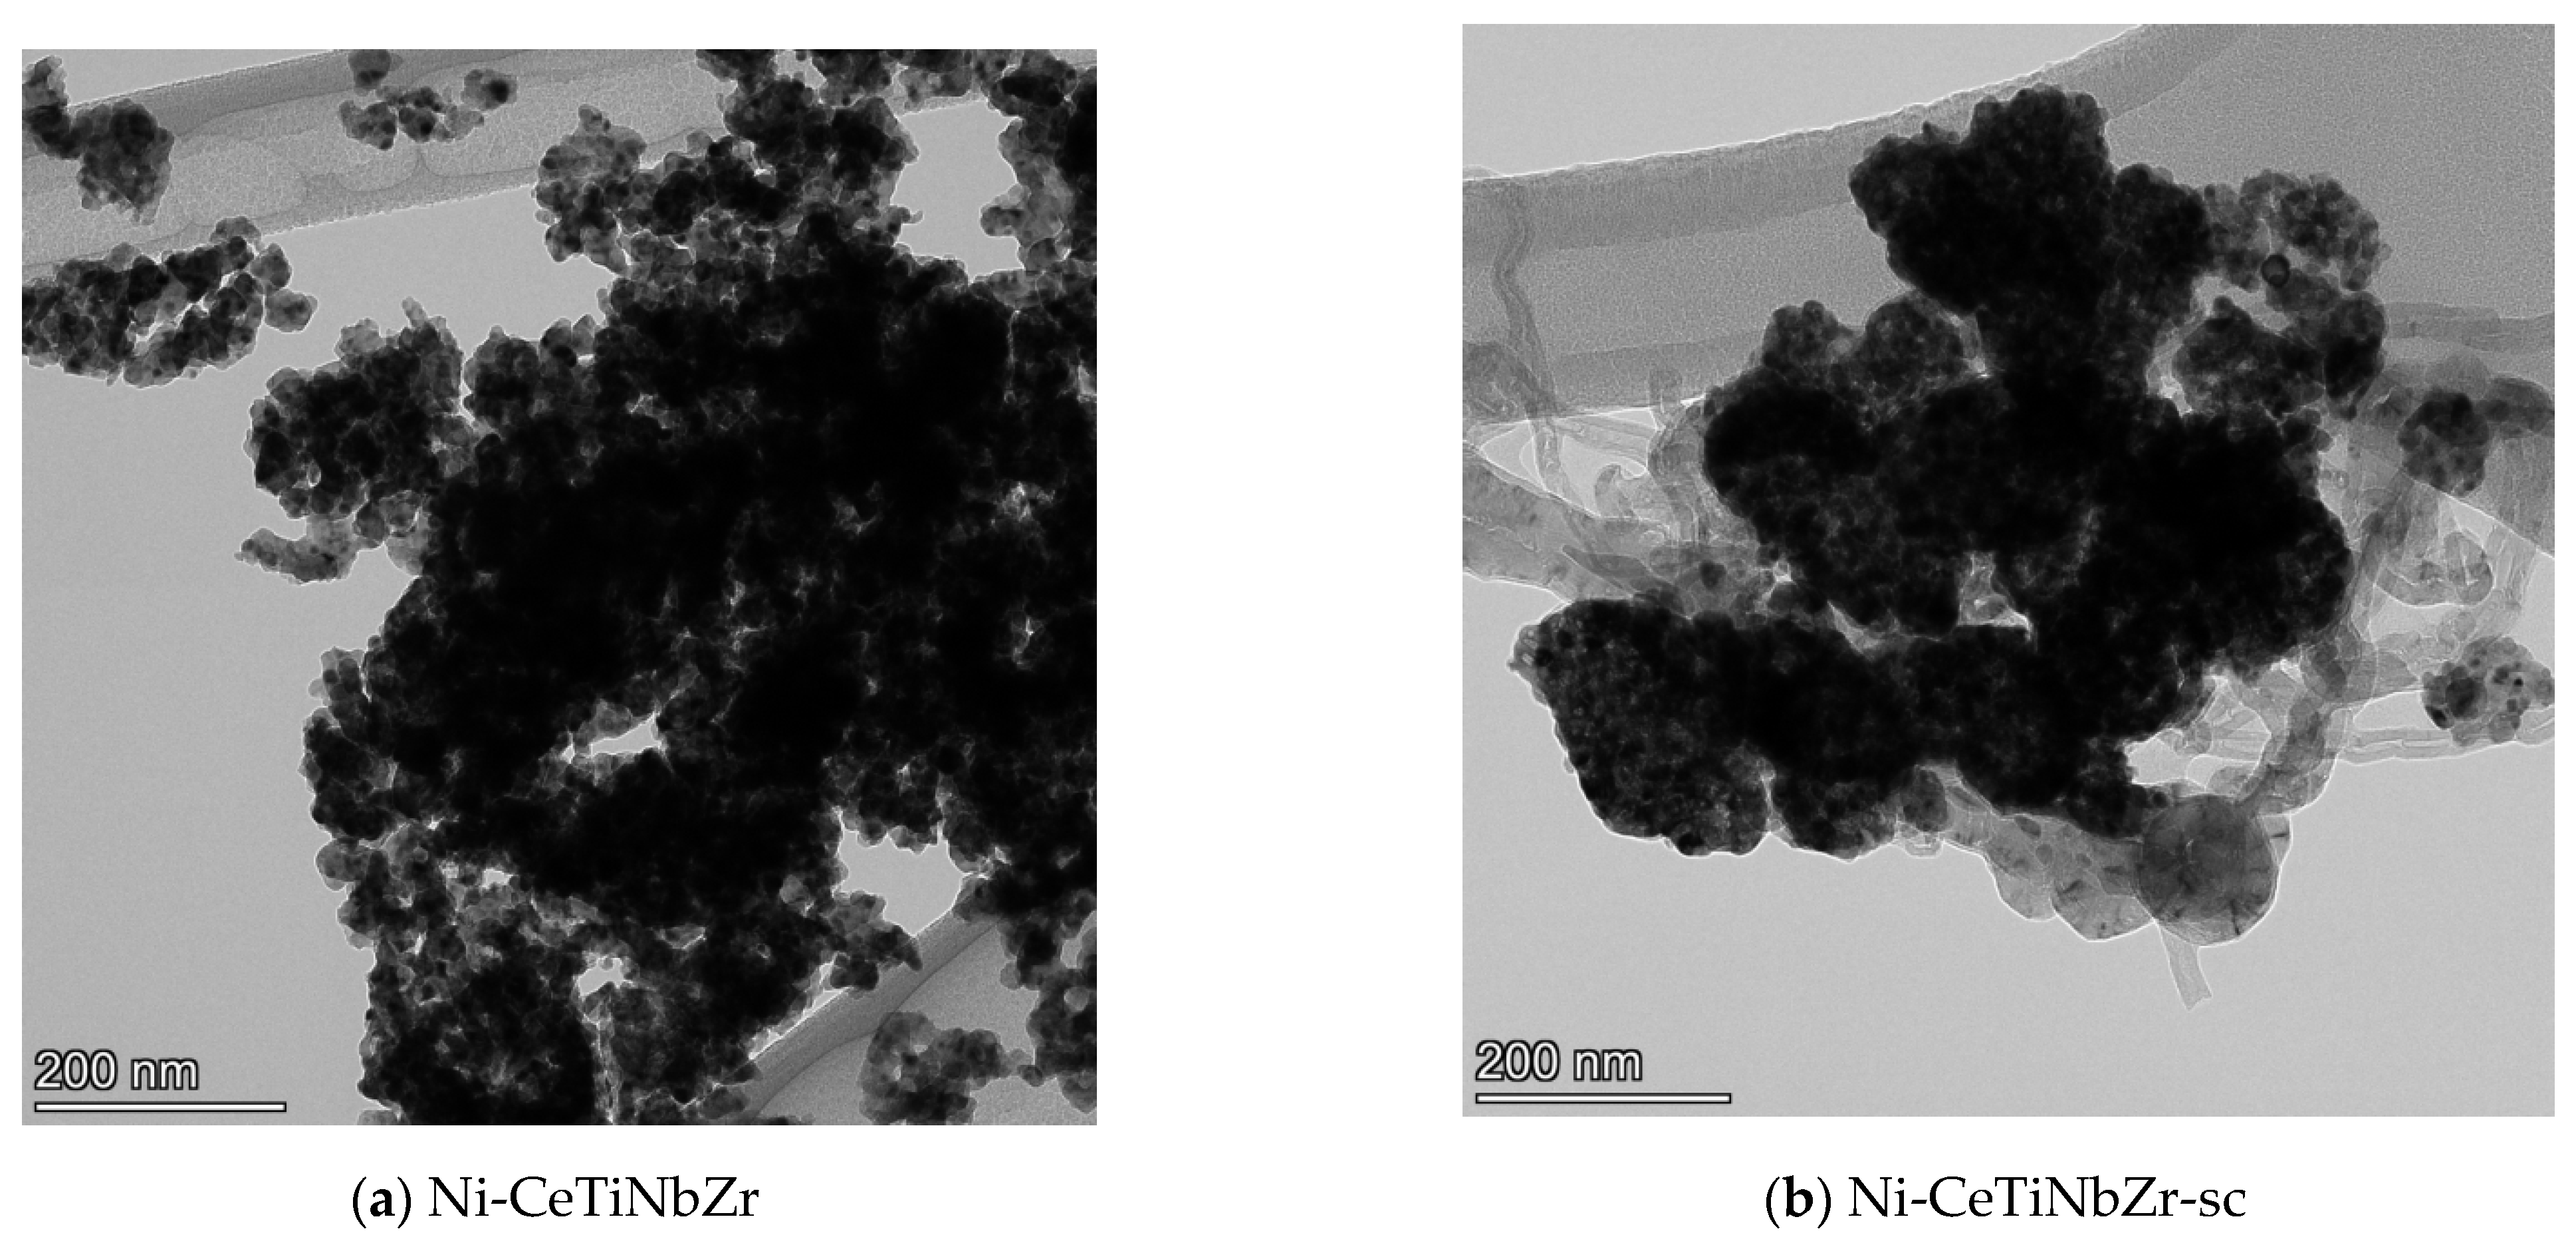
3.3.2. Study of Spent Catalysts by TEM

The morphology of fresh and tested-in-methane dry reforming catalysts was investigated by transmission electron microscopy. Data for fresh catalysts were presented in [30]. Samples are comprised of agglomerated particles with crystallite size ~10 nm for citrate preparation method and 15–20 nm for supercritical synthesis.
Figure 7 shows TEM images of Ni-CeTiNbZr catalysts after tests in methane dry reforming. Images of other catalysts are presented in the Figure S2 in Supplementary Materials. All samples prepared by supercritical synthesis are covered by loose carbon and carbon filaments, while no carbon is observed for catalysts based on supports prepared by citrate method. Some carbon deposits are present only on the Ni-CeNbZr sample (Figure S2).
During hydrogen pretreatment before reaction and subsequently under reaction conditions, nickel oxide is reduced to metallic nickel. For samples prepared by citrate route, nickel particles are in contact with the oxide support (Figure S3a) suggesting strong metal–support interaction. In the case of supercritical synthesis, some metal particles are separated from the support (Figure S3b). This is due to the mechanism of carbon formation during which carbon is diffusing through the Ni particles, and formation of carbon filaments leads to their detachment from the surface [60]. No nickel decoration by oxide support fragments was observed. However, this may be due to the locality of the method.
A significant effect of the support synthesis method on nickel distribution is observed only in the case of Ni-CeTiZr composition (Figure S4). For the citrate method, more uniform and dispersed distribution of nickel is obtained, whereas for supercritical sample there are well-formed metal particles on the catalyst surface. For other samples, a broad particle size distribution is observed.

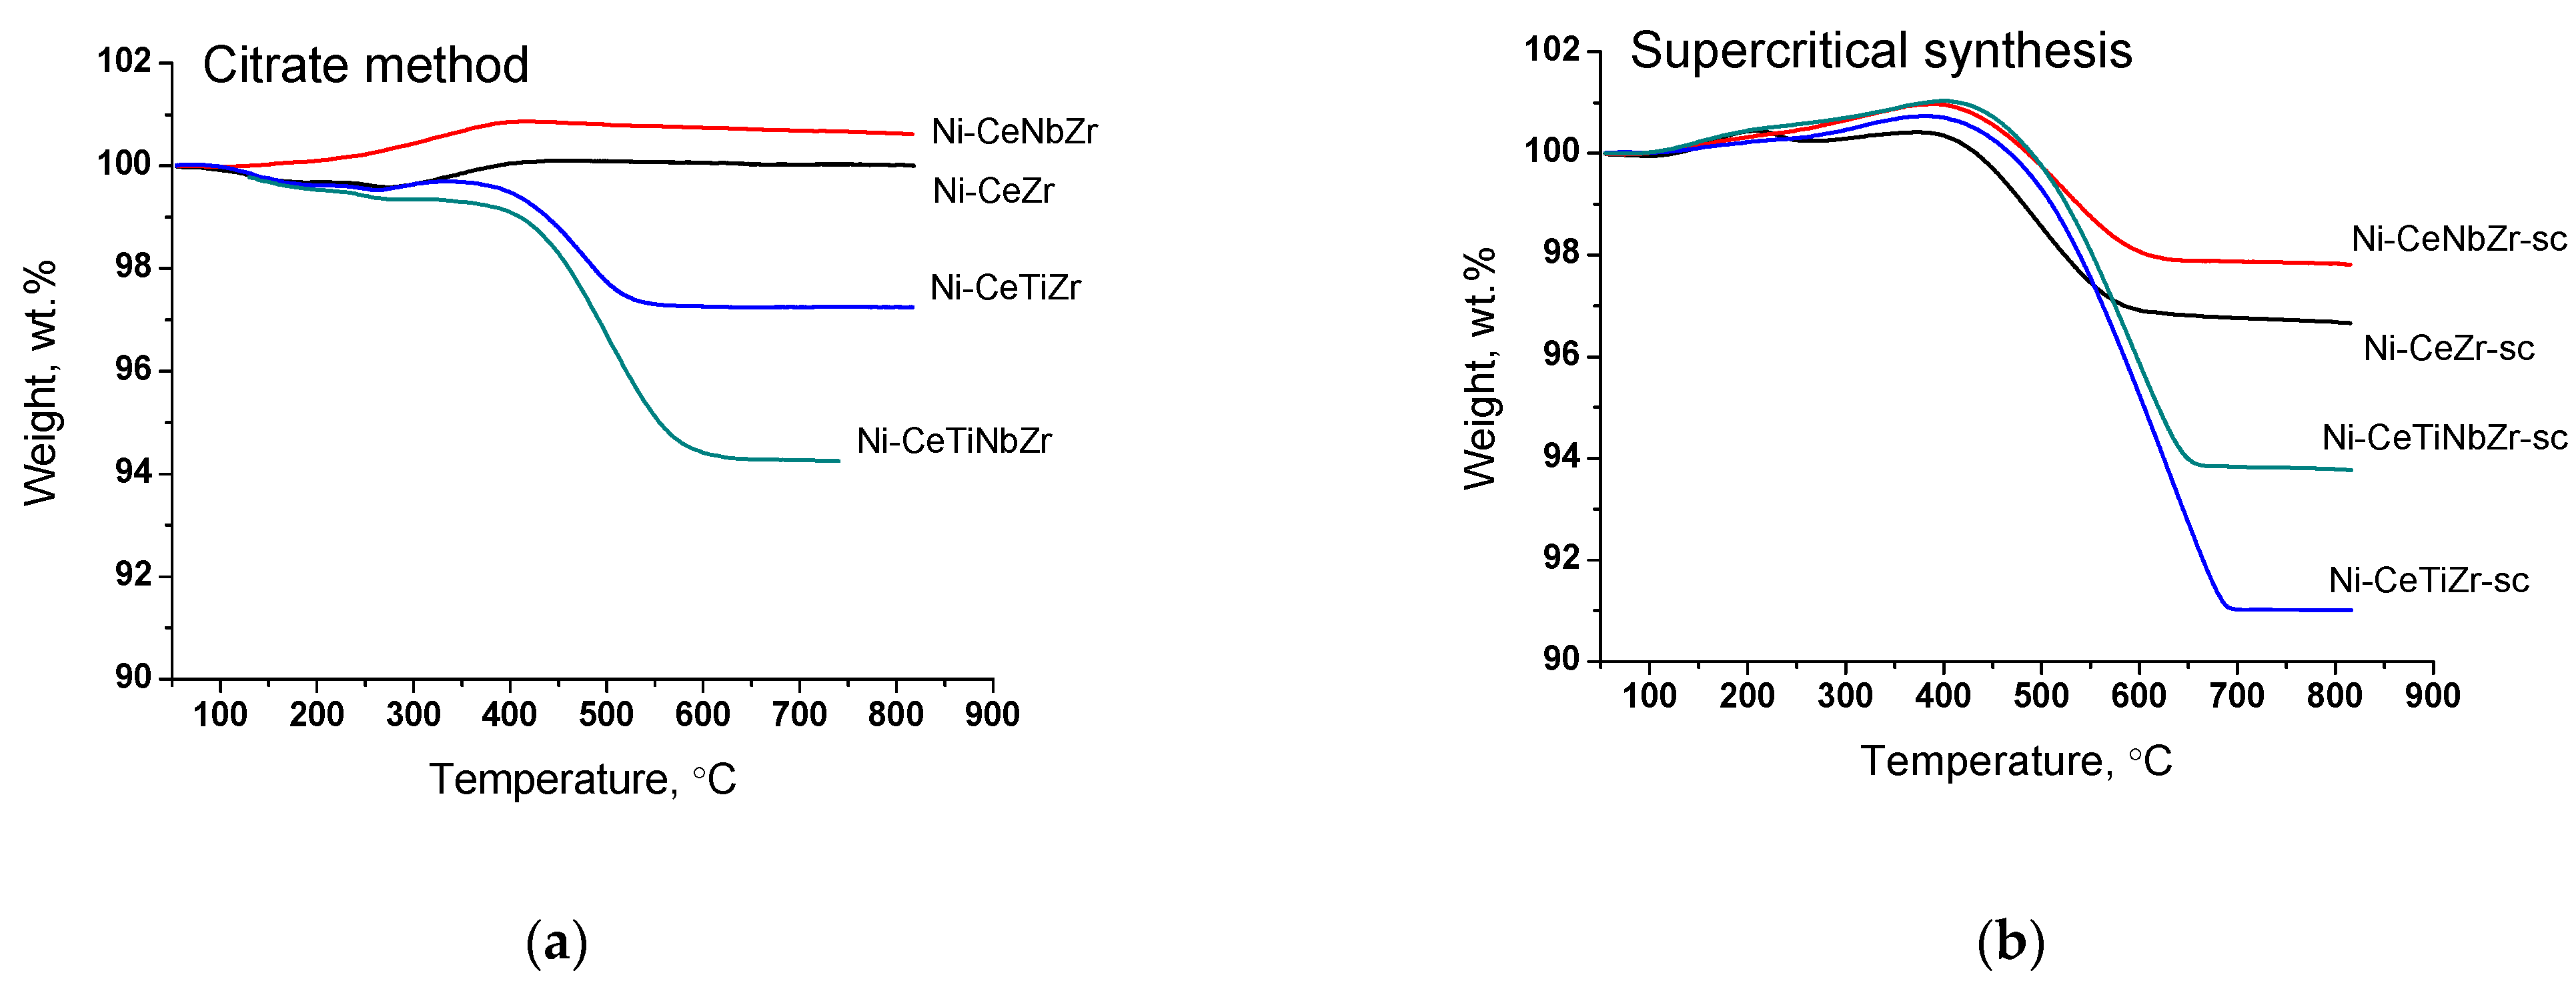
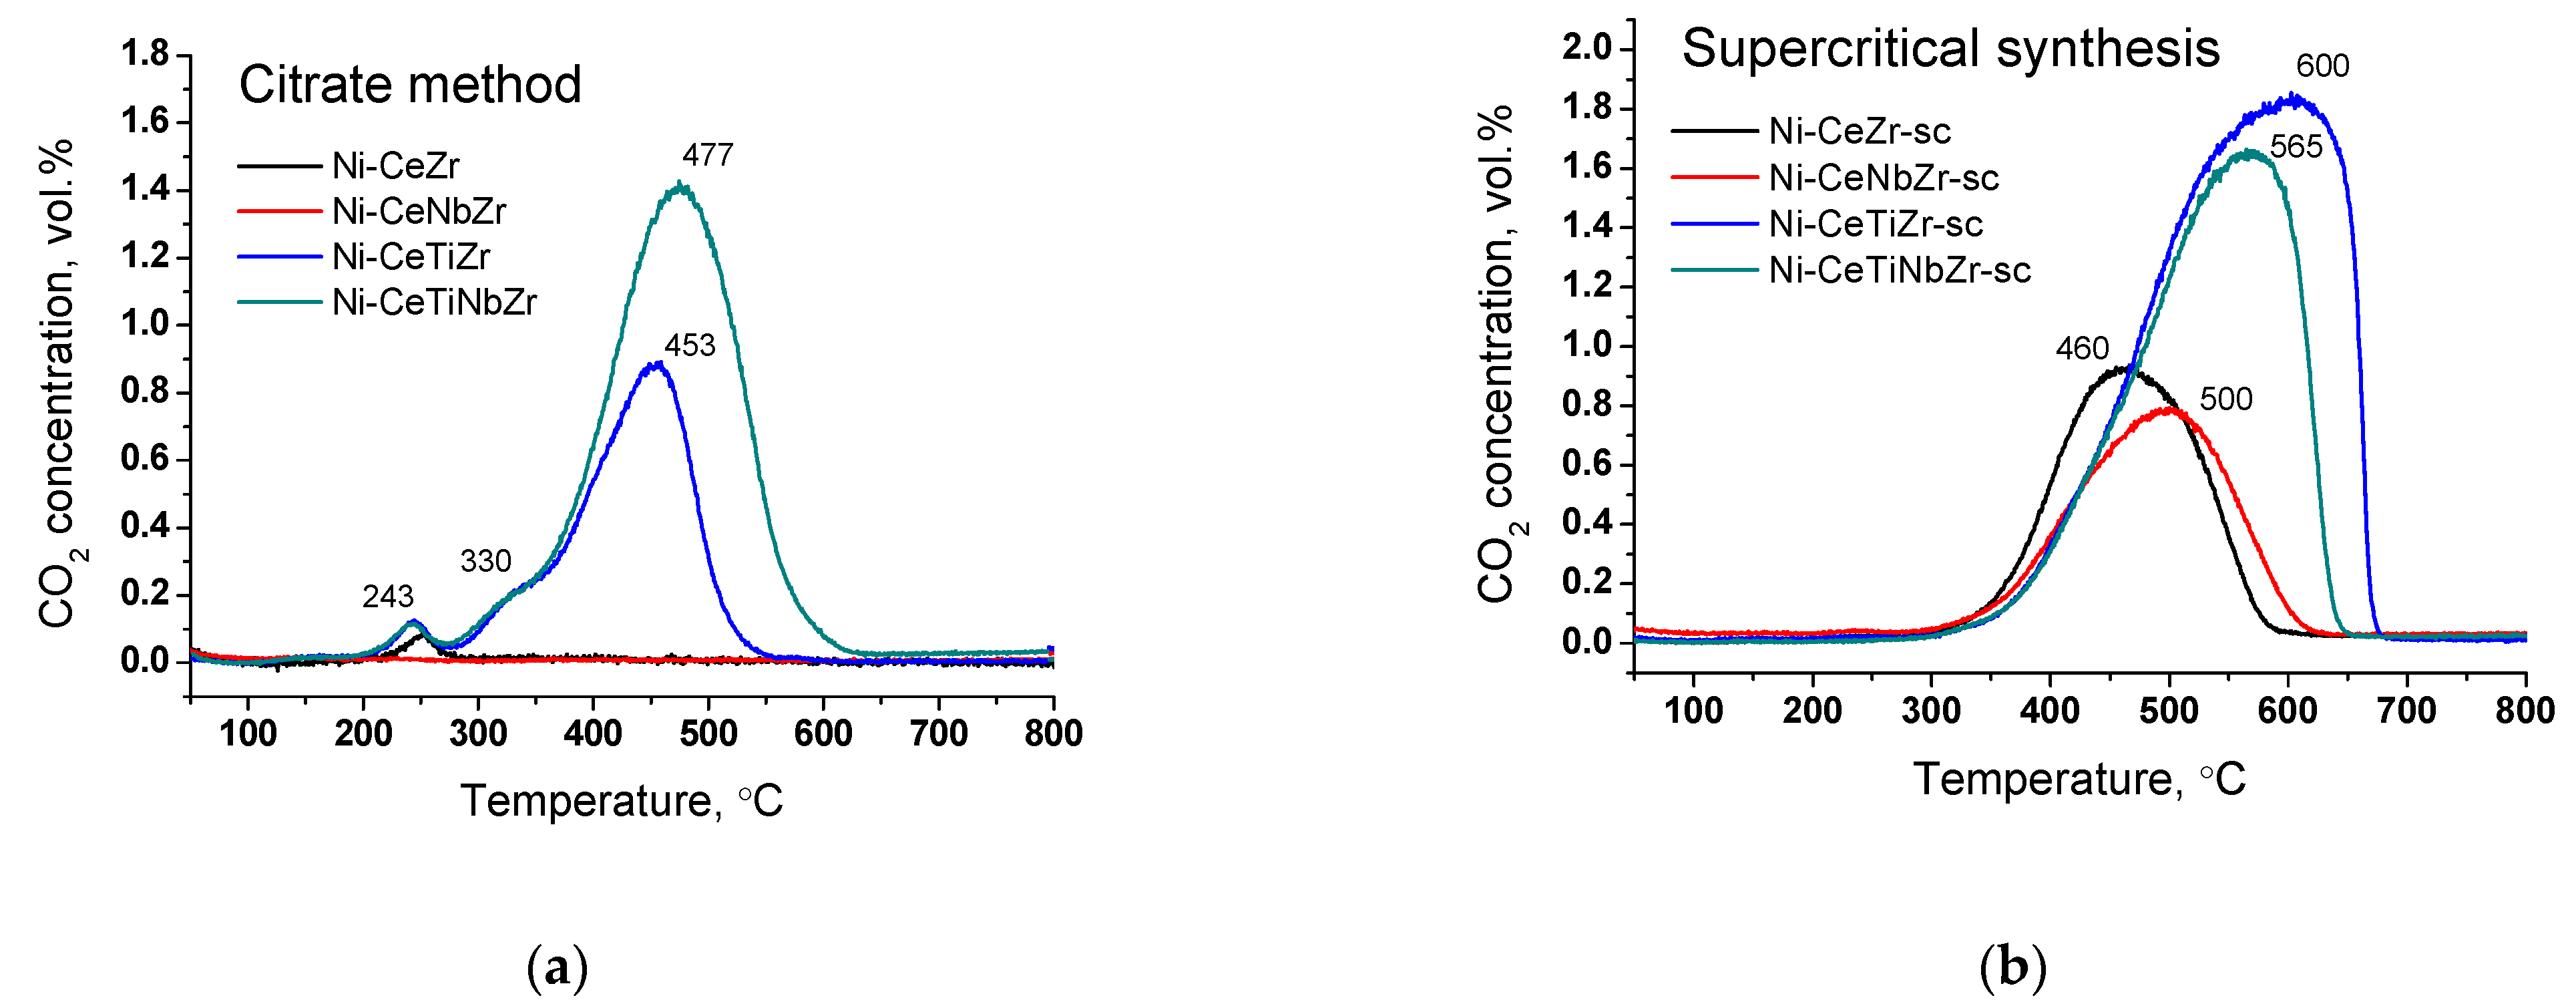
3.3.3. Study of Carbon Deposits by TGA

The amount and nature of coke deposits formed during tests in methane dry reforming were investigated by TGA with mass-spectrometric analysis of effluent gases. The data are presented in the Table 7. Figure 8 presents curves of weight change obtained during TGA. For all samples, the mass increase over 100% at temperature up to 400 °C is observed due to oxidation of metal Ni° to Ni2+ and Ce3+ to Ce4+ [61]. A higher mass increase for catalysts obtained in supercritical conditions may be related to a higher amount of oxygen vacancies (and, thus, Ce3+ cations) in their lattice as was shown in our previous work [30] and corresponding ability to take in more oxygen.
The weight loss of the spent catalysts is associated with the removal of carbon deposits or their precursors (CHx or CHxOy species) from the surface. The mass increase for citrate Ni-CeNbZr sample may be observed since there is no removal of carbon deposits, but oxidation of Ni0 and Ce3+ cations occurs. In both catalysts’ series, the lowest amounts of carbon deposits were obtained for unmodified Ni-CeZr and Ni-CeNbZr compositions. It correlates well with the oxygen diffusion coefficients estimated from the isotope exchange experiments for supercritical catalysts, which were higher for these two compositions and turned out to be significantly lower for titanium-doped samples.
It was shown that Ti addition leads to a significant increase in the amount of carbon. Similar correlations were also observed in the literature. In the work [62], the authors investigated effect of Ce/Ti ratio on catalytic activity and stability of Ni/CeO2–TiO2 catalyst and showed that with increasing Ti content the degree of surface carbonization also increases. Similar results were obtained for ethanol steam reforming catalysts in [63]. It was demonstrated in [64] that stability to coking of 5% Ni/Ce1-xTixO2 catalysts significantly decreases with increasing Ti amount from 20 to 50% due to decreased (sub)surface lattice oxygen mobility as was shown by transient 16O/18O isotopic exchange experiments.
At the same time, there is no obvious relation between oxygen diffusion coefficients and catalysts’ activity in the dry reforming of methane in present work. This is probably due to the fact that diffusion of bulk oxygen is sufficiently high for all our ceria–zirconia catalysts and it is not the rate-determining step [65,66].
The use of supports prepared in supercritical conditions resulted in formation of a larger quantity of carbon. It is an unexpected result since Ni crystallite sizes obtained from XRD data are close for both catalysts series. The possible explanation is less strong metal–support interaction which resulted in detachment of nickel particles from the oxide support, as was shown by microscopy data, and less effective carbon gasification.
It is known that the temperature of coke oxidation depends on its structure. Figure 9 shows change in CO2 concentration during oxidation of spent catalysts in TGA experiments. For all citrate samples (except Ni-CeNbZr for which there was no carbon observed), there is a low-temperature peak at ~240 °C corresponding to the removal of amorphous carbon [16,17,18].
The shoulder at 330 °C and peak at 450–480 °C for Ti-doped citrate catalysts can be assigned to oxidation of carbon species with a higher degree of graphitization [16,17,18]. All supercritical samples have only one peak of CO2 release. Carbon oxidation occurs in the region of 460–500 °C for Ni-CeZr-sc and Ni-CeNbZr-sc samples and shifts towards higher temperatures of 560–600 °C for both catalysts modified with Ti that corresponds to oxidation of graphitic carbon [17,18]. Increased temperature of carbon removal corresponds to increased degree of graphitization of carbon deposits that makes them less prone to oxidation [17].
Summarizing, it was shown that use of supports obtained in supercritical alcohols leads to the formation of more ordered carbon in larger quantities compared to citrate samples, which may be due to stronger metal–support interaction for the last ones, as was shown by microscopy data. For both catalysts’ series, there is no correlation between the carbon amount and nickel crystallite size or XPS results. However, there is a relationship between the amount of carbon deposits and oxygen mobility for the studied samples. For supercritical catalysts, a decreased amount of carbon was obtained for samples with higher oxygen diffusion coefficients, suggesting that for our samples oxygen mobility plays more important role than nickel dispersion.

3.4. Long-Term Stability Tests of Catalysts Prepared by Supercritical Synthesis

3.4.1. Long-Term Stability Tests

Since the highest activity in the temperature cycle DRM tests (Section 3.2) was observed for samples prepared in supercritical media, we decided to conduct long-term tests for 25 h to check their stability. The Figure 10a shows the values of reagents conversion and products yield after 25 h of catalyst operation at 700 °C. For all catalysts, the CO2 conversion is higher than the CH4 conversion due to occurrence of side reverse water–gas shift reaction (Equation (2)).
Catalysts doped with both titanium and niobium showed higher activity compared with the unmodified sample. Methane conversion increases in the row Ni-CeZr-sc < Ni-CeTiZr-sc < Ni-CeNbZr-sc = Ni-CeTiNbZr-sc.
Initial activity increase in the first half-hour of catalyst operation is associated with the establishment of its steady-state (Figure 10b). After reaching the steady-state, sharp activity drop is observed for all compositions in the first three hours. In the remaining time, activity decrease is slower and amounts to 10–13% of methane conversion for all samples. The change in hydrogen yield for all samples has the similar character as methane conversion (Figure 10c). The highest activity at the end of the tests was observed for Ni-CeNbZr-sc and Ni-CeTiNbZr-sc samples. They provided methane conversion of 57% and a hydrogen yield of 30%. The lowest total activity decrease, by 16% in methane conversion, was observed for Ni-CeNbZr-sc sample.
A higher H2/CO ratio (Figure 10d) at the beginning of tests may indicate a greater contribution of carbon formation reactions—methane cracking (Equation (3)) and/or Boudouard reaction (Equation (4)). Therefore, it can be suggested, that active carbon formation accompanied by sharp drop in catalytic activity occurs in the first few hours of the DRM reaction; after that, catalysts demonstrate quite stable operation.

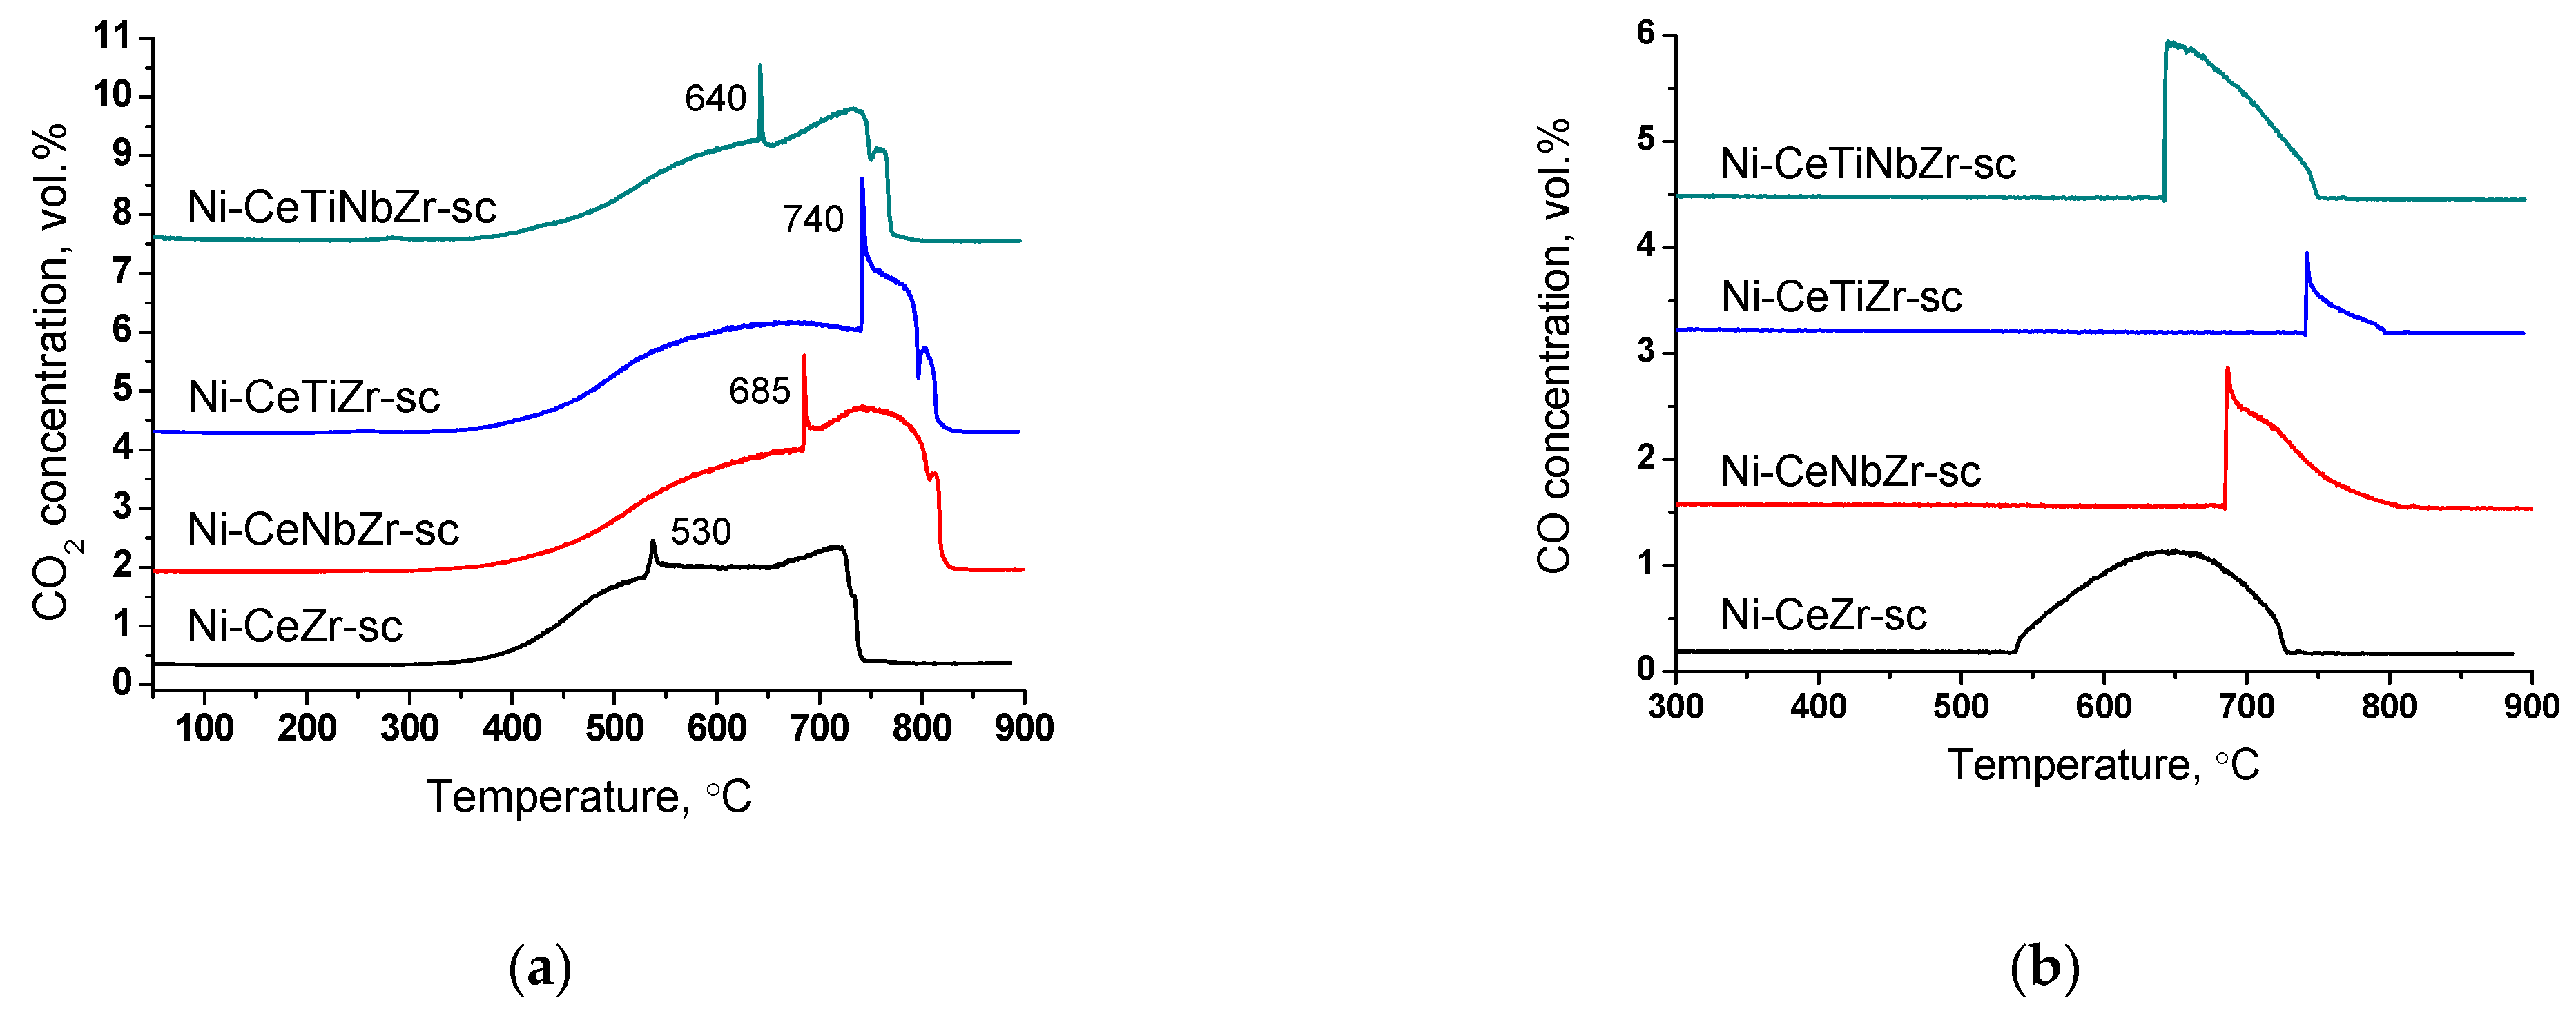
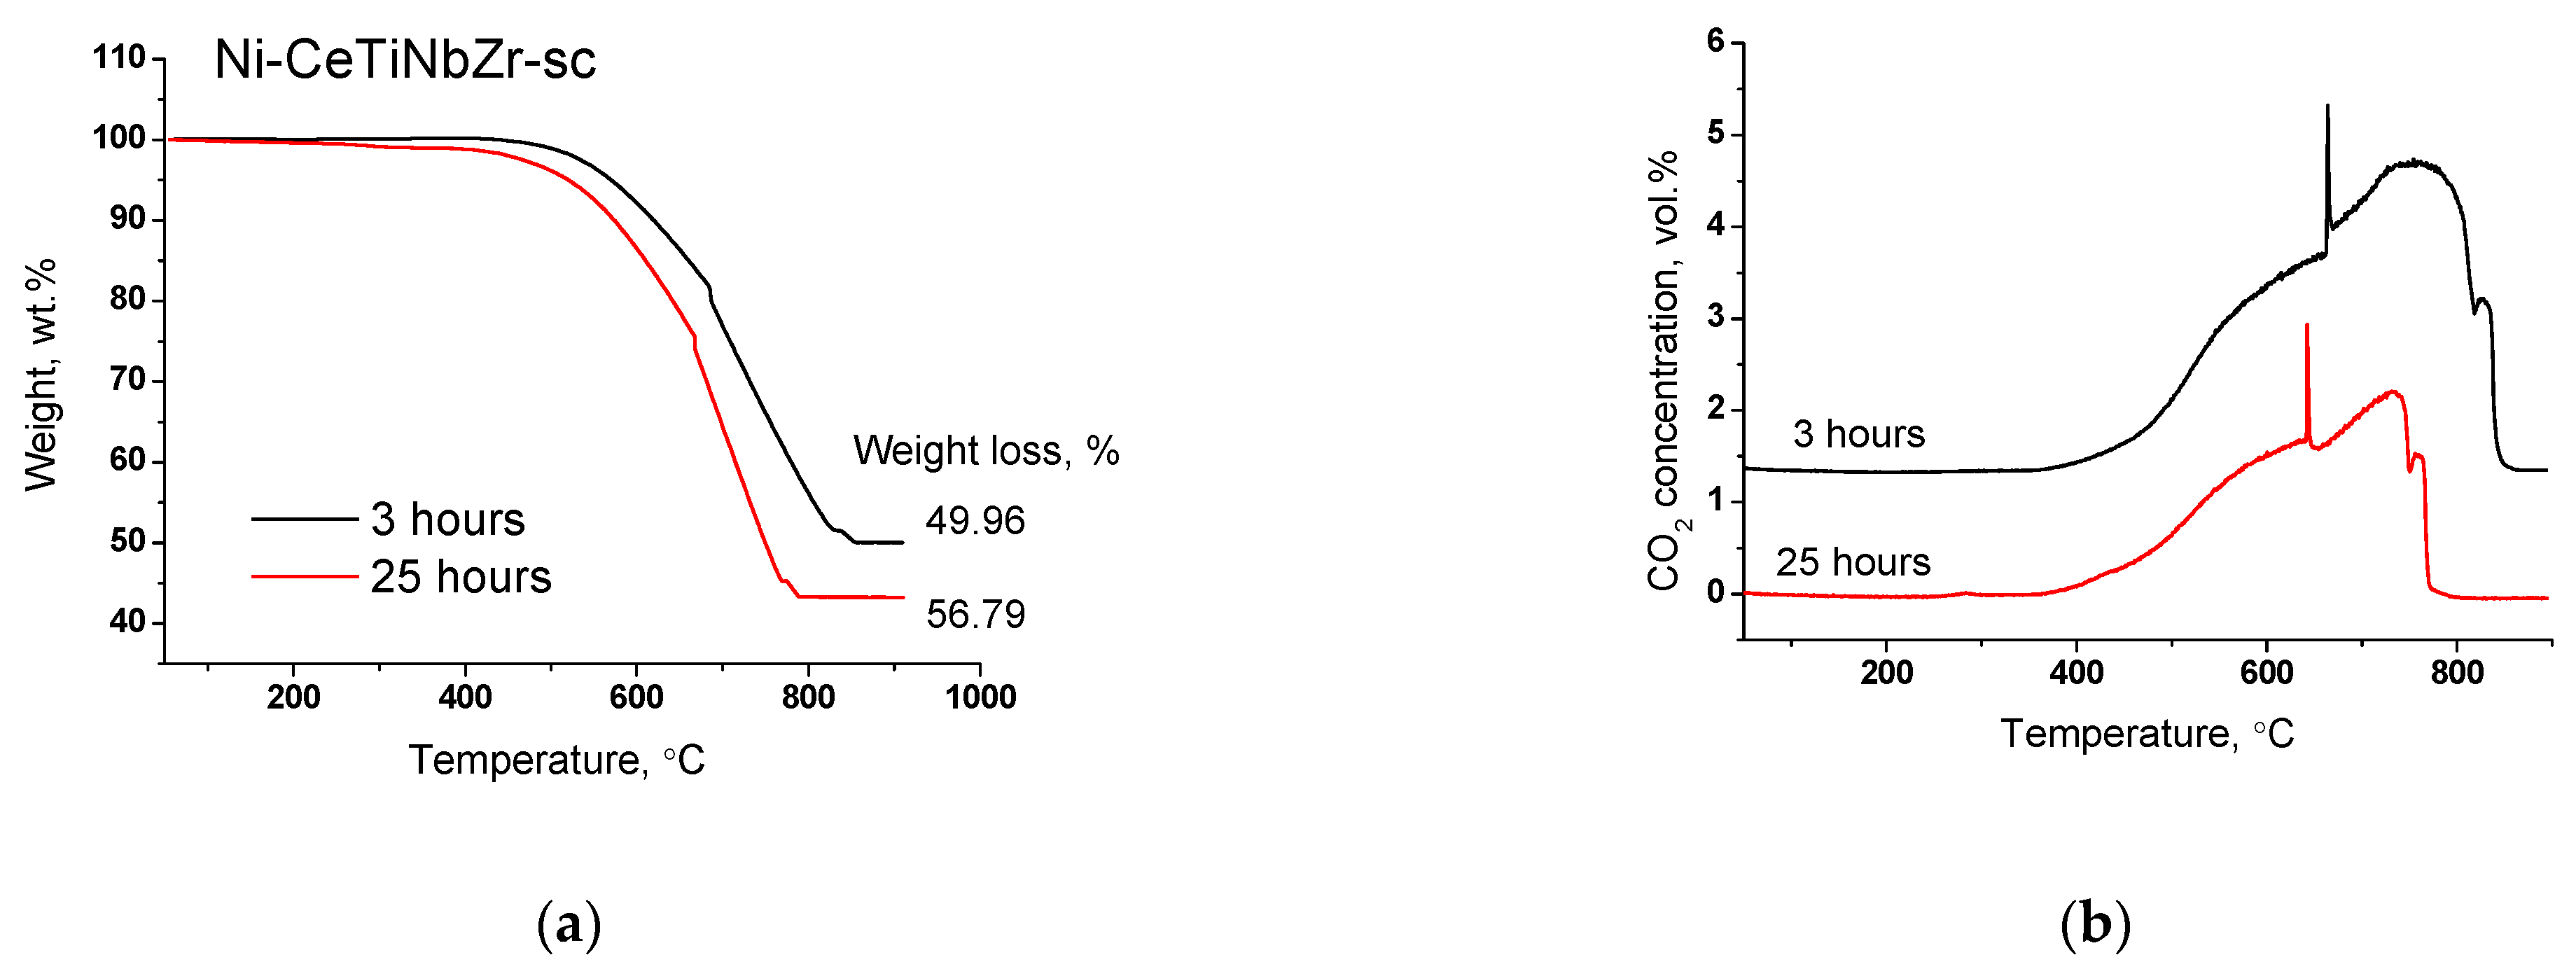
3.4.2. Study of Carbon Deposits after Long-Term Tests by TGA

Results of TGA experiments of catalysts after long-term stability tests in DRM are presented in Figure 11 and Figure 12, and in Table 7. There are several peaks of CO2 release (Figure 12a) indicating the existence of various types of carbon. For all samples, CO2 formation begins at higher temperatures than for catalysts tested in short-term experiments (Section 3.3.3) suggesting higher degree of carbon graphitization. In general, in the temperature range 350–650 °C graphitic carbon is removed [16,17,18]. The catalyst Ni-CeTiNbZr-sc that showed the highest activity during long-term stability tests was also examined by microscopy (Figure S6). The presence of several forms of carbon has been shown—carbon layers, including those with encapsulated metal particles, and carbon fibers with various defects. It should be noted that defect carbon fibers are oxidized at lower temperature than the normal ones. There are also some metallic particles in contact with the oxide support which are free from carbon.
At higher temperatures, a sharp increase in CO2 concentration accompanied by CO appearance (Figure 12b) in products and a sharp mass drop on the TGA curve is observed (Figure 11). Such a spike-shape of the peak is observed due to sharp increase in CO2 formation rate and insufficient recording rate of detector to obtain usual sloping peak. The combustion of carbon is a complex topochemical reaction, the rate of which passes through a maximum with its transformation. The sharp increase in carbon burning rate can be connected with several factors: release of support surface from amorphous carbon and participation of support oxygen in the gasification of carbon deposits; oxidation of metallic nickel to nickel oxide and more efficient combustion of carbon on its surface; process of carbon self-ignition, which can occur at different temperatures for various forms of carbon. The appearance of CO is associated with incomplete oxidation of carbon due to oxygen lack.
High temperature peaks in the 650–850 °C temperature range correspond to the removal of whisker type carbon [16,18].
For doped samples, the mass drop ends at higher temperature and the rate of weight loss is lower (Figure 11), which suggests a higher degree of graphitization of carbon deposits [17,67].
It is known that the filamentous carbon does not block the catalysts’ surface, therefore its formation does not lead to catalyst deactivation in the first catalytic cycle [18,67,68]. In the work [68], the 5% Ni/SiO2 catalyst showed a stable operation in DRM reaction for 10 h at 800 °C, although the weight loss of spent catalysts corresponding to removal of the whisker carbon was 65%. In the work [67], the La-NiMgAlO catalyst was tested in DRM for 200 h at various temperatures—650, 700 and 750 °C. Contrary to expectations, the catalyst tested at 750 °C, which showed the best stability, exhibited the highest weight loss of about 70% and large amount of carbon fibers. For catalysts tested at lower temperatures, the formation of coating carbon was observed in a greater extent, what led to their deactivation.
At temperatures above 600 °C, carbonate removal can also contribute to weight loss [18]. However, the CO2 release occurred synchronously with the O2 consumption (Figure S5), indicating that CO2 is formed mainly due to the oxidation of carbon deposits.
Significant weight loss from 55 to 58% is observed for all samples (Table 7). Thus, we can conclude that in the case of long-term tests at 700 °C the introduction of the dopant does not affect the amount of carbon deposits, but strongly affect the catalyst activity.
In the work [17], the authors compared the effect of La and Ce addition on stability of 8%Ni/ZrO2 to carbon formation in DRM at various reaction temperatures 550–800 °C. It was shown that addition of promoter leads to increased activity and amount of carbon at low temperatures. However, the difference in the carbon amount decreases with increasing temperature. In addition, the influence of La and Ce on catalytic activity was found to be close.
In our case, reaction temperature is supposed to be high enough so that the effect of the doping cation on the amount of carbon deposits is not observed.
The most active catalyst Ni-CeTiNbZr-sc was additionally tested in DRM for three hours to study the amount and nature of carbon deposits. The TGA results and mass-spectroscopy data are presented in the Figure 13. The amount of carbon after three hours of testing was found to be close to that after 25 h of operation. CO2 evolution begins at the same temperature and ends at 60 degrees higher temperature that suggests a higher graphitization degree of carbon deposits. Thus, we confirmed the assumption that the main deactivation occurs in the first hours of catalyst operation.
It is known that the carbon formation takes place mainly on large ensembles of nickel [35]. TGA data indicate the presence of graphitic carbon, which is capable to block the catalyst surface. So, it can be assumed that in the first hours of the reaction, carbon is formed on the most active centers and then blocks them, due to which a sharp drop in activity is observed. After that, the catalyst reaches a steady-state and the subsequent activity decrease occurs not due to the carbon formation, but due to the sintering of the active component. However, this assumption requires further research.

4. Conclusions

Nickel-containing catalysts based on fluorite-like supports prepared by the citrate method and by original supercritical synthesis were studied before and after tests in DRM reaction. According to the XPS data, the preparation method has a strong influence on the surface composition. Catalysts prepared by supercritical synthesis contain much more cerium ions on the surface than catalysts synthesized by the citrate method. The number of Ni species is also higher for catalysts prepared by supercritical synthesis. No CO adsorption bands were observed at room temperature in the FTIR spectra of adsorbed CO on the doped citrate samples.
The oxygen mobility of supercritical samples was studied by the temperature-programmed isotope exchange (TPIE) with C18O2. Incorporation of titanium results in almost fourfold decrease in oxygen mobility compared to undoped ceria–zirconia. The effect of nickel consists in decrease in the oxygen diffusion coefficients by 2–5 times and is probably associated with a decrease in the oxygen permeability of the near-surface layers of catalysts. For spent catalysts doped by Ti and Nb, metal Ni particles are of the same size as the initial NiO (~25 nm), suggesting that incorporation of these cations prevents nickel particles from sintering regardless of the preparation method.
The catalysts after tests in DRM were investigated by TGA coupled with temperature-programmed oxidation with mass-spectrometric analysis of effluent gases. After short-term temperature tests, the lowest amounts of carbon deposits were obtained for unmodified Ni-CeZr and Ni-CeNbZr compositions (lack of carbon for citrate samples and 2–3% for supercritical ones) that correlates well with their higher oxygen mobility estimated for supercritical catalysts. No correlation between the carbon amount and nickel crystallite size or XPS results is observed. The use of supports obtained in supercritical alcohols leads to formation of more ordered carbon in larger quantities (max. ~9%) compared to citrate samples that may be connected with stronger metal–support interaction for the last ones, which was shown by microscopy data.
Catalysts prepared by supercritical synthesis were tested in DRM for 25 h to check their stability. The highest activity drop due to carbon formation was observed in the first three hours. In the remaining time, catalysts demonstrate quite stable operation and activity decrease of 10–13% of methane conversion for all samples. The highest activity was observed for Ni-CeNbZr-sc and Ni-CeTiNbZr-sc samples, corresponding to methane conversion of 57% and a hydrogen yield of 30% at the end of tests. For all compositions, close values of weight loss (~55%) were observed. So, in the case of long-term tests at 700 °C, the introduction of the dopant does not affect the amount of carbon deposits, but strongly affect the catalyst activity.

Supplementary Materials

Study of oxygen mobility by isotope exchange with C18O2. Figures S1–S6. The following supporting information can be downloaded at: https://www.mdpi.com/article/10.3390/nano12203676/s1.

Author Contributions

Methodology, E.S. (Ekaterina Smal), Y.B. and M.S.; formal analysis, E.S. (Ekaterina Sadovskaya); investigation, V.F., K.V., N.E., T.K., T.G. and Y.B.; writing—original draft preparation, E.S. (Ekaterina Smal); writing—review and editing, M.S. and M.A.; supervision, V.S.; project administration, M.S.; funding acquisition, M.S. All authors have read and agreed to the published version of the manuscript.

Funding

This research was funded by Russian Science Foundation, grant number 18-73-10167.

Data Availability Statement

Not applicable.

Acknowledgments

The authors acknowledge the Shared Research Center “VTAN” of the Novosibirsk State University supported by Ministry of Science and Higher Education of the Russian Federation by agreement #075-12-2021-697 for HRTEM investigation. The XPS experiments were performed using facilities of the shared research center “National center of investigation of catalysts” at the Boreskov Institute of Catalysis. Authors would like to thank personally A.V. Ishchenko for carrying out HRTEM studies and A.A. Saraev, A.M. Kremneva for XPS studies.

Conflicts of Interest

The authors declare no conflict of interest.

References

  1. Usman, M.; Daud, W.M.A.W.; Abbas, H.F. Dry reforming of methane: Influence of process parameters—A review. Renew. Sustain. Energy Rev. 2015, 45, 710–744. [Google Scholar] [CrossRef] [Green Version]
  2. Yentekakis, I.V.; Panagiotopoulou, P.; Artemakis, G. A review of recent efforts to promote dry reforming of methane (DRM) to syngas production via bimetallic catalyst formulations. Appl. Catal. B 2021, 296, 120210. [Google Scholar] [CrossRef]
  3. Zhang, G.; Liu, J.; Xu, Y.; Sun, Y. A review of CH4-CO2 reforming to synthesis gas over Ni-based catalysts in recent years (2010–2017). Int. J. Hydrog. Energy 2018, 43, 15030–15054. [Google Scholar] [CrossRef]
  4. Pakhare, D.; Spivey, J. A review of dry (CO2) reforming of methane over noble metal catalysts. Chem. Soc. Rev. 2014, 43, 7813–7837. [Google Scholar] [CrossRef]
  5. Nikoo, M.K.; Amin, N.A.S. Thermodynamic analysis of carbon dioxide reforming of methane in view of solid carbon formation. Fuel Process. Technol. 2014, 92, 678–691. [Google Scholar] [CrossRef] [Green Version]
  6. Bradford, M.C.J.; Vannice, M.A. CO2 reforming of CH4. Catal. Rev. 1999, 41, 1–42. [Google Scholar] [CrossRef]
  7. Erdohelyi, A. Catalytic Reaction of Carbon Dioxide with Methane on Supported Noble Metal Catalysts. Catalysts 2021, 11, 159. [Google Scholar] [CrossRef]
  8. Makri, M.M.; Vasiliades, M.A.; Petallidou, K.C.; Efstathiou, A.M. Effect of support composition on the origin and reactivity of carbon formed during dry reforming of methane over 5wt%Ni/Ce1−xMxO2−I (M = Zr4+, Pr3+) catalysts. Catal. Today 2016, 259, 150–164. [Google Scholar] [CrossRef]
  9. Marinho, A.L.A.; Toniolo, F.S.; Noronha, F.B.; Epron, F.; Duprez, D.; Bion, N. Highly active and stable Ni dispersed on mesoporous CeO2-Al2O3 catalysts for production of syngas by dry reforming of methane. Appl. Catal. B 2021, 281, 119459. [Google Scholar] [CrossRef]
  10. Gao, X.; Lin, W.; Ge, Z.; Ge, H.; Kawi, S. Modification Strategies of Ni-Based Catalysts with Metal Oxides for Dry Reforming of Methane. Methane 2022, 1, 139–157. [Google Scholar] [CrossRef]
  11. Wang, S.; Lu, G.Q.M. Carbon dioxide reforming of methane to produce synthesis gas over metal supported catalysts: State of the art. Energy Fuels 1996, 10, 896–904. [Google Scholar] [CrossRef]
  12. Lanre, M.S.; Al-Fatesh, A.S.; Fakeeha, A.H.; Kasim, S.O.; Ibrahim, A.A.; Al-Awadi, A.S.; Al-Zahrani, A.A.; Abasaeed, A.E. Catalytic Performance of Lanthanum Promoted Ni/ZrO2 for Carbon Dioxide Reforming of Methane. Processes 2020, 8, 1502. [Google Scholar] [CrossRef]
  13. Gadalla, A.M.; Bower, B. The role of catalyst support on the activity of nickel for reforming methane with CO2. Chem. Eng. Sci. 1998, 43, 3049–3062. [Google Scholar] [CrossRef]
  14. Hu, Y.H.; Ruckenstein, E. Catalytic Conversion of Methane to Synthesis Gas by Partial Oxidation and CO2 Reforming. Adv. Catal. 2004, 48, 297–345. [Google Scholar] [CrossRef]
  15. Carrero, A.; Calles, J.A.; Vizcaíno, A.J. Effect of Mg and Ca addition on coke deposition over Cu–Ni/SiO2 catalysts for ethanol steam reforming. Chem. Eng. J. 2010, 163, 395–402. [Google Scholar] [CrossRef]
  16. Kambolis, A.; Matralis, H.; Trovarelli, A.; Papadopoulou, C. Ni/CeO2-ZrO2 catalysts for the dry reforming of methane. Appl. Catal. A 2010, 377, 16–26. [Google Scholar] [CrossRef]
  17. Charisiou, N.D.; Siakavelas, G.; Tzounis, L.; Sebastian, V.; Monzon, A.; Baker, M.A.; Hinder, S.J.; Polychronopoulou, K.; Yentekakis, I.V.; Goula, M.A. An in depth investigation of deactivation through carbon formation during the biogas dry reforming reaction for Ni supported on modified with CeO2 and La2O3 zirconia catalysts. Int. J. Hydrog. Energy 2018, 43, 18955–18976. [Google Scholar] [CrossRef]
  18. Wolfbeisser, A.; Sophiphun, O.; Bernardi, J.; Wittayakun, J.; Föttinger, K.; Rupprechter, G. Methane dry reforming over ceria-zirconia supported Ni catalysts. Catal. Today 2016, 277, 234–245. [Google Scholar] [CrossRef] [Green Version]
  19. Swaan, H.M.; Kroll, V.C.H.; Martin, G.A.; Mirodatos, C. Deactivation of supported nickel catalysts during reforming of methane by carbon dioxide. Catal. Today 1994, 21, 571–578. [Google Scholar] [CrossRef]
  20. Zhang, Z.L.; Verykios, X.E. Carbon dioxide reforming of methane to synthesis gas over supported Ni catalysts. Catal. Today 1994, 21, 589–595. [Google Scholar] [CrossRef]
  21. Chen, Y.-G.; Tomishige, K.; Fujirnoto, K. Formation and characteristic properties of carbonaceous species on nickel-magnesia solid solution catalysts during CH4-CO2 reforming reaction. Appl. Catal. A 1997, 161, Ll1–Ll7. [Google Scholar] [CrossRef]
  22. Fakeeha, A.H.; Kasim, S.O.; Ibrahim, A.A.; Abasaeed, A.E.; Al-Fatesh, A.S. Influence of Nature Support on Methane and CO2 Conversion in a Dry Reforming Reaction over Nickel-Supported Catalysts. Materials 2019, 12, 1777. [Google Scholar] [CrossRef] [Green Version]
  23. Tsyganok, A.I.; Inaba, M.; Tsunoda, T.; Hamakawa, S.; Suzuki, K.; Hayakawa, T. Dry reforming of methane over supported noble metals: A novel approach to preparing catalysts. Catal. Commun. 2003, 4, 493–498. [Google Scholar] [CrossRef]
  24. Harshini, D.; Lee, D.H.; Kim, Y.; Nam, S.W.; Han, J.H.; Ham, H.C.; Yoon, C.W. Catalytic Hydrogen Production via Dry Reforming of Methane Over Ni/Ce0.65Hf0.25M0.1O2−δ (M = Tb, Sm, Nd, Pr and La). Catal. Lett. 2014, 144, 656–662. [Google Scholar] [CrossRef]
  25. Zhang, F.; Liu, Z.; Chen, X.; Rui, N.; Betancourt, L.E.; Lin, L.; Xu, W.; Sun, C.; Abeykoon, A.M.M.; Rodriguez, J.A.; et al. Effects of Zr Doping into Ceria for the Dry Reforming of Methane over Ni/CeZrO2 Catalysts: In Situ Studies with XRD, XAFS, and APXPS. ACS Catal. 2020, 10, 3274–3284. [Google Scholar] [CrossRef]
  26. Manan, W.N.; Wan Isahak, W.N.R.; Yaakob, Z. CeO2-Based Heterogeneous Catalysts in Dry Reforming Methane and Steam Reforming Methane: A Short Review. Catalysts 2022, 12, 452. [Google Scholar] [CrossRef]
  27. Wang, Y.; Liang, S.; Cao, A.; Thompson, R.L.; Veser, G. Au mixed lanthanum/cerium oxide catalysts for water gas shift. Appl. Catal. B 2010, 99, 89–95. [Google Scholar] [CrossRef]
  28. Menegazzo, F.; Pizzolitto, C.; Ghedini, E.; Michele, A.D.; Cruciani, G.; Signoretto, M. Development of La Doped Ni/CeO2 for CH4/CO2 Reforming. J. Carbon Res. 2018, 4, 60. [Google Scholar] [CrossRef] [Green Version]
  29. Liu, Z.; Xu, W.; Yao, S.; Johnson-Peck, A.C.; Michorczyk, F.; Kubacka, A.; Stach, E.A.; Fernández-García, M.; Senanayake, S.D.; Rodriguez, J.A. Superior performance of Ni−W−Ce mixed-metal oxide catalysts for ethanol steam reforming: Synergistic effects of W and Ni-dopants. J. Catal. 2015, 321, 90–99. [Google Scholar] [CrossRef] [Green Version]
  30. Simonov, M.; Bespalko, Y.; Smal, E.; Valeev, K.; Fedorova, V.; Krieger, T.; Sadykov, V. Nickel-Containing Ceria-Zirconia Doped with Ti and Nb. Effect of Support Composition and Preparation Method on Catalytic Activity in Methane Dry Reforming. Nanomaterials 2020, 10, 1281. [Google Scholar] [CrossRef]
  31. Bespalko, Y.; Smal, E.; Simonov, M.; Valeev, K.; Fedorova, V.; Krieger, T.; Cherepanova, S.; Ishchenko, A.; Rogov, V.; Sadykov, V. Novel Ni/Ce(Ti)ZrO2 Catalysts for Methane Dry Reforming Prepared in Supercritical Alcohol Media. Energies 2020, 13, 3365. [Google Scholar] [CrossRef]
  32. Arapova, M.; Smal, E.; Bespalko, Y.; Fedorova, V.; Valeev, K.; Cherepanova, S.; Ischenko, A.; Sadykov, V.; Simonov, M. Ethanol dry reforming over Ni supported on modified ceria-zirconia catalysts: The effect of Ti and Nb dopants. Int. J. Hydrog. Energy 2021, 46, 39236–39250. [Google Scholar] [CrossRef]
  33. Radlik, M.; Adamowska-Teyssier, M.; Krzton, A.; Kozieł, K.; Krajewski, W.; Turek, W.; Da Costa, P. Dry reforming of methane over Ni/Ce0.62Zr0.38O2 catalysts: Effect of Ni loading on the catalytic activity and on H2/CO production. C. R. Chim. 2015, 18, 1242–1249. [Google Scholar] [CrossRef]
  34. Damaskinos, C.M.; Zavašnik, J.; Djinović, P.; Efstathiou, A.M. Dry reforming of methane over Ni/Ce0.8Ti0.2O2-δ: The effect of Ni particle size on the carbon pathways studied by transient and isotopic techniques. Appl. Catal. B 2021, 296, 120321. [Google Scholar] [CrossRef]
  35. Rostrup-Nielsen, J.R. Promotion by poisoning. Stud. Surf. Sci. Catal. 1991, 68, 85–101. [Google Scholar] [CrossRef]
  36. Gao, X.; Ashok, J.; Kawi, S. Smart Designs of Anti-Coking and Anti-Sintering Ni-Based Catalysts for Dry Reforming of Methane: A Recent Review. Reactions 2020, 1, 162–194. [Google Scholar] [CrossRef]
  37. Lyu, Y.; Jocz, J.N.; Xu, R.; Stavitski, E.; Sievers, C. Nickel Speciation and Methane Dry Reforming Performance of Ni/CexZr1-xO2 Prepared by Different Synthesis Methods. ACS Catal. 2020, 10, 11235–11252. [Google Scholar] [CrossRef]
  38. Scofield, J.H. Hartree-Slater subshell photoionization cross-sections at 1254 and 1487 eV. J. Electron Spectrosc. Relat. Phenom. 1976, 8, 129–137. [Google Scholar] [CrossRef]
  39. Paukshtis, E.A.; Yurchenko, E.N. Study of the Acid–Base Properties of Heterogeneous Catalysts by Infrared Spectroscopy. Russ. Chem. Rev. 1983, 52, 242–258. [Google Scholar] [CrossRef]
  40. Fedorova, V.; Simonov, M.; Valeev, K.; Bespalko, Y.; Smal, E.; Eremeev, N.; Sadovskaya, E.; Krieger, T.; Ishchenko, A.; Sadykov, V. Kinetic regularities of methane dry reforming reaction on nickel-containing modified ceria–zirconia. Energies 2021, 14, 2973. [Google Scholar] [CrossRef]
  41. Sadykov, V.A.; Sadovskaya, E.M.; Uvarov, N.F. Methods of isotopic relaxations for estimation of oxygen diffusion coefficients in solid electrolytes and materials with mixed ionic-electronic conductivity. Russ. J. Electrochem. 2015, 51, 458–467. [Google Scholar] [CrossRef]
  42. Borchert, H.; Frolova, Y.V.; Kaichev, V.V.; Prosvirin, I.P.; Alikina, G.M.; Lukashevich, A.I.; Zaikovskii, V.I.; Moroz, E.M.; Trukhan, S.N.; Ivanov, V.P.; et al. Electronic and Chemical Properties of Nanostructured Cerium Dioxide Doped with Praseodymium. J. Phys. Chem. B 2005, 109, 5728–5738. [Google Scholar] [CrossRef] [PubMed]
  43. Bulavchenko, O.A.; Vinokurov, Z.S.; Afonasenko, T.N.; Tsyrul’nikov, P.G.; Tsybulya, S.V.; Saraev, A.A.; Kaichev, V.V. Reduction of mixed Mn-Zr oxides: In situ XPS and XRD studies. Dalton Trans. 2015, 44, 15499–15507. [Google Scholar] [CrossRef] [PubMed] [Green Version]
  44. Kim, M.-S.; Ko, Y.-D.; Hong, J.-H.; Jeong, M.-C.; Myoung, J.-M.; Yun, I. Characteristics and processing effects of ZrO2 thin films grown by metal-organic molecular beam epitaxy. Appl. Surf. Sci. 2004, 227, 387–398. [Google Scholar] [CrossRef]
  45. Finetti, P.; Sedona, F.; Rizzi, G.A.; Mick, U.; Sutara, F.; Svec, M.; Matolin, V.; Schierbaum, K.; Granozzi, G. Core and Valence Band Photoemission Spectroscopy of Well-Ordered Ultrathin TiOx Films on Pt(111). J. Phys. Chem. C 2007, 111, 869–876. [Google Scholar] [CrossRef]
  46. Kaichev, V.V.; Chesalov, Y.A.; Saraev, A.A.; Klyushin, A.Y.; Knop-Gericke, A.; Andrushkevich, T.V.; Bukhtiyarov, V.I. Redox mechanism for selective oxidation of ethanol over monolayer V2O5/TiO2 catalysts. J. Catal. 2016, 338, 82–93. [Google Scholar] [CrossRef] [Green Version]
  47. Kwoka, M.; Galstyan, V.; Comini, E.; Szuber, J. Pure and Highly Nb-Doped Titanium Dioxide Nanotubular Arrays: Characterization of Local Surface Properties. Nanomaterials 2017, 7, 456. [Google Scholar] [CrossRef] [Green Version]
  48. Singh, N.; Deo, M.N.; Nand, M.; Jha, S.N.; Roy, S.B. Raman and photoelectron spectroscopic investigation of high-purity niobium materials: Oxides, hydrides, and hydrocarbons. J. Appl. Phys. 2016, 120, 114902. [Google Scholar] [CrossRef]
  49. Kaichev, V.V.; Teschner, D.; Saraev, A.A.; Kosolobov, S.S.; Gladky, A.Y.; Prosvirin, I.P.; Rudina, N.A.; Ayupov, A.B.; Blume, R.; Hävecker, M.; et al. Evolution of self-sustained kinetic oscillations in the catalytic oxidation of propane over a nickel foil. J. Catal. 2016, 334, 23–33. [Google Scholar] [CrossRef] [Green Version]
  50. Alders, D.; Voogt, F.C.; Hibma, T.; Sawatzky, G.A. Nonlocal screening effects in 2p X-ray photoemission spectroscopy of NiO(100). Phys. Rev. B 1996, 54, 7716–7719. [Google Scholar] [CrossRef]
  51. Farmer, J.A.; Campbell, C.T. Ceria Maintains Smaller Metal Catalyst Particles by Strong Metal-Support Bonding. Science 2010, 329, 933–936. [Google Scholar] [CrossRef] [PubMed]
  52. Zheng, X.; Li, Y.; Zhang, L.; Shen, L.; Xiao, Y.; Zhang, Y.; Au, C.; Jiang, L. Insight into the effect of morphology on catalytic performance of porous CeO2 nanocrystals for H2S selective oxidation. Appl. Catal. B 2019, 252, 98–110. [Google Scholar] [CrossRef]
  53. Sadykov, V.A.; Kuznetsova, T.G.; Alikina, G.M.; Frolova, Y.V.; Lukashevich, A.I.; Potapova, Y.V.; Muzykantov, V.S.; Rogov, V.A.; Kriventsov, V.V.; Kochubei, D.I.; et al. Ceria-based fluorite-like oxide solid solutions as catalysts of methane selective oxidation into syngas by the lattice oxygen: Synthesis, characterization and performance. Catal. Today 2004, 93–95, 45–53. [Google Scholar] [CrossRef]
  54. Kuznetsova, T.G.; Sadykov, V.A.; Moroz, E.M.; Trukhan, S.N.; Paukshtis, E.A.; Kolomiichuk, V.N.; Burgina, E.B.; Zaikovskii, V.I.; Fedotov, M.A.; Lunin, V.V.; et al. Preparation of Ce-Zr-O composites by a polymerized complex method. Stud. Surf. Sci. Catal. 2002, 143, 659–667. [Google Scholar] [CrossRef]
  55. Gopalakrishnan, S.; Faga, M.G.; Miletto, I.; Coluccia, S.; Caputo, G.; Sau, S.; Giaconia, A.; Berlier, G. Unravelling the structure and reactivity of supported Ni particles in Ni-CeZrO2 catalysts. Appl. Catal. B 2013, 138–139, 353–361. [Google Scholar] [CrossRef]
  56. Sadykov, V.A.; Kuznetsova, T.G.; Alikina, G.M.; Frolova, Y.V.; Lukashevich, A.I.; Muzykantov, V.S.; Rogov, V.A.; Batuev, L.C.; Kriventsov, V.V.; Kochubei, D.I.; et al. Ceria-based fluorite-like oxide solid solutions promoted by precious metals as catalysts of methane transformation into syngas. In New Topics in Catalysis Research; McReynolds, D.K., Ed.; Nova Science Publishers: New York, NY, USA, 2007; pp. 97–197. [Google Scholar]
  57. Hadjiivanov, K.I.; Vayssilov, G.N. Characterization of oxide surfaces and zeolites by carbon monoxide as an IR probe molecule. Adv. Catal. 2002, 47, 307–511. [Google Scholar] [CrossRef]
  58. Hadjiivanov, K.; Mihaylov, M.; Klissurski, D.; Stefanov, P.; Abadjieva, N.; Vassileva, E.; Mintchev, L. Characterization of Ni/SiO2 Catalysts Prepared by Successive Deposition and Reduction of Ni2+ Ions. J. Catal. 1999, 185, 314–323. [Google Scholar] [CrossRef]
  59. Sadykov, V.A.; Kuznetsova, T.G.; Frolova-Borchert, Y.V.; Alikina, G.M.; Lukashevich, A.I.; Rogov, V.A.; Muzykantov, V.S.; Pinaeva, L.G.; Sadovskaya, E.M.; Ivanova, Y.A.; et al. Fuel-rich methane combustion: Role of the Pt dispersion and oxygen mobility in a fluorite-like complex oxide support. Catal. Today 2006, 117, 475–483. [Google Scholar] [CrossRef]
  60. Frusteri, F.; Freni, S.; Chiodo, V.; Donato, S.; Bonura, G.; Cavallaro, S. Steam and auto-thermal reforming of bio-ethanol over MgO and CeO2 Ni-supported catalysts. Int. J. Hydrog. Energy 2006, 31, 2193–2199. [Google Scholar] [CrossRef]
  61. Luisetto, I.; Tuti, S.; Romano, C.; Boaro, M.; Di Bartolomeo, E.; Kesavan, J.K.; Kumar, S.S.; Selvakumar, K. Dry reforming of methane over Ni supported on doped CeO2: New insight on the role of dopants for CO2 activation. J. CO2 Util. 2019, 30, 63–78. [Google Scholar] [CrossRef]
  62. Kim, S.S.; Lee, S.M.; Won, J.M.; Yang, H.J.; Hong, S.C. Effect of Ce/Ti ratio on the catalytic activity and stability of Ni/CeO2–TiO2 catalyst for dry reforming of methane. Chem. Eng. J. 2015, 280, 433–440. [Google Scholar] [CrossRef]
  63. Ye, J.L.; Wang, Y.Q.; Liu, Y.; Wang, H. Steam reforming of ethanol over Ni/CexTi1-xO2 catalysts. Int. J. Hydrog. Energy 2008, 33, 6602–6611. [Google Scholar] [CrossRef]
  64. Damaskinos, C.M.; Vasiliades, M.A.; Efstathiou, A.M. The effect of Ti4+ dopant in the 5 wt% Ni/Ce1-xTixO2-δ catalyst on the carbon pathways of dry reforming of methane studied by various transient and isotopic techniques. Appl. Catal. A 2019, 579, 116–129. [Google Scholar] [CrossRef]
  65. Rotaru, C.G.; Postole, G.; Florea, M.; Matei-Rutkovska, F.; Pârvulescu, V.I.; Gelin, P. Dry reforming of methane on ceria prepared by modified precipitation route. Appl. Catal. A 2015, 494, 29–40. [Google Scholar] [CrossRef]
  66. Otsuka, J.; Wang, Y.; Sunada, E.; Yamanaka, I. Direct Partial Oxidation of Methane to Synthesis Gas by Cerium Oxide. J. Catal. 1998, 175, 152–160. [Google Scholar] [CrossRef]
  67. Serrano-Lotina, A.; Daza, L. Long-term stability test of Ni-based catalyst in carbon dioxide reforming of methane. Appl. Catal. A 2014, 474, 107–113. [Google Scholar] [CrossRef]
  68. Taufiq-Yap, Y.H.; Rashid, U.; Zainal, Z. CeO2–SiO2 supported nickel catalysts for dry reforming of methane toward syngas production. Appl. Catal. A 2013, 468, 359–369. [Google Scholar] [CrossRef]
Figure 1. XPS spectra of catalysts prepared by supercritical synthesis after reduction treatment in H2 at 450 °C: (a) Ce3d spectra, (b) Zr3d spectra, (c) Ti2p spectra, (d) Nb3d spectra, (e) Ni2p3/2 spectra.
Nanomaterials 12 03676 g001
Figure 2. Differential FTIR spectra of CO adsorbed on catalysts prepared by citrate method (a) and by supercritical synthesis (b). pCO 10 Torr, T −196 °C.
Nanomaterials 12 03676 g002
Figure 3. Differential FTIR spectra of CO adsorbed on catalysts at CO pressure 10 Torr and room temperature.
Nanomaterials 12 03676 g003
Figure 4. The TPIE curves for Ce0.75Zr0.25O2 samples synthesized by citrate method and by supercritical synthesis. Points—experiment, lines—modelling.
Nanomaterials 12 03676 g004
Figure 5. The TPIE curves for supports (a) and catalysts (b) prepared by supercritical synthesis.
Nanomaterials 12 03676 g005
Figure 6. Diffraction patterns of catalysts prepared by citrate methods (a) and by supercritical synthesis (b) after tests in methane dry reforming.
Nanomaterials 12 03676 g006
Figure 7. TEM images of Ni-CeTiNbZr catalysts prepared by citrate method (a) and by supercritical synthesis (b) after testing in methane dry reforming.
Nanomaterials 12 03676 g007
Figure 8. Weight loss during TGA of catalysts prepared by citrate method (a) and by supercritical synthesis (b) after tests in methane dry reforming.
Nanomaterials 12 03676 g008
Figure 9. CO2 concentration measured by mass-spectroscopy analysis during TGA of catalysts prepared by citrate method (a) and by supercritical synthesis (b) after tests in methane dry reforming.
Nanomaterials 12 03676 g009
Figure 10. Results of long-term stability tests in methane dry reforming over catalysts prepared by supercritical synthesis: (a) values after 25 h of testing, (b) methane conversion, (c) H2 yield, and (d) H2/CO ratio during testing for 25 h. Reaction feed 15%CH4 + 15%CO2 + Ar balance.
Nanomaterials 12 03676 g010
Figure 11. Weight loss during TGA of catalysts prepared by supercritical synthesis after long-term stability tests in methane dry reforming.
Nanomaterials 12 03676 g011
Figure 12. CO2 (a) and CO (b) concentrations measured by mass-spectroscopy analysis during TGA of catalysts prepared by supercritical synthesis after long-term stability tests in methane dry reforming.
Nanomaterials 12 03676 g012
Figure 13. Weight loss (a) and CO2 concentration (b) during TGA of Ni-CeTiNbZr-sc after long-term stability tests for 25 and 3 h in methane dry reforming.
Nanomaterials 12 03676 g013
Table 1. Catalysts’ compositions and abbreviations.
CompositionSynthesis Method
CitrateSupercritical
15%Ni/Ce0.75Zr0.25O2-δNi-CeZrNi-CeZr-sc
25%Ni/Ce0.75Nb0.1Zr0.15O2-δNi-CeNbZrNi-CeNbZr-sc
35%Ni/Ce0.75Ti0.1Zr0.15O2-δNi-CeTiZrNi-CeTiZr-sc
45%Ni/Ce0.75Ti0.05Nb0.05Zr0.15O2-δNi-CeTiNbZrNi-CeTiNbZr-sc
Table 2. Textural and structural properties of fresh and spent catalysts.
SampleFreshAfter Reaction
SBET,
m2/g
Vtotal,
cm³/g
d sup *,
nm
d NiO **,
nm
SBET,
m2/g
Vtotal,
cm³/g
d sup *,
nm
d Ni **,
nm
Citrate method
Ni-CeZr350.141118220.151765
Ni-CeNbZr290.111124280.131123
Ni-CeTiZr260.191124360.191124
Ni-CeTiNbZr280.211118300.241152
Supercritical synthesis
Ni-CeZr-sc210.14930110.191177
Ni-CeNbZr-sc170.191428150.291326
Ni-CeTiZr-sc230.181020240.171125
Ni-CeTiNbZr-sc260.181524140.151250
* d sup—crystallite size of fluorite phase according to XRD data. ** d NiO and d Ni—crystallite sizes according to XRD data.
Table 3. Atomic ratios of elements in the (sub)surface layers of catalysts after reduction treatment in H2 at 450 °C.
Sample[Ce]*[Ce3+]/[Ce],
%
[Ni] *[Ni2+]/[Ni],
%
[Ti] *[Nb] *
Citrate method
Ni-CeZr0.70590.0812--
Ni-CeNbZr0.63710.117-0.20
Ni-CeTiZr0.74620.10100.08-
Ni-CeTiNbZr0.70610.08100.030.13
Supercritical synthesis
Ni-CeZr-sc0.81500.1510--
Ni-CeNbZr-sc0.79600.1510-0.13
Ni-CeTiZr-sc0.79550.19100.10-
Ni-CeTiNbZr-sc0.75600.10100.040.09
* the ratio is normalized to [Ce] + [Zr] + [Ti] + [Nb].
Table 4. Concentration of various type of surface carbonyls according to IR spectroscopy.
SampleνCO, cmSites Amount,
μmol/g
Bridging CO
Amount,
μmol/g
On-top CO
Amount,
μmol/g
Total Amount, μmol/g
Ni-CeZr1905
1954
1980
2027
2063
14
2
16
2
12
321446
Ni-CeZr-sc1839
1937
1955
1975
2047
2055
2080
0.1
17
4
3
9
2
5
241640
Ni-CeNbZr-sc1903
1953
2040
2057
2076
5
6
8
2
5
111526
Ni-CeTiZr-sc1917
1954
2032
2067
2079
8
1
7
4
0.3
91120
Ni-CeTiNbZr-sc1933
1949
2039
2067
2083
15
0.5
8
7
2
161733
Table 5. Weighted average oxygen tracer diffusion coefficients for samples at 600 °C and their effective activation energies according to TPIE with C18O2 data.
SampleS
m2/g
L,
10−6 cm
(D/L2)over,
10−4 s−1
Dover,
10−16 cm2/s
E
kJ/mol
β
Citrate method
CeZroxide440.952427538
Supercritical synthesis
CeZr-scoxide291.522437513
Ni/oxide212.05.924779
CeNbZr-scoxide202.21048757
Ni/oxide162.72.014754
CeTiZr-scoxide281.64.9127533
Ni/oxide231.92.89.78514
CeTiNbZr-scoxide222.06247529
Ni/oxide261.71.85.2839
Table 6. Steady-state CH4 conversions during methane dry reforming at different temperatures.
SampleTemperature, °C
600650700750700650600
Citrate method
Ni-CeZr17273748332213
Ni-CeNbZr17263543291910
Ni-CeTiZr17273643291810
Ni-CeTiNbZr017263525169
Supercritical synthesis
Ni-CeZr-sc26293538291911
Ni-CeNbZr-sc1119233020137
Ni-CeTiZr-sc13202733241610
Ni-CeTiNbZr-sc25354451382717
Table 7. Weight loss during TGA of spent catalysts.
SampleMass Loss, %TGA
Temperature TestsLong-Term Tests
Citrate method
Ni-CeZr0-
Ni-CeNbZr0-
Ni-CeTiZr2.75-
Ni-CeTiNbZr5.80-
Supercritical synthesis
Ni-CeZr-sc3.3455.20
Ni-CeNbZr-sc2.1958.13
Ni-CeTiZr-sc8.9955.61
Ni-CeTiNbZr-sc6.2456.79
Publisher’s Note: MDPI stays neutral with regard to jurisdictional claims in published maps and institutional affiliations.

