Abstract
The current investigation deals with the application of a one-pot system to facilitate the production of cellulose nanocrystals (CNCs) from banana peel by a combination of microwave pre-treatment and mild oxidative hydrolysis with hydrogen peroxide (H2O2, 0–30 wt%) and sulfuric acid (H2SO4, 0–10%). H2O2 causes decolorization of the banana peel suspension from dark brown to light yellow, while further treatment with H2SO4 produces a white suspension, indicating successful removal of the non-cellulosic components from the banana peel. This finding was further supported by Fourier Transform Infrared (FTIR) spectroscopic analysis, which showed the gradual disappearance of lignin and hemicellulose peaks with increasing H2O2 and H2SO4 concentrations. The CNCs has considerably high crystallinity, with the highest crystallinity (~85%) being obtained at 6% H2SO4. Therefore, CNCs obtained at 6% H2SO4 were selected for further characterization. Scanning Electron Microscope (SEM) analysis confirmed the disintegration of the cellulose fibres into small fragments after hydrolysis. Transmission Electron Microscope (TEM) and Atomic Force Microscope (AFM) analyses revealed the spherical shape of the CNCs with an average size of approximately 20 nm. The CNCs have good stability with zeta potential of −42.9 mV. Findings from this study suggest that the combination of microwave pre-treatment and oxidative hydrolysis with 30 wt% H2O2 and 6% H2SO4, which is about 11 times lower than the commonly used H2SO4 concentration, is proven effective for the isolation of CNCs from banana peel. These observations are expected to provide insight into a facile and environmentally benign alternative to the conventional CNCs isolation method, using abundant and underutilized agricultural waste as feedstock.
1. Introduction
Many efforts have been made in the development of eco-friendly materials for a variety of purposes throughout the past century. Among these materials, cellulose stands out due to its abundance, light weight, recyclability, and biodegradability [1]. However, despite their abundance, woods and croplands have a finite capacity to provide cellulosic resources, a reality that urges researchers and industries to find alternative sources in order to maximize the efficiency of natural resource exploitation. In this regard, agricultural wastes, by-products of agricultural activities such as rice husk [2], rice straw [3], corn cob [4], coconut shell [5], orange tree pruning [6], and fruit peels such as pear [7] and banana [8], are seen as promising lignocellulosic feedstock for various applications.
Bananas (Musa sp.) are a staple food crop that are widely grown in Asia, Latin America, and Africa, playing a significant role in food security and economy. The global production of bananas is more than 100 million metric tons (MMT) per year and accounts for 16% of the total global food production [9]. The high consumption and industrial processing of the edible parts of the banana, however, results in a vast amount of waste, including peel, which is often dumped in landfills and creates negative environmental impact [8,10,11] due to microbial decomposition and emission of greenhouse gases such as methane and carbon dioxide [12,13]. Given that banana peel contains a considerable amount of cellulose (7.5–18.7%) [14,15,16,17,18,19,20], conversion of this lignocellulosic biomass to nanocellulose in the form of cellulose nanocrystals (CNCs) or cellulose nanofibers (CNFs) could add value to the underutilized by-products as well as reduce environmental pollution, in line with the circular economy concept and Sustainable Development Goals (SDG) [12].
Nanocellulose is a sustainable nanomaterial that has become a topic of great interest in recent years due to the inherent cellulose properties (i.e., most abundant in nature, renewable, biodegradable, low toxicity) and outstanding features such as high specific surface area, high aspect ratio and superior mechanical strength [21,22,23,24,25]. Its good barrier properties and tunable surface chemistry are particularly attractive in food science and technology applications such as food packaging, additives, and stabilizers [26,27]. Pelissari et al. [16] and Tibolla et al. [15] have reported that the extraction of nanocellulose from banana peel was possible through several pre-treatments steps, including repeated alkalization (5% KOH, 14 h) and bleaching (1% NaClO2, 1 h, 70 °C), followed by successive washing to prepare relatively pure cellulosic starting materials prior to hydrolysis with dilute sulfuric acid (H2SO4, 0.1–10%, 80 °C, 1 h) and high-pressure homogenization (0–7 passages). However, such multistep extraction procedures are laborious, time-consuming, and involved the use of harmful chemicals, high water consumption for neutralization, and high energy, which become an obstacle for the industrialization and application of nanocellulose [28]. Therefore, innovative solutions in nanocellulose isolation method are urgently needed to overcome these drawbacks.
Harini et al. [8] implemented the combination of microwave and hydrogen peroxide (H2O2) as a green alternative to the conventional chemical pre-treatment to afford the production of cellulose microfibers from banana peel. Microwave provides high heating efficiency, lower energy requirements, faster treatment time, selective processing, and easy operation. H2O2 is a powerful oxidizing agent that decomposes into water and oxygen, thus creating no harmful by-product [29]. A combination of microwave and H2O2 could therefore promote effective and rapid removal of the non-cellulosic components without the need for alkaline treatment [8]. Interestingly, the use of H2O2 eliminate the needs for successive washing and enables the acid hydrolysis reaction to be conducted in one-pot, as recently reported by Chen et al. [7] and Chávez-Guerrero et al. [30]. However, the combination of microwave and oxidative hydrolysis with H2O2 and dilute H2SO4 in one-pot for nanocellulose isolation has never been reported, hence the objective of the present study. The effect of H2O2 and H2SO4 concentrations in the range of 0–30% and 0–10%, respectively, on the nanocellulose production was investigated. The nanocellulose produced were characterized for their chemical functionality, crystallinity, morphology, size, and colloidal stability by FTIR, XRD, SEM, TEM, AFM, and zeta potential analyses.
2. Materials and Methods
2.1. Materials
Bananas (Musa acuminata × balbisiana) with maturity stage 7 (yellow peel with little brown spot) were purchased from a local market in Kota Kinabalu, Sabah, Malaysia, and immediately processed in the laboratory. Hydrogen peroxide (H2O2, 30%) and sulfuric acid (H2SO4, 98%) were a product of Merck, Germany. A cellulose standard, Avicel® PH-101 (microcrystalline), and sodium metabisulfite (Na2S2O5, 97%) were supplied by Sigma-Aldrich. Deionized water (Millipore) was used throughout this work. All of the reagents used were of analytical grade.
2.2. Preparation of Banana Peel (BP) Powder
The banana peel (BP) was removed from its flesh and immersed in 2% sodium metabisulphite solution for 24 h to avoid oxidation and microbial spoilage. The peel was then dried in an electric cabinet dryer (Shin-1) for 48 h at 60 °C. The dried peel was cooled to room temperature before being grinded by a mixer grinder (MX-AC2105, Panasonic Malaysia Sdn. Bhd., Selangor, Malaysia) and sieved with 250 πm laboratory test sieve (Endecotts, BS-410-1, London, UK) to obtain fine powder. The BP powder was then kept in an airtight container at room temperature until further use.
2.3. Proximate and Chemical Composition Analyses
The BP powder was analyzed for its proximate composition according to the Association of Official Analytical Chemists (AOAC, 2005) procedure [31]. Determination of moisture content was carried out using an oven dry method at 105 °C for 12 h until a constant weight was reached, while the ash content was measured using a muffle furnace ashing method in which the samples were heated in a furnace at 550 °C for 8–12 h. Crude protein content was determined using protein analyzer (Kjeltec®2300 Analyzer Unit, Hillerod, Denmark) following the Kjeldahl method. The fat content was analyzed using a solvent extraction system (Soxtec®Avanti 2050 Auto System, Höganäs, Sweden). Lignocellulosic fractions of the BP powder, including cellulose, hemicellulose, and lignin, were analyzed according to the Technical Association of the Pulp and Paper Industry (TAPPI) standard methods, as described by Song et al. [32]. All the analyses were performed in triplicates and the results were reported as average.
2.4. Isolation of CNCs from BP Powder by One-Pot Process
Production of CNCs from the BP powder was conducted by using a modified one-pot method [33]. Briefly, 10 g of the dried BP powder was soaked in deionized water and subjected to microwave irradiation at 600 W for 1 min to loosen the compact lignocellulosic structure. The swollen BP was then centrifuged and filtered to remove water from the sample. Bleaching was performed by the addition of 100 mL H2O2 to the same pot with a concentration ranging from 0 to 30% followed by 5 h incubation at 90 °C with mechanical agitation. After that, the reaction mixture was cooled to room temperature in an ice bath. Hydrolysis was performed by adding dilute H2SO4 with a concentration ranging from 0 to 10% into the pot containing the suspension and heated to 80 °C for 1 h. The mixture was quenched with ice cubes to stop the reaction. In order to remove the non-fibrillated cellulose components, successive washing with deionized water and centrifugation at 12,000 rpm (25 °C) were conducted until a constant pH was reached. The suspension was then ultrasonicated in a pulsing mode (15 s on and 5 s off) for 5 min to reduce agglomeration and improve nanocellulose dispersibility. The resultant suspension was freeze-dried and kept in a sealed container at 4 °C until further use. The procedures for the modified one-pot nanocellulose isolation are depicted in Figure 1. The yield of CNCs was determined using Equation (1):
where WCNCs is the dry weight of CNCs obtained after freeze-drying and WBP is the dry weight of the banana peel powder [15].
Yield (%) = (WCNCs/WBP) × 100
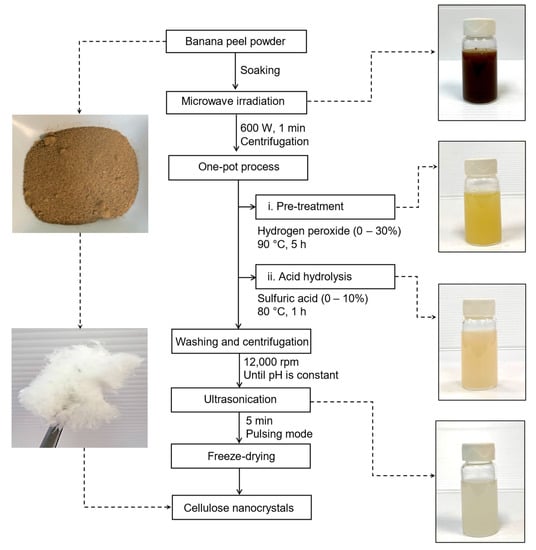
Figure 1.
Step-by-step procedures for isolation of CNCs from banana peel.
2.5. Fourier Transform Infrared Spectroscopy (FTIR)
Changes in chemical compositions of the BP powder after hydrogen peroxide pre-treatment and dilute sulfuric acid hydrolysis were monitored using Fourier-Transform Infrared Spectroscopy (FTIR). Agilent Cary 630 FTIR Spectrometer (Agilent Technologies, Inc., Danbury, CT, USA) was used to collect the absorbance spectra in the infrared region between 4000 and 600 cm−1 with a spectral resolution of 4 cm−1 and 32 scans. The measurement was conducted at room temperature. Avicel® PH-101 microcrystalline cellulose (Sigma Aldrich) was used as a reference [34].
2.6. X-ray Diffraction (XRD) Analysis
XRD pattern of the dried samples were recorded using a Rigaku SmartLab X-ray diffractometer (Rigaku Corporation, Tokyo, Japan). The analysis was performed at 25 °C, with an X-ray generator of 40 kV and 50 mA in the diffraction angle (2θ) range 5° to 80°. Crystallinity index (ICR) was determined using Equation (2) [7,15]:
where I200 is the maximum intensity of the diffraction peak from the (200) plane at 2θ ≈ 22° and Iam is the intensity of amorphous region between the (110) and (200) planes (2θ ≈ 18°). The CNCs sample with highest crystallinity was selected for further characterizations.
ICR (%) = [(I200 − Iam)/ I200] × 100
2.7. Scanning Electron Microscope (SEM) Analysis
Morphological properties of the BP powder and the resulting cellulose and CNCs were examined using a Scanning Electron Microscope (SEM). The samples were placed on a stub by using double-sided black conducting tape and observed by SEM under vacuum at an accelerating voltage of 10 kV. The samples were sputter-coated with gold prior to the analysis.
2.8. Atomic Force Microscope (AFM) Analysis
Topographic imaging of the samples was performed using Dimension Icon AFM instrument (Bruker, Santa Barbara, CA, USA). The scanning speed and area were 0.6 line/s and 0.5 × 0.5 μm2, respectively. Before being subjected to AFM imaging, dilute suspension (0.01 wt%) were first prepared followed by 5 min ultrasonication. One drop of the sonicated suspension was dispersed on a freshly cleaned optical glass substrate and air-dried at room temperature.
2.9. Transmission Electron Microscopy (TEM)
The image was acquired by using a Tecnai G2 Spirit BioTWIN transmission electron microscope (TEM) (FEI, Hillsboro, OR, USA) with an operating voltage of 80 kV. Prior to the analysis, the dilute CNCs suspension was ultrasonicated for 5 min. Then, a drop of suspension was placed on a carbon microgrid (300 mesh) and dried at 60 °C for 20 min.
2.10. Particle Size and Zeta Potential Measurements
Particle size and zeta potential of the CNCs suspension (0.1 wt% in deionized water) were determined using NanoPlus Particulate Systems (Micromeritics, Norcross, GA, USA) under the following conditions: water refractive index 1.3328, viscosity 0.8878 cP, dielectric constant 78.30, temperature 25 °C. Before analysis, the suspension was ultrasonicated for 5 min to improve sample dispersibility. The result is presented as the average value of three measurements.
3. Results and Discussion
3.1. Proximate and Chemical Compositions of the BP Powder
Table 1 shows the proximate compositions of the BP powder, which include moisture, ash, fat, and protein contents. The BP powder has a moisture content of 8.2 ± 0.2%, comparable to those of the Musa sapientum Linn. cv. Mali-Ong (7.7%) banana peel [29]. Higher moisture content (15.5–17.8%) was reported by Ibiyinka et al. [35] for ripe Musa sapientum banana peels from different varieties (cavendish, nino, and red banana). Moisture content plays a critical role in determining the storage stability of the product. A product with low moisture content can be stored longer, as it is less prone to microbial degradation and chemical changes [36]. Considerably high ash content (13.8 ± 0.3%) was obtained, corroborated with the findings of Singanusong et al. [29] and Deb et al. [37], which indicate a high mineral content in the BP powder. The high fat content (12.0 ± 0.2%) could be associated with the synthesis of fatty acids during fruit metabolism., in accordance with the data reported by Deb et al. [37] for Musa acuminata banana peel. The protein content (5.4 ± 0.1%) obtained here was almost similar to that of the peel of Musa sapientum, as reported by Pyar and Peh [36].

Table 1.
Proximate compositions of BP powder.
The chemical compositions of the BP powder are shown in Table 2 and compared to those obtained by other researchers. The cellulose, hemicellulose, and lignin contents in the BP powder were found to be 12.1 ± 0.3%, 14.8 ± 0.9%, and 15.7 ± 2.1%, respectively, indicating that the BP powder has a considerable amount of cellulose that can be utilized for CNCs production. The cellulose and hemicellulose content obtained is in accordance with those reported by Tibolla et al. [15] for Terra banana peel. In an earlier study by Tibolla et al. [14], lower cellulose content was observed for the same banana variety. The BP powder has comparatively lower hemicellulose content and higher lignin content than other banana peels, as displayed in Table 2. These findings imply that the both the proximate and chemical compositions in banana peel are not just influenced by the banana variety, but also other factors, such as state of ripeness, soil, and climate condition during harvesting [38,39].
Table 2.
Chemical compositions of BP powder.
3.2. Isolation of CNCs from BP Powder by One-Pot Process
The BP powder was successfully converted into CNCs with a yield of 28.1% by using a one-pot process of microwave pre-treatment and oxidative hydrolysis. Throughout these processes, the non-cellulosic components from the BP powder were removed, leaving a white “sugar candy” appearance of CNCs after freeze-drying (Figure 1). The yield of CNCs obtained is comparable to the yield reported by Tibolla et al. [15] (27.1%) for CNFs produced from banana peel using the conventional chemical pre-treatment with KOH and NaOCl2, followed by hydrolysis with 10% H2SO4 and five passages of high-pressure homogenization. Other studies have reported a lower yield of CNCs produced using the typical procedures of alkalization, bleaching, and H2SO4 hydrolysis, as stated by Chen et al. [7].
The mechanism of the one-pot process employed in the present study is depicted in Figure 2. The implementation of one-pot process does not just simplify the practical aspects of the CNCs isolation, but also saves time and minimizes product losses between steps [7,30]. By applying the microwave pre-treatment, the time required for overnight soaking and conventional heating could be reduced. Dielectric polarization by microwave energy facilitates rapid loosening and swelling of the lignocellulosic structure by penetration of water molecules in the space between the cellulose microfibers [8,40]. Further pre-treatment using H2O2 facilitates the removal of hemicellulose and the delignification process, enabling the implementation of the one-pot process as the decomposition of hydrogen peroxide produced water and oxygen [41,42]. Thus, successive washing after pre-treatment is unnecessary, and hydrolysis can be carried out directly in the same pot. In this way, water consumption for neutralization can be minimized effectively.
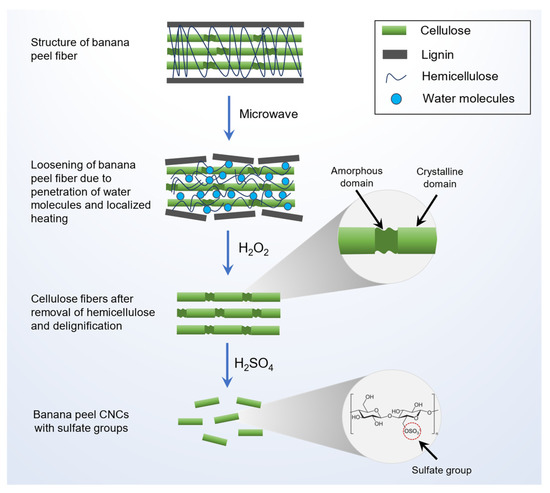
Figure 2.
Mechanism of CNCs formation through one-pot microwave and oxidative hydrolysis.
3.2.1. Effect of Hydrogen Peroxide Concentration on the Pre-Treatment of BP Powder
Hydrogen peroxide (H2O2) is a powerful oxidizing agent that facilitates the detachment and loosening of the lignocellulosic material, thus increasing its accessibility. H2O2 is also capable of penetrating the amorphous domains of the cellulosic materials and promotes degradation of lignin and decolorization [43]. This study investigated the effect of H2O2 concentration, ranging from 5 to 30% on the pre-treatment of BP powder. BP powder suspended in deionized water (0% H2O2) was used as a control. As shown in Figure 3, pre-treatment with increasing H2O2 concentration resulted in BP decolorization from dark brown (control) to light yellow. According to Andrade et al. [44], the dark brown color of lignocellulosic material is due to the presence of chromogen groups such as conjugated carbonyls, double bonds, and their combination. The color change of the suspension following pre-treatment indicates the partial degradations of hemicellulose and lignin substances [31].
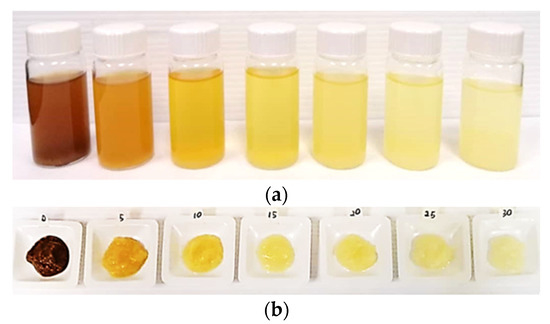
Figure 3.
Washing supernatants (a) and insoluble residues (b) obtained after pre-treatment with hydrogen peroxide at concentration ranging from 0% (control) to 30%.
Several reactions may occur during the oxidation of lignocellulosic biomass by hydrogen peroxide, including the cleavage of alkyl aryl ether linkages, displacement of side chains, electrophilic substitution, and oxidative cleavage of aromatic nuclei. Dissociation of H2O2 generated hydroperoxide anion (HOO−), which reacted with undissociated H2O2 to form highly reactive hydroxyl (HO•) and superoxide (O2−•) radicals. HOO− is responsible for lignin oxidation, preferentially attacking the ethylenic and carbonyl groups, whereas HO• and O2−• attack the lignin sidechains to produce water-soluble oxidation that promotes decolorization. In this process, most of the lignin and hemicellulose components were degraded simultaneously. A combination of H2O2 pre-treatment with other treatments to eliminate lignin and hemicellulose were studied by some researchers, such as enzymatic [45], alkali [46], and microwave-assisted dilute alkali [42] pre-treatments. These works have demonstrated that H2O2 pre-treatment plays a significant role in the hydrolysis of lignocellulosic biomass.
3.2.2. Effect of Sulfuric Acid Concentration on the Hydrolysis of BP Powder
Sulfuric acid hydrolysis is the most common method used for producing nanocellulose, owing to the high uniformity, crystallinity, and stability of the nanocellulose produced. However, high acid concentration, typically 64 wt% H2SO4, has poor selectivity over amorphous and crystalline regions, resulting in the degradation of some of the crystalline phases. This decreases the hydrolysis performance, especially when it is isolated from lignocellulosic biomass with a low cellulose content. Therefore, dilute acid treatment appears to be the preferred method for milder hydrolysis reaction. The efficacy of sulfuric acid hydrolysis can be observed based on the color change of the suspension from brown to white [47]. In this study, dilute sulfuric acid with a concentration ranging from 0 to 10% was used to hydrolyze the pre-treated banana peel. The control sample (0%) appears slightly yellowish, indicating the presence of a small amount of lignin and hemicellulose that decreased gradually during acid hydrolysis (Figure S1). White suspension was obtained at 6% concentration, signifying that most of the impurities have been removed from the sample. A further increase in the acid concentration to 8% and 10% may cause overdegradation of the banana peel, as evident by the slight brownish hue of the suspensions [47].
Cellulose microfibril in BP fiber contains crystalline and amorphous domains that are randomly distributed along their length [48]. The cellulose chain in the crystalline domain is packed closely, while in the amorphous domain, it is arranged in a disordered manner and is more susceptible to hydrolytic action. During acid hydrolysis, the H+ ions were able to penetrate the amorphous regions and facilitate hydrolytic cleavage of β-1,4 glycosidic bonds in cellulose chain, and produced CNCs [16]. According to Lee et al. [49], the formation of CNCs through H2SO4 hydrolysis involved the following mechanism: (i) Protonation of the oxygen atom of glycosidic bond; (ii) Replacement of unstable positive charged group in the cellulose chain by hydroxyl group of water; and (iii) Esterification between H2SO4 and hydroxyl group, producing negatively charged CNCs with sulfate ester groups (–OSO3−).
3.3. FTIR Analysis
Figure 4 and Figure 5 depict the FTIR spectra of the BP in response to pre-treatment and hydrolysis, with varying concentrations of H2O2 and H2SO4. All samples exhibit two major absorbance regions at the wavenumbers 3700–2900 cm−1 and 1700–800 cm−1. The broad absorption band in the 3700–3000 cm−1 region corresponds to the exposed OH groups of cellulose, which are bound by intermolecular hydrogen bonding [50,51]. The similarity of the absorption band between the banana peel sample and the H2O2 and H2SO4-treated samples at this region is a clear indication that the crystalline cellulose in the raw materials was not disrupted during the nanocellulose isolation process [52]. The band at 2920 cm−1 is assigned to asymmetrical stretching vibration of the C–H groups in polysaccharides [16].
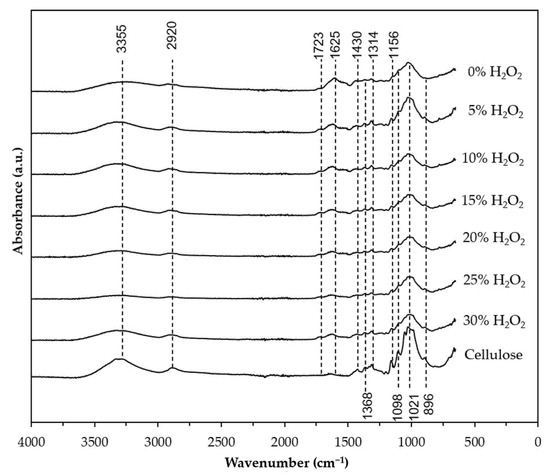
Figure 4.
FTIR spectra of the banana peel after pre-treatment using different H2O2 concentration (5%, 10%, 15%, 20%, 25%, and 30%). Untreated banana peel (0% H2O2) was used as a control. The pre-treatment was conducted at 90 °C for 2 h.
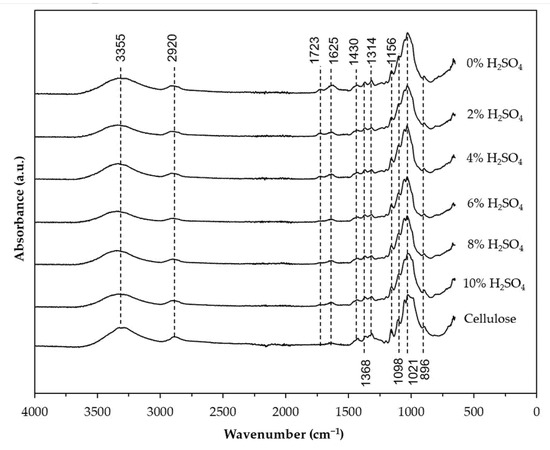
Figure 5.
FTIR spectra of nanocellulose obtained after hydrolysis with of the H2O2 pre-treated banana peel using different H2SO4 concentration (2%, 4%, 6%, 8%, and 10%). H2O2 pre-treated banana peel without the addition of H2SO4 (0% H2SO4) was used as a control The hydrolysis reaction was conducted at 80 °C for 1 h.
As shown in Figure 4, the banana peel spectrum (0% H2O2) displayed a peak at 1723 cm−1 attributed to the stretching vibration C=O ester bonds of ferulic and/or p-coumaric acids, which are bonded together with the hemicellulose [31]. This peak is not present in the reference spectra and became less intense in the H2O2 pre-treated samples. Huang et al. [42] reported a similar observation when rape raw residue was subjected to H2O2 treatment. Similarly, the peak at 1625 cm−1, which originated from stretching of the C=C and C=O lignin aromatic ring [53], gradually reduced with increasing H2O2 concentration. Gradual disappearance of these peaks suggests that the hemicellulose and lignin have been partially removed from the banana peel. Based on this finding and the color change observed in Figure 3, 30% H2O2 was selected for further investigation on acid hydrolysis. An obvious reduction in the peak intensity at 1723 and 1625 cm−1 can be observed when the pre-treated sample was treated further with H2SO4 (Figure 5). Indeed, the absence of the peak at 1723 cm−1 in samples treated with 6%, 8%, and 10% of H2SO4 suggests that the hemicellulose and lignin components that are present in the banana fiber were almost entirely eliminated during the acid hydrolysis at these conditions [54]. The success of the one-pot H2O2 pre-treatment and H2SO4 hydrolysis was further confirmed by the intensified absorption bands at 1430, 1368, 1314, and 1021 cm−1 and the appearance of peak at 896 cm−1 at all the H2O2/H2SO4-treated samples, which corresponds to stretching and bending vibrations of –CH2 and –CH, –OH and C–O bonds in cellulose [55,56]. These peaks did not appear or were less intense in the banana peel spectrum.
3.4. Crystallinity of the CNCs
Crystallinity of CNCs is one of the main factors that determines its mechanical strength, thermal degradation behavior, and reinforcing ability in nanocomposite applications [57]. Figure 6 shows that all the hydrolyzed samples have a similar XRD pattern, with prominent peaks at 2θ = 16° and 22° corresponding to the (110) and (200) lattice planes which represent the typical cellulose I [10,47,58]. The findings are consistent with other research [9,52,55], confirming that the original structure of native banana peel cellulose was retained after the isolation process [55]. Additional peaks that appeared in the spectra of the control sample (0% H2SO4) indicate the presence of impurities, probably from an inorganic substance as reported by [59].
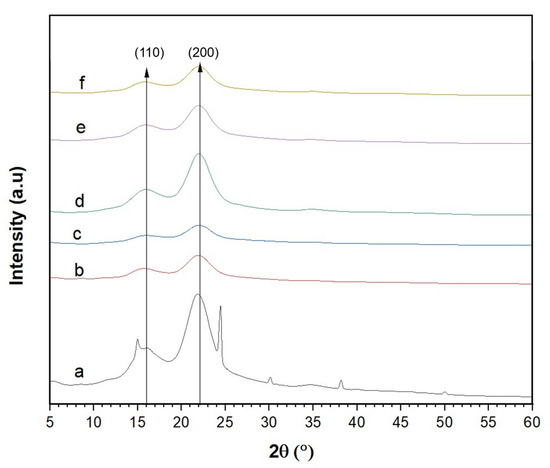
Figure 6.
X-ray diffraction pattern of the nanocellulose obtained after hydrolysis with different sulfuric acid concentrations: (a) 0%, (b) 2%, (c) 4%, (d) 6%, (e) 8%, and (f) 10%.
From Table 3, it was observed that the H2SO4 concentration influenced the degree of crystallinity. The crystallinity of BP powder was determined to be 58.1%, and the value increase after H2O2 pre-treatment and H2SO4 hydrolysis due to the elimination of hemicellulose and delignification process [9], as well as the removal of amorphous domains of cellulose [60]. The sample hydrolyzed with 6% H2SO4 had the highest crystallinity of 85.2%, comparable to that of the standard cellulose (88.7%) and CNCs isolated from enset fiber (80.9%) [51], pear fruit peel (85.7%) [7], and date palm trunk mesh (89.6%) [61], but much higher than those from pea hull waste (77%) [58], Spanish poplar biomass (65%) [62], and cocoa pod husk (67.6%) [54]. The high crystallinity and sharp diffraction peak indicate a stronger hydrogen bonding interaction between the nanocellulose chains, which creates a high crystalline and compact structure [63]. However, lower crystallinity was obtained when the banana peel samples were hydrolyzed with 8% and 10% H2SO4. This could be due to partial degradation of crystalline region of the cellulose fiber [52] and is in agreement with the color changes and FTIR data.
Table 3.
Crystallinity index (CrI) of raw banana peel and after hydrolysis with 0 to 10% sulfuric acid.
3.5. SEM, TEM, and AFM Analyses
The microstructure of the BP powder and the freeze-dried suspensions after the one-pot process were observed using Scanning Electron Microscope (SEM). As presented in Figure 7, the raw BP appears as aggregated structure with a rough surface due to the intact lignocellulosic components. Clear morphological changes were observed after the BP powder was subjected to pre-treatment and hydrolysis. The freeze-dried suspensions showed a sheet-like structure, which was commonly observed when cellulose suspension was subjected to a relatively slow freezing process (−20 °C) [64]. Closer observation on the surface of the sheet revealed randomly arranged nanosized cellulose fibers with a diameter ranging from 70–150 nm. Further hydrolysis with 6% H2SO4 causes fragmentation of the cellulose fibers, as can be seen in Figure 7f.
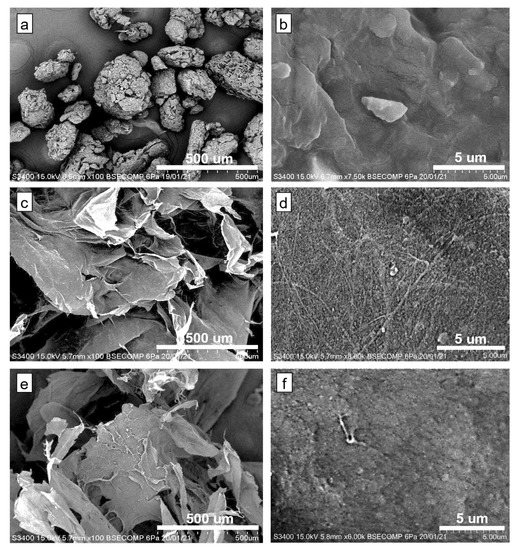
Figure 7.
SEM images of (a,b) Banana peel powder; (c,d) Freeze-dried H2O2-pre-treated banana peel; and (e,f) Freeze-dried H2O2/ H2SO4-treated banana peel. The concentrations of H2O2 and H2SO4 used were 30% and 6%, respectively.
The formation of a sheet-like structure during freeze-drying of cellulose suspension could be associated with the self-assembly behavior of cellulose, brought about by the strong hydrogen bonding between cellulose sub-units. Extensive investigation on the self-assembly behavior of cellulose nanoparticles during freeze-drying has been conducted by [65]. In their study, CNCs and CNFs were extracted from bleached wood pulp by pre-treatment with 20 wt% aqueous sodium hydroxide solution followed by hydrolysis with 64% and 48% sulfuric acid, respectively. It was inferred that the occurrence of this phenomenon could be related to the basic physics of ice crystal growth, as well as the interaction between cellulose particles. The freezing process causes the cellulose particles to concentrate and become trapped at the edge of the growing ice crystals. The particles were then aggregated with the adjacent particles through hydrogen bonding and were further rearranged and self-assembled along the freezing direction to form a sheet-like structure. Similar observations were also reported when walnut shells [66] and empty fruit bunches [64] were subjected to freeze-drying.
The TEM and AFM images in Figure 8 confirmed the presence of spherical CNCs particles with uniform size distribution and an average size of 20.5 ± 6.5 nm. The particle morphology is different from the typical rod- or needle-like morphologies of CNCs obtained through sulfuric acid hydrolysis [54,60,67,68]. Although several studies have reported the production of spherical CNCs with a size of less than 100 nm from various sources, including waste cotton [52,69], oil palm empty fruit bunch [70], and pear fruit peel [7], the exact structure and formation mechanism are principally unknown. Chen et al. [7] postulated that the formation of spherical CNCs could be attributed to the self-assembly of short cellulose rods via interfacial hydrogen bonds. Ultrasonic treatment applied to the suspension prior to the TEM and AFM analyses might also facilitate the formation of spherical CNCs, as reported by Azrina et al. [70]. According to Dong et al. [71], spherical CNCs could be potential candidates as a Pickering stabilizer in food, cosmetic, and biomedicine due to their high emulsification index, high stability, and low viscosity.
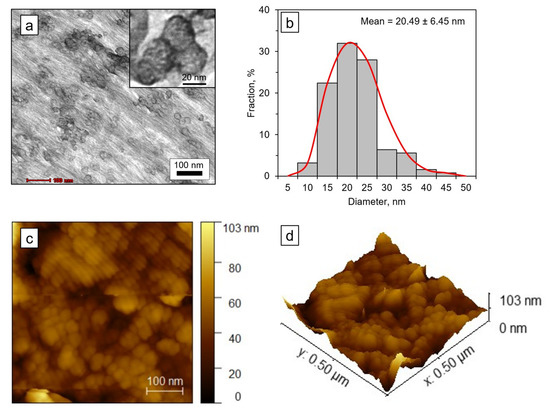
Figure 8.
Morphological properties of CNCs obtained after one-pot microwave and oxidative hydrolysis treatment with 30% H2O2 and 6% H2SO4: (a) TEM image; (b) Particle size distribution of nanocellulose analyzed from the TEM images using ImageJ; (c,d) AFM images.
Aggregation of the CNCs can also be clearly observed in both the TEM and AFM images which led to the formation of a dense layered structure (Figure 8d). During the drying process of the suspension, the CNCs particles become closer to one another as the water is removed, and finally form a close-packed network [72]. This phenomenon is possibly driven by a layer-by-layer and thermodynamically favored process to reduced specific surface area [7]. Besides that, the smaller distance between the particles could also be due to the effect of capillary and diffusion forces [70].
3.6. Particle Size and Zeta Potential Analyses
Dynamic light scattering (DLS) is one of the most frequently used methods to obtain the size of nanoparticles dispersed in liquids. The particle size distribution of the banana peel CNCs in aqueous suspension is shown in Figure 9a. Narrow particle size distribution can be observed with an average diameter of 89.9 ± 23.9 nm. About 77% of the particles had a size below 100 nm, and 99.5% were less than 200 nm. It should be noted that the particle size obtained by DLS is about four times larger than the size measured from TEM image, a tendency that have been reported previously by Gong et al. [73] and Harini et al. [8]. This could be due to the fact that DLS measures the hydrodynamic diameter of the particles, which also includes the hydration layer, leading to a larger particle size [74]. Besides that, the presence of bigger particles may contribute to an increase in light scattering, shifting the measured particles’ size towards larger values [75].
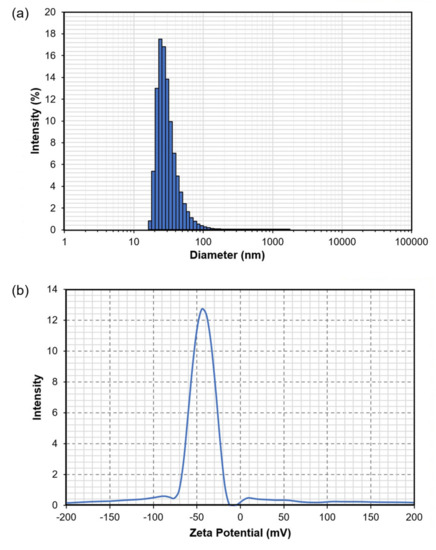
Figure 9.
Distribution of (a) particle size and (b) Zeta potential of CNCs produced from banana peel using the one-pot process.
Zeta potential is an important parameter that relates to the surface charge of particles and determines the stability of CNCs suspension [31]. High zeta potential (absolute value) indicates stable suspension and low tendency of particle aggregation. On the other hand, for suspension with low zeta potential, repulsive forces between the particles are minimal, which may lead to the formation of aggregates [68]. Figure 9b shows the zeta potential distribution of the CNCs suspension obtained after the one-pot process. The CNCs exhibit a high negative surface charge (−42.9 mV), consistent with previous reports on CNCs produced through H2SO4 hydrolysis [52,68,76]. Generally, particles with absolute zeta potential of higher than 30 mV are considered kinetically stable [52]. The high zeta potential of the CNCs is due to the formation of anionic sulfate ester groups (–OSO3−) during acid hydrolysis with H2SO4, which results in strong electrostatic repulsion [76].
4. Conclusions
The present study provides insight on the feasibility of one-pot oxidative hydrolysis system using hydrogen peroxide and sulfuric acid at mild concentrations for isolation of nanocellulose from abundant and underutilized banana peels. Spherical CNCs with average size of 20.5 ± 6.5 nm, high crystallinity, and good colloidal stability was successfully isolated from banana peel powder. The method employed could provide simpler and environmentally benign alternatives to the conventional nanocellulose isolation method. Investigation of swelling, mechanical, and thermal properties of the CNCs should be explored in future studies for potential food applications such as additives and stabilizers, as well as reinforcement in food packaging materials.
Supplementary Materials
The following supporting information can be downloaded at: https://www.mdpi.com/article/10.3390/nano12193537/s1, Figure S1: Suspensions obtained after the H2O2-pre-treated banana peel samples were subjected to acid hydrolysis at concentration ranging from 0% (control) to 10%.
Author Contributions
Conceptualization, S.S. (Suryani Saallah), S.S. (Shafiquzzaman Siddiquee), M.M., J.R. and W.L.; investigation, N.A.M.J. and S.S.J.; writing—original draft preparation, N.A.M.J.; writing—review and editing, S.S. (Suryani Saallah), J.R., N.A.M.J. and S.S.J.; funding acquisition, S.S. (Suryani Saallah), M.M., S.S. (Shafiquzzaman Siddiquee), J.R. and W.L.; supervision, S.S. (Suryani Saallah), M.M. and J.R. All authors have read and agreed to the published version of the manuscript.
Funding
This research was funded by Ministry of Higher Education Malaysia, grant number RACER/1/2019/TK10/UMS//1 and Universiti Malaysia Sabah, grant number PHD0020-2019.
Institutional Review Board Statement
Not applicable.
Informed Consent Statement
Not applicable.
Data Availability Statement
Not applicable.
Conflicts of Interest
The authors declare no conflict of interest.
References
- Mishra, R.K.; Sabu, A.; Tiwari, S.K. Materials Chemistry and the Futurist Eco-Friendly Applications of Nanocellulose: Status and Prospect. J. Saudi Chem. Soc. 2018, 22, 949–978. [Google Scholar] [CrossRef]
- Rashid, S.; Dutta, H. Characterization of Nanocellulose Extracted from Short, Medium and Long Grain Rice Husks. Ind. Crops Prod. 2020, 154, 112627. [Google Scholar] [CrossRef]
- Oun, A.A.; Rhim, J.W. Isolation of Oxidized Nanocellulose from Rice Straw Using the Ammonium Persulfate Method. Cellulose 2018, 25, 2143–2149. [Google Scholar] [CrossRef]
- Louis, A.C.F.; Venkatachalam, S. Energy Efficient Process for Valorization of Corn Cob as a Source for Nanocrystalline Cellulose and Hemicellulose Production. Int. J. Biol. Macromol. 2020, 163, 260–269. [Google Scholar] [CrossRef] [PubMed]
- Hassan, S.H.; Velayutham, T.S.; Chen, Y.W.; Lee, H.V. TEMPO-Oxidized Nanocellulose Films Derived from Coconut Residues: Physicochemical, Mechanical and Electrical Properties. Int. J. Biol. Macromol. 2021, 180, 392–402. [Google Scholar] [CrossRef] [PubMed]
- Espinosa, E.; Arrebola, R.I.; Bascón-Villegas, I.; Sánchez-Gutiérrez, M.; Domínguez-Robles, J.; Rodríguez, A. Industrial Application of Orange Tree Nanocellulose as Papermaking Reinforcement Agent. Cellulose 2020, 27, 10781–10797. [Google Scholar] [CrossRef]
- Chen, Y.W.; Hasanulbasori, M.A.; Chiat, P.F.; Lee, H.V. Pyrus Pyrifolia Fruit Peel as Sustainable Source for Spherical and Porous Network Based Nanocellulose Synthesis via One-Pot Hydrolysis System. Int. J. Biol. Macromol. 2019, 123, 1305–1319. [Google Scholar] [CrossRef]
- Harini, K.; Ramya, K.; Sukumar, M. Extraction of Nano Cellulose Fibers from the Banana Peel and Bract for Production of Acetyl and Lauroyl Cellulose. Carbohydr. Polym. 2018, 201, 329–339. [Google Scholar] [CrossRef] [PubMed]
- Baruah, J.; Bardhan, P.; Mukherjee, A.K.; Deka, R.C.; Mandal, M.; Kalita, E. Integrated Pretreatment of Banana Agrowastes: Structural Characterization and Enhancement of Enzymatic Hydrolysis of Cellulose Obtained from Banana Peduncle. Int. J. Biol. Macromol. 2022, 201, 298–307. [Google Scholar] [CrossRef] [PubMed]
- Tibolla, H.; Maria, F.; Cecilia, F. Cellulose Nanofibers Produced from Banana Peel by Chemical and Enzymatic Treatment LWT-Food Science and Technology Cellulose Nano Fi Bers Produced from Banana Peel by Chemical and Enzymatic Treatment. LWT- Food Sci. Technol. 2014, 59, 1311–1318. [Google Scholar] [CrossRef]
- Mohd Zaini, H.; Roslan, J.; Saallah, S.; Munsu, E.; Sulaiman, N.S.; Pindi, W. Banana Peels as a Bioactive Ingredient and Its Potential Application in the Food Industry. J. Funct. Foods 2022, 92, 105054. [Google Scholar] [CrossRef]
- Alzate Acevedo, S.; Díaz Carrillo, Á.J.; Flórez-López, E.; Grande-Tovar, C.D. Recovery of Banana Waste-Loss from Production and Processing: A Contribution to a Circular Economy. Molecules 2021, 26, 5282. [Google Scholar] [CrossRef] [PubMed]
- Sial, T.A.; Khan, M.N.; Lan, Z.; Kumbhar, F.; Ying, Z.; Zhang, J.; Sun, D.; Li, X. Contrasting Effects of Banana Peels Waste and Its Biochar on Greenhouse Gas Emissions and Soil Biochemical Properties. Process Saf. Environ. Prot. 2019, 122, 366–377. [Google Scholar] [CrossRef]
- Tibolla, H.; Pelissari, F.M.; Rodrigues, M.I.; Menegalli, F.C. Cellulose Nanofibers Produced from Banana Peel by Enzymatic Treatment: Study of Process Conditions. Ind. Crops Prod. 2017, 95, 664–674. [Google Scholar] [CrossRef]
- Tibolla, H.; Pelissari, F.M.; Martins, J.T.; Vicente, A.A.; Menegalli, F.C. Cellulose Nanofibers Produced from Banana Peel by Chemical and Mechanical Treatments: Characterization and Cytotoxicity Assessment. Food Hydrocoll. 2018, 75, 192–201. [Google Scholar] [CrossRef]
- Pelissari, F.M.; Sobral, P.J.D.A.; Menegalli, F.C. Isolation and Characterization of Cellulose Nanofibers from Banana Peels. Cellulose 2014, 21, 417–432. [Google Scholar] [CrossRef]
- Kabenge, I.; Omulo, G.; Banadda, N.; Seay, J.; Zziwa, A.; Kiggundu, N. Characterization of Banana Peels Wastes as Potential Slow Pyrolysis Feedstock. J. Sustain. Dev. 2018, 11, 14. [Google Scholar] [CrossRef]
- Oliveira, T.Í.S.; Rosa, M.F.; Cavalcante, F.L.; Pereira, P.H.F.; Moates, G.K.; Wellner, N.; Mazzetto, S.E.; Waldron, K.W.; Azeredo, H.M.C. Optimization of Pectin Extraction from Banana Peels with Citric Acid by Using Response Surface Methodology. Food Chem. 2016, 198, 113–118. [Google Scholar] [CrossRef]
- Orozco, R.S.; Hernández, P.B.; Morales, G.R.; Núñez, F.U.; Villafuerte, J.O.; Lugo, V.L.; Ramírez, N.F.; Díaz, C.E.B.; Vázquez, P.C. Characterization of Lignocellulosic Fruit Waste as an Alternative Feedstock for Bioethanol Production. BioResources 2014, 9, 1873–1885. [Google Scholar]
- Khawas, P.; Deka, S.C. Comparative Nutritional, Functional, Morphological, and Diffractogram Study on Culinary Banana (Musa ABB) Peel at Various Stages of Development. Int. J. Food Prop. 2016, 19, 2832–2853. [Google Scholar] [CrossRef]
- Dhali, K.; Ghasemlou, M.; Daver, F.; Cass, P.; Adhikari, B. A Review of Nanocellulose as a New Material towards Environmental Sustainability. Sci. Total Environ. 2021, 775, 145871. [Google Scholar] [CrossRef] [PubMed]
- Yang, X.; Biswas, S.K.; Han, J.; Tanpichai, S.; Li, M.C.; Chen, C.; Zhu, S.; Das, A.K.; Yano, H. Surface and Interface Engineering for Nanocellulosic Advanced Materials. Adv. Mater. 2021, 33, 2002264. [Google Scholar] [CrossRef] [PubMed]
- Xiao, J.; Li, H.; Zhang, H.; He, S.; Zhang, Q.; Liu, K.; Jiang, S.; Duan, G.; Zhang, K. Nanocellulose and Its Derived Composite Electrodes toward Supercapacitors: Fabrication, Properties, and Challenges. J. Bioresour. Bioprod. 2022. [Google Scholar] [CrossRef]
- Niu, Z.; Cheng, W.; Cao, M.; Wang, D.; Wang, Q.; Han, J.; Long, Y.; Han, G. Recent Advances in Cellulose-Based Flexible Triboelectric Nanogenerators. Nano Energy 2021, 87, 106175. [Google Scholar] [CrossRef]
- Amin, K.N.M.; Hosseinmardi, A.; Martin, D.J.; Annamalai, P.K. A Mixed Acid Methodology to Produce Thermally Stable Cellulose Nanocrystal at High Yield Using Phosphoric Acid. J. Bioresour. Bioprod. 2022, 7, 99–108. [Google Scholar] [CrossRef]
- Franco, T.S. Nanocellulose in Food Science and Technology—Potential, Advantages and Gaps of Research. Nov. Tech. Nutr. Food Sci. 2018, 1, 2016–2017. [Google Scholar] [CrossRef]
- Fujisawa, S.; Togawa, E.; Kuroda, K. Nanocellulose-Stabilized Pickering Emulsions and Their Applications. Sci. Technol. Adv. Mater. 2017, 18, 959–971. [Google Scholar] [CrossRef] [PubMed]
- Leung, A.C.W.; Hrapovic, S.; Lam, E.; Liu, Y.; Male, K.B.; Mahmoud, K.A.; Luong, J.H.T. Characteristics and Properties of Carboxylated Cellulose Nanocrystals Prepared from a Novel One-Step Procedure. Small 2011, 7, 302–305. [Google Scholar] [CrossRef] [PubMed]
- Singanusong, R.; Tochampa, W.; Kongbangkerd, T.; Sodchit, C. Extraction and Properties of Cellulose From Banana Peels. Suranaree J. Sci. Technol. 2013, 21, 14. [Google Scholar] [CrossRef]
- Chávez-Guerrero, L.; Toxqui-Terán, A.; Pérez-Camacho, O. One-Pot Isolation of Nanocellulose Using Pelagic Sargassum Spp. from the Caribbean Coastline. J. Appl. Phycol. 2022, 34, 637–645. [Google Scholar] [CrossRef]
- Andrade-Mahecha, M.M.; Pelissari, F.M.; Tapia-Blácido, D.R.; Menegalli, F.C. Achira as a Source of Biodegradable Materials: Isolation and Characterization of Nanofibers. Carbohydr. Polym. 2015, 123, 406–415. [Google Scholar] [CrossRef] [PubMed]
- Song, K.; Zhu, X.; Zhu, W.; Li, X. Preparation and Characterization of Cellulose Nanocrystal Extracted from Calotropis Procera Biomass. Bioresour. Bioprocess. 2019, 6, 45. [Google Scholar] [CrossRef]
- Saallah, S.; Roslan, J.; Zakaria, N.N.; Pindi, W.; Siddiquee, S.; Misson, M.; Ongkudon, C.M.; Mohd Jamil, N.H.A.; Lenggoro, W. Isolation of Nanocellulose from Saba’ (Musa Acuminata × Balbisiana) Banana Peel by One-Pot Oxidation-Hydrolysis System. Adv. Agric. Food Res. J. 2020, 1, 1–14. [Google Scholar] [CrossRef]
- Camacho, M.; Ureña, Y.R.C.; Lopretti, M.; Carballo, L.B.; Moreno, G.; Alfaro, B.; Vega Baudrit, J.R. Synthesis and Characterization of Nanocrystalline Cellulose Derived from Pineapple Peel Residues. J. Renew. Mater. 2017, 5, 271–279. [Google Scholar] [CrossRef]
- Ibiyinka, O.; Akinwumi Oluwafemi, A.; Adebayo, O.O.; Olugbenga Kayode, P. Comparative Study of Chemical Composition and Evaluation of the In-Vitro Antioxidant Capacity of Unripe and Ripe Banana Species (Musa Sapientum) Biowastes. Int. J. Agric. Sci. Food Technol. 2021, 7, 061–066. [Google Scholar] [CrossRef]
- Pyar, H.; Peh, K.K. Chemical Compositions of Banana Peels (Musa Sapientum) Fruits Cultivated in Malaysia Using Proximate Analysis. Res. J. Chem. Environ. 2018, 22, 108–113. [Google Scholar]
- Deb, S.; Kumar, Y.; Saxena, D.C. Functional, Thermal and Structural Properties of Fractionated Protein from Waste Banana Peel. Food Chem. X 2022, 13, 100205. [Google Scholar] [CrossRef]
- Dibanda Romelle, F.; Ashwini, R.P.; Manohar, R.S. Chemical Composition of Some Selected Fruit Peels. Eur. J. Food Sci. Technol. 2016, 4, 12–21. [Google Scholar]
- Happi Emaga, T.; Andrianaivo, R.H.; Wathelet, B.; Tchango, J.T.; Paquot, M. Effects of the Stage of Maturation and Varieties on the Chemical Composition of Banana and Plantain Peels. Food Chem. 2007, 103, 590–600. [Google Scholar] [CrossRef]
- Tiwari, G.; Sharma, A.; Kumar, A.; Sharma, S. Assessment of Microwave-Assisted Alkali Pretreatment for the Production of Sugars from Banana Fruit Peel Waste. Biofuels 2019, 10, 3–10. [Google Scholar] [CrossRef]
- Su, J.; Zhu, H.; Wang, L.; Liu, X.; Nie, S.; Xiong, J. Optimization of Microwave-Hydrogen Peroxide Pretreatment of Cellulose. BioResources 2016, 11, 7416–7430. [Google Scholar] [CrossRef]
- Huang, X.; De Hoop, C.F.; Li, F.; Xie, J.; Hse, C.Y.; Qi, J.; Jiang, Y.; Chen, Y. Dilute Alkali and Hydrogen Peroxide Treatment of Microwave Liquefied Rape Straw Residue for the Extraction of Cellulose Nanocrystals. J. Nanomater. 2017, 2017, 4049061. [Google Scholar] [CrossRef]
- Koshani, R.; Van De Ven, T.G.M.; Madadlou, A. Characterization of Carboxylated Cellulose Nanocrytals Isolated through Catalyst-Assisted H2O2 Oxidation in a One-Step Procedure. J. Agric. Food Chem. 2018, 66, 7692–7700. [Google Scholar] [CrossRef]
- Andrade, D.R.M.; Mendonça, M.H.; Helm, C.V.; Magalhães, W.L.E.; de Muniz, G.I.B.; Kestur, S.G. Assessment of Nano Cellulose from Peach Palm Residue as Potential Food Additive: Part II: Preliminary Studies. J. Food Sci. Technol. 2015, 52, 5641–5650. [Google Scholar] [CrossRef] [PubMed]
- Shen, G.; Tao, H.; Zhao, M.; Yang, B.; Wen, D.; Yuan, Q.; Rao, G. Effect of Hydrogen Peroxide Pretreatment on the Enzymatic Hydrolysis of Cellulose. J. Food Process Eng. 2011, 34, 905–921. [Google Scholar] [CrossRef]
- Zhang, H.; Huang, S.; Wei, W.; Zhang, J.; Xie, J. Investigation of Alkaline Hydrogen Peroxide Pretreatment and Tween 80 to Enhance Enzymatic Hydrolysis of Sugarcane Bagasse. Biotechnol. Biofuels 2019, 12, 107. [Google Scholar] [CrossRef]
- Rosa, M.F.; Medeiros, E.S.; Malmonge, J.A.; Gregorski, K.S.; Wood, D.F.; Mattoso, L.H.C.; Glenn, G.; Orts, W.J.; Imam, S.H. Cellulose Nanowhiskers from Coconut Husk Fibers: Effect of Preparation Conditions on Their Thermal and Morphological Behavior. Carbohydr. Polym. 2010, 81, 83–92. [Google Scholar] [CrossRef]
- Jaffar, S.S.; Saallah, S.; Misson, M.; Siddiquee, S.; Roslan, J.; Saalah, S.; Lenggoro, W. Recent Development and Environmental Applications of Nanocellulose-Based Membranes. Membranes 2022, 12, 287. [Google Scholar] [CrossRef] [PubMed]
- Lee, H.V.; Hamid, S.B.A.; Zain, S.K. Conversion of Lignocellulosic Biomass to Nanocellulose: Structure and Chemical Process. Sci. World J. 2014, 2014, 631013. [Google Scholar] [CrossRef] [PubMed]
- Pavalaydon, K.; Ramasawmy, H.; Surroop, D. Comparative Evaluation of Cellulose Nanocrystals from Bagasse and Coir Agro-Wastes for Reinforcing PVA-Based Composites. Environ. Dev. Sustain. 2021, 24, 9963–9984. [Google Scholar] [CrossRef] [PubMed]
- Beyan, S.M.; Amibo, T.A.; Prabhu, S.V.; Ayalew, A.G. Production of Nanocellulose Crystal Derived from Enset Fiber Using Acid Hydrolysis Coupled with Ultrasonication, Isolation, Statistical Modeling, Optimization, and Characterizations. J. Nanomater. 2021, 2021, 7492532. [Google Scholar] [CrossRef]
- Doan, T.K.Q.; Chiang, K.Y. Characteristics and Kinetics Study of Spherical Cellulose Nanocrystal Extracted from Cotton Cloth Waste by Acid Hydrolysis. Sustain. Environ. Res. 2022, 32, 26. [Google Scholar] [CrossRef]
- Javier-Astete, R.; Jimenez-Davalos, J.; Zolla, G. Determination of Hemicellulose, Cellulose, Holocellulose and Lignin Content Using FTIR in Calycophyllum Spruceanum (Benth.) K. Schum. And Guazuma Crinita Lam. PLoS ONE 2021, 16, e0256559. [Google Scholar] [CrossRef] [PubMed]
- Akinjokun, A.I.; Petrik, L.F.; Ogunfowokan, A.O.; Ajao, J.; Ojumu, T.V. Isolation and Characterization of Nanocrystalline Cellulose from Cocoa Pod Husk (CPH) Biomass Wastes. Heliyon 2021, 7, e06680. [Google Scholar] [CrossRef]
- Lapuz, A.R.; Tsuchikawa, S.; Inagaki, T.; Ma, T.; Migo, V. Production of Nanocellulose Film from Abaca Fibers. Crystals 2022, 12, 601. [Google Scholar] [CrossRef]
- Bassyouni, M.; Zoromba, M.S.; Abdel-Aziz, M.H.; Mosly, I. Extraction of Nanocellulose for Eco-Friendly Biocomposite Adsorbent for Wastewater Treatment. Polymers 2022, 14, 1852. [Google Scholar] [CrossRef] [PubMed]
- Bahloul, A.; Kassab, Z.; El Bouchti, M.; Hannache, H.; Qaiss, A.E.K.; Oumam, M.; El Achaby, M. Micro- and Nano-Structures of Cellulose from Eggplant Plant (Solanum Melongena L.) Agricultural Residue. Carbohydr. Polym. 2021, 253, 117311. [Google Scholar] [CrossRef]
- Li, H.; Shi, H.; He, Y.; Fei, X.; Peng, L. Preparation and Characterization of Carboxymethyl Cellulose-Based Composite Films Reinforced by Cellulose Nanocrystals Derived from Pea Hull Waste for Food Packaging Applications. Int. J. Biol. Macromol. 2020, 164, 4104–4112. [Google Scholar] [CrossRef]
- Guimarães, J.L.; Frollini, E.; da Silva, C.G.; Wypych, F.; Satyanarayana, K.G. Characterization of Banana, Sugarcane Bagasse and Sponge Gourd Fibers of Brazil. Ind. Crops Prod. 2009, 30, 407–415. [Google Scholar] [CrossRef]
- Nang An, V.; Chi Nhan, H.T.; Tap, T.D.; Van, T.T.T.; Van Viet, P.; Van Hieu, L. Extraction of High Crystalline Nanocellulose from Biorenewable Sources of Vietnamese Agricultural Wastes. J. Polym. Environ. 2020, 28, 1465–1474. [Google Scholar] [CrossRef]
- Shaikh, H.M.; Anis, A.; Poulose, A.M.; Al-Zahrani, S.M.; Madhar, N.A.; Alhamidi, A.; Alam, M.A. Isolation and Characterization of Alpha and Nanocrystalline Cellulose from Date Palm (Phoenix Dactylifera L.) Trunk Mesh. Polymers 2021, 13, 1893. [Google Scholar] [CrossRef] [PubMed]
- Mehanny, S.; Abu-El Magd, E.E.; Sorbara, S.; Navarro, J.; Gil-San-millan, R. Spanish Poplar Biomass as a Precursor for Nanocellulose Extraction. Appl. Sci. 2021, 11, 6863. [Google Scholar] [CrossRef]
- Xie, J.; Hse, C.Y.; De Hoop, C.F.; Hu, T.; Qi, J.; Shupe, T.F. Isolation and Characterization of Cellulose Nanofibers from Bamboo Using Microwave Liquefaction Combined with Chemical Treatment and Ultrasonication. Carbohydr. Polym. 2016, 151, 725–734. [Google Scholar] [CrossRef]
- Burhani, D.; Septevani, A.A.; Setiawan, R.; Djannah, L.M.; Putra, M.A.; Kusumah, S.S.; Sondari, D. Self-Assembled Behavior of Ultralightweight Aerogel from a Mixture of Cnc/Cnf from Oil Palm Empty Fruit Bunches. Polymers 2021, 13, 2649. [Google Scholar] [CrossRef]
- Han, J.; Zhou, C.; Wu, Y.; Liu, F.; Wu, Q. Self-Assembling Behavior of Cellulose Nanoparticles during Freeze-Drying: Effect of Suspension Concentration, Particle Size, Crystal Structure, and Surface Charge. Biomacromolecules 2013, 14, 1529–1540. [Google Scholar] [CrossRef]
- Zheng, D.; Zhang, Y.; Guo, Y.; Yue, J. Isolation and Characterization of Nanocellulose with a Novel Shape from Walnut (Juglans Regia L.) Shell Agricultural Waste. Polymers 2019, 11, 1130. [Google Scholar] [CrossRef]
- Doh, H.; Lee, M.H.; Whiteside, W.S. Physicochemical Characteristics of Cellulose Nanocrystals Isolated from Seaweed Biomass. Food Hydrocoll. 2020, 102, 105542. [Google Scholar] [CrossRef]
- Maciel, M.M.Á.D.; de Carvalho Benini, K.C.C.; Voorwald, H.J.C.; Cioffi, M.O.H. Obtainment and Characterization of Nanocellulose from an Unwoven Industrial Textile Cotton Waste: Effect of Acid Hydrolysis Conditions. Int. J. Biol. Macromol. 2019, 126, 496–506. [Google Scholar] [CrossRef]
- Fattahi Meyabadi, T.; Dadashian, F.; Mir Mohamad Sadeghi, G.; Ebrahimi Zanjani Asl, H. Spherical Cellulose Nanoparticles Preparation from Waste Cotton Using a Green Method. Powder Technol. 2014, 261, 232–240. [Google Scholar] [CrossRef]
- Zianor Azrina, Z.A.; Beg, M.D.H.; Rosli, M.Y.; Ramli, R.; Junadi, N.; Alam, A.K.M.M. Spherical Nanocrystalline Cellulose (NCC) from Oil Palm Empty Fruit Bunch Pulp via Ultrasound Assisted Hydrolysis. Carbohydr. Polym. 2017, 162, 115–120. [Google Scholar] [CrossRef]
- Dong, H.; Ding, Q.; Jiang, Y.; Li, X.; Han, W. Pickering Emulsions Stabilized by Spherical Cellulose Nanocrystals. Carbohydr. Polym. 2021, 265, 118101. [Google Scholar] [CrossRef]
- Sinquefield, S.; Ciesielski, P.N.; Li, K.; Gardner, D.J.; Ozcan, S. Nanocellulose Dewatering and Drying: Current State and Future Perspectives. ACS Sustain. Chem. Eng. 2020, 8, 9601–9615. [Google Scholar] [CrossRef]
- Gong, J.; Li, J.; Xu, J.; Xiang, Z.; Mo, L. Research on Cellulose Nanocrystals Produced from Cellulose Sources with Various Polymorphs. RSC Adv. 2017, 7, 33486–33493. [Google Scholar] [CrossRef]
- Fissan, H.; Ristig, S.; Kaminski, H.; Asbach, C.; Epple, M. Comparison of Different Characterization Methods for Nanoparticle Dispersions before and after Aerosolization. Anal. Methods 2014, 6, 7324–7334. [Google Scholar] [CrossRef]
- Souza, T.G.F.; Ciminelli, V.S.T.; Mohallem, N.D.S. A Comparison of TEM and DLS Methods to Characterize Size Distribution of Ceramic Nanoparticles. J. Phys. Conf. Ser. 2016, 733, 012039. [Google Scholar] [CrossRef]
- Moreno, G.; Ramirez, K.; Esquivel, M.; Jimenez, G. Isolation and Characterization of Nanocellulose Obtained from Industrial Crop Waste Resources by Using Mild Acid Hydrolysis. J. Renew. Mater. 2018, 6, 362–369. [Google Scholar] [CrossRef]


Publisher’s Note: MDPI stays neutral with regard to jurisdictional claims in published maps and institutional affiliations. |
© 2022 by the authors. Licensee MDPI, Basel, Switzerland. This article is an open access article distributed under the terms and conditions of the Creative Commons Attribution (CC BY) license (https://creativecommons.org/licenses/by/4.0/).