
Ag–Se/Nylon Nanocomposites Grown by Template-Engaged Reaction: Microstructures, Composition, and Optical Properties


Abstract
:
1. Introduction
2. Materials and Methods
2.1. Polymer
2.2. Chemicals
2.3. Sample Preparation and Theoretical Background
2.4. Testing Procedures
3. Results
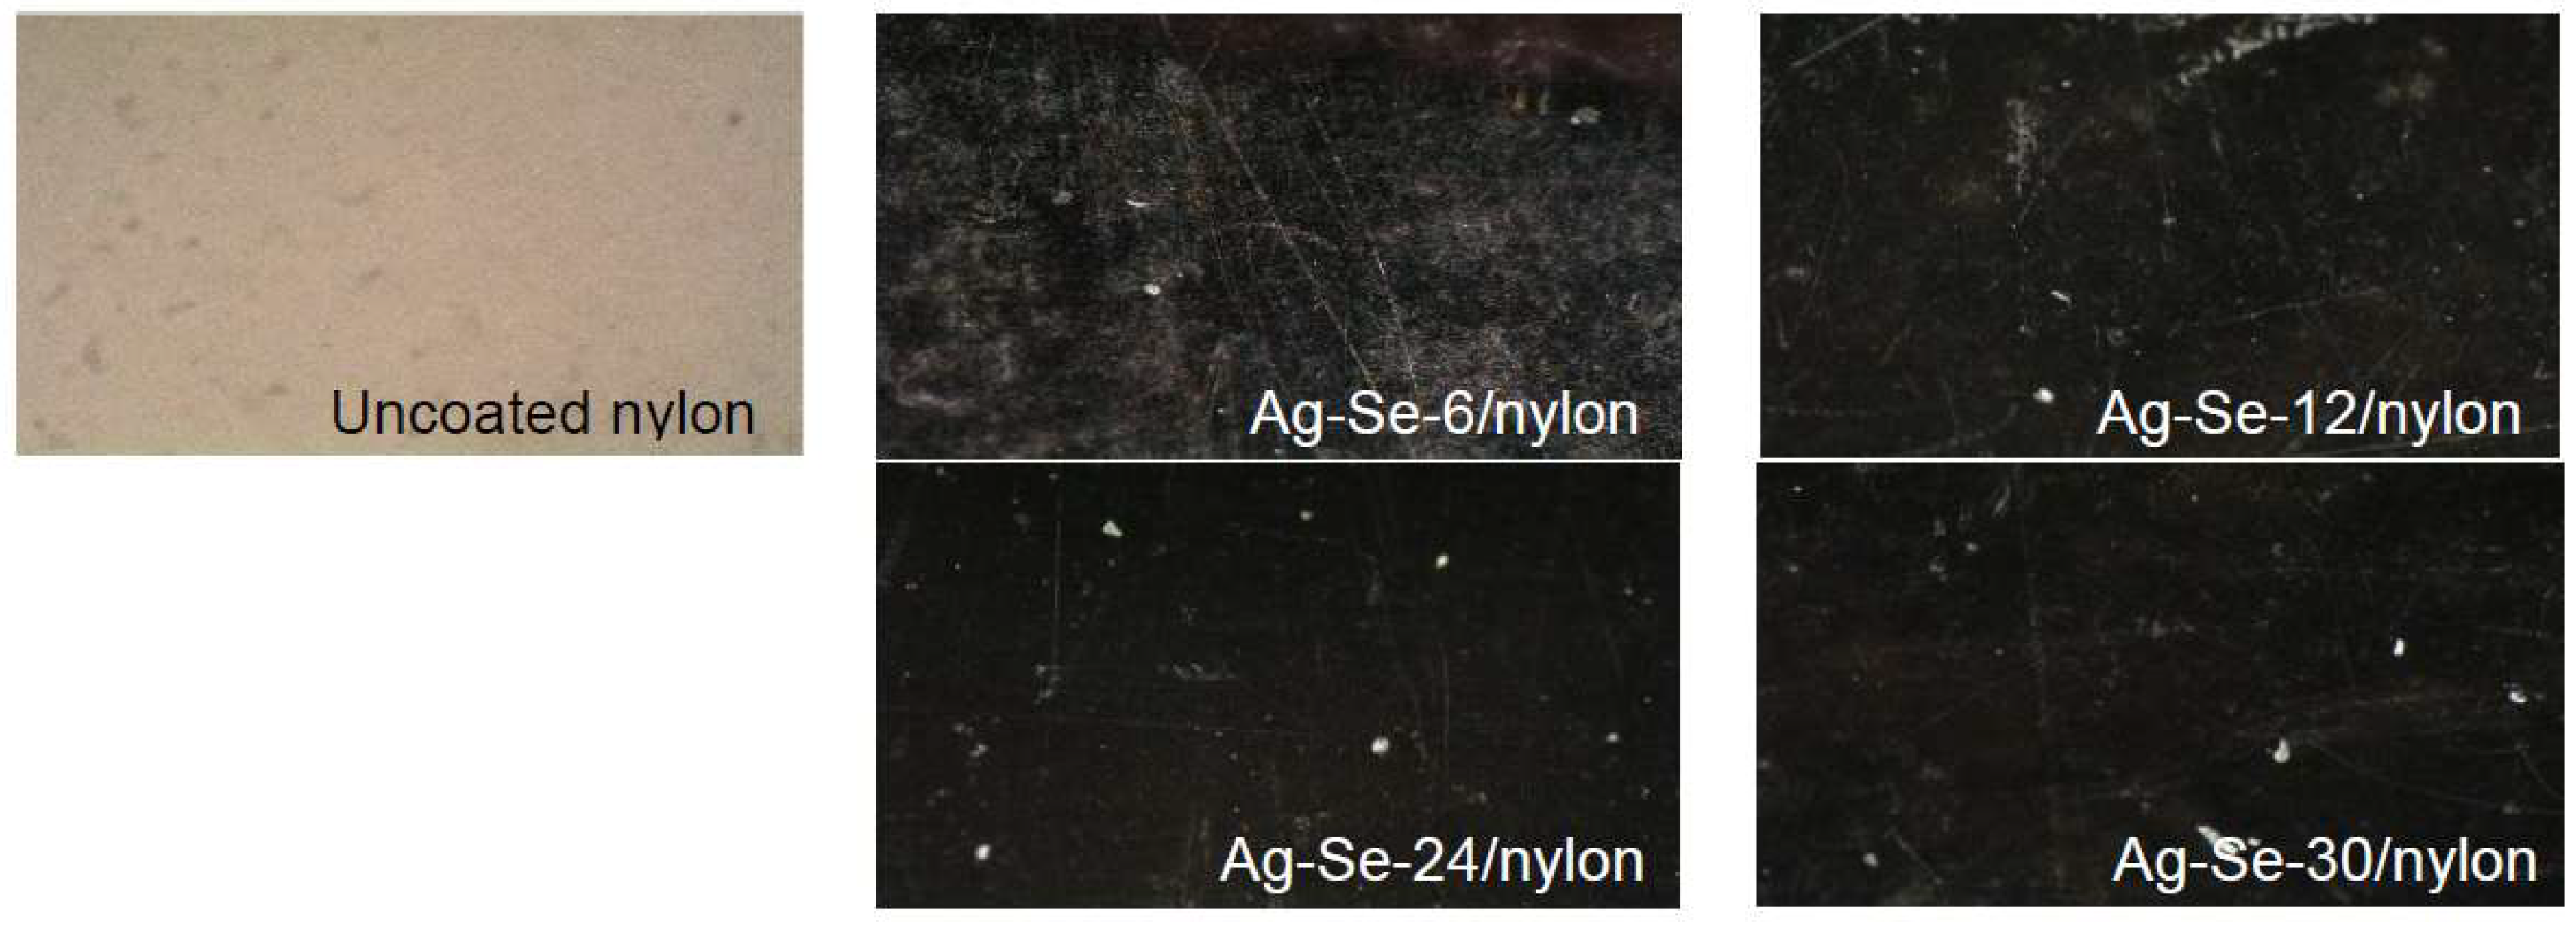
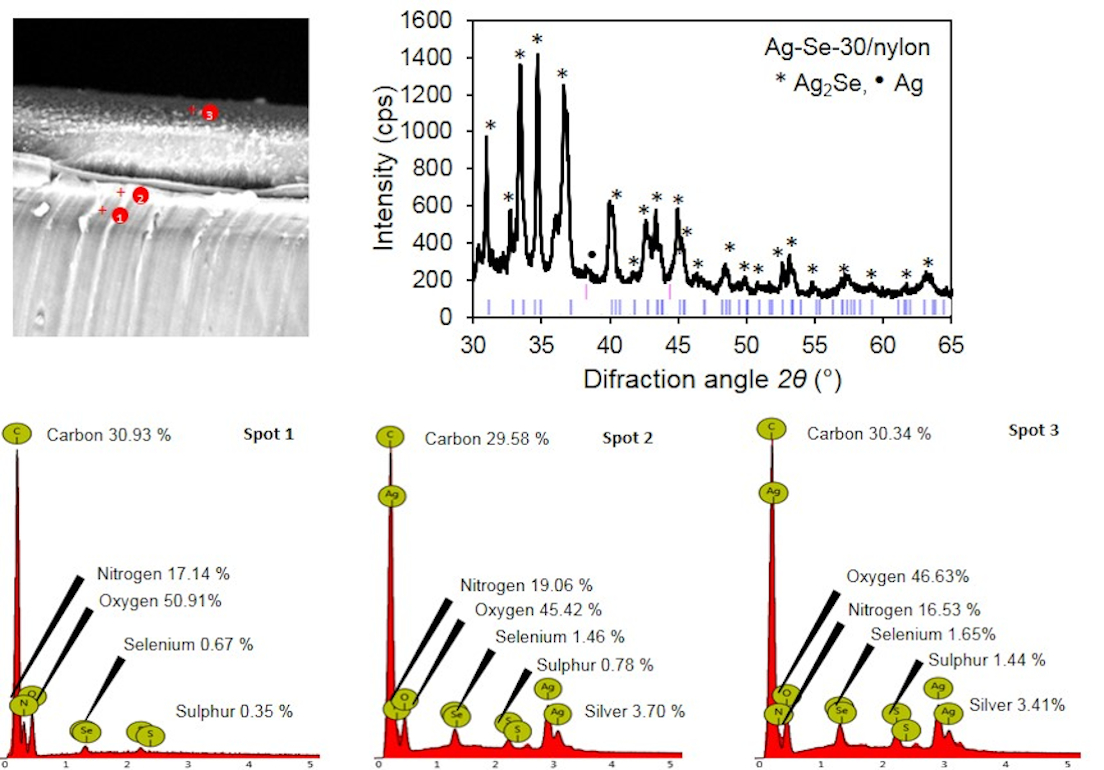
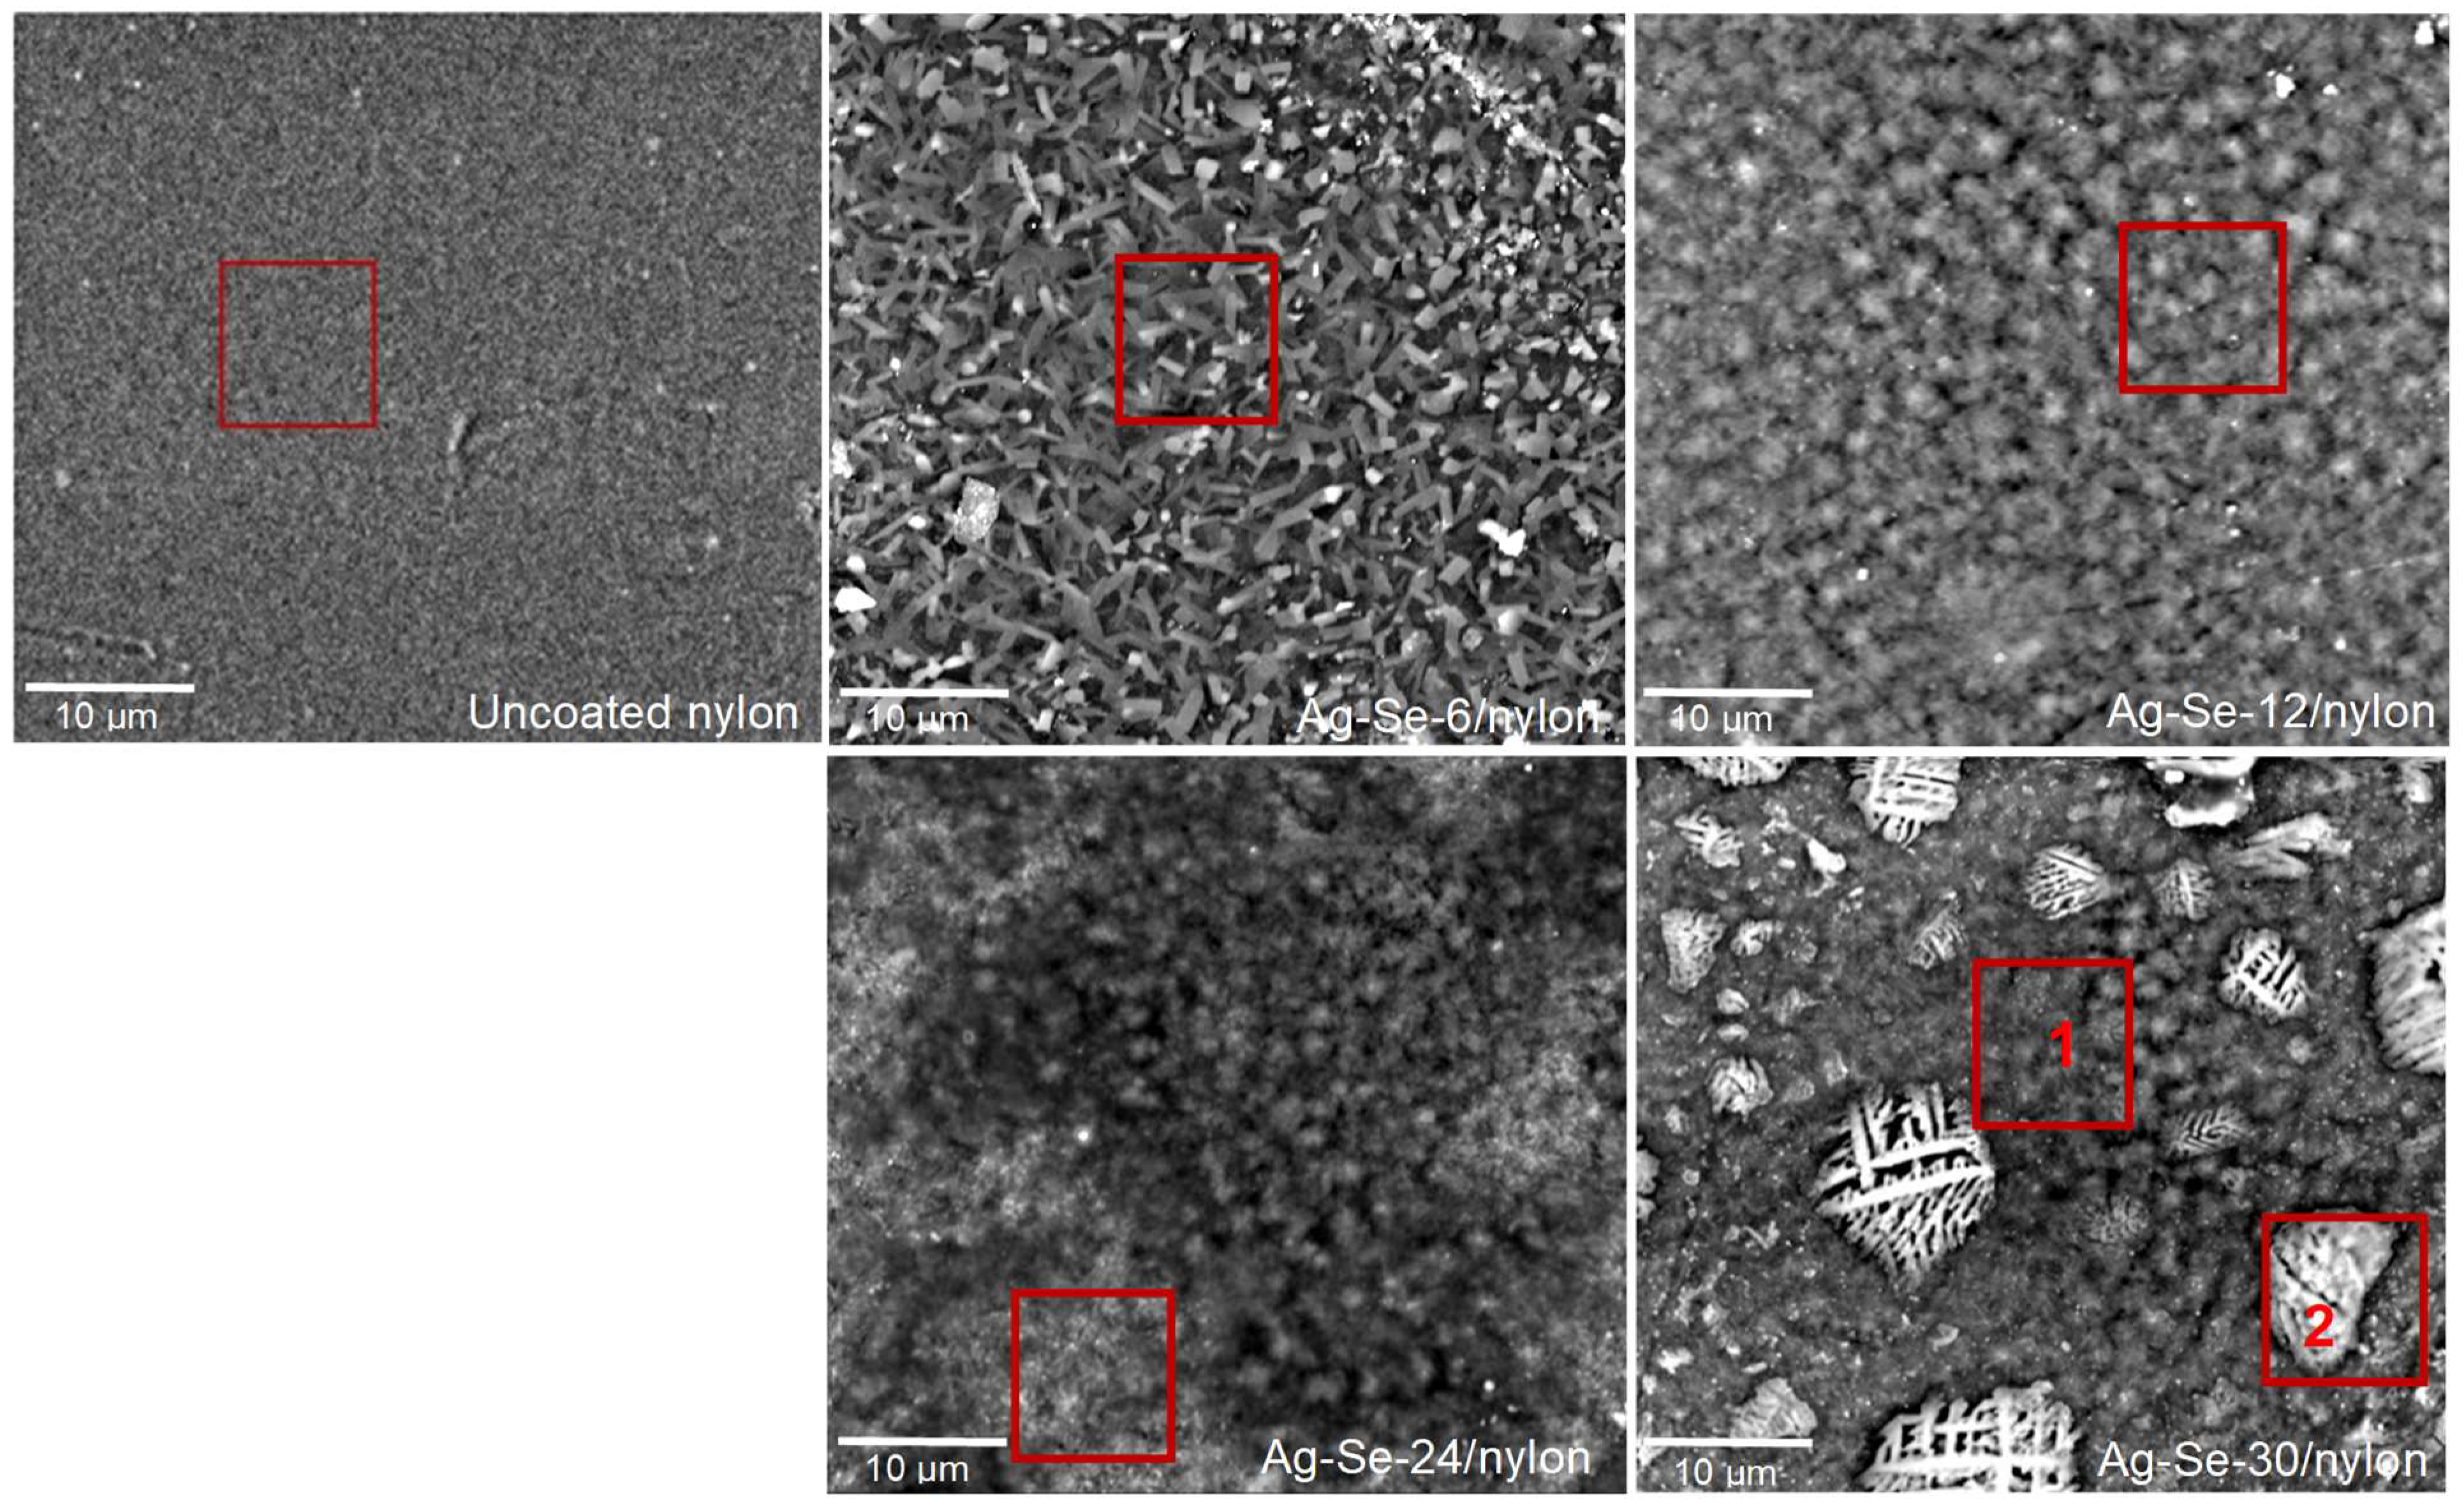
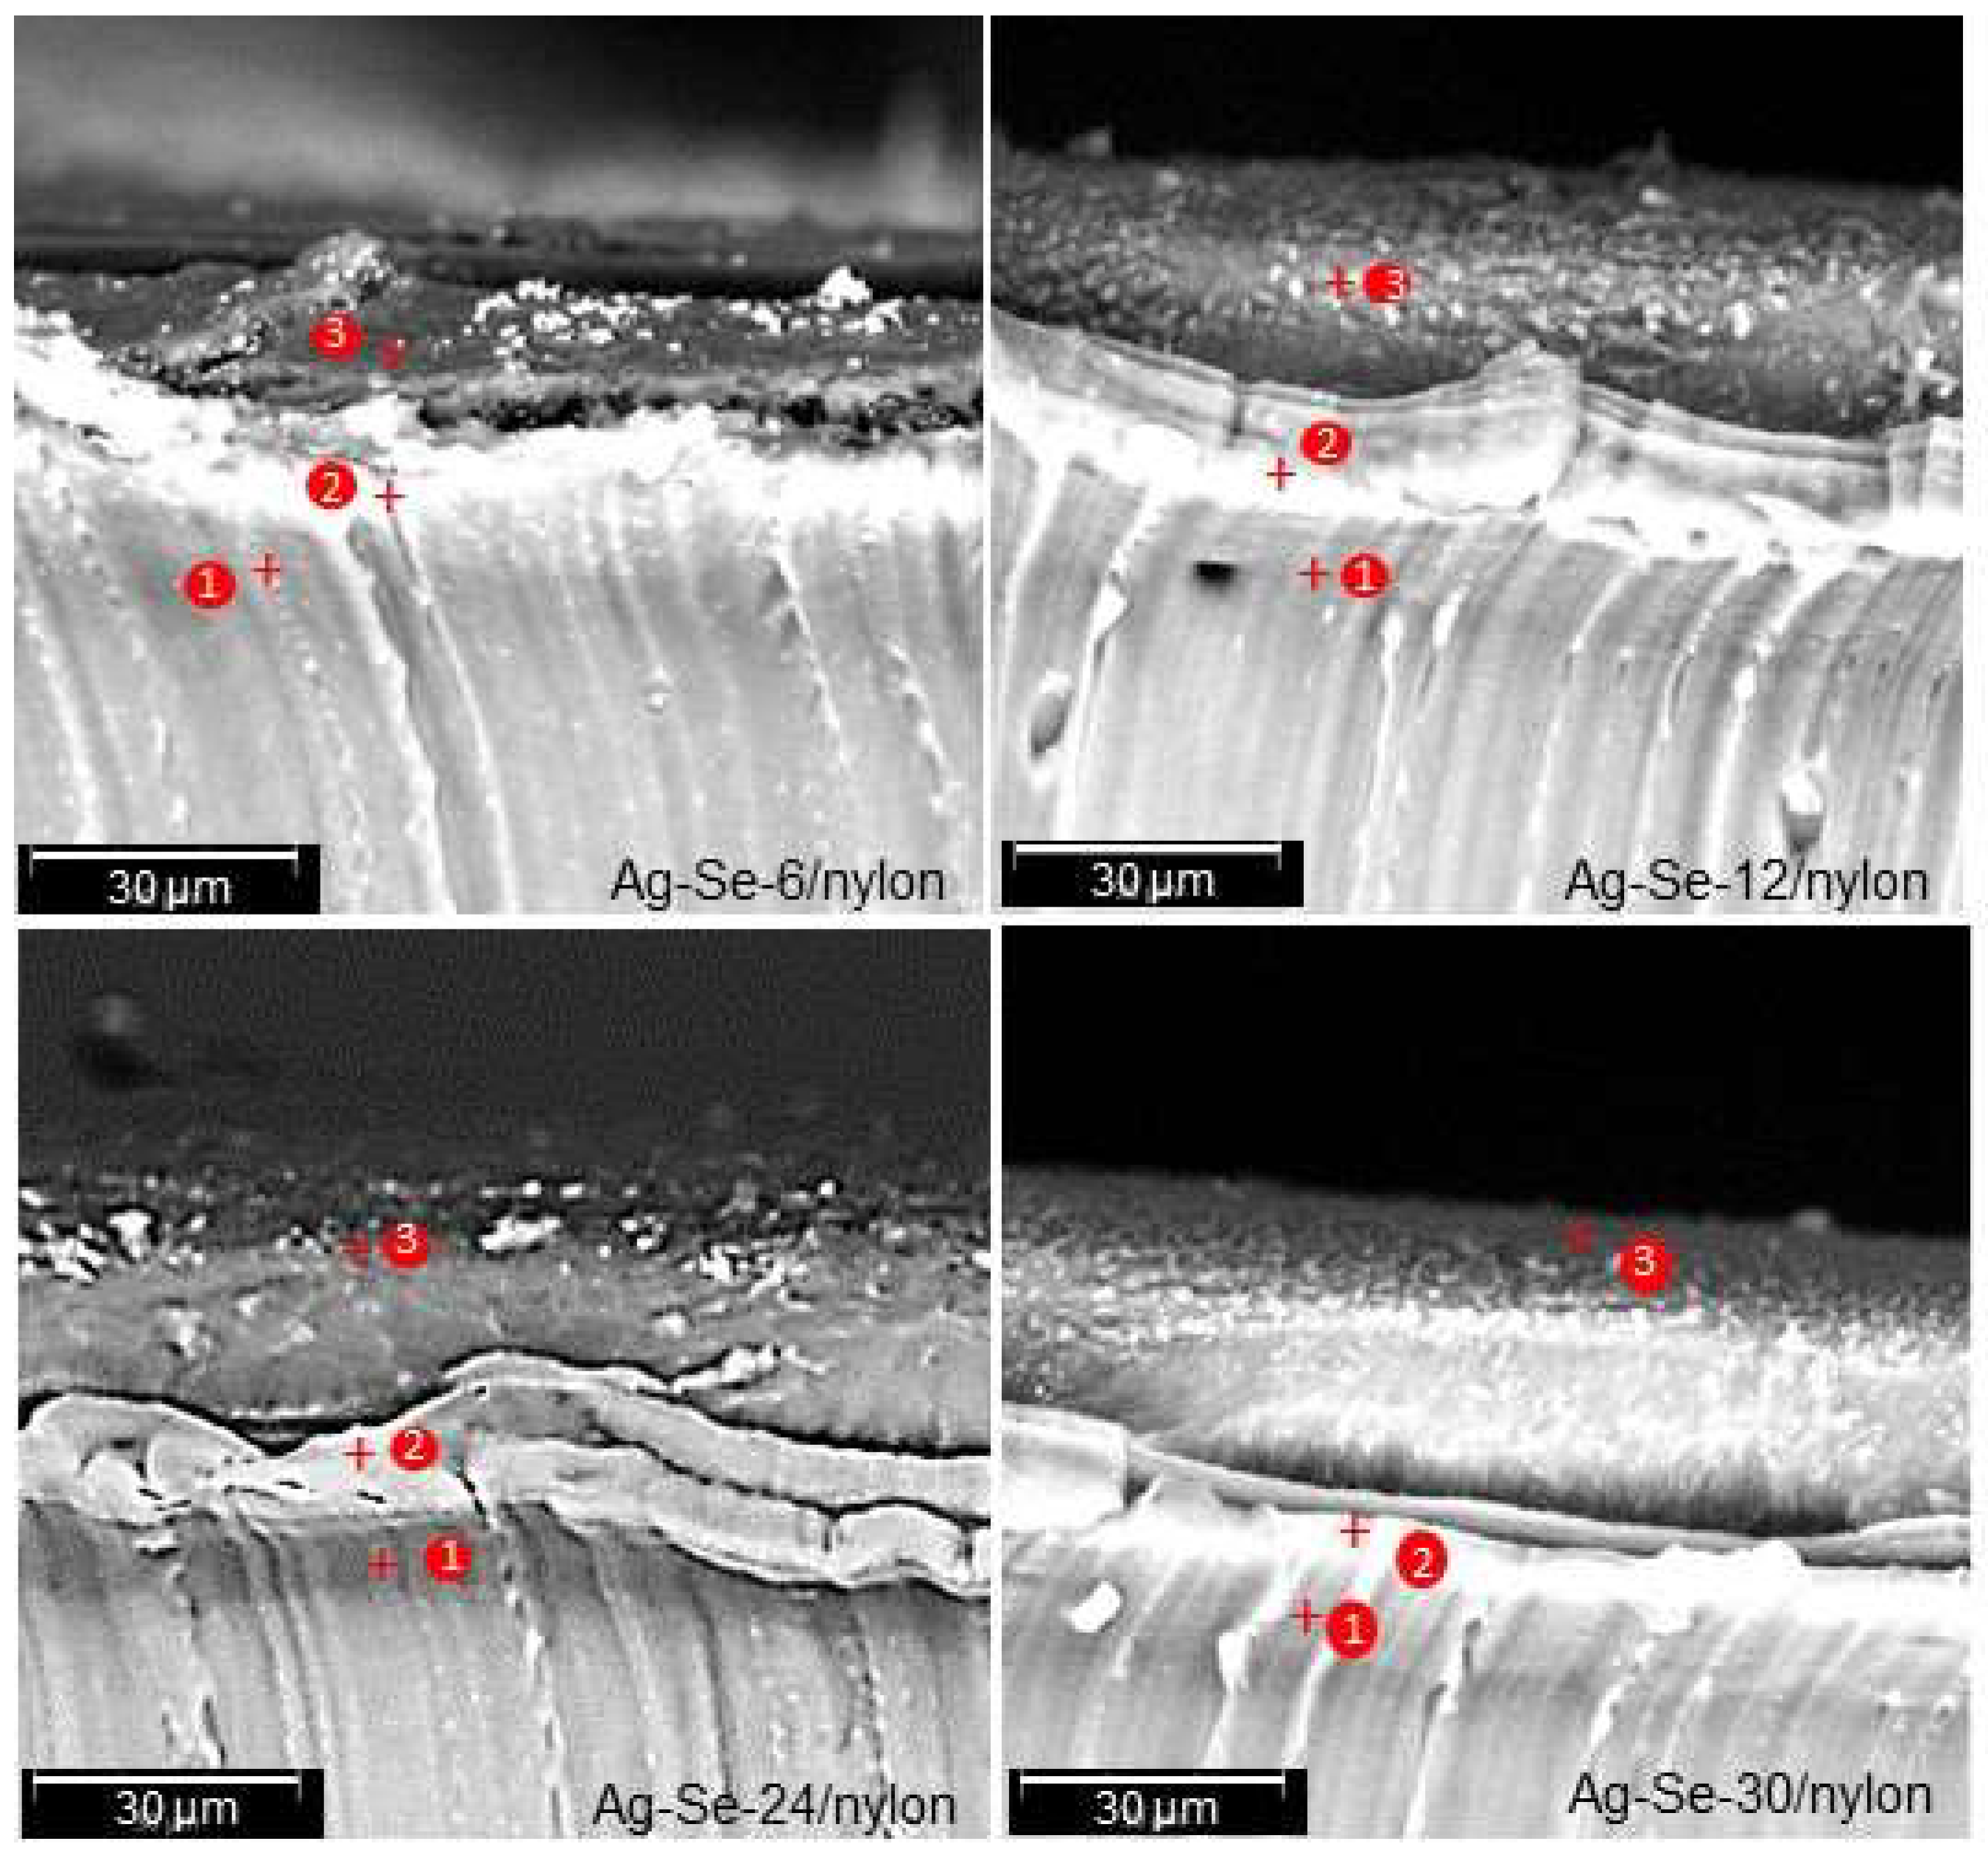
3.1. Optical Microscopy and ProX-SEM-EDS Analysis
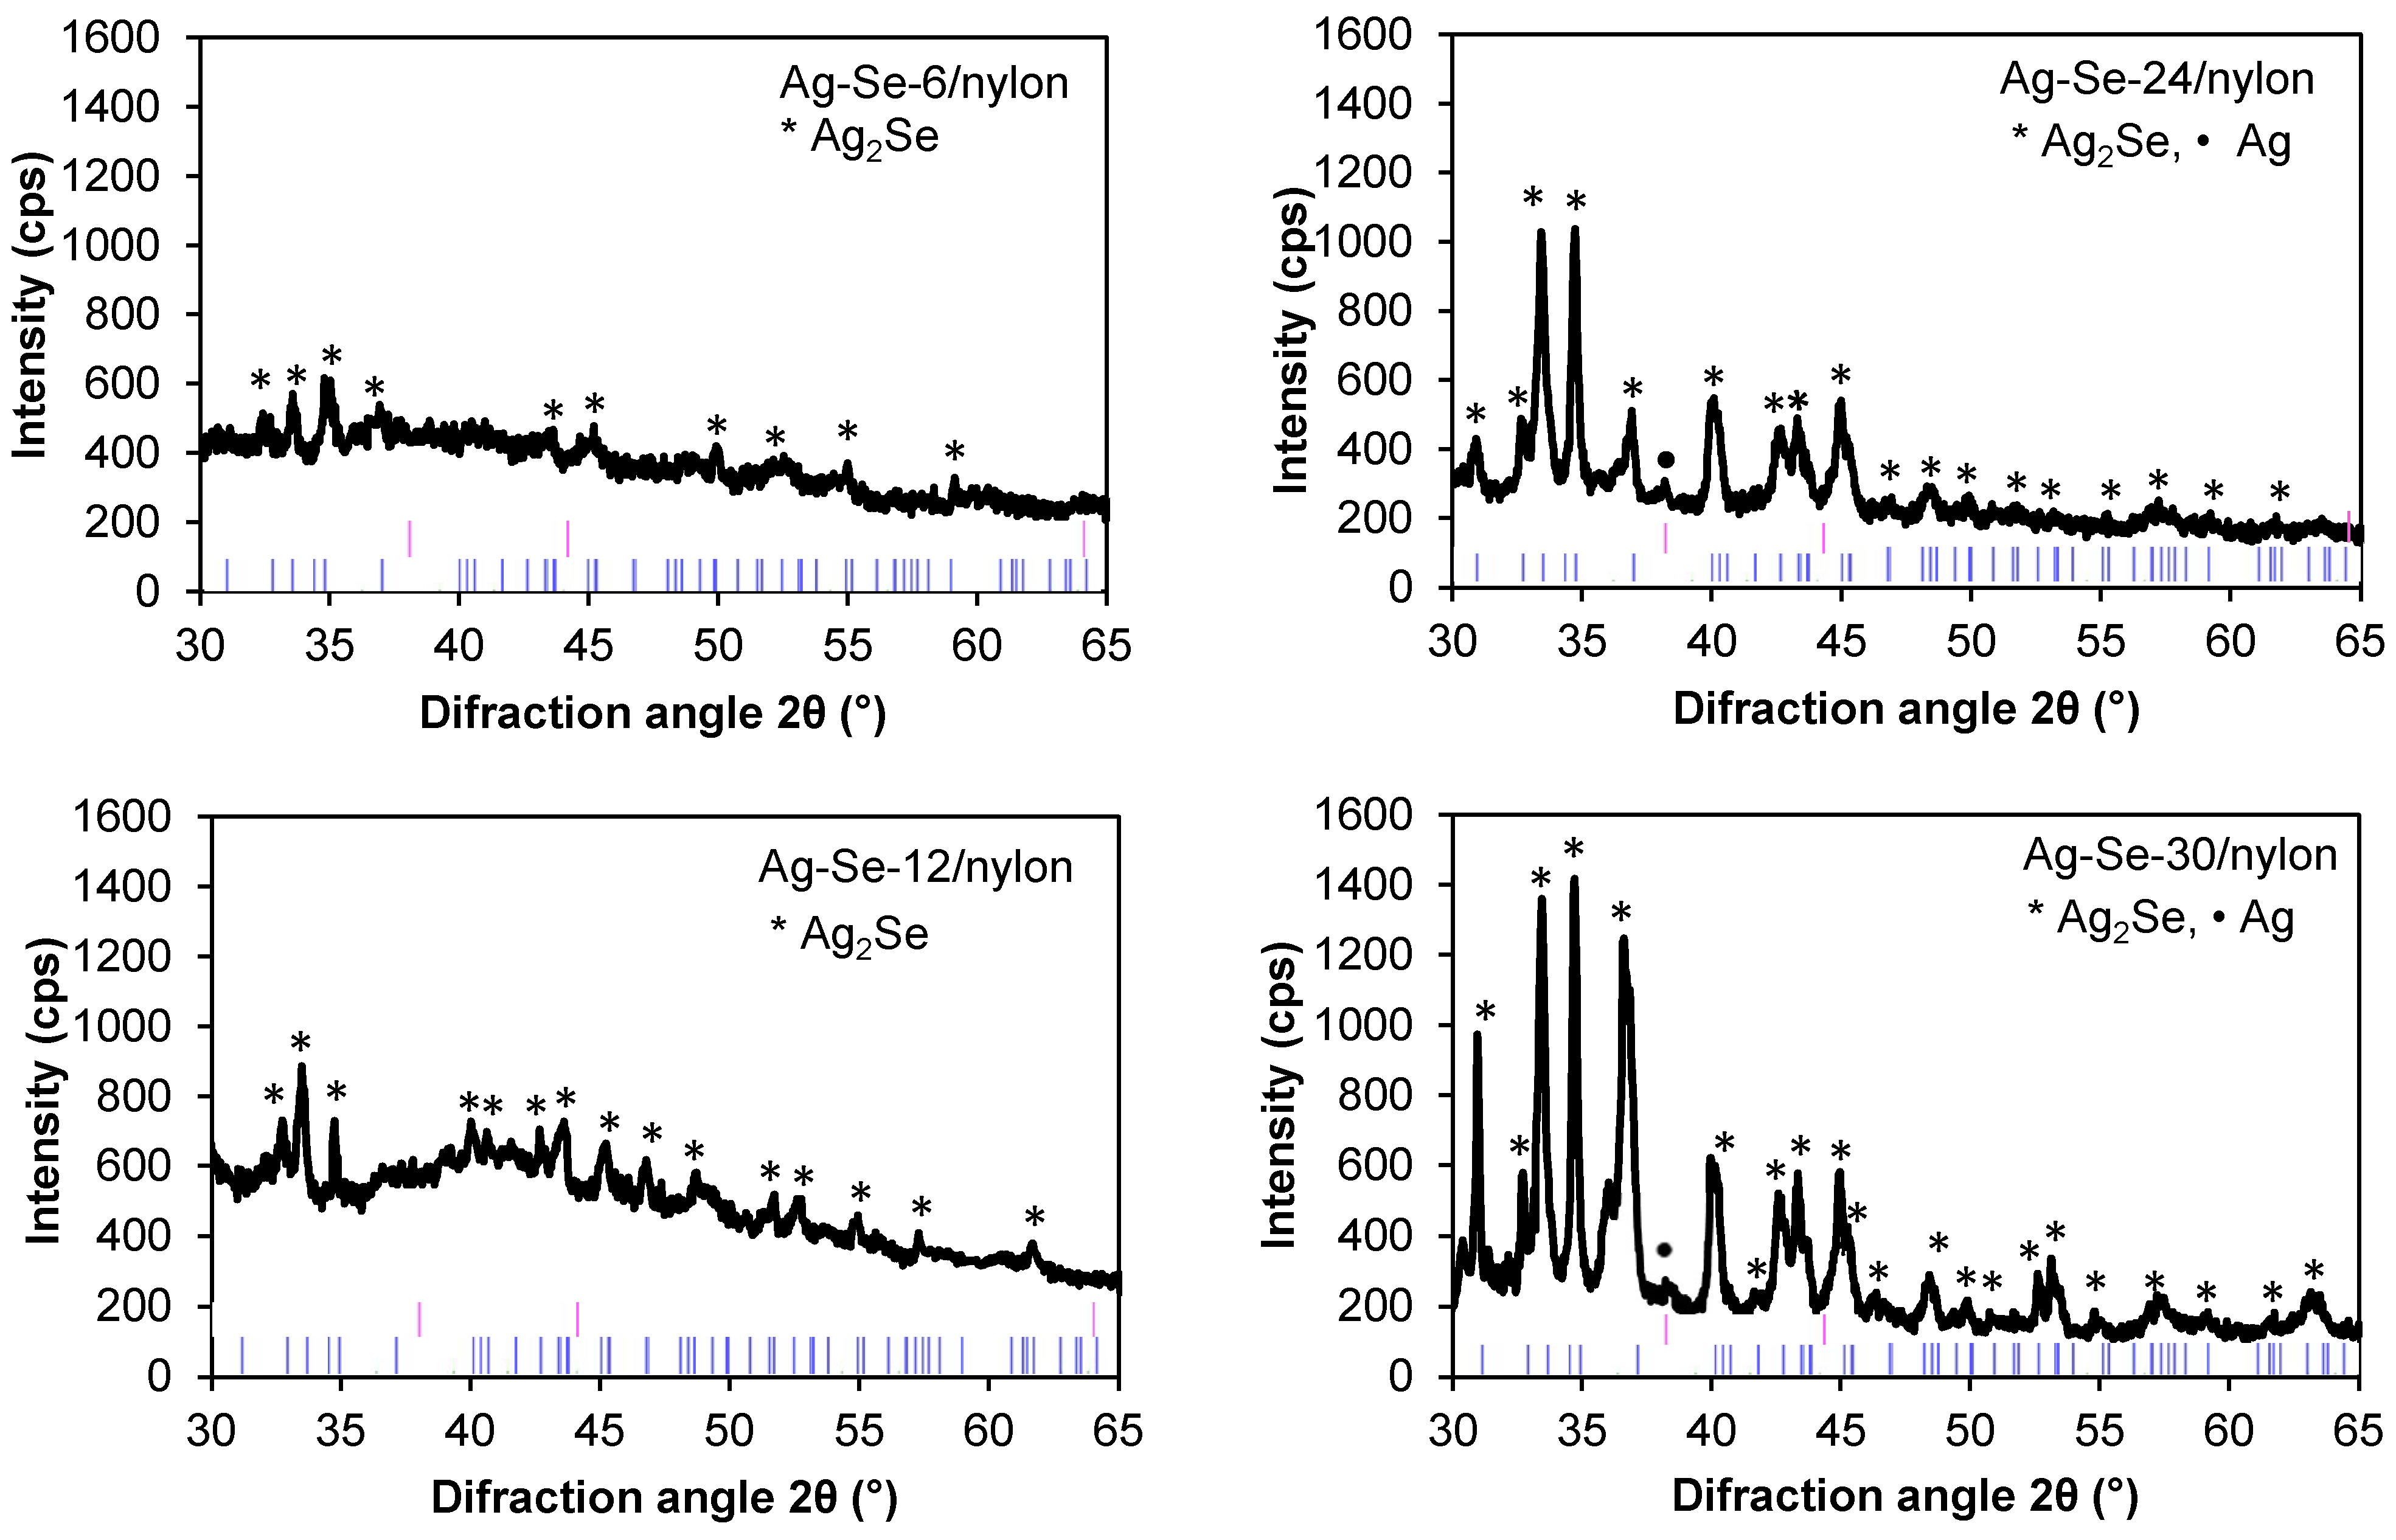
3.2. XRD Analysis
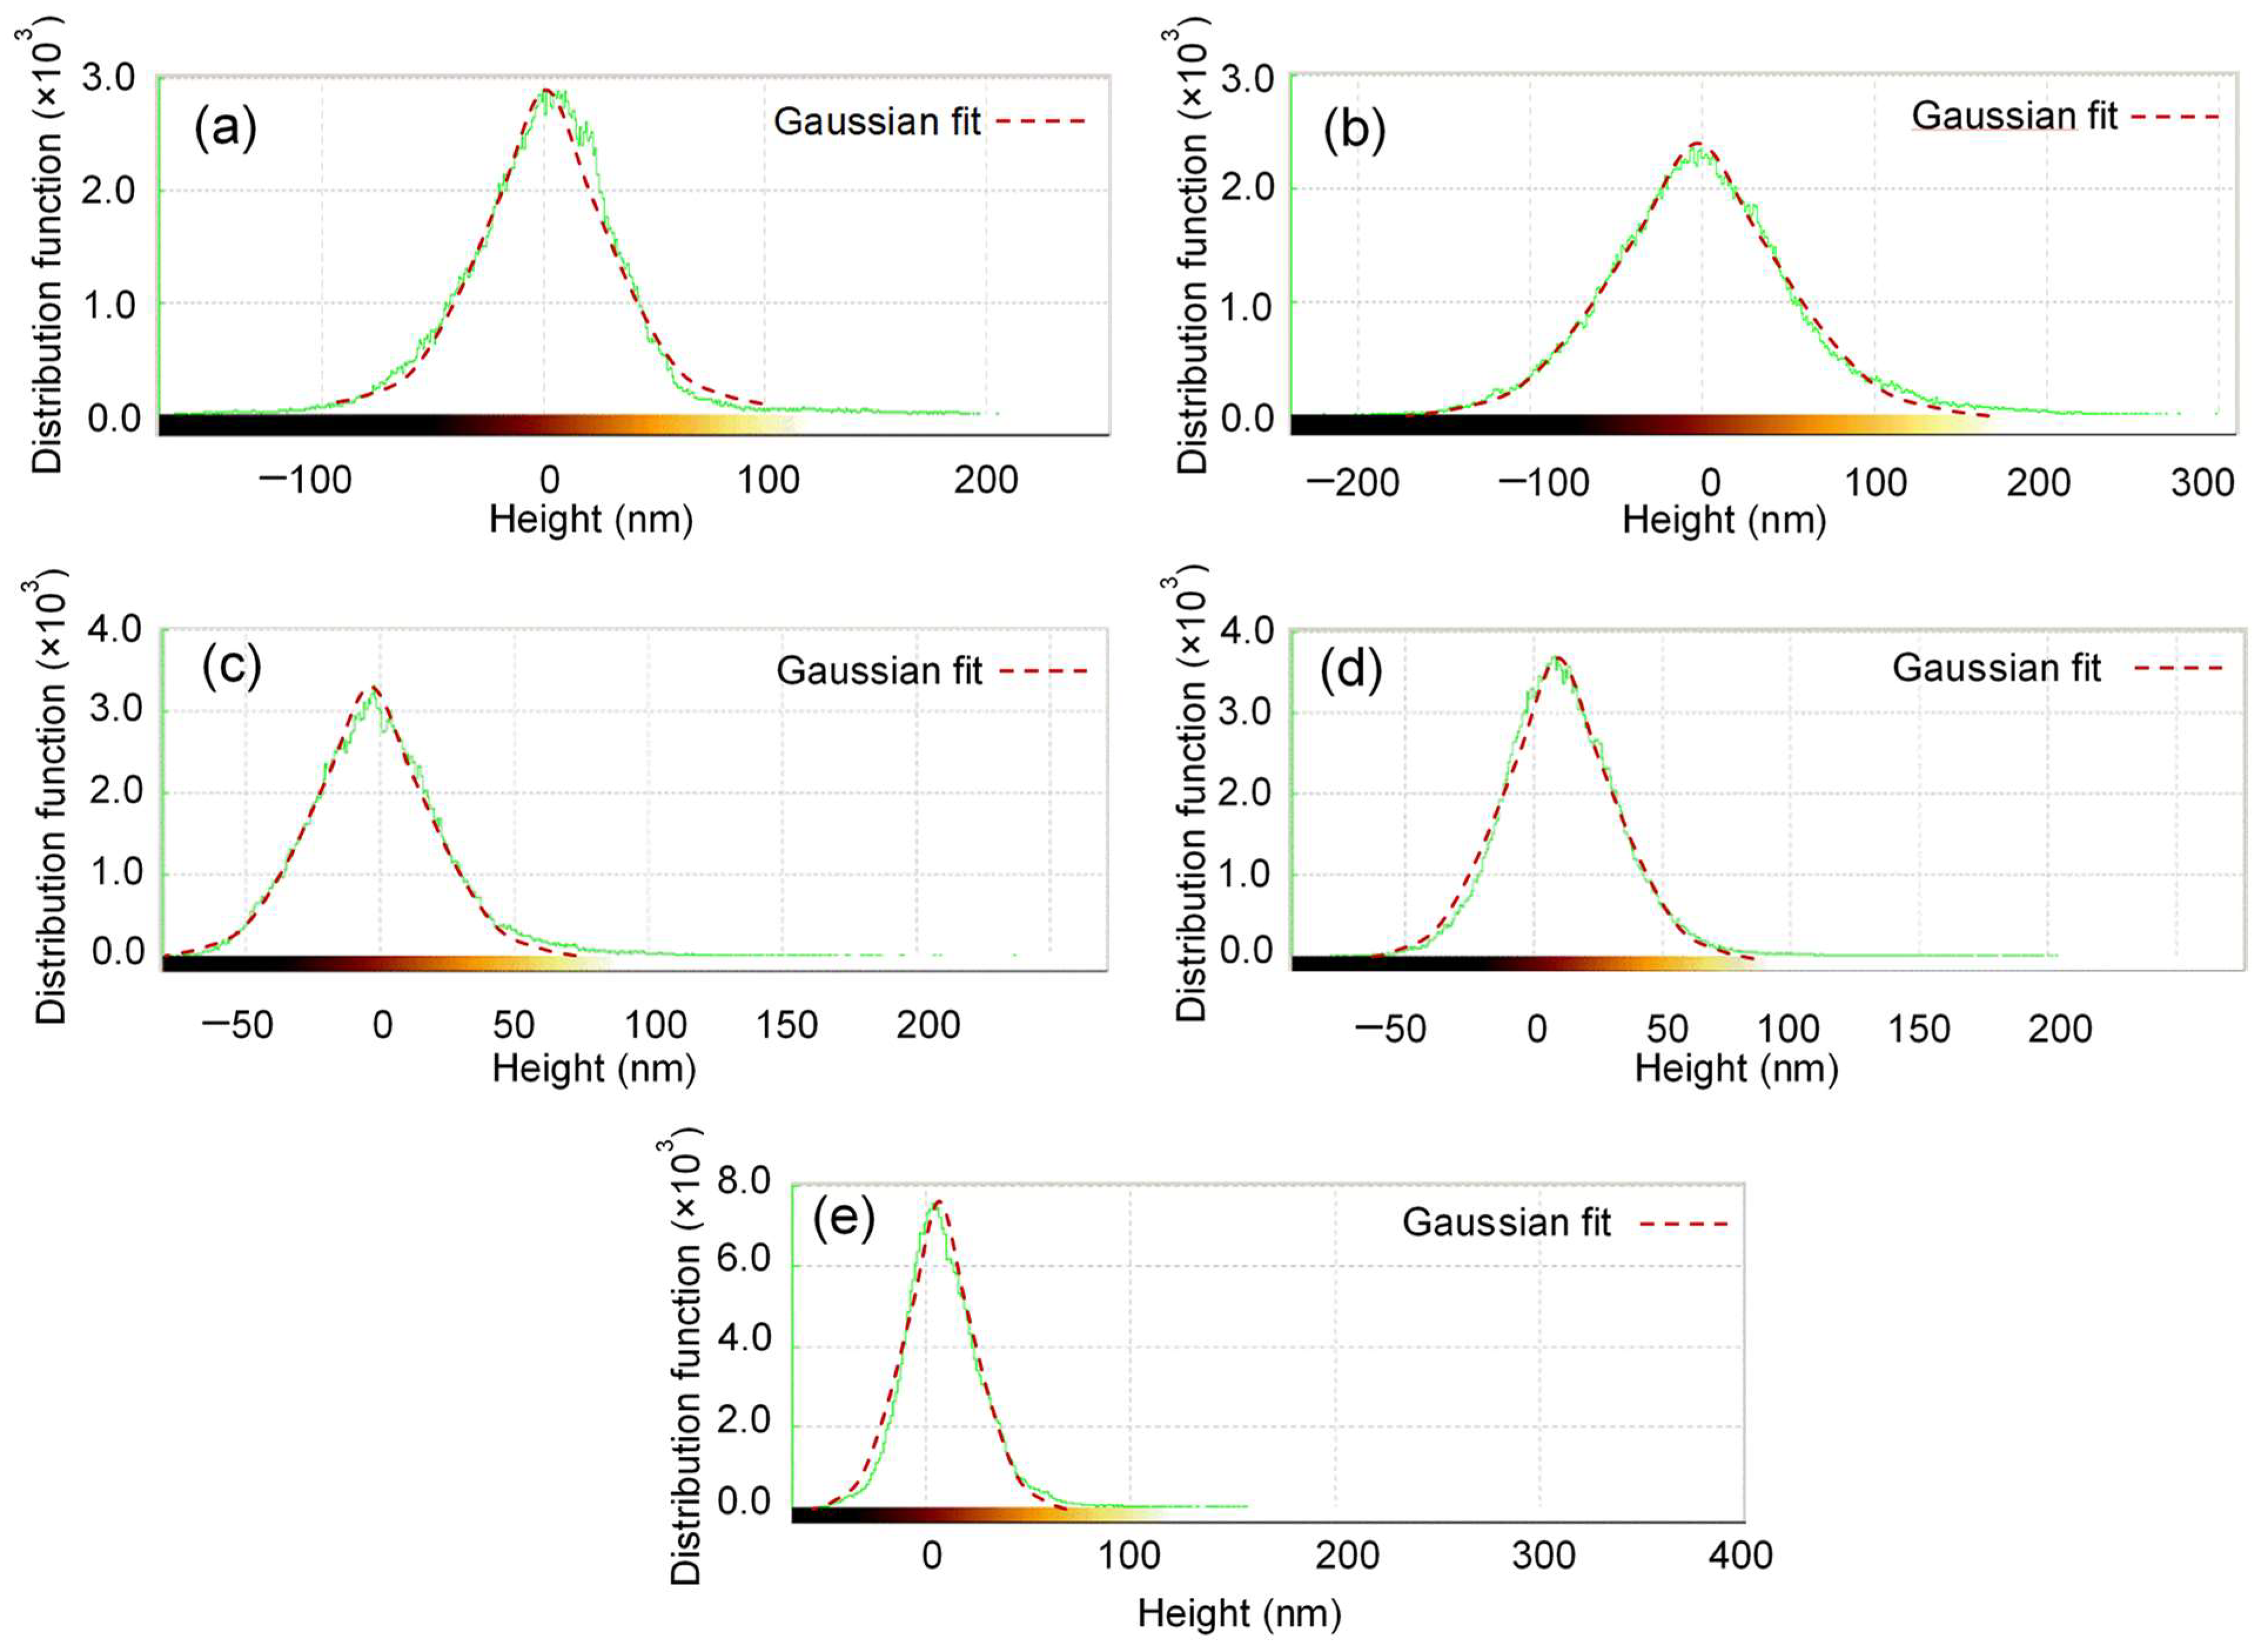
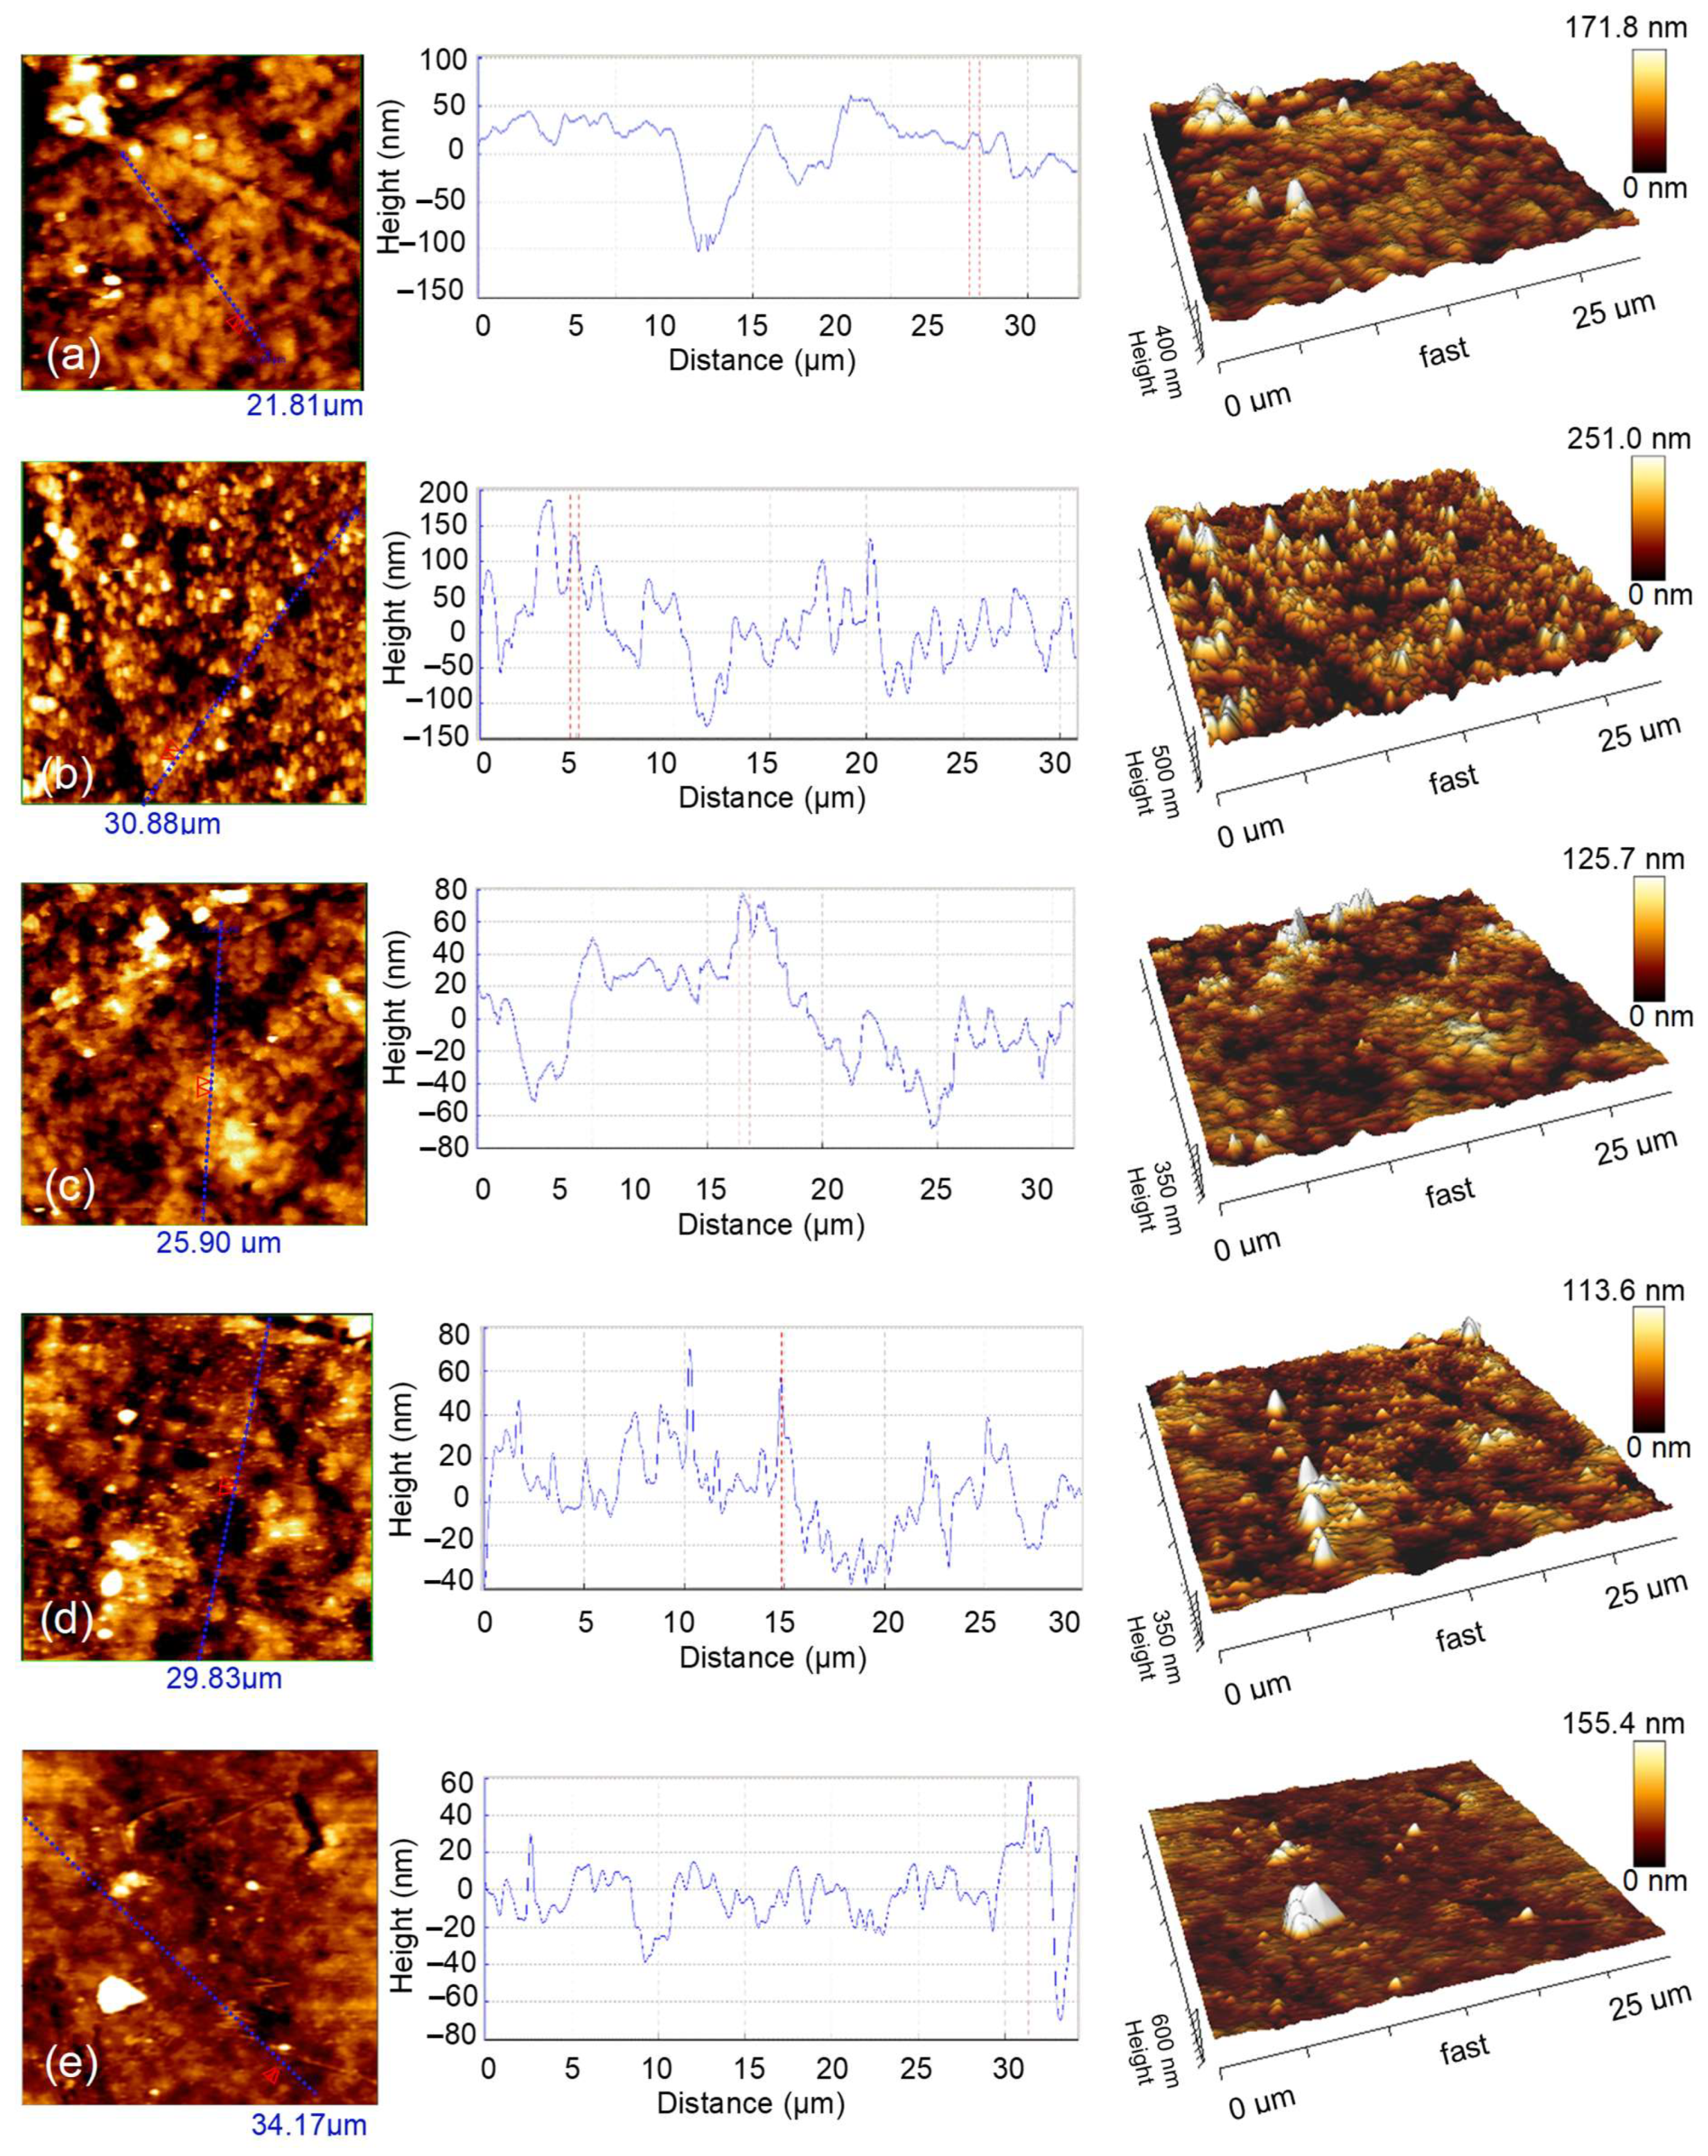
3.3. AFM Analysis
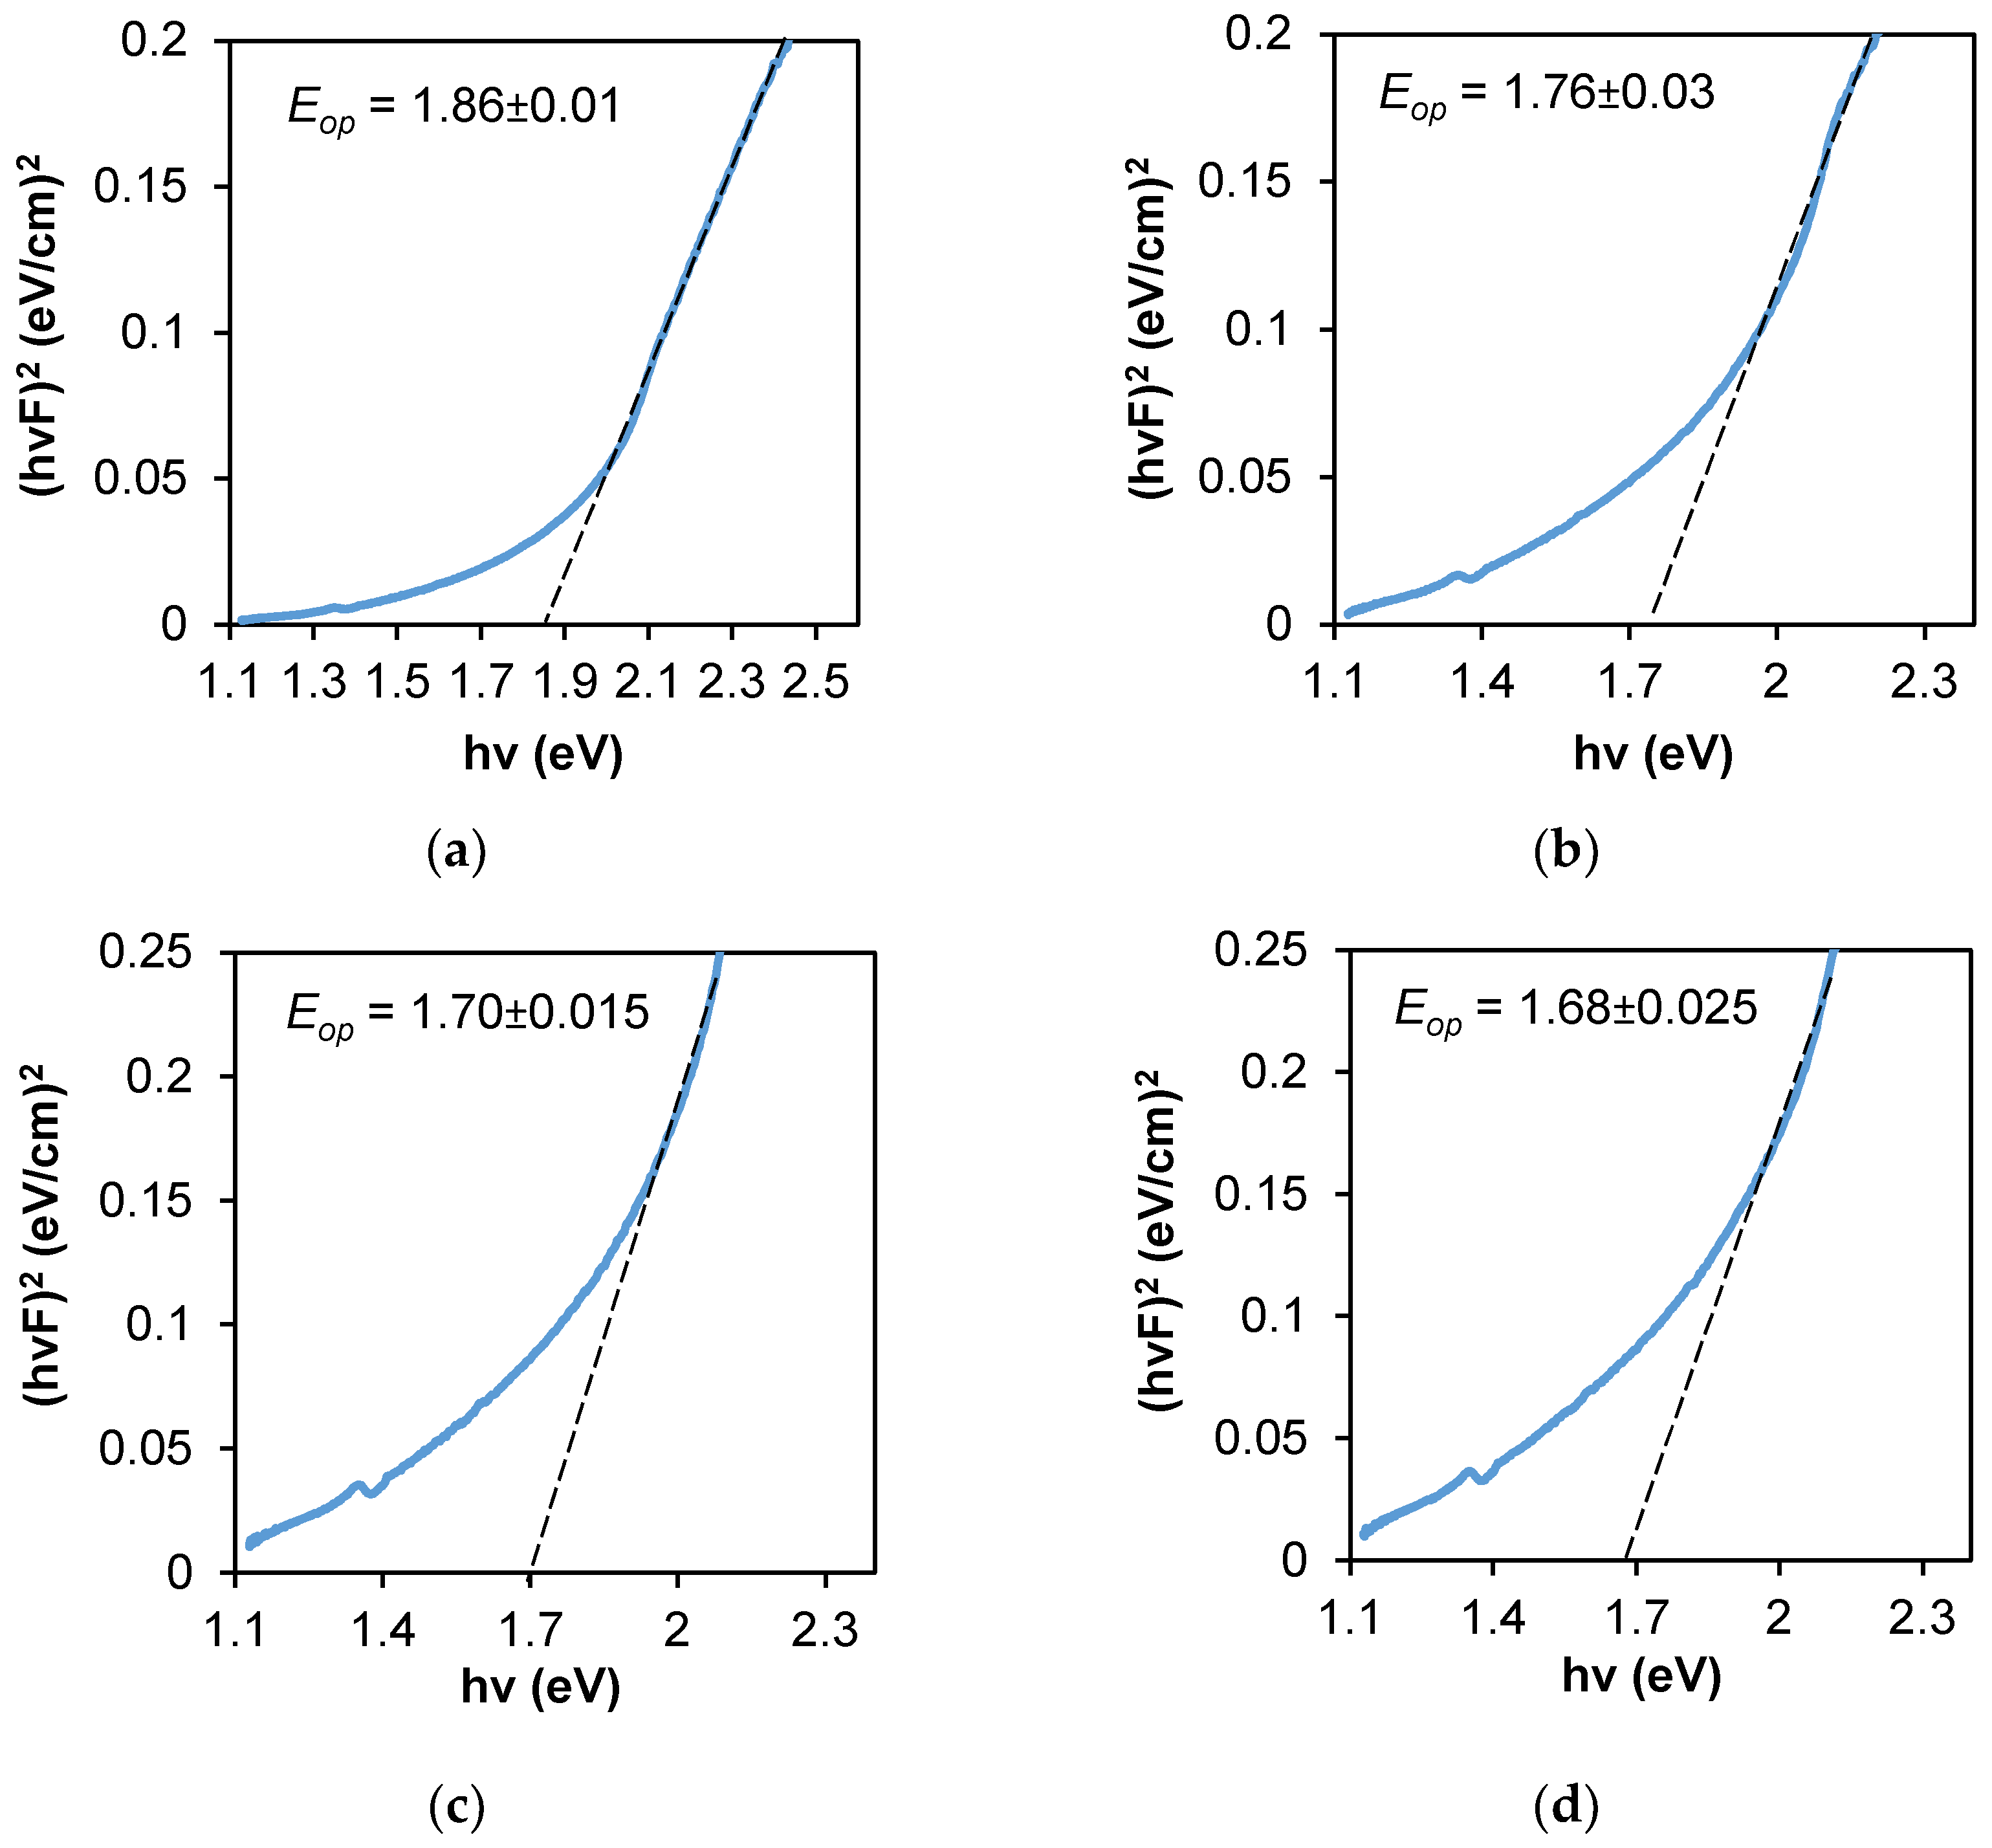
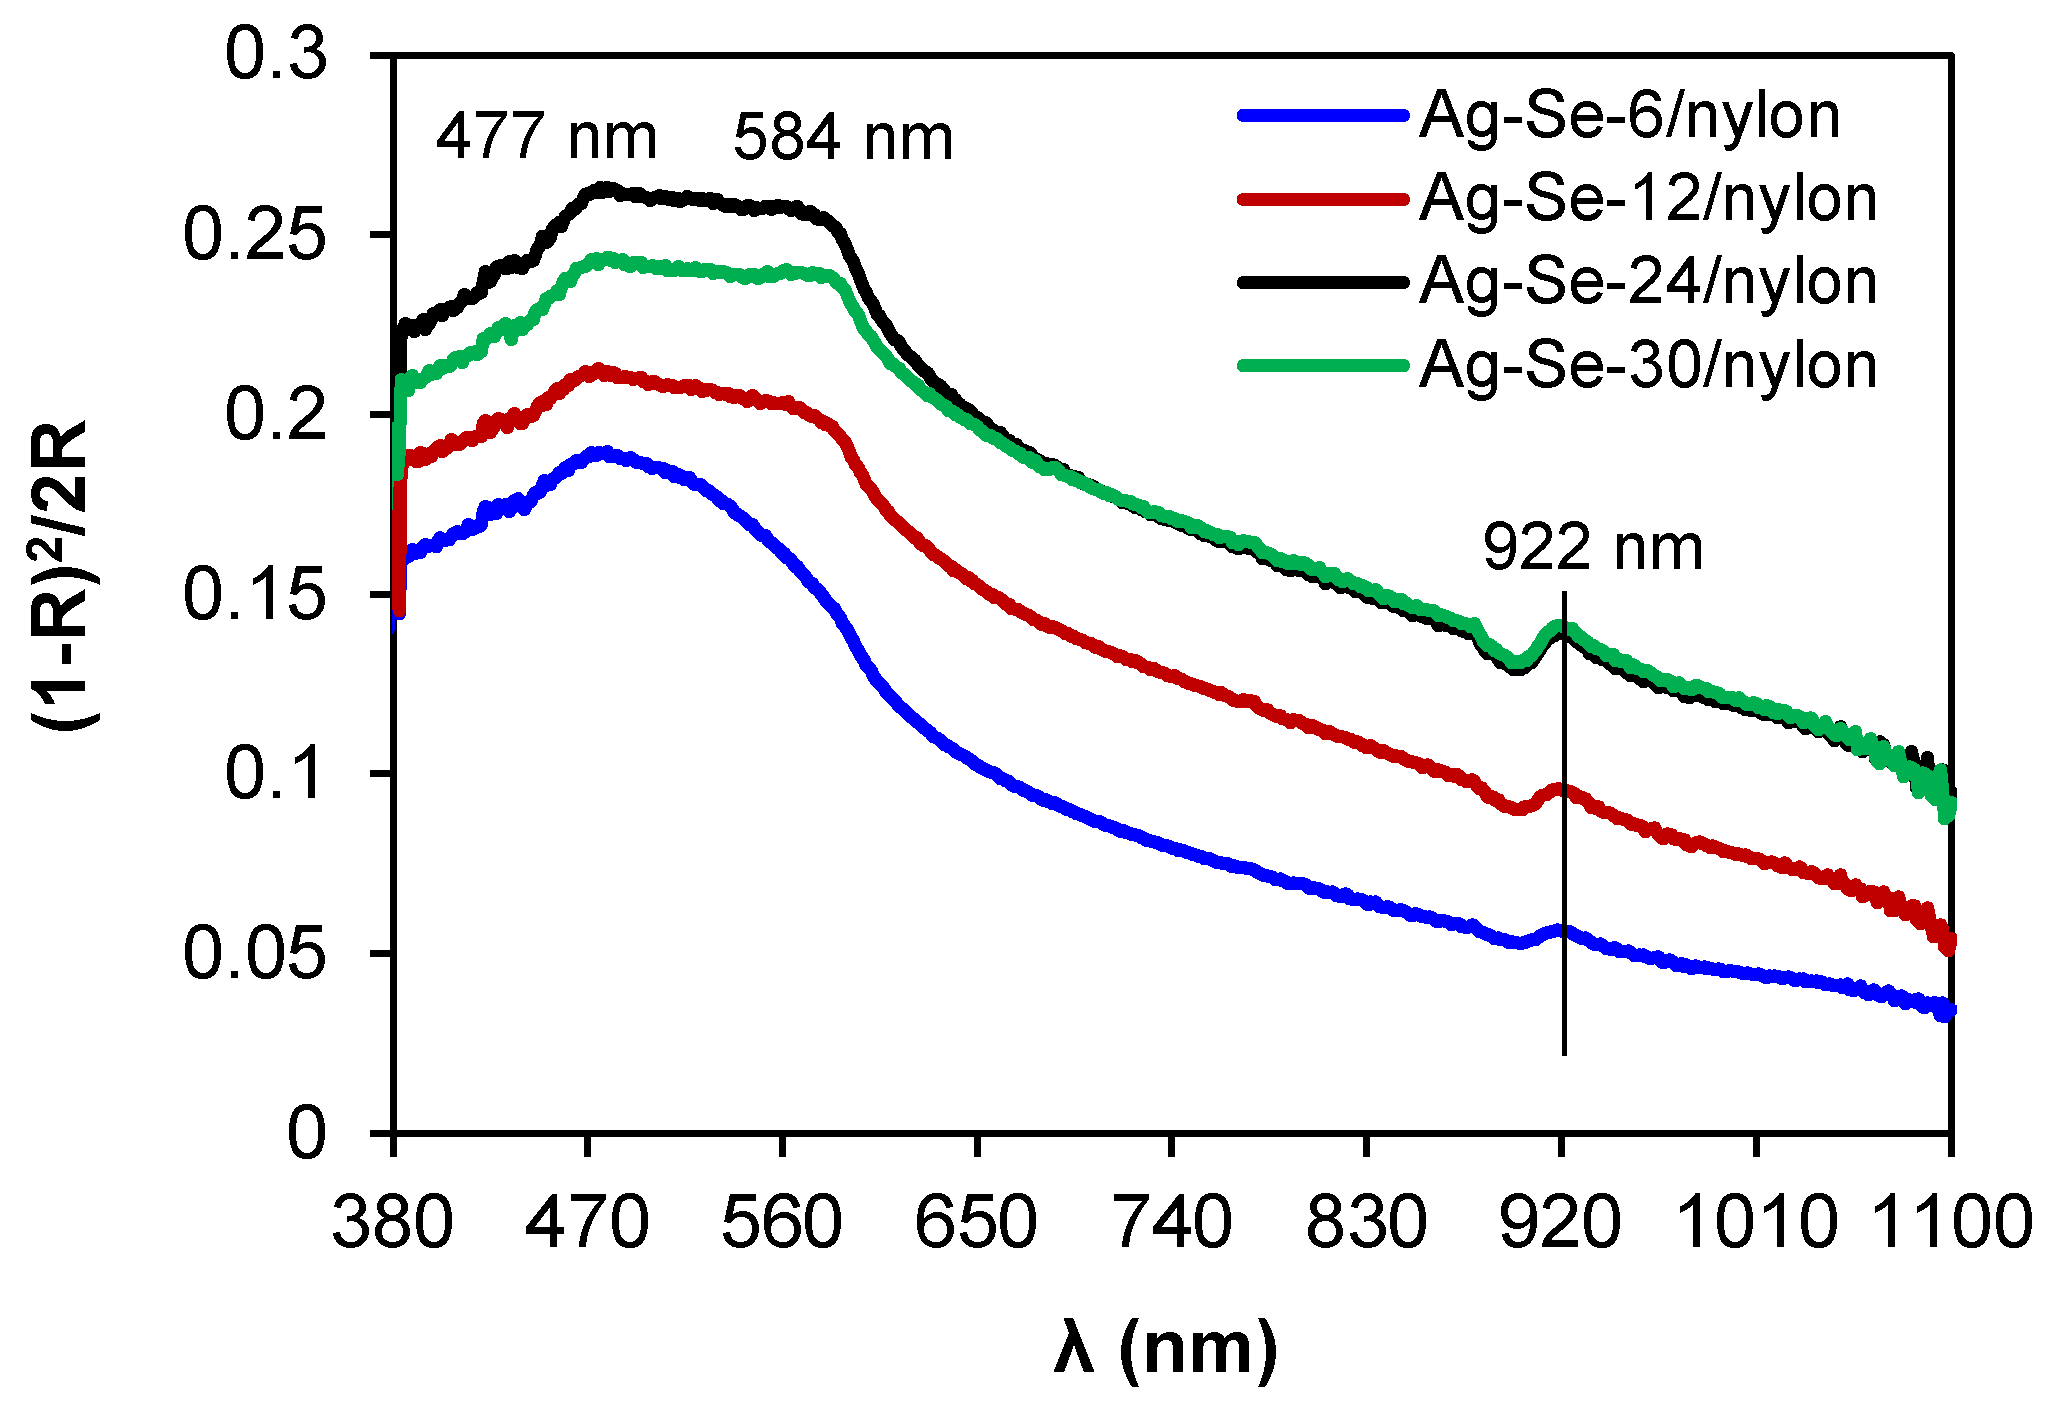
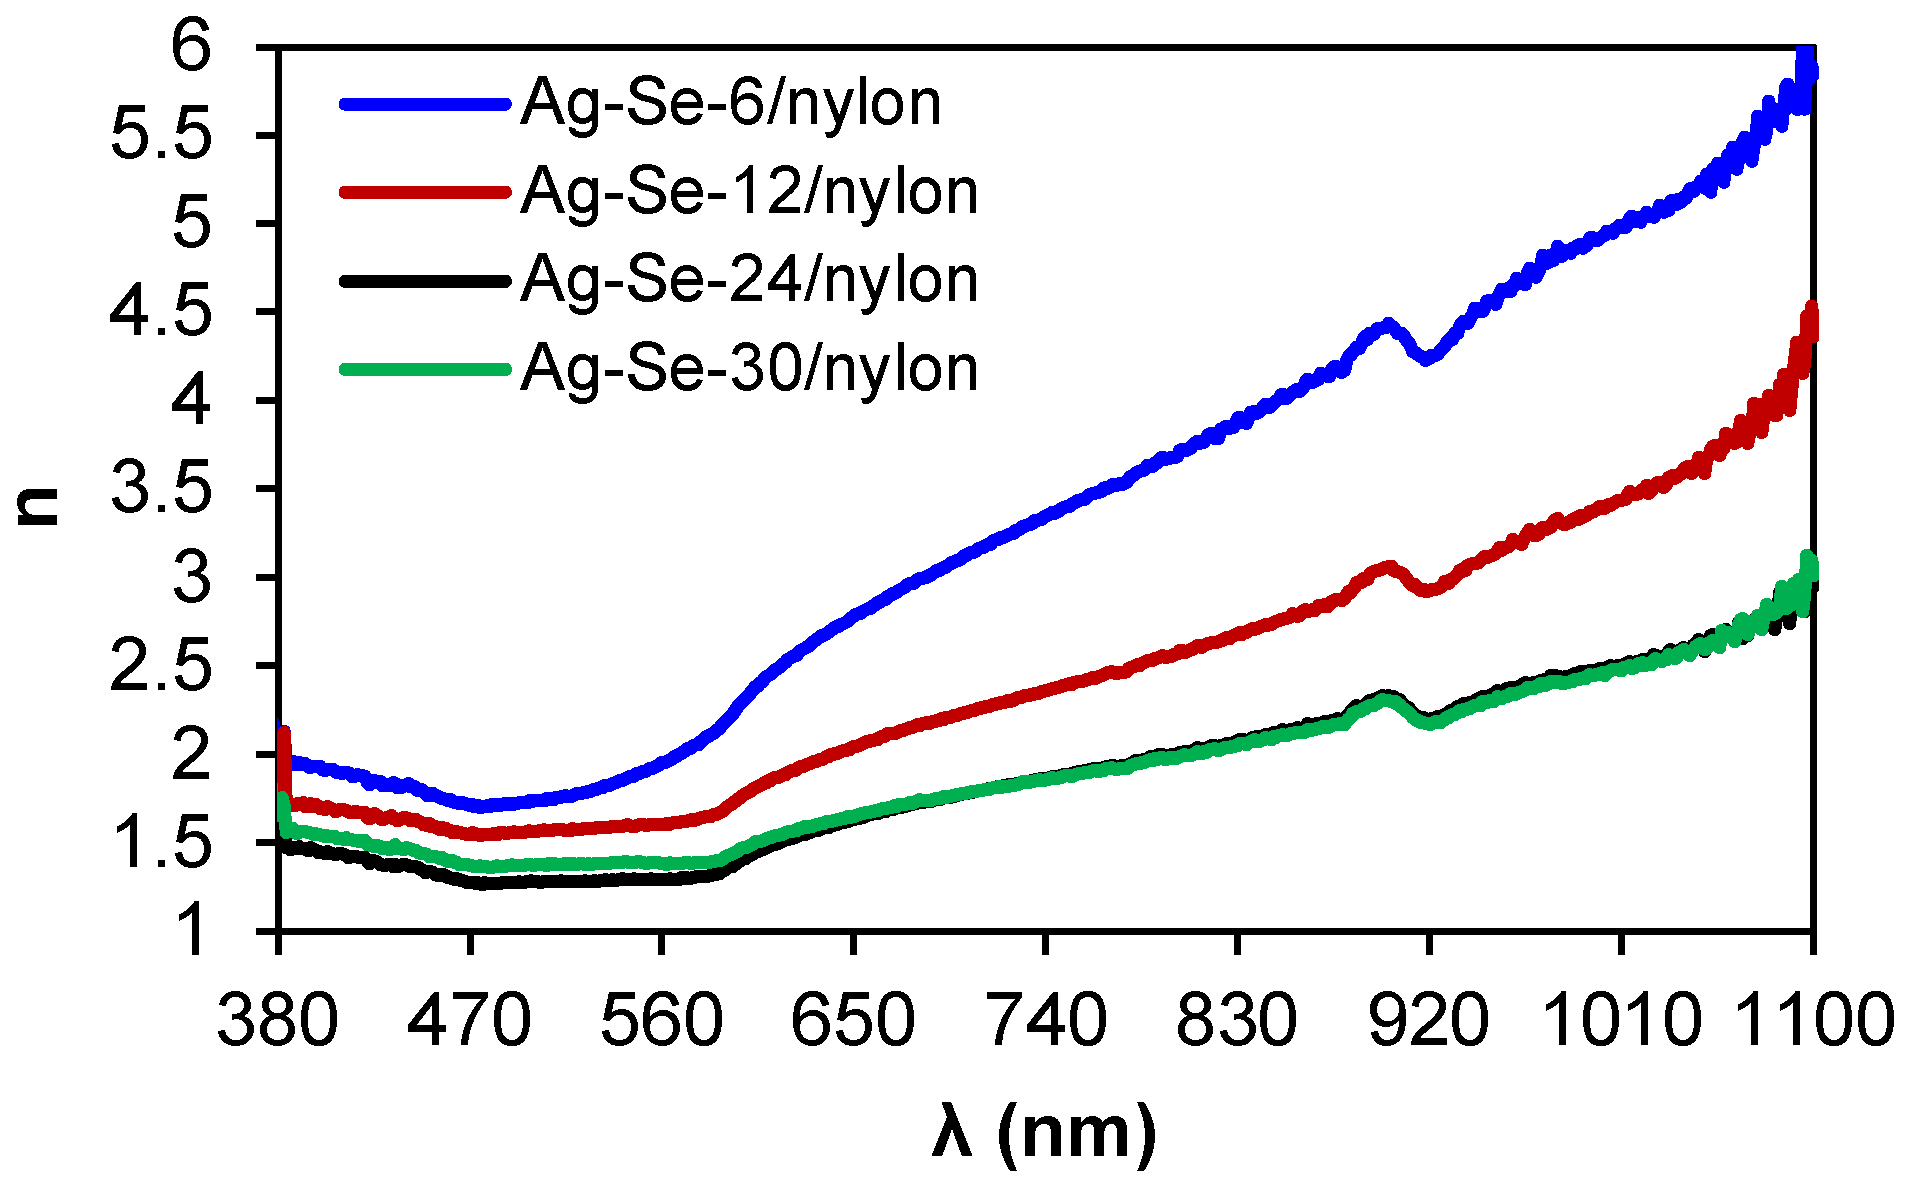
3.4. UV-Vis Analysis
4. Conclusions
Author Contributions
Funding
Institutional Review Board Statement
Informed Consent Statement
Data Availability Statement
Conflicts of Interest
References
- Li, Q.; Zanelli, A. A review on fabrication and applications of textile envelope integrated flexible photovoltaic systems. Renew. Sustain. Energy Rev. 2021, 139, 110678. [Google Scholar] [CrossRef]
- Saveleva, M.S.; Eftekhari, K.; Abalymov, A.; Douglas, T.E.L.; Volodkin, D.; Parakhonskiy, B.V.; Skirtach, A.G. Hierarchy of Hybrid Materials—The Place of Inorganics-in-Organics in it, Their Composition and Applications. Front. Chem. 2019, 7, 179. [Google Scholar] [CrossRef] [PubMed] [Green Version]
- Hilal, H.S.; Zyoud, A.; Helal, M.H.S.; Bsharat, H.; Helal, H.H.; Ali, C. Effects of annealing temperature and cooling rate on photo-electrochemical performance of pristine polycrystalline metal-chalcogenide film electrodes. Sol. Energy 2019, 183, 704–715. [Google Scholar] [CrossRef]
- Mlambo, M.; Moloto, M.J.; Moloto, N.; Mdluli, P.S. Influence of temperature and precursor concentration on the synthesis of HDA-capped Ag2Se nanoparticles. Mater. Res. Bull. 2013, 48, 2196–2200. [Google Scholar] [CrossRef]
- Gates, B.; Mayers, B.; Wu, Y.; Sun, Y.; Cattle, B.; Yang, P.; Xia, Y. Synthesis and Characterization of Crystalline Ag 2 Se Nanowires Through a Template-Engaged Reaction at Room Temperature. Adv. Funct. Mater. 2002, 12, 679–686. [Google Scholar] [CrossRef]
- Husmann, A.; Betts, J.B.; Boebinger, G.S.; Migliori, A.; Rosenbaum, T.F.; Saboungi, M.-L. Megagauss sensors. Nature 2002, 417, 421–424. [Google Scholar] [CrossRef] [PubMed]
- Ding, Y.; Qiu, Y.; Cai, K.; Yao, Q.; Chen, S.; Chen, L.; He, J. High performance n-type Ag2Se film on nylon membrane for flexible thermoelectric power generator. Nat. Commun. 2019, 10, 841. [Google Scholar] [CrossRef] [Green Version]
- Schoen, D.T.; Xie, C.; Cui, Y. Electrical Switching and Phase Transformation in Silver Selenide Nanowires. J. Am. Chem. Soc. 2007, 129, 4116–4117. [Google Scholar] [CrossRef]
- Kobayashi, M. Review on structural and dynamical properties of silver chalcogenides. Solid State Ionics 1990, 39, 121–149. [Google Scholar] [CrossRef]
- Pejova, B.; Najdoski, M.; Grozdanov, I.; Dey, S.K. Chemical bath deposition of nanocrystalline (111) textured Ag2Se thin films. Mater. Lett. 2000, 43, 269–273. [Google Scholar] [CrossRef]
- Wu, M.; Cai, K.; Li, X.; Li, Y.; Liu, Y.; Lu, Y.; Wang, Z.; Zhao, W.; Wei, P. Ultraflexible and high-thermoelectric-performance sulfur-doped Ag2Se film on nylon for power generators. ACS Appl. Mater. Interfaces 2022, 14, 4307–4315. [Google Scholar] [CrossRef]
- Gao, Q.; Wang, W.; Lu, Y.; Cai, K.; Li, Y.; Wang, Z.; Wu, M.; Huang, C.; He, J. High power factor Ag/Ag2Se composite films for flexible thermoelectric generators. ACS Appl. Mater. Interfaces 2021, 13, 14327–14333. [Google Scholar] [CrossRef]
- Zhang, S.-Y.; Fang, C.-X.; Wei, W.; Jin, B.-K.; Tian, Y.-P.; Shen, Y.-H.; Yang, J.-X.; Gao, H.-W. Synthesis and Electrochemical Behavior of Crystalline Ag2Se Nanotubes. J. Phys. Chem. C 2007, 111, 4168–4174. [Google Scholar] [CrossRef]
- Jiang, Z.-Y.; Xie, Z.-X.; Zhang, X.-H.; Huang, R.-B.; Zheng, L.-S. Conversion of Se nanowires to Se/Ag2Se nanocables and Ag2Se nanotubes. Chem. Phys. Lett. 2003, 378, 313–316. [Google Scholar] [CrossRef]
- Gates, B.; Wu, Y.; Yin, Y.; Yang, P.; Xia, Y. Single-Crystalline Nanowires of Ag2Se Can Be Synthesized by Templating against Nanowires of Trigonal Se. J. Am. Chem. Soc. 2001, 123, 11500–11501. [Google Scholar] [CrossRef]
- Greenwood, N.N.; Earnshaw, A. (Eds.) Selenium, Tellurium and Polonium. In Chemistry of the Elements, 2nd ed.; Elsevier Ltd., Butterworth-Heinemann: Oxford, UK, 1997; Volume 16, pp. 747–788. [Google Scholar] [CrossRef]
- Sukyte, J.; Ivanauskas, R.; Ancutiene, I. Comparative study of selenopolythionic acids H2SenS2O6 as precursors for formation of chalcogenides layers. Chalcogenide Lett. 2015, 12, 569–578. [Google Scholar]
- Luo, Y.-R. Comprehensive Handbook of Chemical Bond Energies, 1st ed.; CRC Press: Boca Raton, FL, USA, 2007; p. 1688. [Google Scholar] [CrossRef]
- Olin, Å.; Noläng, B.; Osadchii, E.G.; Öhman, L.-O.; Rosén, E. Chemical Thermodynamics of Selenium, 1st ed.; Elsevier Science: Amsterdam, The Netherlands, 2005; p. 894. Available online: https://www.oecd-nea.org/dbtdb/pubs/vol7-selenium.pdf (accessed on 14 April 2022).
- Feng, S.; Xu, R. New Materials in Hydrothermal Synthesis. Acc. Chem. Res. 2001, 34, 239–247. [Google Scholar] [CrossRef]
- Mohanty, B.C.; Murty, B.S.; Vijayan, V.; Kasiviswanathan, S. Atomic force microscopy study of thermal stability of silver selenide thin films grown on silicon. Appl. Surf. Sci. 2006, 252, 7975–7982. [Google Scholar] [CrossRef]
- Saito, Y.; Sato, M.; Shiojiri, M. Orientation in Ag2Se polymorphic films produced by the reaction of silver films with selenium. Thin Solid Films 1981, 79, 257–266. [Google Scholar] [CrossRef]
- Krylova, V.; Dukštienė, N. The structure of PA-Se-S-Cd composite materials probed with FTIR spectroscopy. Appl. Surf. Sci. 2019, 470, 462–471. [Google Scholar] [CrossRef]
- Mokgalapa, N.M.; Ghosh, T.K.; Tompson, R.V.; Loyalka, S.K. Adhesion Force between a Silver Particle and Haynes 230: Role of Surface Conditions. Nucl. Technol. 2016, 194, 353–368. [Google Scholar] [CrossRef]
- López, R.; Gómez, R. Band-gap energy estimation from diffuse reflectance measurements on sol–gel and commercial TiO2: A comparative study. J. Sol-Gel Sci. Technol. 2012, 61, 1–7. [Google Scholar] [CrossRef]
- Nasr, M.; Viter, R.; Eid, C.; Warmont, F.; Habchi, R.; Miele, P.; Bechelany, M. Synthesis of novel ZnO/ZnAl2O4 multi co-centric nanotubes and their long-term stability in photocatalytic application. RSC Adv. 2016, 6, 103692–103699. [Google Scholar] [CrossRef]
- Kienle, L.; Duppel, V.; Mogwitz, B.; Janek, J.; Kreutzbruck, M.V.; Leineweber, A.; Simon, A. Synthesis–Real Structure–Property: The Showcase of Silver-Rich Ag2Se. Cryst. Growth Des. 2011, 11, 2412–2421. [Google Scholar] [CrossRef]
- Beck, G.; Janek, J. Negative and linear positive magnetoresistance effect in silver-rich silver selenide. J. Solid State Sci. 2008, 10, 776–789. [Google Scholar] [CrossRef]
- Krylova, V.; Dukstienė, N.; Žalenkienė, S.; Baltrusaitis, J. Chemical and structural changes in polyamide based organic–inorganic hybrid materials upon incorporation of SeS2O62−precursor. Appl. Surf. Sci. 2017, 392, 634–641. [Google Scholar] [CrossRef]
- Ayele, D.W. A facile one-pot synthesis and characterization of Ag2Se nanoparticles at low temperature. Egypt. J. Basic Appl. Sci. 2016, 3, 149–154. [Google Scholar] [CrossRef] [Green Version]
- Delgado-Beleño, Y.; Martinez-Nuñez, C.E.; Cortez-Valadez, M.; Flores-López, N.S.; Flores-Acosta, M. Optical properties of silver, silver sulfide and silver selenide nanoparticles and antibacterial applications. Mater. Res. Bull. 2018, 99, 385–392. [Google Scholar] [CrossRef]
- Abdelrazek, E.M.; Abdelghany, A.M.; Badr, S.I.; Morsi, M.A. Structural, optical, morphological and thermal properties of PEO/PVP blend containing different concentrations of biosynthesized Au nanoparticles. J. Mater. Res. Technol. 2018, 7, 419–431. [Google Scholar] [CrossRef]
- Zhu, C.-N.; Chen, G.; Tian, Z.-Q.; Wang, W.; Zhong, W.-Q.; Li, Z.; Zhang, Z.-L.; Pang, D.-W. Near-Infrared Fluorescent Ag2Se-Cetuximab Nanoprobes for Targeted Imaging and Therapy of Cancer. Small 2017, 13, 1602309. [Google Scholar] [CrossRef]
- Anthony, S.P. Synthesis of Ag2S and Ag2Se nanoparticles in self assembled block copolymer micelles and nano-arrays fabrication. Mater. Lett. 2009, 63, 773–776. [Google Scholar] [CrossRef]
- Loste, J.; Lopez-Cuesta, J.-M.; Billon, L.; Garay, H.; Save, M. Transparent polymer nanocomposites: An overview on their synthesis and advanced properties. Prog. Polym. Sci. 2019, 89, 133–158. [Google Scholar] [CrossRef]
- Rashad, M. Tuning optical properties of polyvinyl alcohol doped with different metal oxide nanoparticles. Opt. Mater. 2020, 105, 109857. [Google Scholar] [CrossRef]
- Jatautė, L.; Krylova, V.; Dukštienė, N.; Lelis, M.; Tučkutė, S. Ag-In-Se films on flexible architectural textiles as efficient material for optoelectronics applications: A preliminary study. Thin Solid Films 2021, 721, 138566. [Google Scholar] [CrossRef]
- Raj, K.R.; Murugakoothan, P. Studies on the optical and mechanical properties of non-linear optical 3-aminophenol orthophosphoric acid (3-amphph) single crystal. Optik 2012, 123, 1082–1086. [Google Scholar] [CrossRef]
- Beaglehole, D.; Hunderi, O. Study of the Interaction of Light with Rough Metal Surfaces. I. Experiment. Phys. Rev. B 1970, 2, 309–321. [Google Scholar] [CrossRef]
- Pandiaraman, M.; Soundararajan, N.; Vijayan, C.; Kumar, C.; Ganesan, R. Spectroscopic studies on silver selenide thin films. J. Ovonic Res. 2010, 6, 285–295. [Google Scholar]


| Sample | Atomic Concentrations, % | ||||||
|---|---|---|---|---|---|---|---|
| C | O | N | S | Se | Ag | Ag/Se Concentration Ratio | |
| Uncoated nylon | 28.68 | 44.96 | 26.36 | - | - | - | - |
| Ag–Se-6/nylon | 27.62 | 52.53 | 17.31 | 0.32 | 0.99 | 1.23 | 1.24 |
| Ag–Se-12/nylon | 25.14 | 52.70 | 17.22 | 0.90 | 1.44 | 2.60 | 1.81 |
| Ag–Se-24/nylon | 29.32 | 50.05 | 15.65 | 1.03 | 1.69 | 2.26 | 1.34 |
| Ag–Se-30/nylon area 1 area 2 | 27.76 31.51 | 49.42 44.50 | 17.40 18.34 | 0.93 0.81 | 1.48 1.47 | 3.01 3.37 | 2.03 2.29 |
| Layer | Fractional Thickness of the Layers, μm | |||
|---|---|---|---|---|
| Ag–Se-6/nylon | Ag–Se-12/nylon | Ag–Se-24/nylon | Ag–Se-30/nylon | |
| Topmost (dark) | 7.61–9.51 | 8.67–15.17 | 8.51–13.70 | 14.09–19.51 |
| Intermediate (white) | 7.61–13.31 | 8.67–10.14 | 5.15–7.87 | 4.34–9.76 |
| Diffusion (grey) | 7.61–9.51 | 8.67–13.00 | 8.52–11.61 | 8.67–10.64 |
| Total | 22.83–32.33 | 26.01–38.31 | 22.18–33.18 | 27.1–39.91 |
| Spot | Atomic Concentrations, % | ||||||
|---|---|---|---|---|---|---|---|
| C | O | N | S | Se | Ag | Ag/Se Concentration Ratio | |
| 1 | 28.69 | 44.96 | 26.35 | - | - | - | - |
| 2 | 34.19 | 40.10 | 24.98 | 0.19 | 0.54 | - | - |
| 3 | 36.70 | 37.70 | 23.30 | 0.23 | 0.95 | 1.12 | 1.18 |
| Spot | Atomic Concentrations, % | ||||||
|---|---|---|---|---|---|---|---|
| C | O | N | S | Se | Ag | Ag/Se Concentration Ratio | |
| 1 | 20.99 | 55.98 | 22.22 | 0.39 | 0.42 | - | - |
| 2 | 41.94 | 37.58 | 18.68 | 0.50 | 0.99 | 0.31 | 0.31 |
| 3 | 40.04 | 36.30 | 17.80 | 0.95 | 3.32 | 1.59 | 0.48 |
| Spot | Atomic Concentrations, % | ||||||
|---|---|---|---|---|---|---|---|
| C | O | N | S | Se | Ag | Ag/Se Concentration Ratio | |
| 1 | 27.12 | 47.98 | 24.03 | 0.34 | 0.53 | - | - |
| 2 | 26.60 | 45.78 | 24.47 | 0.23 | 0.95 | 1.97 | 2.07 |
| 3 | 25.14 | 52.70 | 17.22 | 0.93 | 1.41 | 2.60 | 1.84 |
| Spot | Atomic Concentrations, % | ||||||
|---|---|---|---|---|---|---|---|
| C | O | N | S | Se | Ag | Ag/Se Concentration Ratio | |
| 1 | 30.93 | 50.91 | 17.14 | 0.35 | 0.67 | - | - |
| 2 | 29.58 | 45.42 | 19.06 | 0.78 | 1.46 | 3.70 | 2.53 |
| 3 | 30.34 | 46.63 | 16.53 | 1.44 | 1.65 | 3.41 | 2.07 |
| Sample | Zmean (nm) | Ra (nm) | Rq (nm) | Rt (nm) |
|---|---|---|---|---|
| Uncoated nylon | 171.8 | 28.22 | 39.06 | 429.0 |
| Ag–Se-6/nylon | 251.0 | 43.19 | 57.04 | 547.0 |
| Ag–Se-12/nylon | 125.7 | 20.67 | 28.57 | 350.9 |
| Ag–Se-24/nylon | 113.6 | 18.53 | 25.82 | 369.2 |
| Ag–Se-30/nylon | 155.4 | 17.54 | 35.33 | 607.6 |
Publisher’s Note: MDPI stays neutral with regard to jurisdictional claims in published maps and institutional affiliations. |
© 2022 by the authors. Licensee MDPI, Basel, Switzerland. This article is an open access article distributed under the terms and conditions of the Creative Commons Attribution (CC BY) license (https://creativecommons.org/licenses/by/4.0/).
Share and Cite
Krylova, V.; Dukštienė, N.; Markevičiūtė, H. Ag–Se/Nylon Nanocomposites Grown by Template-Engaged Reaction: Microstructures, Composition, and Optical Properties. Nanomaterials 2022, 12, 2584. https://doi.org/10.3390/nano12152584
Krylova V, Dukštienė N, Markevičiūtė H. Ag–Se/Nylon Nanocomposites Grown by Template-Engaged Reaction: Microstructures, Composition, and Optical Properties. Nanomaterials. 2022; 12(15):2584. https://doi.org/10.3390/nano12152584
Chicago/Turabian StyleKrylova, Valentina, Nijolė Dukštienė, and Henrieta Markevičiūtė. 2022. "Ag–Se/Nylon Nanocomposites Grown by Template-Engaged Reaction: Microstructures, Composition, and Optical Properties" Nanomaterials 12, no. 15: 2584. https://doi.org/10.3390/nano12152584
APA StyleKrylova, V., Dukštienė, N., & Markevičiūtė, H. (2022). Ag–Se/Nylon Nanocomposites Grown by Template-Engaged Reaction: Microstructures, Composition, and Optical Properties. Nanomaterials, 12(15), 2584. https://doi.org/10.3390/nano12152584