Article

Effect of Cold Rolling on the Evolution of Shear Bands and Nanoindentation Hardness in Zr41.2Ti13.8Cu12.5Ni10Be22.5 Bulk Metallic Glass

1
Department of Metallurgical and Materials Engineering, Indian Institute of Technology Kharagpur, West Bengal 721302, India
2
KITECH North America, Korea Institute of Industrial Technology, San Jose, CA 95134, USA
*
Author to whom correspondence should be addressed.
Nanomaterials 2021, 11(7), 1670; https://doi.org/10.3390/nano11071670
Submission received: 15 April 2021 / Revised: 17 June 2021 / Accepted: 22 June 2021 / Published: 25 June 2021

Abstract

:
The effect of cold rolling on the evolution of hardness (H) and Young’s modulus (E) on the rolling-width (RW), normal-rolling (NR), and normal-width (NW) planes in Zr41.2Ti13.8Cu12.5Ni10Be22.5 (Vitreloy 1) bulk metallic glass (BMG) was investigated systematically using nanoindentation at peak loads in the range of 50 mN–500 mN. The hardness at specimen surface varied with cold rolling percentage (%) and the variation is similar on RW and NR planes at all the different peak loads, whereas the same is insignificant for the core region of the specimen on the NW plane. Three-dimensional (3D) optical surface profilometry studies on the NR plane suggest that the shear band spacing decreases and shear band offset height increases with the increase of cold rolling extent. Meanwhile, the number of the pop-in events during loading for all the planes reduces with the increase of cold rolling extent pointing to more homogeneous deformation upon rolling. Calorimetric studies were performed to correlate the net free volume content and hardness in the differently cold rolled specimens.

1. Introduction

Bulk metallic glasses (BMGs) exhibiting high structural strength can be synthesized by quenching from the liquid state at a critical cooling rate of >102 K/s [1]. The glassy structure produced at different cooling rates exhibits different free volume contents, leading to the evolution of different configurational states in the potential energy landscape (PEL), and exhibits different fictive temperatures Tf, which affects the mechanical behavior [2,3]. Owing to the absence of long-range order, BMGs are isotropic, but can become anisotropic in terms of elastic, mechanical, and magnetic properties owing to local cooling rate difference fluctuations during vitrification [4] or secondary processing like elastic [5], anelastic [6], homogeneous (creep) [7], and inhomogeneous plastic deformation through compression [8] or high-pressure torsion [9]. Bond-orientation anisotropy (BOA) in BMGs was reported to cause anelastic deformation [8,10]. Furthermore, local bond exchange or the bond reformation during plastic deformation was reported to be the root cause of the observed structural anisotropy [3,7,9].
The plastic deformation of bulk metallic glasses (BMGs) involves two competing processes, including free volume creation and relaxation [11,12,13]. The free volume creation process includes disordering and dilatation, which led to softening, whereas the relaxation process is linked with diffusional ordering and densification [14,15]. The disordering and softening processes dominate in most of the cases and fail the BMG catastrophically by forming shear bands [11,12,16]. At low temperatures, the run-away of shear bands is dominated by the sluggish diffusion rate, thus the free volume accumulation is significant compared with that of free volume annihilation rate. Therefore, experimental and molecular dynamics simulations have shown that uncontrolled softening is the dominant mechanism during shear banding, as reported by several authors [17,18,19,20,21,22,23,24,25,26].
On the other hand, the hardening in BMGs has been reported to occur as a result of the homogeneous nucleation and continuous multiplication of the shear bands [27]. Similarly, the change in the morphology and distribution of the chemically heterogeneous domains in the glassy structure may also contribute to the hardening [28]. Along this line, Lee et al. have reported an increase in the compressive yield strength in Vitreloy 1 upon cold rolling without any change in the local chemical composition nor the deformation induced nanocrystallization [29]. Interestingly, the strain-hardening has also been reported during cyclic compressive loading [30]. Schuh et al. have reported that the hardening in a glassy phase is linked with the formation of new shear bands, which increases the flow stress owing to the deformation induced nanocrystallization in the shear bands [13]. Recently, Wang et al. have also observed the densification in a monolithic BMG upon tensile deformation. Such densification is linked to the diffusional rearrangements leading to rapid annihilation of the free volume, which dominates over the shear flow and the free volume accumulation [31]. Therefore, in-depth studies are required to understand the deformation-induced relaxation and dilatation in the BMGs.
In the present work, monolithic Zr41.2Ti13.8Cu12.5Ni10Be22.5 (Vitreloy 1) BMG was cold rolled (CR) to different reductions and the variations of the nanoindentation hardness and Young’s modulus on the rolling-width (RW), normal-rolling (NR), and normal-width (NW) planes at different loads were systematically studied. The evolution of the shear bands on the NR plane was studied by optical profilometry. The effect of rolling on the hardness was correlated with the free volume content.

2. Experimental Procedure

Rectangular bars of Zr41.2Ti13.8Cu12.5Ni10Be22.5 (Vitreloy 1) BMG with the size of 2 × 2 × 4 mm3 were polished carefully to achieve a mirror-like surface finish and were cold-rolled (CR) up to 4.5% (CR4.5), 10% (CR10), 20% (CR20), and 31% (CR31), with 0.05 mm reduction during each pass, as shown in Figure 1. The structure of the specimens was characterized using a differential scanning calorimeter (DSC, Perkin Elmer, Waltham, MA, USA, DSC 8000) and X-ray diffraction (XRD), confirming the glassy nature of the as-cast (CR0) and the differently CR specimens. The X-ray diffraction studies were performed using Philips PANalytical X-ray diffraction (XRD) unit (PW3373, The Netherlands) with Cu-Kα radiation. Figure 2 displays the X-ray diffraction (XRD) patterns of CR0 and CR31, confirming the structure of the specimens to be amorphous. DSC experiments were carried out at a heating rate of 20 K/s. As the shear bands are visible on the free surfaces only, the NR plane of the CR specimens was investigated, which remained untouched during rolling to construct the 3D contour of the surface. The 3D contour of the surfaces was constructed using the interference pattern, as constructed by the 1376 pixel × 1032 pixel high resolution colour charge-coupled device camera attached to Bruker Contour GT 3D-optical surface profilometer (OSP). The instrument has a wide dynamic range with lateral resolution of 0.3 μm and RMS of < 0.03 nm. The shear band spacing and the offset height were estimated using Vision64 analysis software (Billerica, MA, USA).
Similarly, an optical microscope attached to the nanoindenter was used to choose the flat surface in between the two nearby shear bands for the indentation studies on the NR plane. A minimum distance was maintained between two indentations following ASTM standard, which is 20 times of the indentation depth, to avoid an overlapping of the two nearby plastically deformed zones. As no shear bands were observed on the RW and NW planes, the location for nanoindentation tests was chosen randomly, whereas the as-cast and CR samples were cut into two halves along the NW plane for the nanoindentation studies for NW planes, as depicted in Figure 1. The nanoindentation tests were performed using Hysitron TI950 TriboIndenter, Minneapolis, MN with a standard three-sided Berkovich indenter at room temperature in control loading rate (CLR) mode with varying maximum applied load (Pmax) at 50 mN, 100 mN, 200 mN, and 500 mN. Instrumented nanoindentation carried out by pressing a Berkovich indenter into the sample surface with of 30 s of loading followed by load holding of 40 s at peak load and unloading of 10 s, as illustrated in Figure 3. The nanoindenter load resolution is ±1 nN and displacement resolution is ±0.02 nm. The thermal drift was set to be ±0.05 nm/s. The contact area between the diamond indenter and the specimen was calibrated using a fused-quartz standard [32]. A field emission scanning electron microscope (FESEM, Zeiss Merlin Gemini 2, Zeiss, Jena, Germany) was used to study the nanoindentation impressions in the as-cast and differently CR samples. The hardness (H) and elastic modulus (E) values were calculated from P-h curves using the Oliver and Pharr model [32].

3. Results

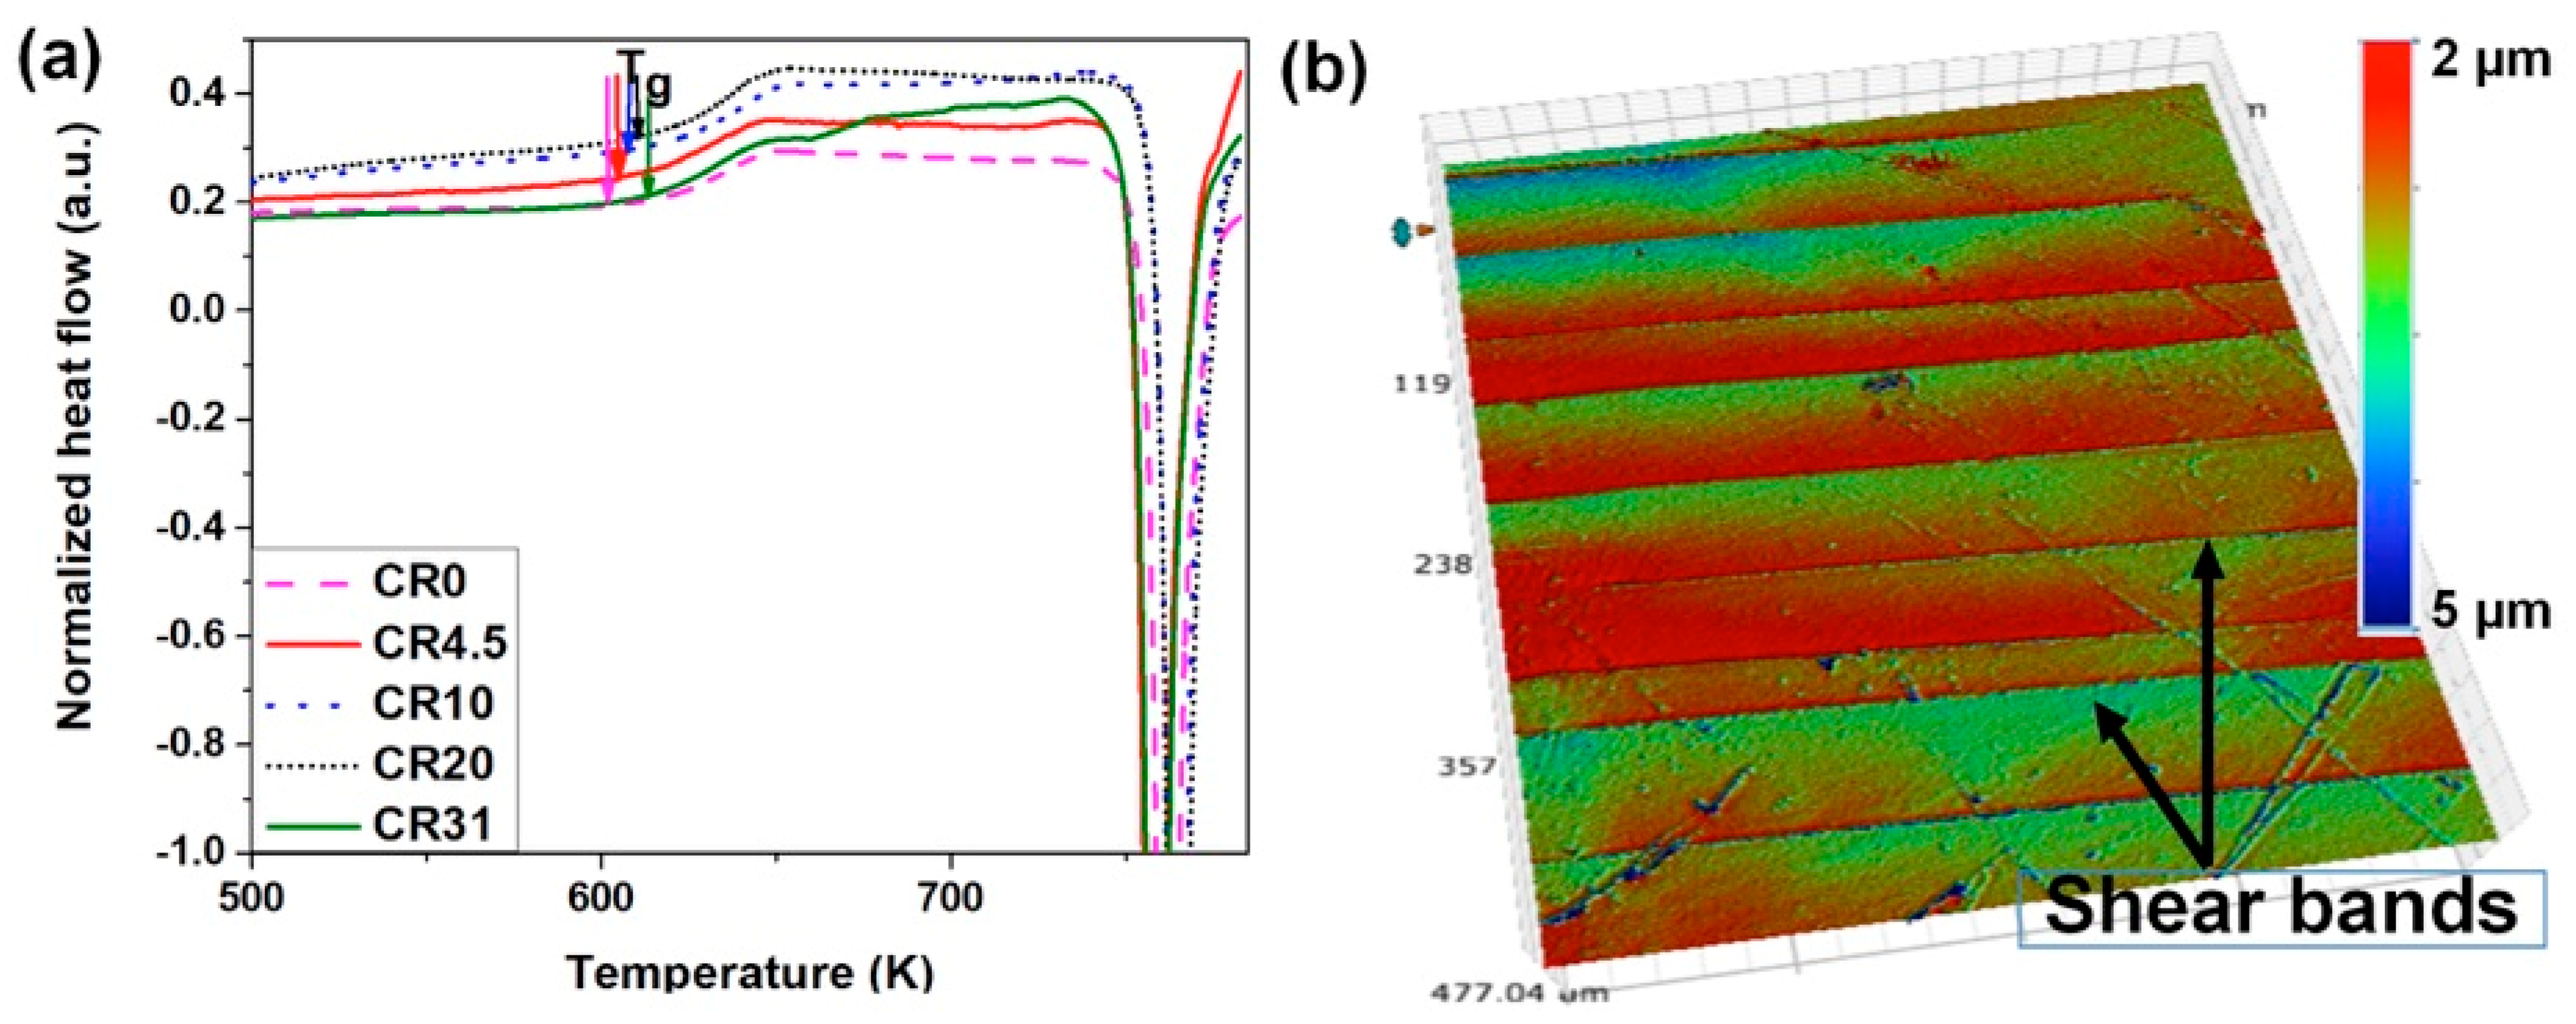
3.1. DSC Studies and Free Volume Estimation

Figure 4a displays the DSC traces for CR0, CR4.5, CR10, CR20, and CR31. The onset of glass transition ( T g o n s e t ) was estimated to be 609.8 ± 8.0 K (CR0), 611 ± 3.7 K (CR4.5), 616.6 ± 7.5 K (CR10), 619.1 ± 3.8 K (CR20), and 619.9 ± 5.5 K (CR31). The estimated T g o n s e t values of CR specimens are higher than that of CR0. The onset of the crystallization (Tx) was measured to be 752.5 ± 0.1K (CR0), 759.9 ± 0.1 K (CR4.5), 760.1 ± 0.2 K (CR10), 759.2 ± 0.1 K (CR20), and 756.7 ± 0.1 K (CR31), respectively, whereas the enthalpy change (ΔH) during crystallization was estimated to be −78.78 ± 0.46 J/g (CR0), −78.53 ± 0.09 J/g (CR4.5), −78.6 ± 0.33 J/g (CR10), −77.93 ± 0.63 J/g (CR20), and −81.08 ± 0.57 J/g (CR31), pointing to similar ΔH values of the as-cast and CR specimens. Hence, the glassy structure remains similar upon cold rolling without any hint of nanocrystallization. Such a conclusion was also confirmed by transmission electron microscopic investigation, and crystallization did not occur upon cold rolling [33]. Several researchers have shown an increase of ΔH values with an increase in the extent of cold rolling [11,12,13,14,34]. In contrary, Flores et. al. have shown that ΔH values varied with prior deformation [35].
According to Beukel and Sietsma [16], the reduced free volume (x) is expressed as x = vf/(γv*), where the average free volume per atom is vf, v* represents the critical free volume for atomic diffusion, and the overlap factor is indicated by γ. For simplicity, the reduced free volume (x) is named as free volume from here onwards in this work. The x value varies with the temperature when a metallic glass is subjected to continuous heating during DSC experiments. The glassy structure relaxes and attains the equilibrium upon heating at a constant rate below Tg [16]. The stored enthalpy releases during the reduction in the free volume and, therefore, the structural relaxation process is featured by an exothermic event. On the other hand, the rise in x with temperature after relaxation leads to an increase in the enthalpy and was characterized by an endothermic reaction, which is related to the glass transition [34]. The onset of the endothermic reaction, pointing to the rise in x, is called the onset of glass transition temperature or T g o n s e t . At T g o n s e t , x reaches the equilibrium free volume xeq  ( T g o n s e t ) , which can be expressed as follows:
x e q ( T ) = ( T T o ) B
where T is the temperature at which free volume is measured; To is the Vogel–Fulcher–Tammann (VFT) temperature (i.e., 390 K); and B is the product of To and the fragility parameter, reported to be 9282 [16,36].
A proportional relation exists between the ΔH and the free volume change (Δx) during both the structural relaxation and the glass transition event [6,34]:
ΔH = A · Δx
where A is the proportionality constant. The structural relaxation process in BMGs occurs at temperatures in between room temperature and T g o n s e t . The change in the enthalpy throughout the structural relaxation process is related to the variation of the net free volume Δx, which is a measure of the difference between x(TRT) at 297 K and the free volume at T g o n s e t in Vitreloy 1. Thus, the value of x(TRT) was estimated to be 0.0234, 0.0222, 0.0245, 0.0241, and 0.0229 using Equations (1) and (2) for CR0, CR4.5, CR10, CR20, and CR31, respectively. The x(TRT) value of CR0 is similar to that reported by Masuhr et al. [37]. The value of x(TRT) of CR10 and CR20 increased, whereas the same value of CR4.5 and CR31 decreased compared with that of CR0. Both the increase and decrease of free volume content upon plastic deformation of BMGs were reported earlier [11,12,13,14,21,38,39].

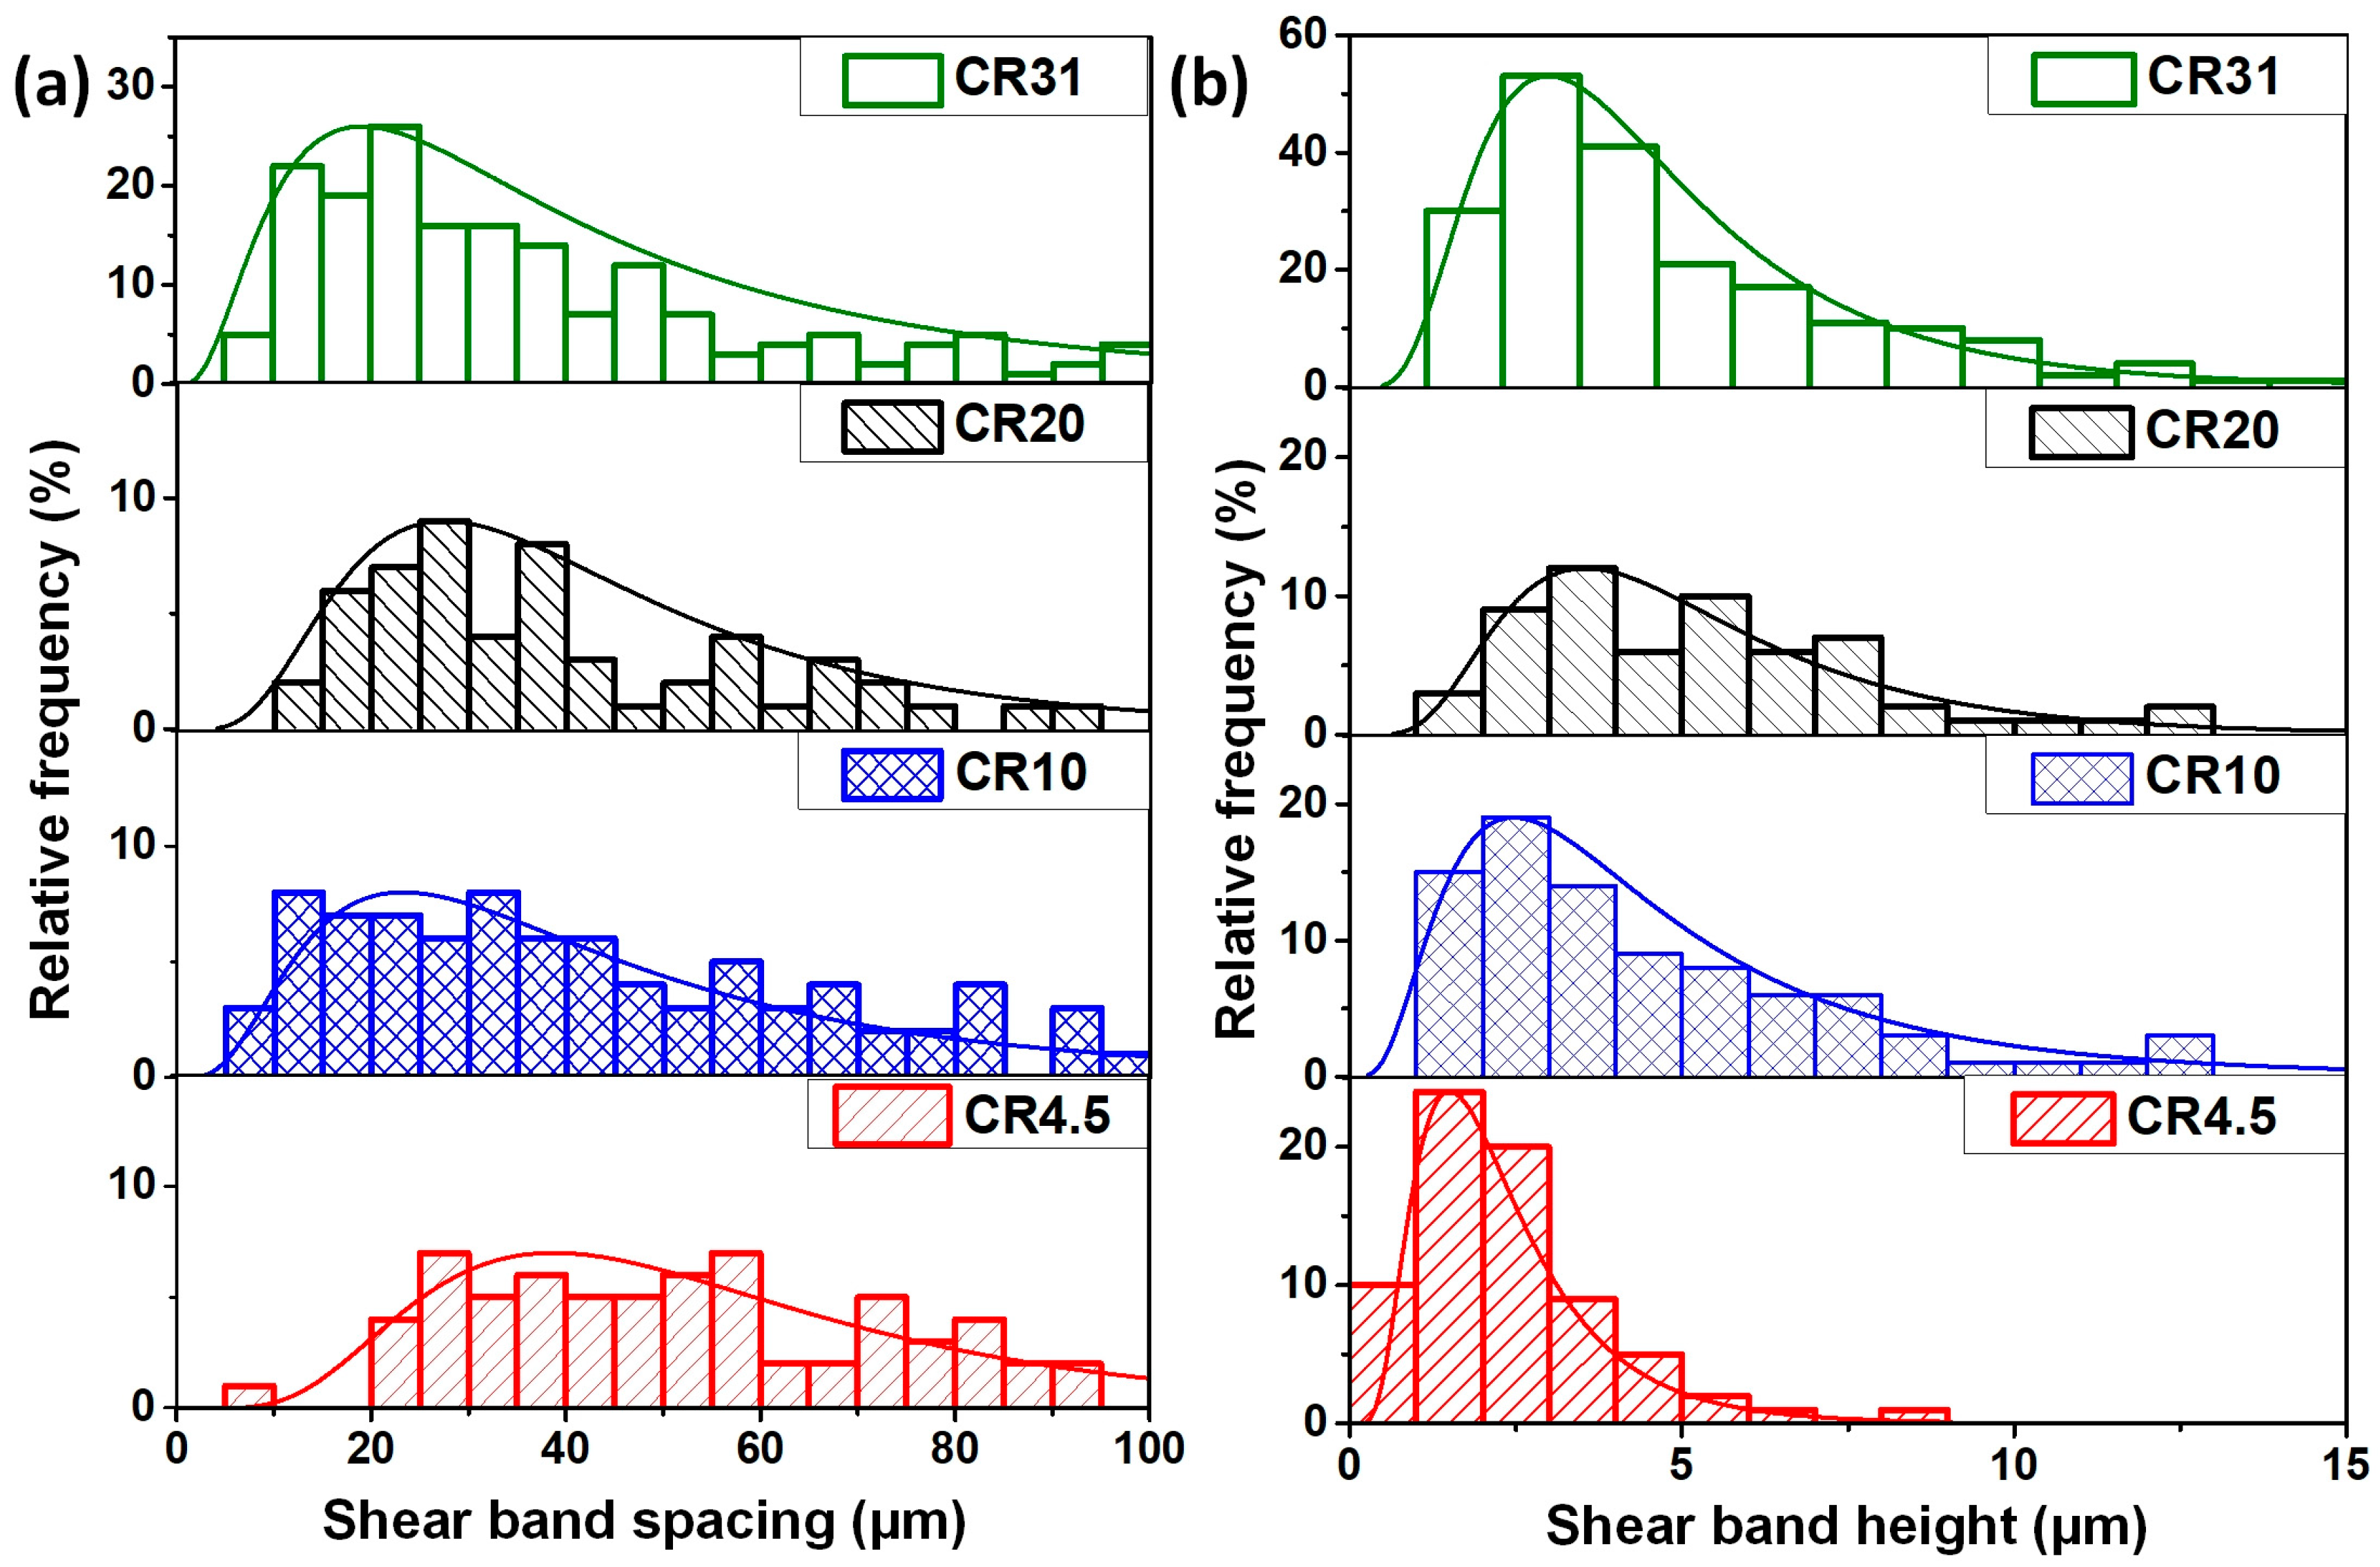
3.2. Characterization of Shear Bands on the NR Plane

Three-dimensional (3D)-OSP studies were performed to quantitatively estimate the shear bands on the free surface of the NR plane, as the shear bands are visible on the free surface, which remained untouched during rolling. For example, a 3D-OSP image of shear bands formed on CR4.5 is shown in Figure 4b. The shear band spacing (λ) and the offset height (δ) were measured in each different CR sample by analyzing the 3D-OSP images, and their relative frequency distribution data shown in Figure 5a,b are very well fitted using the lognormal function, which has a regression coefficient of >0.9 in all cases. The shear band density increased with the increase of cold rolling percentage. It was observed that the λ value decreased and δ increased with the increase in the extent of cold rolling. The average value of shear-band spacing (λavg) was estimated to be 37.6 ± 17.1 μm, 23.3 ± 19.7 μm, 26.8 ± 15.6 μm, and 19.3 ± 12.1 μm for CR4.5, CR10, CR20, and CR31, respectively, whereas the average value of shear band height (δavg) was estimated to be 1.7 ± 1.2 μm, 2.6 ± 1.8 μm, 3.4 ± 0.9 μm, and 2.8 ± 2.1 μm for CR4.5, CR10, CR20, and CR31, respectively.

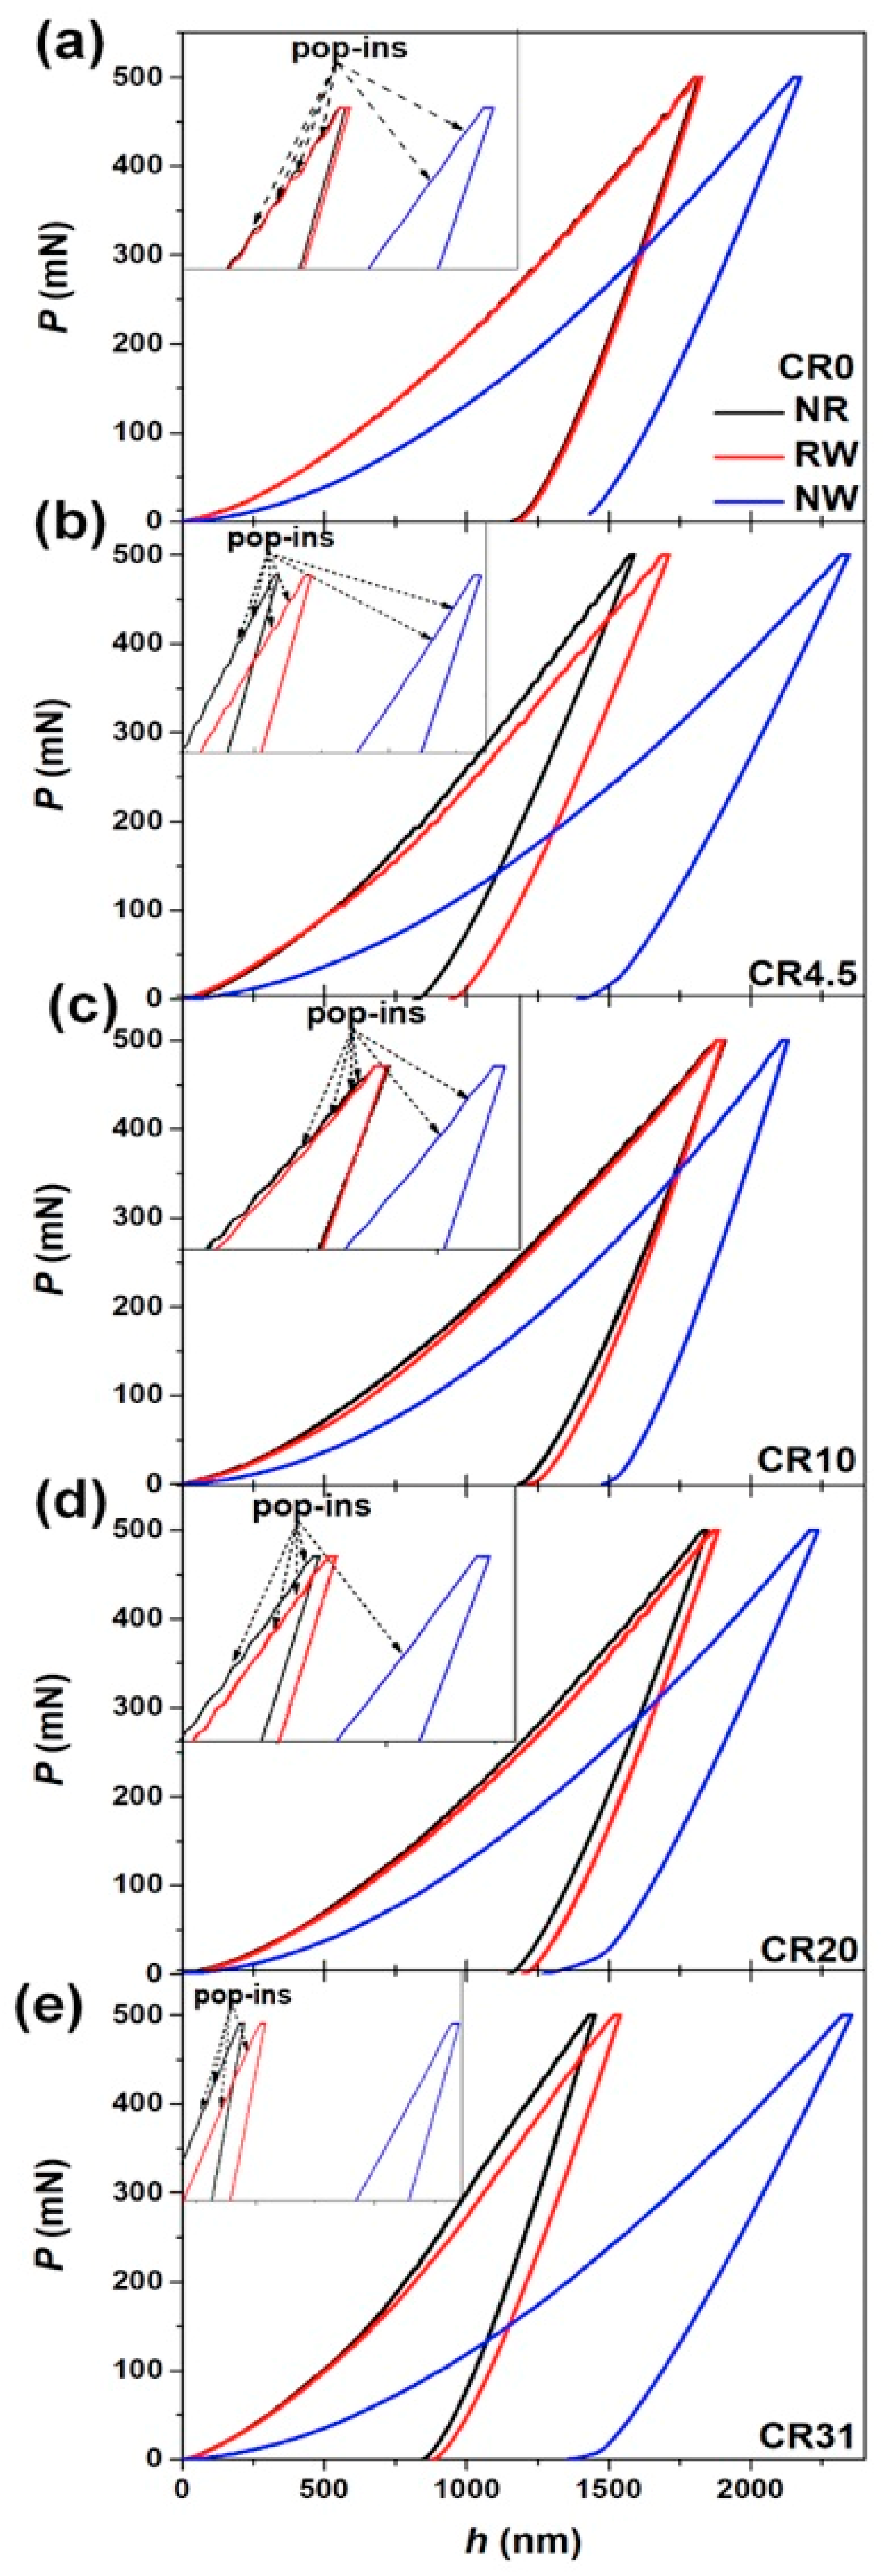
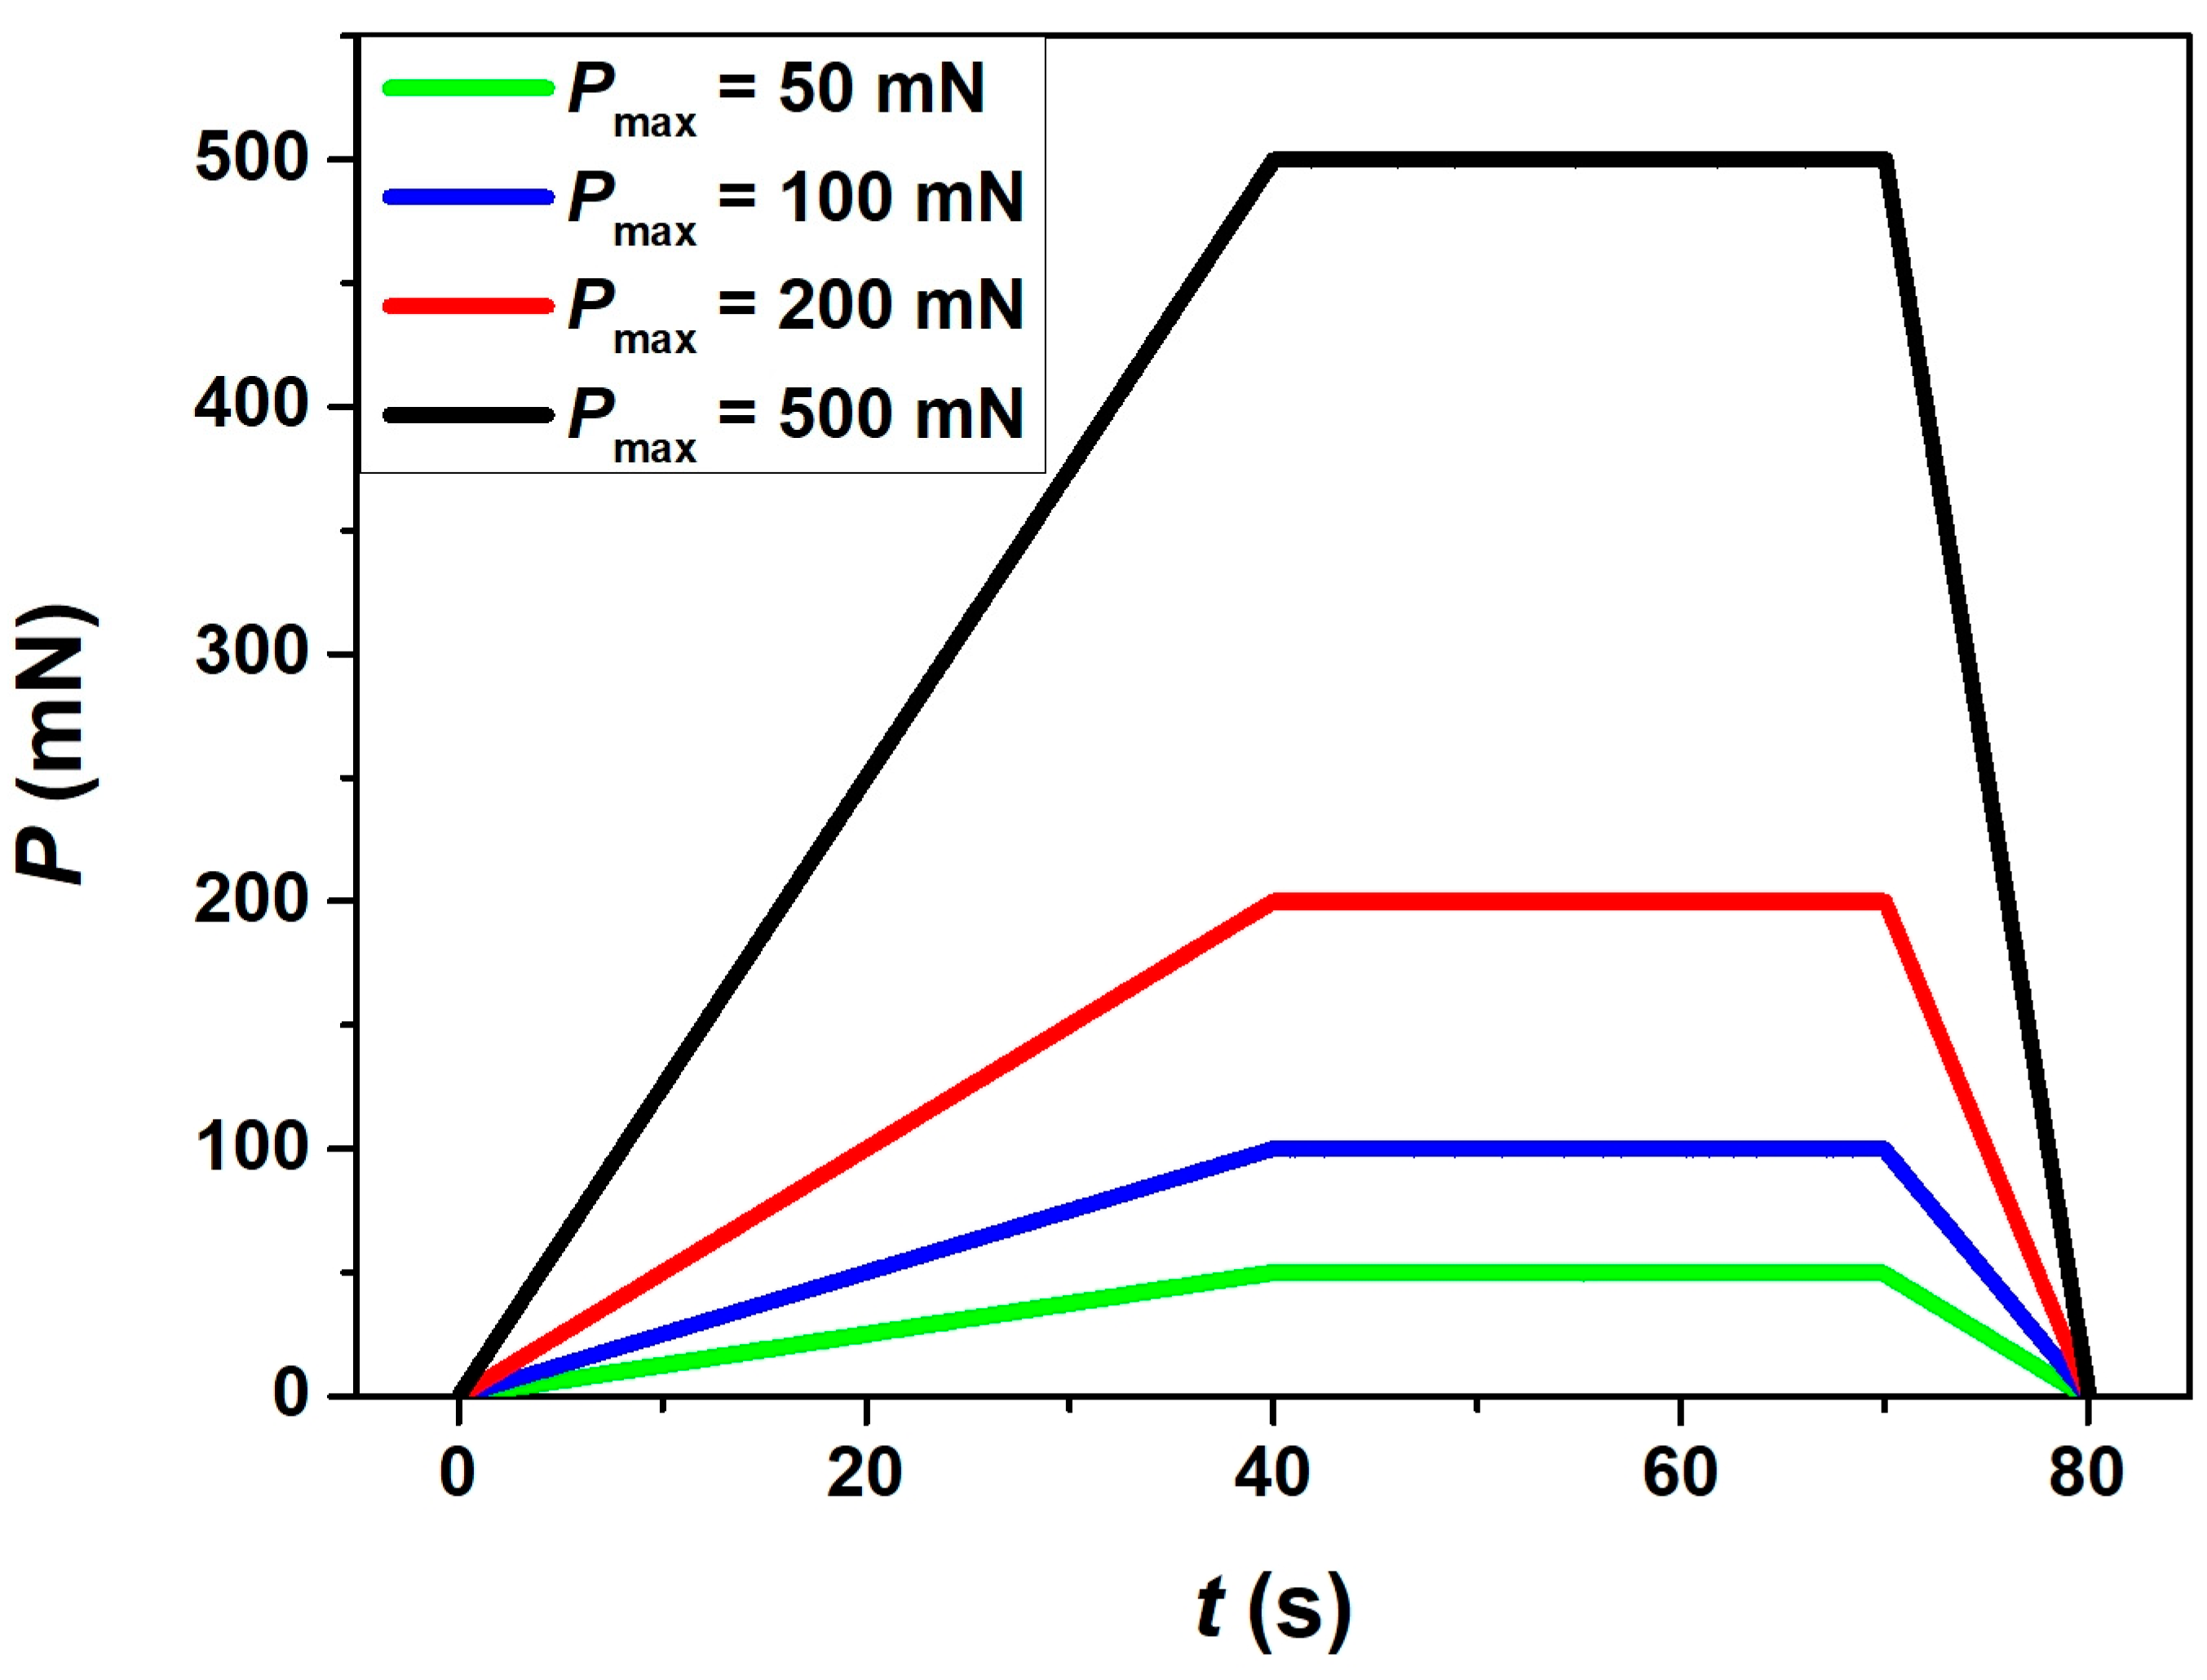
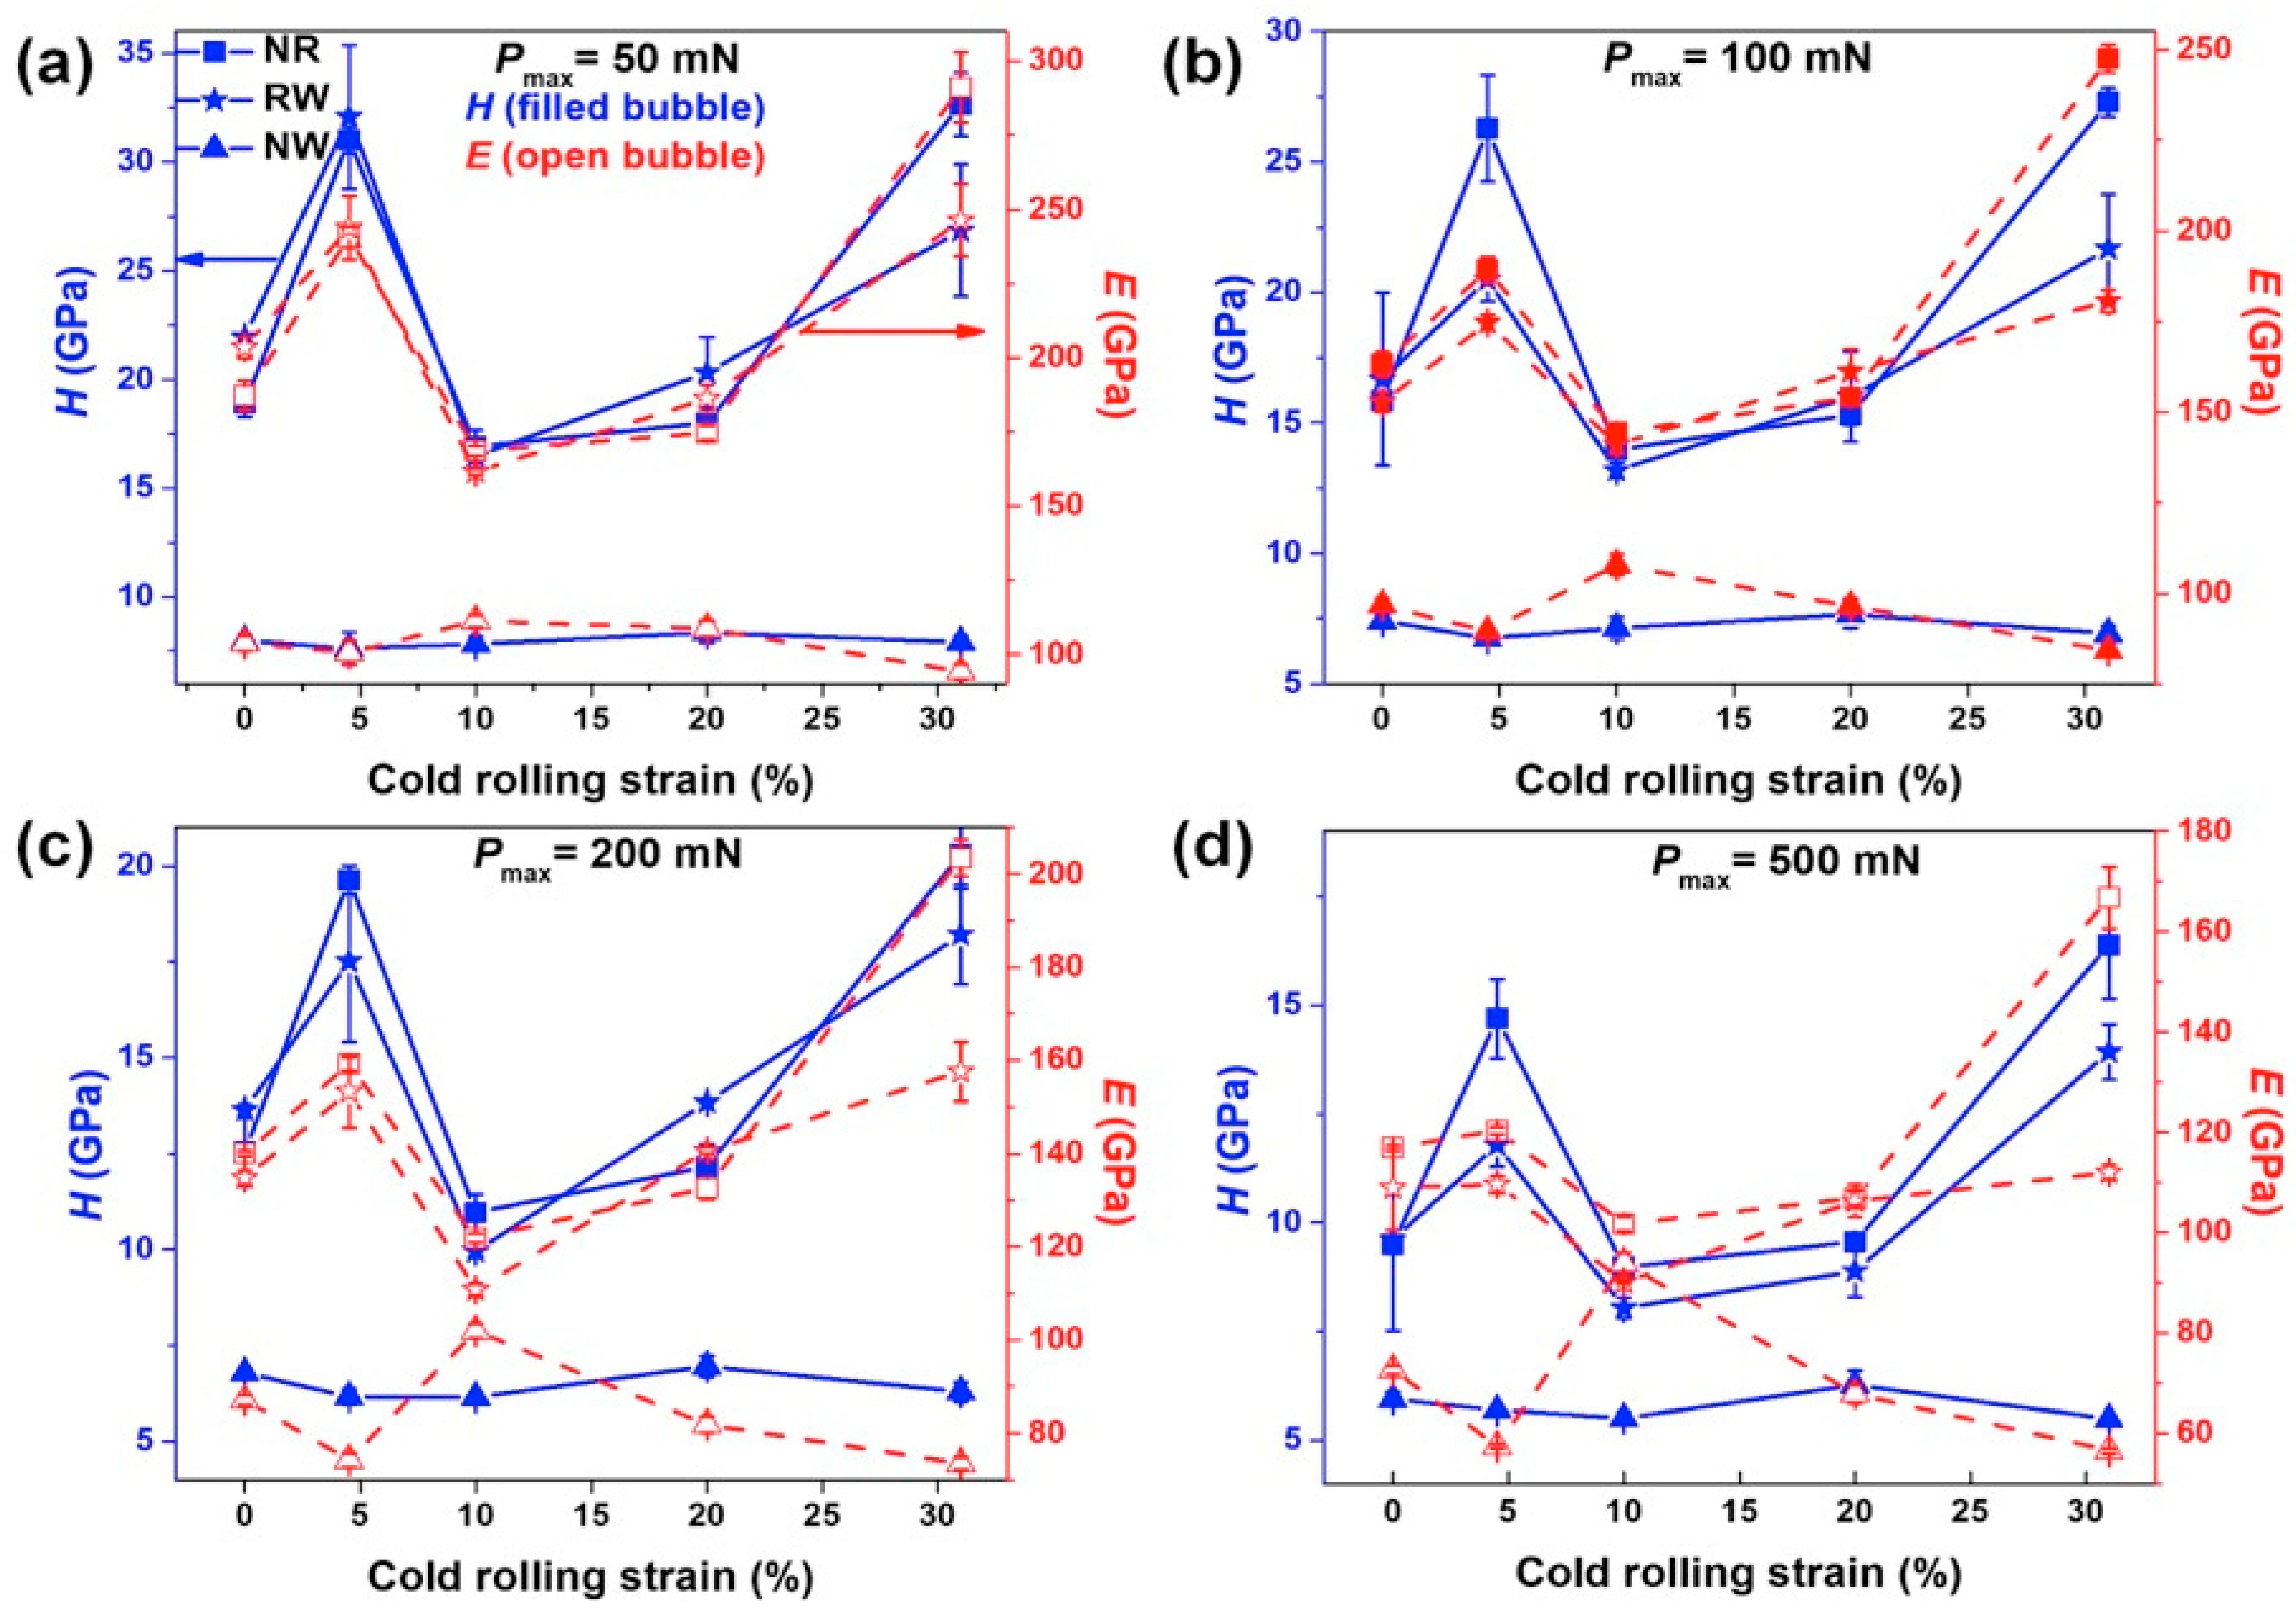
3.3. Nanoindentation Studies at Various Pmax (50 mN–500 mN)

Figure 6a–e and Figures S1–S3 show the load (P) versus displacement (h) plots of CR0, CR4.5, CR10, CR20, and CR31 at different loading rates of 1.66, 3.33, 6.67, and 16.67 mN/s loaded up to Pmax = 50 mN, 100 mN, 200 mN, and 500 mN, respectively, for NR, RW, and NW planes. The indentation hardness (H) was estimated using the following equation:
H = (Pmax/Ac)
where Ac is the corrected contact area, which is equal to C1hc2 + C2hc + C3hc1/2 + C4hc1/4 + C5hc1/8 + C6hc1/16, and the Cn terms are constants, as described earlier [32,40]. The hc values were corrected as hc = hmax − 0.75(Pmax/S), where S is the unloading stiffness and hmax is the maximum penetration depth. The elastic modulus (E) of the specimen was measured using the following equation:
1 E r = 1 ν 2 E + 1 ν i 2 E i
where the reduced modulus E r = 0.5 π / A   ( d p / d h ) , E i is the modulus of the indenter, and ν i   is the Poisson’s ratio of the indenter. The Poisson’s ratio of Vitreloy 1 sample is ν = 0.37 [41].
It was noticed that the hmax value for a given load is higher on the NW plane than that of the NR and RW planes. In addition, the hmax values are higher in CR10 and CR20, and lower in CR4.5 and CR31 for a given load than that of CR0 for the NR and RW planes, as shown in Figure 6a–e. Figure 7 displays the variation H and E with the cold rolling percentage for Pmax of 50 mN, 100 mN, 200 mN, and 500 mN for the NR, RW, and NW planes. The estimated H values of CR0, CR4.5, CR10, CR20, and CR31 were 9.6 ± 0.1 GPa, 14.8 ± 0.3 GPa, 8.9 ± 0.2 GPa, 9.5 ± 0.3 GPa, and 15.9 ± 0.1 GPa, respectively, for the NR plane, whereas the H values of the RW plane were estimated to be 9.6 ± 2.1 GPa, 11.8 ± 0.5 GPa, 8.1 ± 0.2 GPa, 8.9 ± 0.6 GPa, and 13.9 ± 0.7 GPa for CR0, CR4.5, CR10, CR20, and CR31, respectively. Furthermore, the H values were estimated to be lower for the NW plane as 5.9 ± 0.2 GPa, 5.7 ± 0.1 GPa, 5.5 ± 0.1 GPa, 6.3 ± 0.3 GPa, and 5.5 ± 0.1 GPa in CR0, CR4.5, CR10, CR20, and CR31, respectively. The values of H and E in CR0, CR4.5, CR10, CR20, and CR31 at various Pmax values in between 50 and 500 mN for the NR, RW, and NW planes are presented in Table 1, Table 2 and Table 3, respectively. Even though the hardness fluctuation on a particular plane at a given cold rolling percentage is small, as evident from the above hardness error values, the variation of H and E with cold rolling percentage on the NR and RW planes is significant and shows a similar trend at all Pmax values, as shown in Figure 7a–d. The effect of cold rolling percentage on the H and E values is lesser on the NW plane than that of the NR and RW planes. Therefore, the glassy structure was modified upon cold rolling, leading to the variation of H and E values with the increase of cold rolling percentage in Vitreloy 1.
Figure 6 and Figures S1–S3 display the analogous nature of the P-h curves on the NR and RW planes, with more pop-in events in the case of CR0 owing to more trapped in free volume upon cooling than that of the interior of the NW plane, which exhibited a more relaxed glassy structure. Meanwhile, a more parabolic nature of P-h curves with fewer serrations was observed on the NW plane in CR0 with less pop-in depth, revealing a more homogeneous deformation in the NW plane than that of the NR and RW planes. The lower number of pop-in events during nanoindentation on the NW plane than on the NR and RW planes indicates a low number of shear band activation and their propagation. Such reduced pop-in events due to the cooling rate difference between the sample surfaces and interior portion of Zr-based BMG rods have been observed earlier [42]. Likewise, all the cold rolled samples have shown similar behavior on the different planes at a given cold rolling strain.

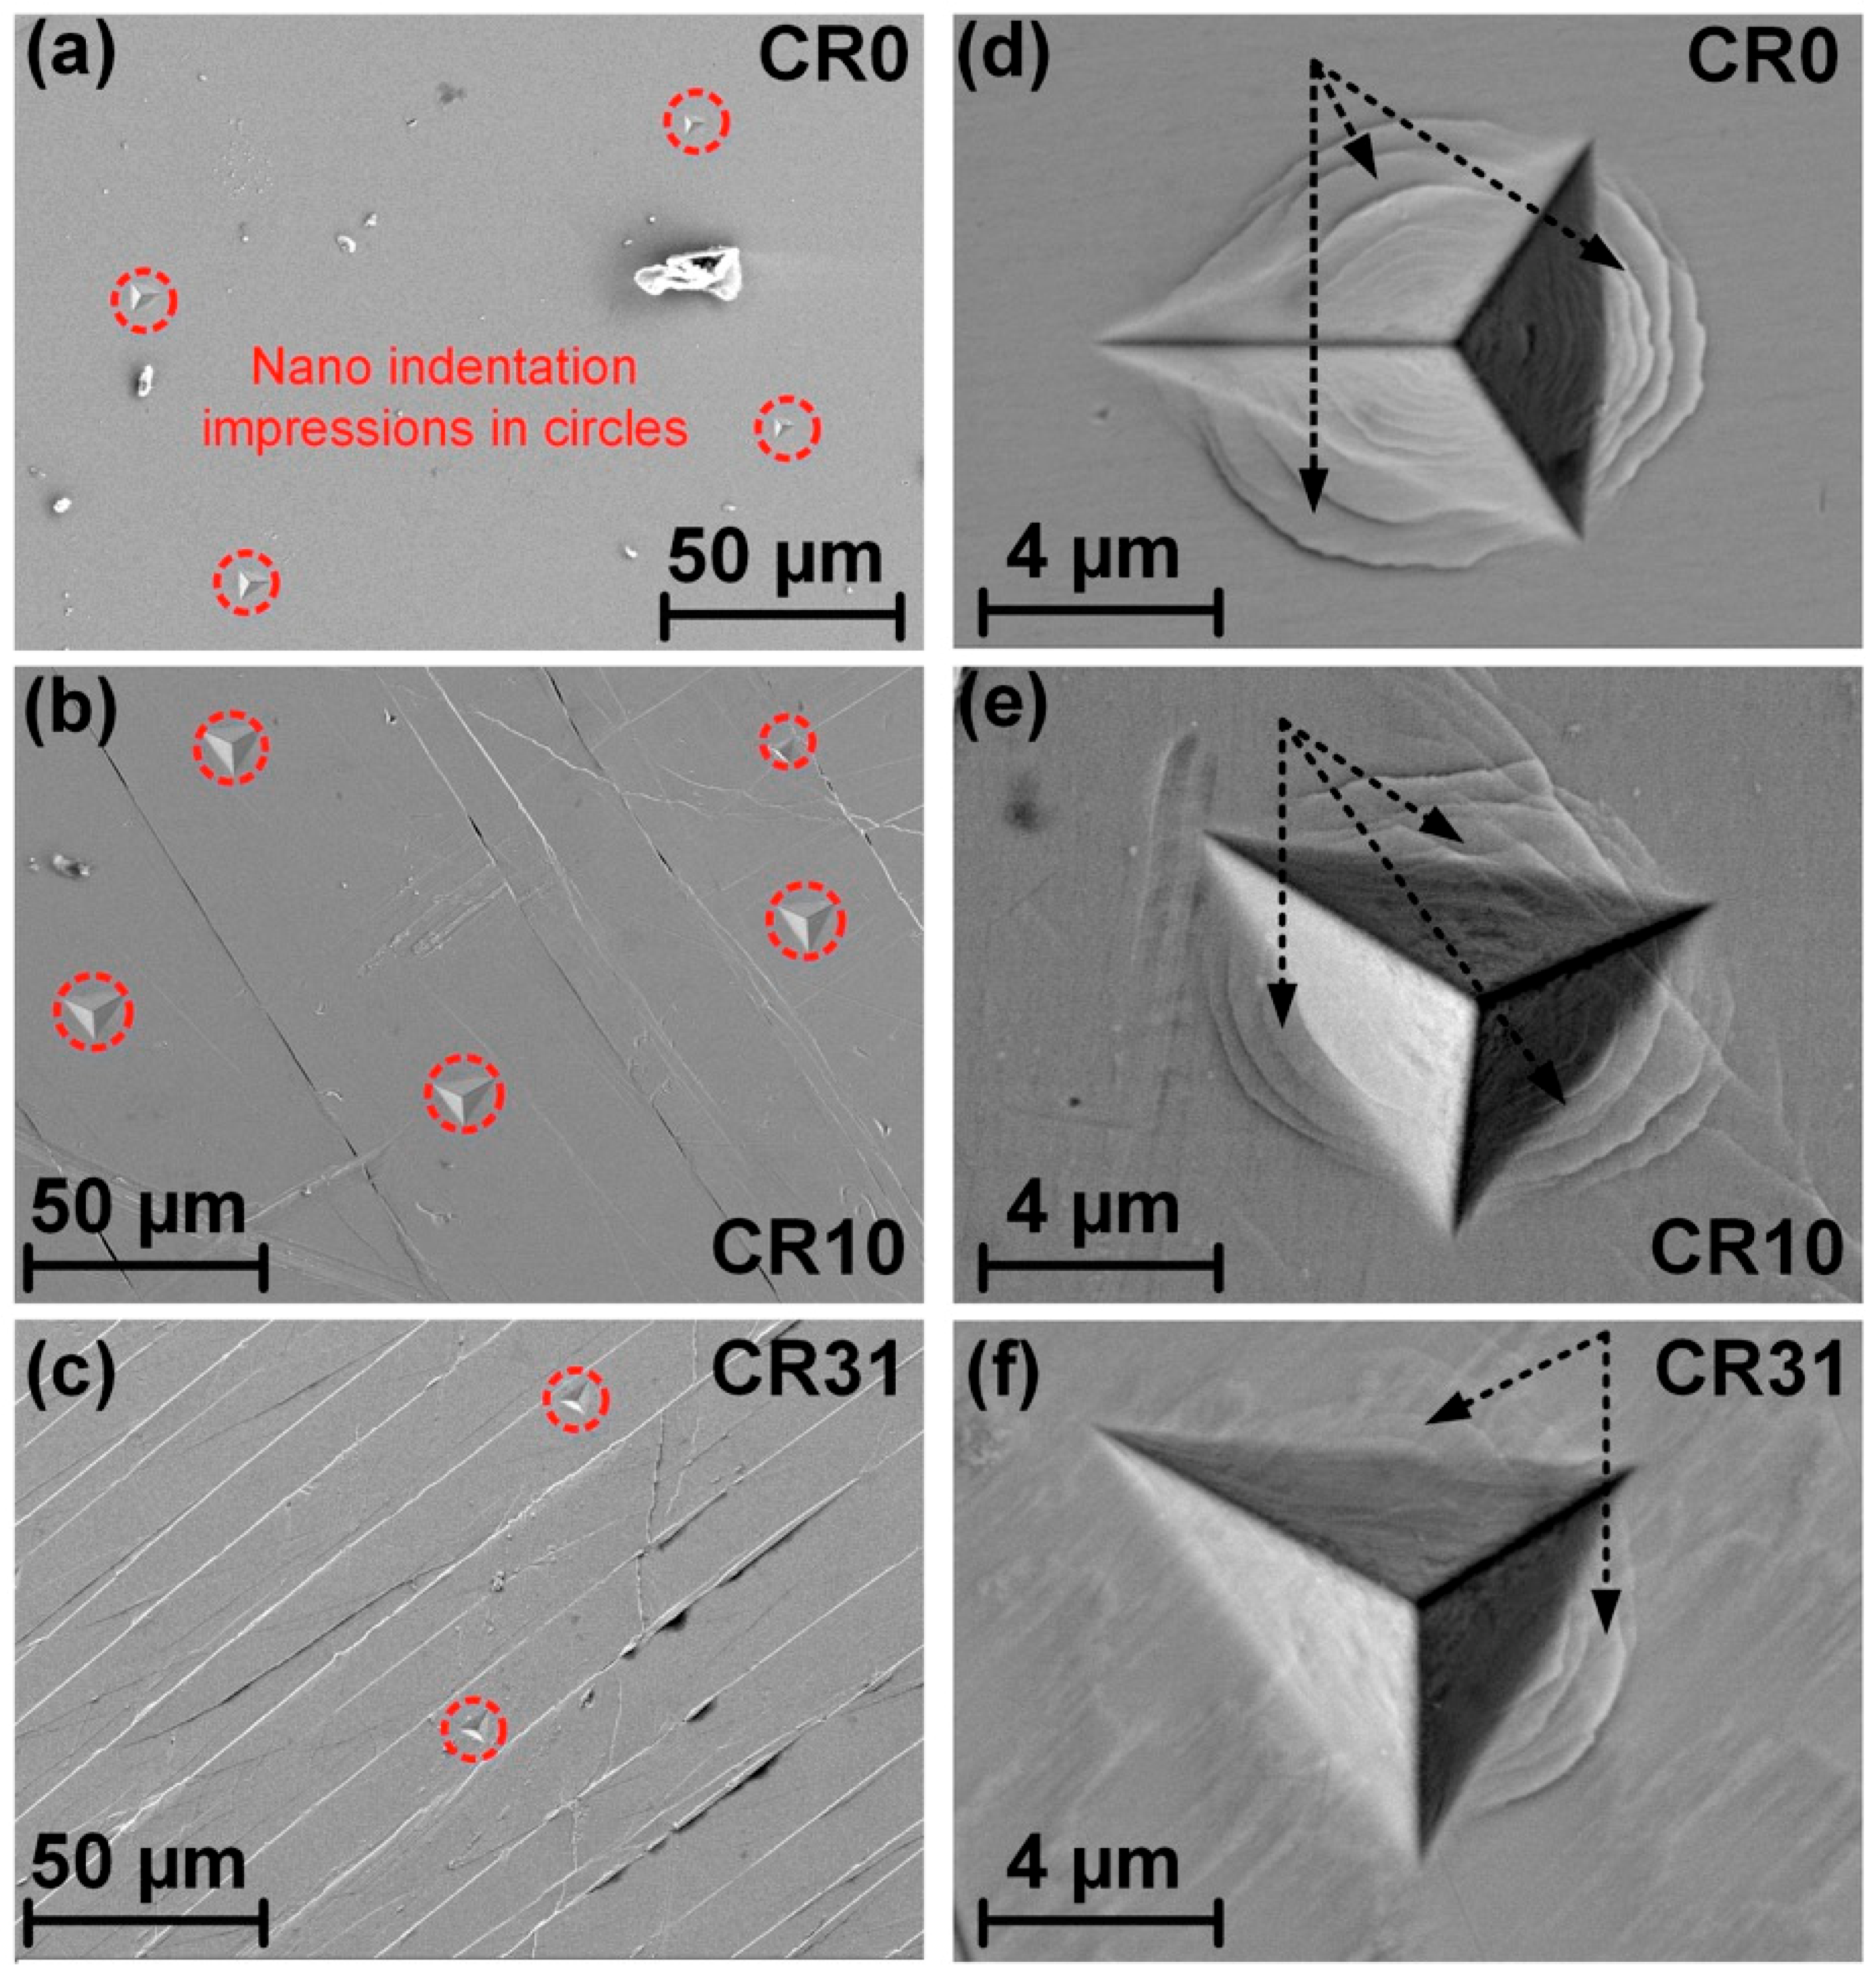
3.4. Studies on the Indentation Impression under SEM

Figure 8a shows the indentation impressions, which are located 70–100 μm away from each other on the surface of CR0. The indentation impression under Pmax = 500 mN in between two shear bands in the case of CR10 and CR31 is shown in Figure 8b,c, respectively. It is worth mentioning that δavg varied between 1.7 μm (CR4.5) and 2.8 μm (CR31) for different CR specimens, exhibiting a much larger length scale than that the indentation impressions for the NR plane. As the location for indentation was chosen between the flat region between two shear bands, the error on the measurement of hc and subsequently on H and E must be neglected. Furthermore, Figure 8d shows the indentation impression on CR0 at Pmax = 500 mN, which shows the formation of very finely spaced shear bands formed around as well as beneath the impression, suggesting inhomogeneous deformation. Meanwhile, a reduction in the number of shear bands around and beneath the indentation impressions was noticed, as shown in Figure 8e,f. Such a disappearance becomes more pronounced with the increase of cold rolling extent, implying the evolution of homogeneous deformation in cold rolled samples.

4. Discussion

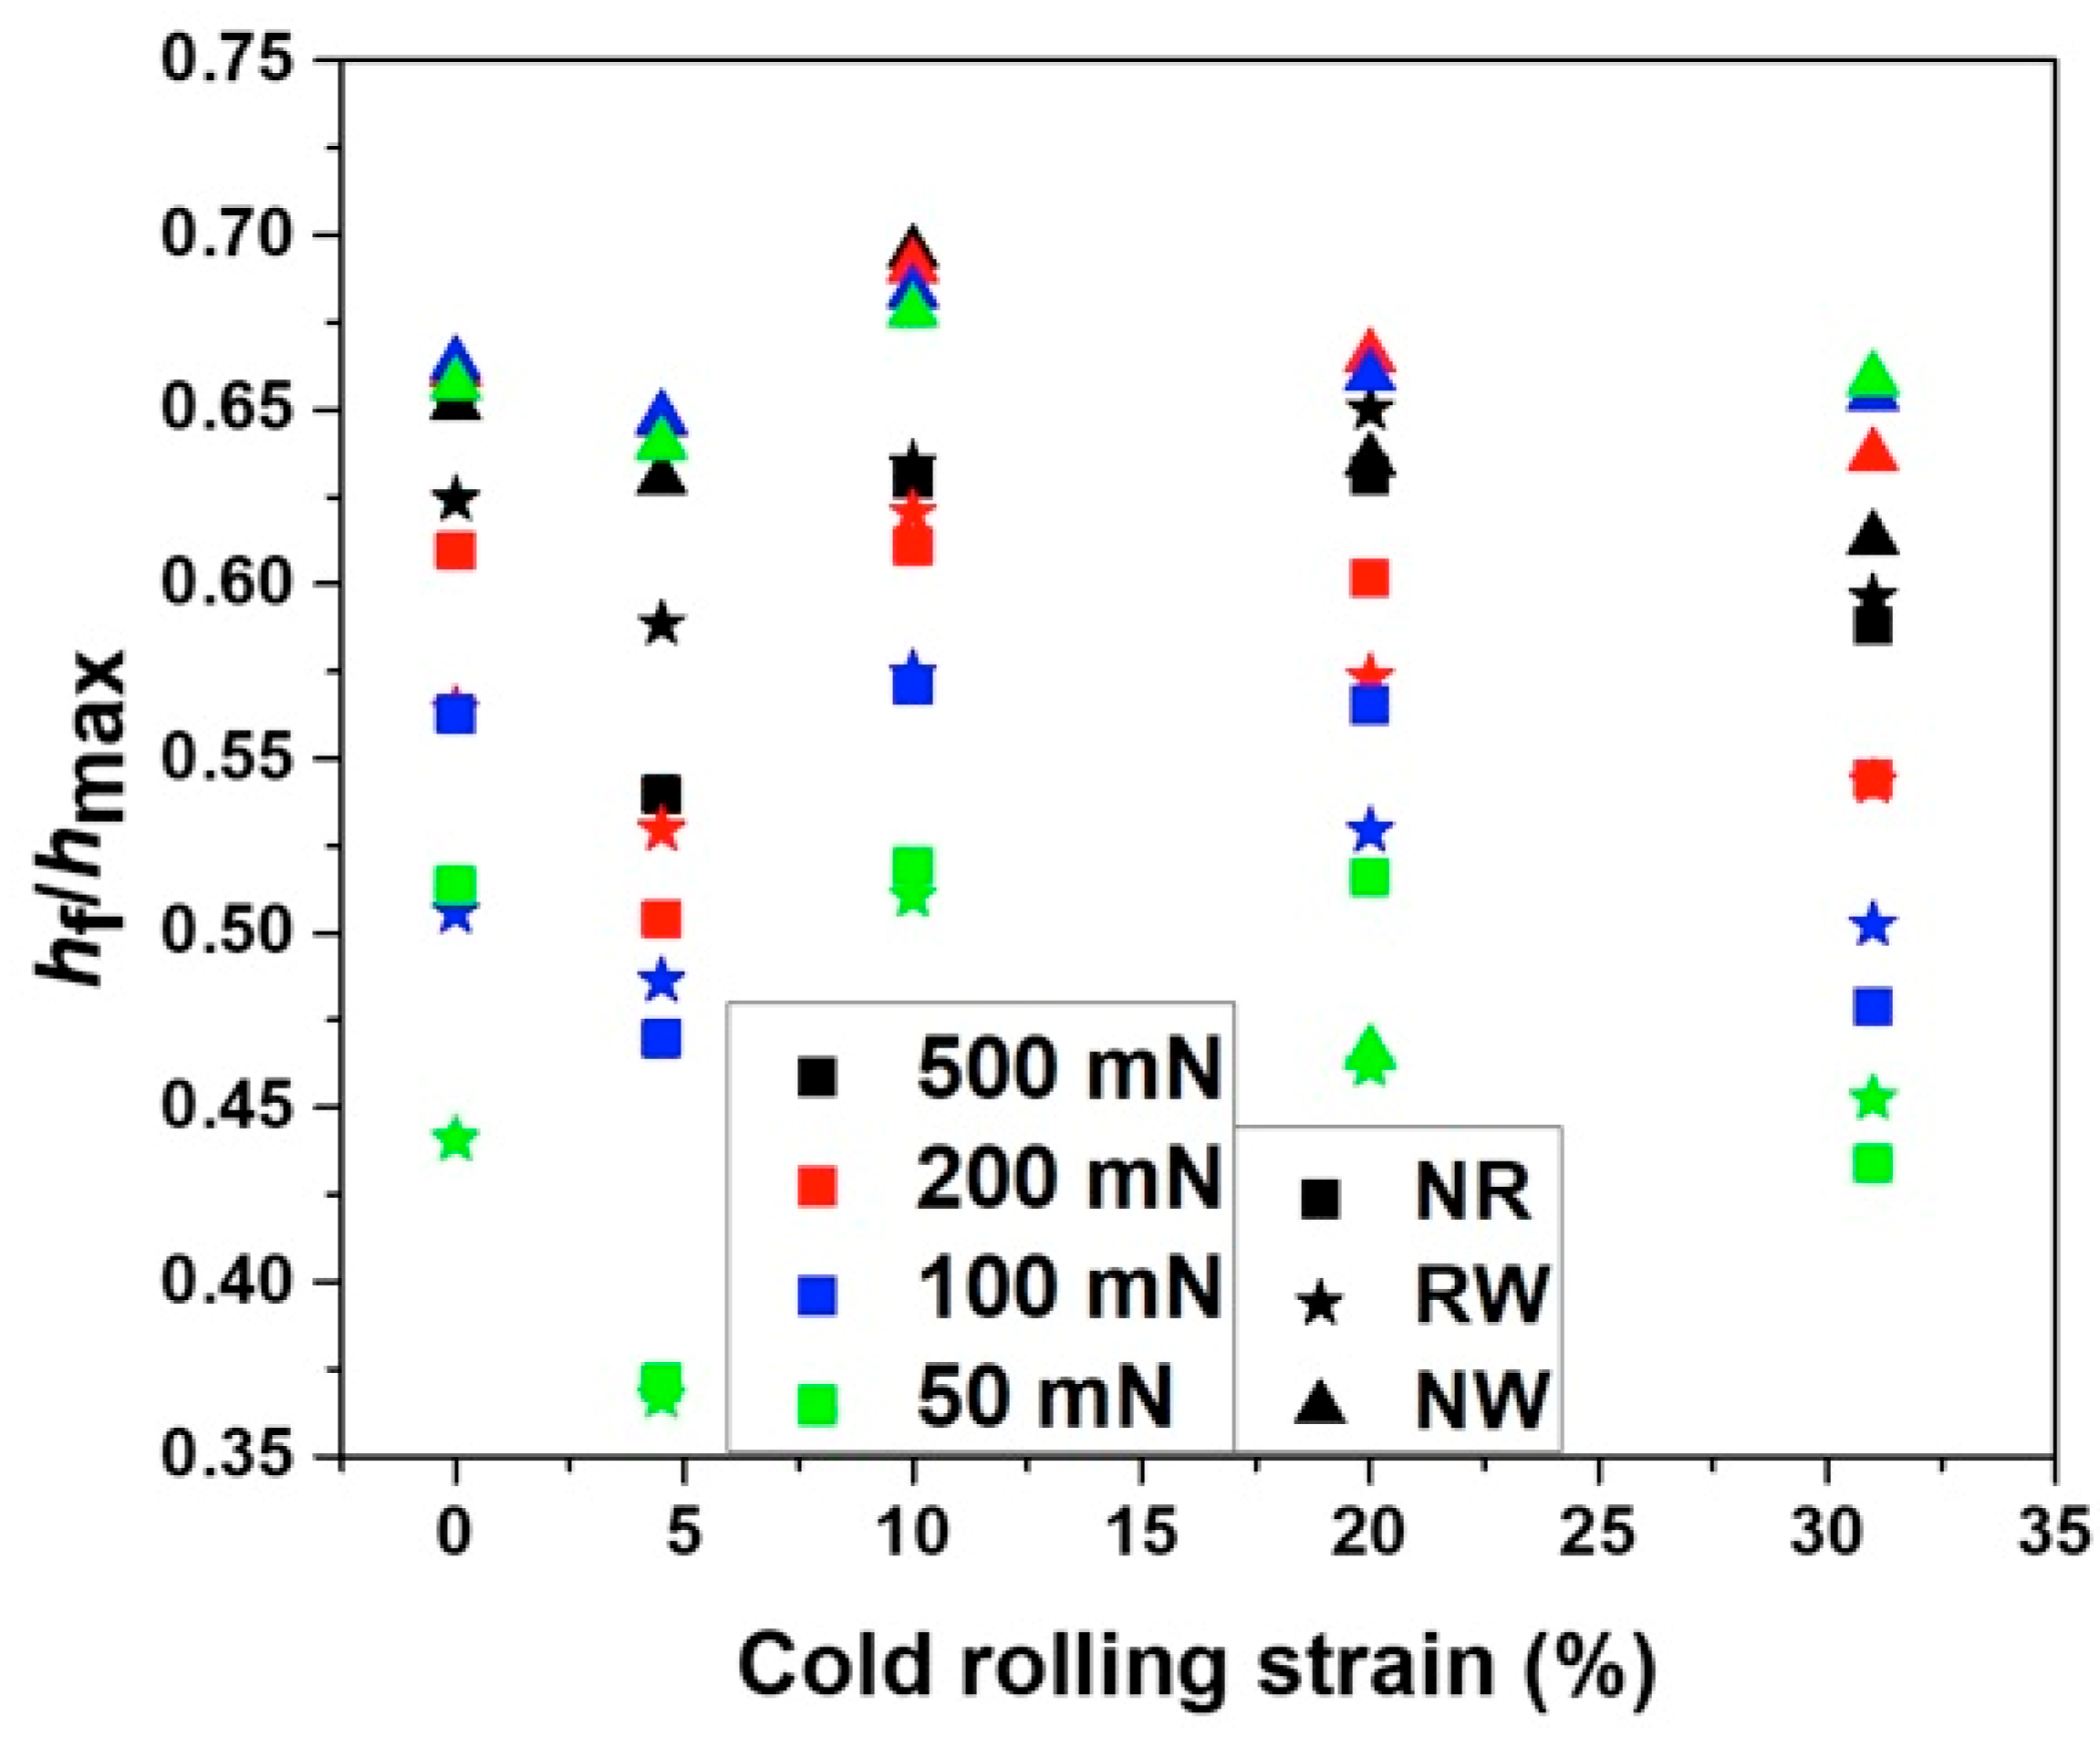
4.1. Effect of Cold Rolling on Elastic-Plastic Response

The P-h plots of a specific sample for a given plane (either NR, RW, or NW) coincided with each other for all the Pmax values in the range of 50–500 mN, which supports the repeatability and reproducibility of the experiments. The nature of elastic-plastic deformation beneath the indenter can be evaluated using the hf/hmax ratio, which lies between 0 and 1 [43]. hf/hmax = 0 implies a complete elastic deformation, whereas hf/hmax = 1 points to a fully plastic deformation. Figure 9 shows the hf/hmax ratio at different Pmax of all the CR specimens for the NR, RW, and NW planes. The CR0 and different CR specimens showed hf/hmax < 0.7, indicating the deformation to be elastic-perfectly plastic. The effect of cold rolling percentage on hf/hmax exhibits a similar trend to that of H variation with cold rolling, as depicted in Figure 7a–d, whereas hf/hmax values lay between 0.6 and 0.7, depicting a more plastic nature in the NW plane than that for the NR and RW planes for all samples. Furthermore, more plastic behavior was observed in CR4.5 and CR31 than that of CR0, CR10, and CR20 for the RW and NR planes. Pharr et al. have shown, using experimental and finite element simulations, that pileup is not a significant factor when hf/hmax˂ 0.7 and, hence, the Oliver–Pharr data analysis procedure can give reasonable results [32]. In the case of hf/hmax > 0.7, the pileup can result in wrong estimation of H owing to an erroneous contact area deduced from indentation load-displacement data [44,45]. In the present study, hf/hmax values < 0.7, indicating calculated H values, are realistic in nature for all samples for the NR, RW, and NW planes.
The affected volume during nanoindentation was estimated by (3*hf)3 for all the specimens at all Pmax for NR, RW, and NW, as shown in Table 4 [46]. The affected volume during nanoindentation is more than 0.43 µm3, 0.73 µm3, 1.33 µm3, and 2.63 µm3 for Pmax of 50 mN, 100 mN, 200 mN, and 500 mN, respectively, for the NR and RW planes for all the samples. The hardened CR4.5 and CR31 show less affected volume during indentation than the CR0 and softened CR10 and CR20. The affected volume during nanoindentation in the central core of CR specimen on NW plane is estimated to be >1.23 µm3 at all Pmax values. Such an affected volume during nanoindentation validates a homogeneous deformation and corroborates the measured H and E values. A schematic potential energy landscape (PEL) model illustrates the available energy for glasses state: the lowest energy minima configuration for crystal representing corresponding atomic configurations or inherent states, as shown in Figure 10. No compositional variation was noticed on the three perpendicular planes of the specimens; therefore, the variations of H and E are linked to the evolution of different structural states only. Such structural fluctuations may evolve during synthesis owing to cooling rate differences between surface planes (NR and RW) and the interior core of the NW plane. NR and RW planes have shown similar H and E values, representing a similar glassy structure to that of the interior NW plane, which exhibited lower H and E values. Such an observation of different structural state formation was also reported in BMGs owing to cooling rate differences between the surface and core region of the sample [42]. Even though no compositional variation was observed in the specimens [33], the variation of H and E are linked to the different structural states that evolved upon cold rolling. Therefore, the evolution of structural fluctuations must have occurred with the increase of cold rolling strain on the NR and RW planes, which resulted in hardening in CR4.5 and CR31, whereas softening was observed in CR10 and CR31, as shown in Figure 4. Therefore, H and E values on the NW plane have shown only slight variation with increasing cold rolling strain indicating less fluctuations of the structural states.

4.2. Serrated to Smooth Flow on NR, RW, and NW Planes upon Cold Rolling

Strain bursts or pop-in events during loading portion of the P-h curve were observed owing to the nucleation of shear bands and/or their propagation, whereas elbow nature at the end part of the unloading P-h curve was also observed. The elbow-like step in the P-h curve is due to phase transition or softer regions or grain boundaries or pores in crystalline specimens. Such “pop-in” events were observed to be more in CR0 and a smoother flow curve was achieved in CR specimens, as depicted in Figure 6 at Pmax = 500 mN for the NR, RW, and NW planes. A similar observation was made for all other Pmax values, as depicted in Figures S1–S3. In addition, P-h curves exhibited more serration behavior for the NR and RW planes in CR0 and all CR samples than that for the NW plane at all Pmax values.
The plastic event in a glassy phase is associated with the evolution of two different spatial regions, i.e., the shear transformation zones (STZs) and the residual glassy matrix [13]. The macroscopic plastic events proceed with the nucleation and proliferation of new shear bands. Such a phenomenon can be explained from the viewpoint of the percolation of the SRO and the atomic rearrangements in the glassy structure. If the local ε ˙ reaches a critical value, then the atomic rearrangements cannot further accommodate the applied strain. Hence, the differences of strain rates among the surrounding matrix and STZs would still remain, which results an inhomogeneous (non-Newtonian) flow and serrations during nanoindentation as reflected in the Ph curves, as shown for CR0 in Figure 6. The nature of the P-h curves for NR and RW planes have changed from ideal stair step-like behavior for CR0 and CR4.5 (lower cold rolling reductions) to a more parabolic nature with increasing cold rolling extent for all loading rates in the NR, RW, and NW planes, pointing to plastic deformation being more homogeneous upon cold rolling for all planes. Similar behavior of reduced pop-in events with a cooling rate difference between surfaces to the interior portion of the transverse direction was observed in Zr-based BMG rods [42]. Such features were supported by the disappearance of shear bands around the indentation impressions in CR31, as shown in Figure 8f. The reduction of the shear bands around the indentation impressions in CR samples also confirms the homogeneous deformation behavior upon cold rolling. Similarly, high-pressure torsion (HPT) processed BMGs also showed more homogeneous deformation [47].

4.3. Effect of Cold Rolling on Structure, H and E

The deformation of BMGs could be understood by the free volume theory as proposed by Spaepen, and Argon has suggested the STZ model involving clusters of atoms undergoing cooperative shear displacements [11,12,14]. The shear stress and indentation hardness are correlated as follows: H 3 3 τ . According to the free volume model, the evolved shear strain rate ( γ ˙ ) is influenced by the temperature (T), applied shear stress ( τ ), free volume accumulation, and viscosity ( η ), which is defined by the ratio of shear stress and shear strain rate as follows [11,14]:
γ ˙ = 2 c f α o k f , O ε o υ o s i n h ( τ ε o υ o 2 k B ) e x p ( Δ G k B T )
η = τ γ ˙ = τ 2 f s i n h ( τ Ω / 2 k B T ) · e x p ( χ v * v f + Δ G m k B T )
H = 6 3 k B T Ω s i n h 1 [ γ ˙ 2 f · γ 0 · e x p ( χ v * v f + Δ G m k B T ) ]
where Ω indicates the atomic volume, αo is a coefficient featuring the quantity of the material undergoing shear transformation, ε o υ o denotes a flow event activation volume, τ is the shear stress, kB is the Boltzmann constant, Δ G is the activation energy for defect migration, and kf,o is associated with the Debye frequency.
The atomic radii of the elements Zr, Ti, Cu, Ni, and Be are 155 pm, 140 pm, 135 pm, 135 pm, and 112 pm, respectively, and the individual atomic volume of these elements was estimated to be 0.0156, 0.115, 0.0103, 0.0103, and 0.00588 nm3, respectively. Therefore, the average atomic volume (i.e., Voronoi volume) in Vitreloy 1 is 0.01165 nm3 [48]. The activation volume of the flow event ( ε o υ o ) was estimated using nanoindentation data. The strain rate sensitivity (m) was estimated using the log(σ)–log( ε ˙ ) plot, where m = dln ( H ) dln ( ε ˙ ) , activation volume V = 3 3 (   k B ) T m H , H is the indentation hardness at temperature T, and kB is the Boltzmann constant. Assuming the tip radius of the Berkovich indenter is 25 nm, which remains constant for all experiments, τ m a x was estimated as τ m a x = 0.47 P R h . By considering Δ G , αo, kB, T, and kf,o to be constant, the γ ˙   γ ˙ 0   ratio was estimated to be 1, 0.93, 0.30, 0.71, and 0.61, for CR0, CR4.5, CR10, CR20, and CR31, respectively. The variation of γ ˙ indicates a change in the flow defect concentration, which will either increase or decrease the free volume content in order to accommodate the applied strain into the glassy phase. The application of shear stress during cold rolling alters PEL by reducing or eliminating the barrier to a neighboring/different metastable state [33]. Hence, the evolved γ ˙ in the CR specimens largely differs from that of as-cast BMG, further confirming the modification of the SRO cluster upon cold rolling.
As insignificant variation of H and E values with cold rolling percentage was noticed at the central core of the specimens on the NW plane, Spaepen’s free volume model was adopted to understand the observed behavior for the NR and RW planes. According to Spaepen’s model, the rate of free volume accumulation and annihilation can be estimated using the following equation [11].
( d x d t ) + = f γ e x p ( Δ G m k T ) e x p ( 1 x ) [ c o s h ( τ Ω 2 k T ) 1 ] 2 k T x S v *
( d x d t ) = f x 2 [ e x p ( 1 x ) e x p ( 1 x e q ) ] e x p ( Δ G m σ m V k T )
where S = 2 μ ( 1 + ϑ ) 3 ( 1 ϑ ) , µ is shear modulus, ϑ is Poisson’s ratio, Δ G is the activation energy, f is an attempt frequency, k is Boltzmann’s constant, Ω is atomic volume, v * is critical volume, γ is the geometrical factor, and the mean stress σ m = 0 during rolling operation. The values of the above parameters are T = 300 K, γ = 0.15, f = 5.415 × 10¹² s−1, Ω = 2.424 × 10⁻²⁹, µ = 35.3 GPa, v* = 1.67 × 10⁻²⁹m3, Δ G m = 10−19 J, and ϑ  = 0.37 [48]. The values of activation volume (V) and free volume (x and xeq) were obtained from the nanoindentation and DSC studies, respectively. Equation (8) indicates that the free volume accumulation depends on the applied shear stress, whereas Equation (9) indicates that free volume annihilation is linked with the diffusional atomic movement, which is further accelerated by the applied stress. Our calculation suggests that the free volume accumulation rate is 2.29 × 10⁻¹⁹ (CR0), 6.74 × 10⁻²⁰ (CR4.5), 4.15 × 10⁻⁶ (CR10), 2.20 × 10⁻¹⁴ (CR20), and 6.42 × 10⁻²⁰ (CR31). On the other hand, the free volume annihilation rates in CR0, CR4.5, CR10, CR20, and CR31 were estimated to be 5.09 × 10⁻²⁰, 1.80 × 10⁻¹⁵, 5.56 × 10⁻²⁰, 1.888 × 10⁻¹⁸, and 2.98 × 10⁻¹⁹, respectively. Plastic deformation in BMGs occurs inhomogeneously by forming shear bands at temperature <Tg and the coalescence of the free volume occurs gradually; therefore, the BMGs exhibit a dynamic response during nanoindentation.
Usually, the microhardness of BMGs decreases with prior deformation, as observed in Pd-base, Zr-base, and Cu-base glassy alloys [12,21,33,49]. Several authors have also reported an increase in hardness in BMGs upon deformation [13,28,29,30,31,32,34]. Furthermore, the increase of the yield strength of Vitreloy 1 upon cold rolling or laser shock peening was reported by Lee et al. and Cao et al., respectively [30,34,50]. The rise and fall of average free volume content with increasing cold rolling percentage were linked to the competition between the average free volume annihilation rate and creation rate, as studied using positron annihilation spectroscopy and DSC studies [33,35]. Furthermore, Pan and co-workers have proved that work hardening occurred as a result of densification in tensile pre-strained Zr-based BMGs using micro and nanoindentation, when free volume annihilation rate dominated the free creation rate [31,51].
Equations (5) and (6) indicate that the viscosity and indentation hardness decrease with the increase of free volume content. Turnbull and Cohen suggested that the excess free volume in MGs decreases the atomic bonding energy by increasing the average interatomic distances [52]. As the value of E is linked to the atomic bond strength, the increase of the E in CR4.5 and CR31 points to an increase of the bond strength compared with that of CR0. Meanwhile, the decrease of E in CR10 and CR20 points to a decrease in the bond strength compared with that of CR0 [53,54]. Thus, short range ordered (SRO) clusters in the glassy phase must have been modified into a newer atomic configuration metastable state upon cold rolling in the PEL model, as proposed by us [33]. In the case of CR10 and CR20, the decreas of the hardness is linked to a higher free volume content, as reported earlier [12,21,49]. Hence, the synergetic effect of free volume accumulation and annihilation during cold rolling is responsible for producing a relaxed glassy structure in CR4.5 and CR31 and a dilated glassy structure in CR10 and CR20, which eventually resulted in enhanced hardness or reduced hardness in those specimens, respectively. Figure 11a illustrates the schematic of the atomic cluster in an as-cast glassy phase, which is modified as a result of the alteration of the free volume content and subsequent dilation or densification at the later stage of cold rolling, as shown in Figure 11b,c, respectively. The relaxed glassy phase in CR4.5 and CR31 exhibited densification-induced hardening during nanoindentation. However, such deformation-induced densification was also reported earlier in the case of silicate and polymeric glasses [55,56,57]. Cold rolling induced structural relaxation, accompanied by reduced free volume content, as reported by us earlier [34]. Thus, the free volume accumulation and annihilation play crucial roles during cold rolling in Vitreloy 1.

5. Conclusions

The following conclusions were drawn from the present study:
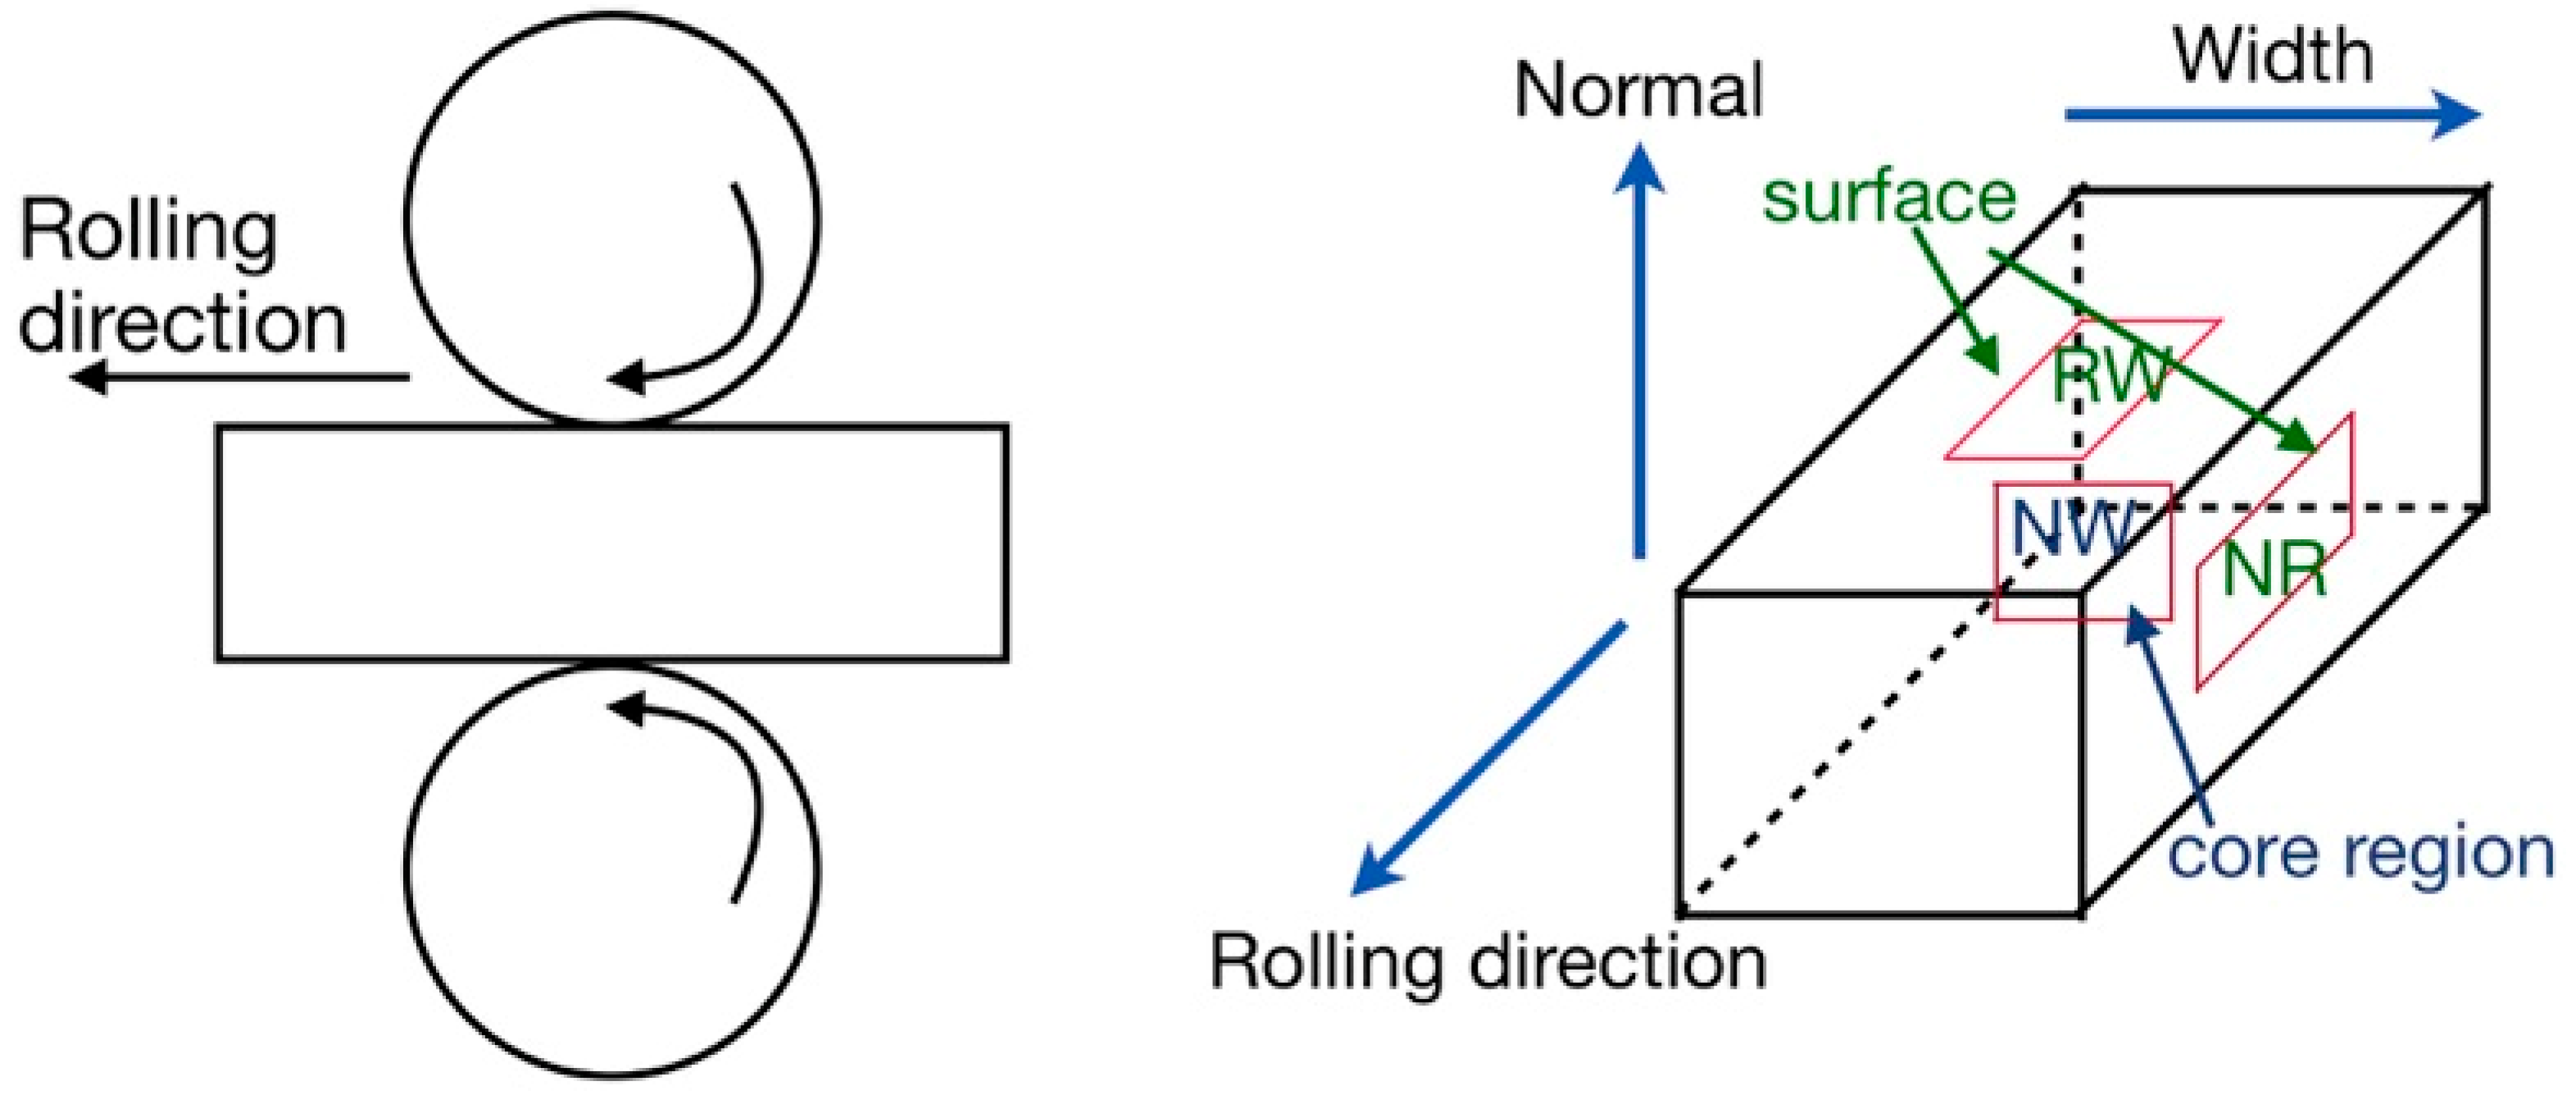
  • The hardness at the specimen surface varied with cold rolling percentage (%) and the variation is similar on the RW and NR planes at all different peak loads in the range of 50 mN–500 mN, whereas the same is insignificant for the core region of the specimen on the NW plane. H and E values increase in CR4.5 and CR31, whereas CR10 and CR20 become softer than CR0 upon cold rolling on the RW and NR planes.
  • 3D optical surface profilometry studies on the NR plane suggest that the shear band spacing decreases from 57.7 μm (CR4.5) to 24.6 μm (CR31), and the shear band offset height increases from 2.4 μm (CR4.5) to 4.4 μm (CR31) with the increase in the extent of cold rolling. Meanwhile, the number of pop-in events during nanoindentation for all the planes reduces with the increase in the extent of cold rolling, and the disappearance of shear bands around indentation impression points to more homogeneous deformation in cold rolled BMGs.
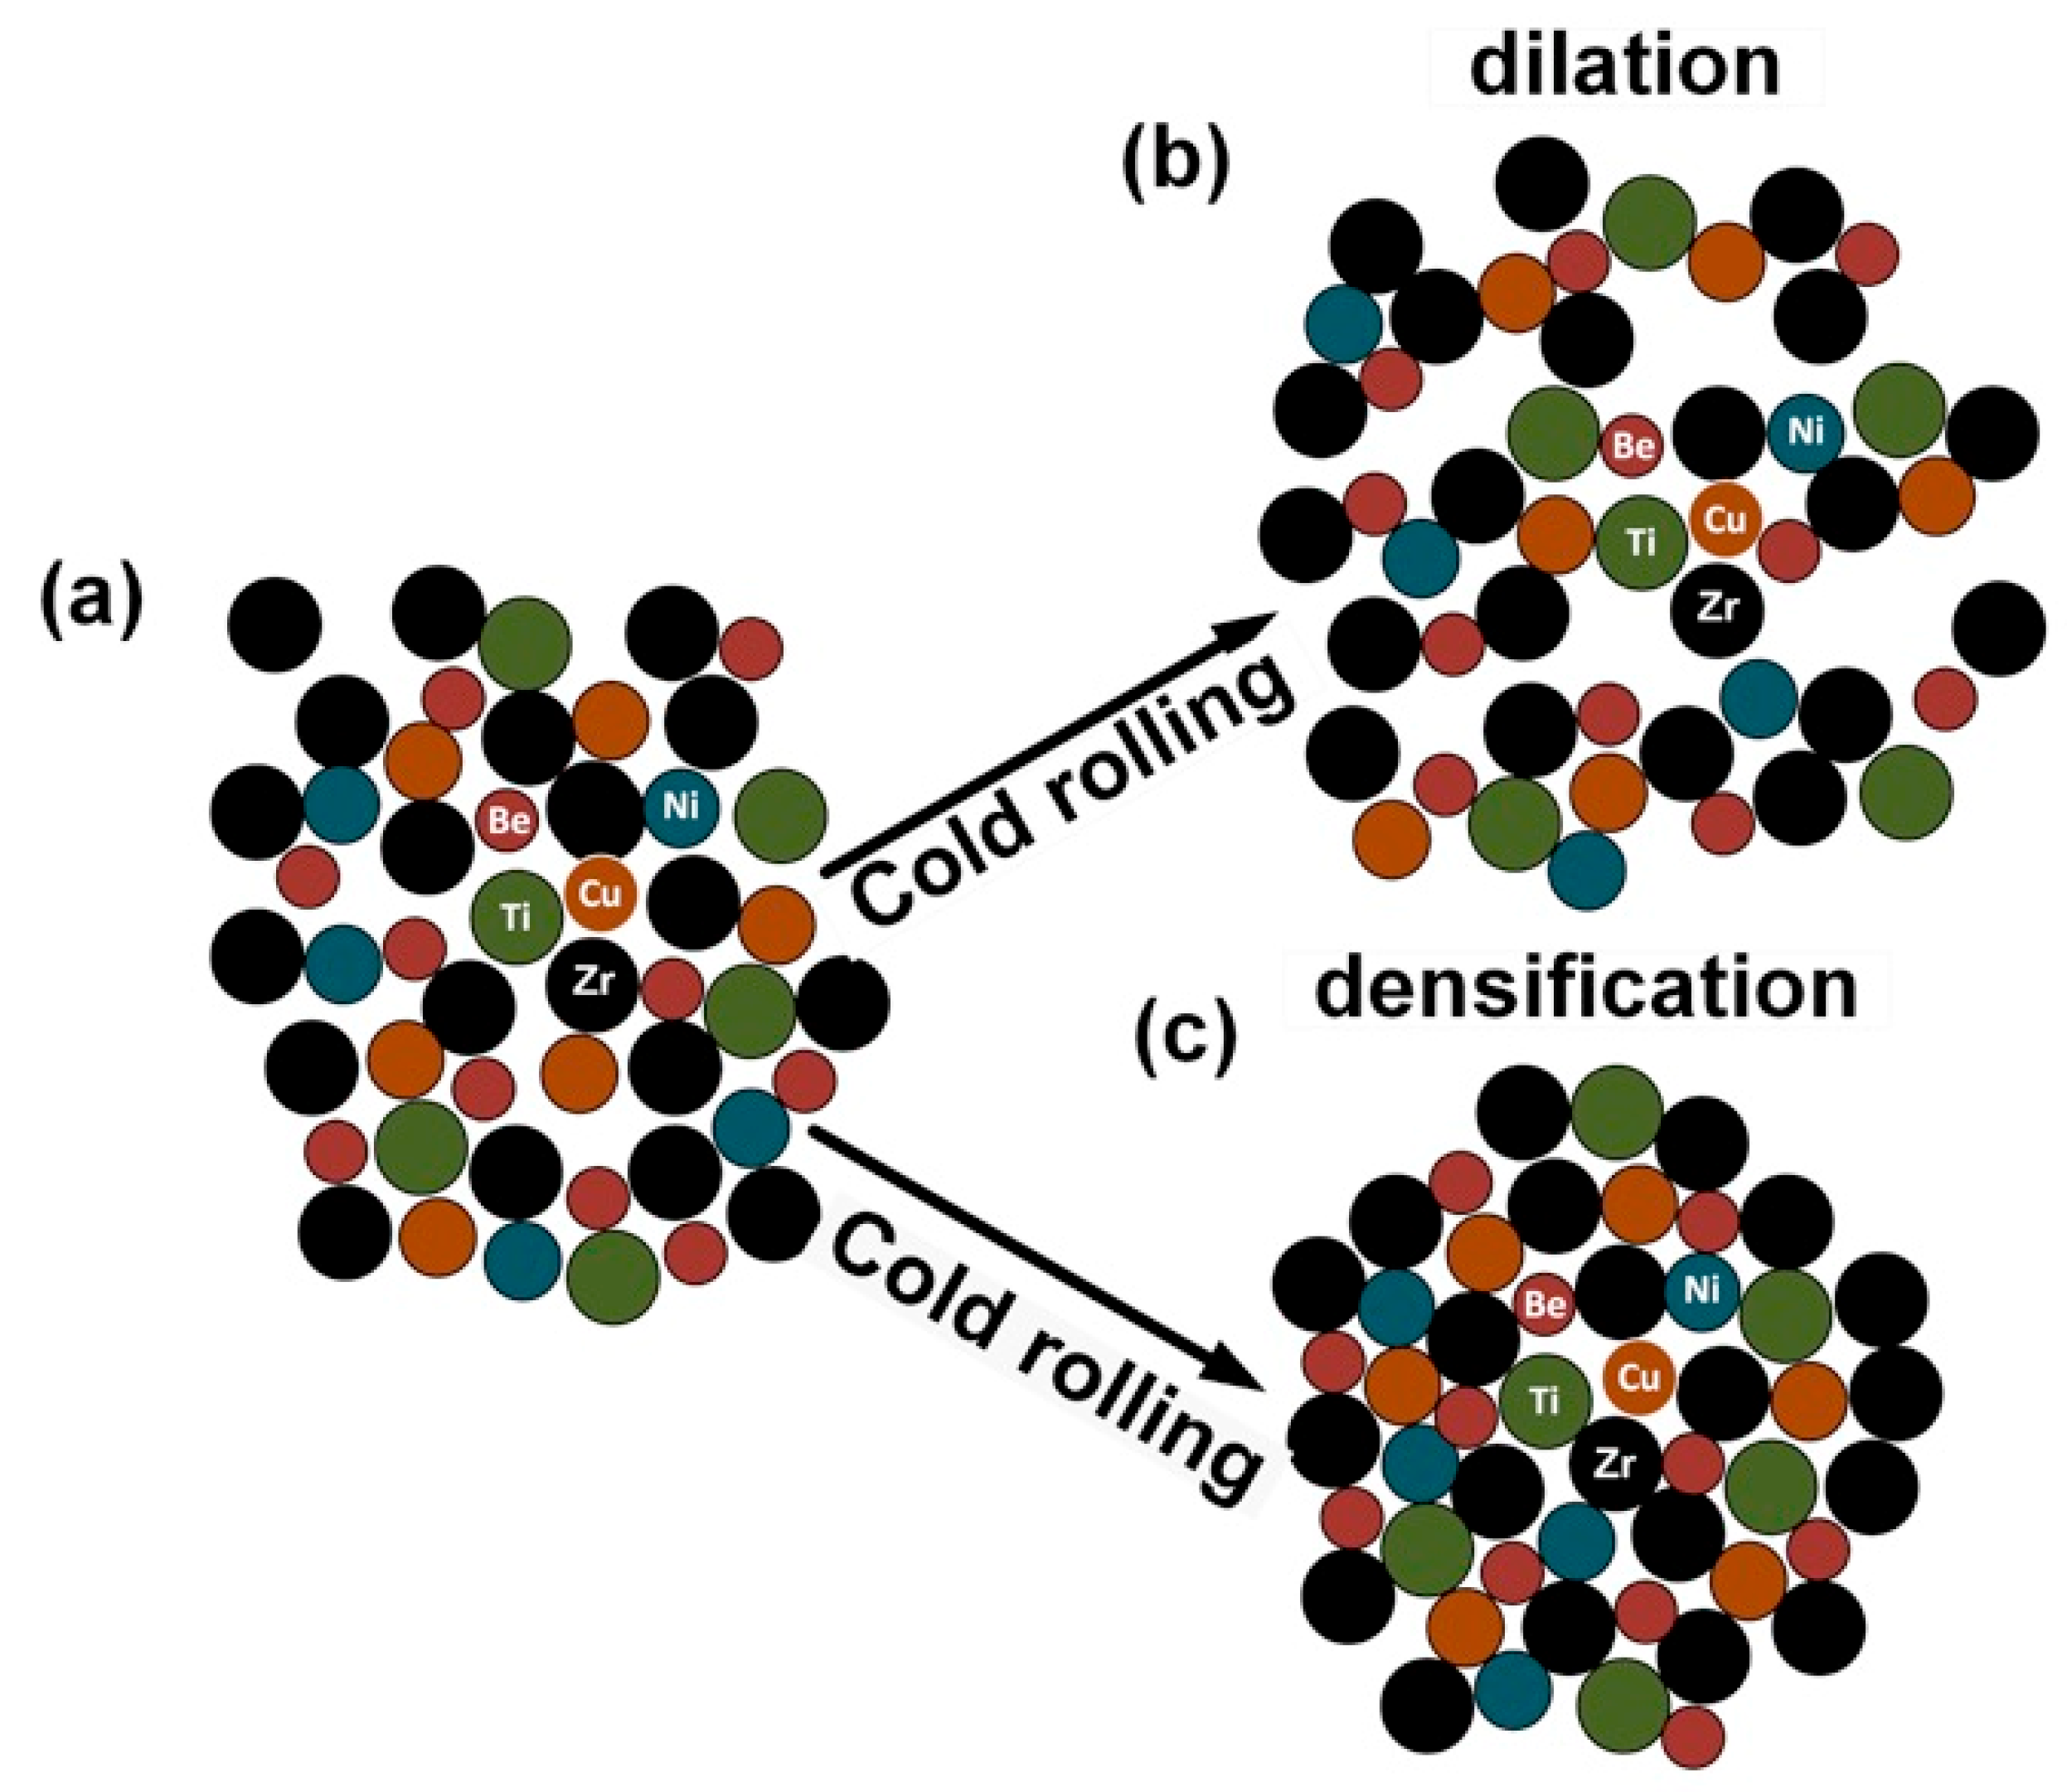
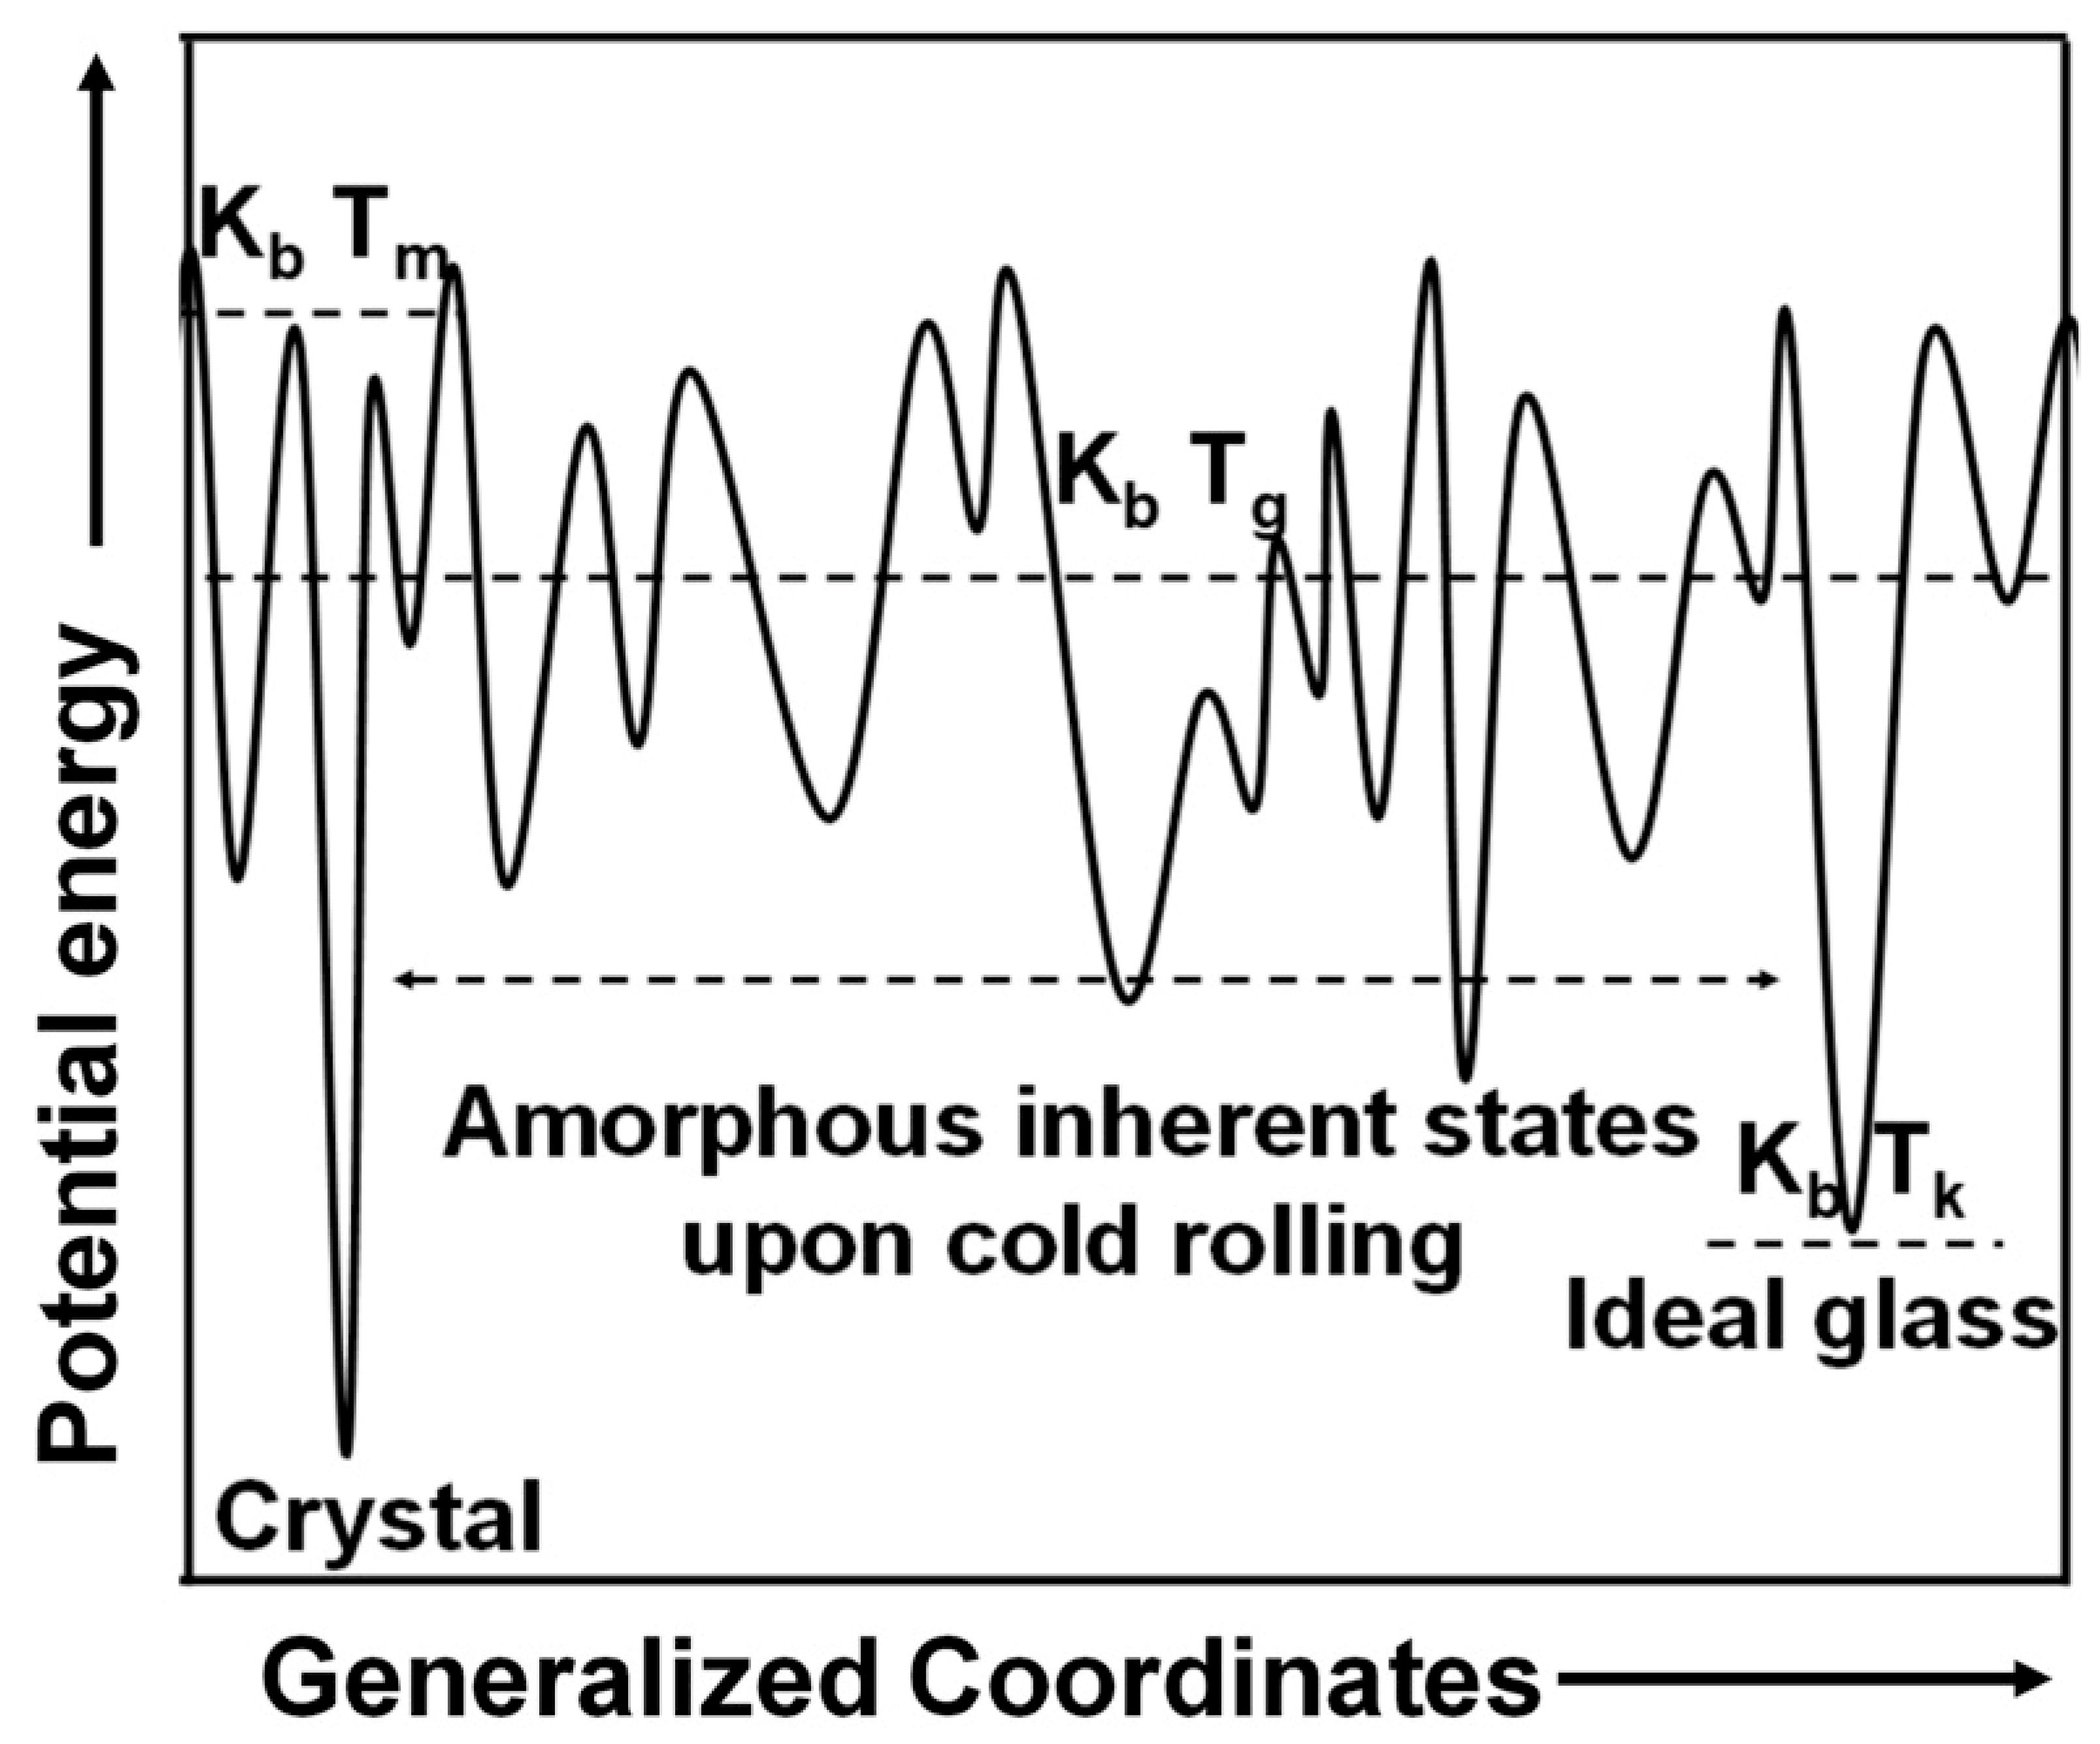
  • The nanoindentation, DSC studies, and model calculations suggest that the annihilation rate dominated over the free volume creation rate, which produce a relaxed and dense glassy structure in CR4.5 and CR31, exhibiting enhanced H and E.

Supplementary Materials

The following are available online at https://www.mdpi.com/article/10.3390/nano11071670/s1, Figure S1: P-h plots at Pmax = 200 mN along along NR, RW and NW; Figure S2: P-h plots at Pmax = 100 mN along along NR, RW and NW; Figure S3: P-h plots at Pmax = 50 mN along NR, RW and NW.

Author Contributions

Conceptualization, A.G. and J.D.; validation, A.G. and P.P.J.; formal analysis, A.G.; investigation, A.G. and P.P.J.; data curation, A.G. and P.P.J.; writing—original draft preparation, A.G.; writing—review and editing, M.-H.L. and J.D.; supervision, J.D.; project administration, J.D.; funding acquisition, M.-H.L. and J.D. All authors have read and agreed to the published version of the manuscript.

Funding

This research was funded by SRIC IIT Kharagpur, grant number SGIRG and the APC was funded by Korea Institute of Industrial Technology (KITECH), grant number PJE21030.

Data Availability Statement

The data presented in this study are available in this article.

Acknowledgments

The authors thank Central Research Facility at IIT Kharagpur for providing experimental facilities.

Conflicts of Interest

The authors declare no conflict of interest. The funders had no role in the design of the study; in the collection, analyses, or interpretation of data; in the writing of the manuscript, or in the decision to publish the results.

References

  1. Suryanarayana, C.; Inoue, A. Bulk Metallic Glasses; CRC Press: New York, NY, USA, 2011. [Google Scholar]
  2. Kumar, G.; Neibecker, P.; Liu, Y.H.; Schroers, J. Critical fictive temperature for plasticity in metallic glasses. Nat. Commun. 2013, 4, 1536. [Google Scholar] [CrossRef] [PubMed] [Green Version]
  3. Egami, T. Formation and deformation of metallic glasses: Atomistic theory. Intermetallics 2006, 14, 882–887. [Google Scholar] [CrossRef]
  4. Sinning, H.R.; Leonardsson, L.; Cahn, R.W. Irreversible anisotropic length changes in fe40ni40b20 and a search for reversible length changes in several metallic glasses. Int. J. Rapid Solidif. 1985, 1, 175–197. [Google Scholar]
  5. Poulsen, H.F.; Wert, J.A.; Neuefeind, J.; Aki, V.H.; Daymond, M. Measuring strain distributions in amorphous materials. Nat. Mater. 2004, 4, 33–36. [Google Scholar] [CrossRef]
  6. Ott, R.T.; Kramer, M.J.; Besser, M.F.; Sordelet, D.J. High-energy X-ray measurements of structural anisotropy and excess free volume in a homogenously deformed Zr-based metallic glass. Acta Mater. 2006, 54, 2463–2471. [Google Scholar] [CrossRef]
  7. Dmowski, W.; Tong, Y.; Iwashita, T.; Yokoyama, Y.; Egami, T. Universal mechanism of thermomechanical deformation in metallic glasses. Phys. Rev. B 2015, 91, 60101. [Google Scholar] [CrossRef] [Green Version]
  8. Shahabi, H.S.; Scudino, S.; Kaban, I.; Stoica, M.; Rütt, U.; Kühn, U.; Eckert, J. Structural aspects of elasto-plastic deformation of a Zr-based bulk metallic glass under uniaxial compression. Acta Mater. 2015, 95, 30–36. [Google Scholar] [CrossRef]
  9. Revesz, A.; Schafler, E.; Kovacs, Z. Structural anisotropy in a Zr57Ti5Cu20Al10Ni8 bulk metallic glass deformed by high pressure torsion at room temperature. Appl. Phys. Lett. 2008, 92, 011910. [Google Scholar] [CrossRef]
  10. Dmowski, W.; Egami, T. Structural anisotropy in metallic glasses induced by mechanical deformation. Adv. Eng. Mater. 2008, 10, 1003–1007. [Google Scholar] [CrossRef]
  11. Spaepen, F. A microscopic mechanism for steady state inhomogeneous flow in metallic glasses. Acta Metall. 1977, 25, 407–415. [Google Scholar] [CrossRef]
  12. Heggen, M.; Spaepen, F.; Feuerbacher, M. Creation and annihilation of free volume during homogeneous flow of a metallic glass. J. Appl. Phys. 2005, 97, 1–8. [Google Scholar] [CrossRef] [Green Version]
  13. Schuh, C.A.; Hufnagel, T.C.; Ramamurty, U. Mechanical behavior of amorphous alloys. Acta Mater. 2007, 55, 4067–4109. [Google Scholar] [CrossRef]
  14. Argon, A.S. Plastic deformation in metallic glasses. Acta Metall. 1979, 27, 47–58. [Google Scholar] [CrossRef]
  15. Steif, P.S.; Spaepen, F.; Hutchinson, J.W. Strain localization in amorphous metals. Acta Metall. 1982, 30, 447–455. [Google Scholar] [CrossRef]
  16. van den Beukel, A.; Sietsma, J. The glass transition as a free volume related kinetic phenomenon. Acta Metall. Mater. 1990, 38, 383–389. [Google Scholar] [CrossRef]
  17. Schuh, C.A.; Lund, A.C. Atomistic basis for the plastic yield criterion of metallic glass. Nat. Mater. 2003, 2, 449–452. [Google Scholar] [CrossRef] [PubMed]
  18. Furukawa, A.; Tanaka, H. Inhomogeneous flow and fracture of glassy materials. Nat. Mater. 2009, 8, 601–609. [Google Scholar] [CrossRef]
  19. Spaepen, F. Must shear bands be hot? Nat. Mater. 2006, 8, 601–609. [Google Scholar] [CrossRef]
  20. de Hey, P.; Sietsma, J.; van den Beukel, A. Structural Disordering In Amorphous Pd40Ni40P20 Induced By High Temperature Deformation. Acta Mater. 1998, 46, 5873–5882. [Google Scholar] [CrossRef]
  21. Bei, H.; Xie, S.; George, E.P. Softening caused by profuse shear banding in a bulk metallic glass. Phys. Rev. Lett. 2006, 96, 105503. [Google Scholar] [CrossRef]
  22. Pan, J.; Chen, Q.; Liu, L.; Li, Y. Softening and dilatation in a single shear band. Acta Mater. 2011, 59, 5146–5158. [Google Scholar] [CrossRef]
  23. Jian, W.R.; Wang, L.; Yao, X.H.; Luo, S.N. Tensile and nanoindentation deformation of amorphous/crystalline nanolaminates: Effects of layer thickness and interface type. Comput. Mater. Sci. 2018, 154, 225–233. [Google Scholar] [CrossRef]
  24. Jian, W.R.; Wang, L.; Li, B.; Yao, X.H.; Luo, S.N. Improved ductility of Cu64Zr36 metallic glass/Cu nanocomposites via phase and grain boundaries. Nanotechnology 2016, 27, 175701. [Google Scholar] [CrossRef] [PubMed]
  25. Deng, C.; Schuh, C.A. Atomistic mechanisms of cyclic hardening in metallic glass. Appl. Phys. Lett. 2012, 100, 251909. [Google Scholar] [CrossRef]
  26. Zhao, D.; Zhu, B.; Wang, S.; Niu, Y.; Xu, L.; Zhao, H. Effects of pre-strain on the nanoindentation behaviors of metallic glass studied by molecular dynamics simulations. Comput. Mater. Sci. 2021, 186, 110073. [Google Scholar] [CrossRef]
  27. Das, J.; Tang, M.B.; Kim, K.B.; Theissmann, R.; Baier, F.; Wang, W.H.; Eckert, J. “Work-Hardenable” Ductile Bulk Metallic Glass. Phys. Rev. Lett. 2005, 94, 205501. [Google Scholar] [CrossRef] [Green Version]
  28. Kim, K.B.; Das, J.; Venkataraman, S.; Yi, S.; Eckert, J. Work hardening ability of ductile Ti45Cu40Ni7.5Zr5Sn2.5 and Cu47.5Zr47.5Al5 bulk metallic glasses. Appl. Phys. Lett. 2006, 89, 071908. [Google Scholar] [CrossRef]
  29. Lee, M.H.; Lee, K.S.; Das, J.; Thomas, J.; Kühn, U.; Eckert, J. Improved plasticity of bulk metallic glasses upon cold rolling. Scr. Mater. 2010, 62, 678–681. [Google Scholar] [CrossRef]
  30. Packard, C.E.; Witmer, L.M.; Schuh, C.A. Hardening of a metallic glass during cyclic loading in the elastic range. Appl. Phys. Lett. 2008, 92, 171911. [Google Scholar] [CrossRef] [Green Version]
  31. Wang, Z.T.; Pan, J.; Li, Y.; Schuh, C.A. Densification and strain hardening of a metallic glass under tension at room temperature. Phys. Rev. Lett. 2013, 111, 135504. [Google Scholar] [CrossRef]
  32. Oliver, W.C.; Pharr, G.M. An improved technique for determining hardness and elastic modulus using load and displacement sensing indentation experiments. J. Mater. Res. 1992, 7, 1564–1583. [Google Scholar] [CrossRef]
  33. Jana, P.P.; Gunti, A.; Das, J. Improvement of intrinsic plasticity and strength of Zr55Cu30Ni5Al10 metallic glass by tuning the glass transition temperature. Mater. Sci. Eng. A 2019, 762, 138102. [Google Scholar] [CrossRef]
  34. Slipenyuk, A.; Eckert, J. Correlation between enthalpy change and free volume reduction during structural relaxation of Zr55Cu30Al10Ni5metallic glass. Scr. Mater. 2004, 50, 39–44. [Google Scholar] [CrossRef]
  35. Flores, K.M.; Sherer, E.; Bharathula, A.; Chen, H.; Jean, Y.C. Sub-nanometer open volume regions in a bulk metallic glass investigated by positron annihilation. Acta Mater. 2007, 55, 3403–3411. [Google Scholar] [CrossRef]
  36. Launey, M.E.; Kruzic, J.J.; Li, C.; Busch, R. Quantification of free volume differences in a Zr44Ti11Ni10Cu10Be25 bulk amorphous alloy. Appl. Phys. Lett. 2007, 91, 051913. [Google Scholar] [CrossRef]
  37. Masuhr, A.; Busch, R.; Johnson, W.L. Thermodynamics and Kinetics of the Zr41.2Ti13.8 Cu10Ni12.5Be22.5 Bulk Metallic Glass Forming Liquid: Glass Formation from a Strong Liquid. J. Non Cryst. Solids. 1999, 250–252, 566–571. [Google Scholar] [CrossRef]
  38. Cao, Q.P.; Li, J.F.; Zhou, Y.H.; Jiang, J.Z. Microstructure and microhardness evolutions of Cu47.5Zr47.5Al5 bulk metallic glass processed by rolling. Scr. Mater. 2008, 59, 673–676. [Google Scholar] [CrossRef]
  39. Liu, J.W.; Cao, Q.P.; Chen, L.Y.; Wang, X.D.; Jiang, J.Z. Shear band evolution and hardness change in cold-rolled bulk metallic glasses. Acta Mater. 2010, 58, 4827–4840. [Google Scholar] [CrossRef]
  40. Maity, T.; Roy, B.; Das, J. Mechanism of lamellae deformation and phase rearrangement in ultrafine β-Ti/FeTi eutectic composites. Acta Mater. 2015, 97, 170–179. [Google Scholar] [CrossRef]
  41. Wei, Y.; Lei, X.; Huo, L.S.; Wang, W.H.; Greer, A.L. Towards more uniform deformation in metallic glasses: The role of Poisson’s ratio. Mater. Sci. Eng. A 2013, 560, 510–517. [Google Scholar] [CrossRef] [Green Version]
  42. Plummer, J.D.; Goodall, R.; Figueroa, I.A.; Todd, I. A study of mechanical homogeneity in as-cast bulk metallic glass by nanoindentation. J. Non Cryst. Solids. 2011, 357, 814–819. [Google Scholar] [CrossRef]
  43. Bolshakov, A.; Pharr, G.M. Influences of pileup on the measurement of mechanical properties by load and depth sensing indentation techniques. J. Mater. Res. 1998, 13, 1049–1058. [Google Scholar] [CrossRef]
  44. Tsui, T.Y.; Oliver, W.C.; Pharr, G.M. Influences of stress on the measurement of mechanical properties using nanoindentation: Part I. Experimental studies in an aluminum alloy. J. Mater. Res. 1996, 11, 752–759. [Google Scholar] [CrossRef]
  45. Bolshakov, A.; Oliver, W.C.; Pharr, G.M. Influences of stress on the measurement of mechanical properties using nanoindentation: Part II. Finite element simulations. J. Mater. Res. 1996, 11, 760–768. [Google Scholar] [CrossRef]
  46. Nemecek, J. (Ed.) Nanoindentation in Materials Science; BoD—Books on Demand: Rijeka, Croatia, 2012. [Google Scholar]
  47. Ebner, C.; Pauly, S.; Eckert, J.; Rentenberger, C. Effect of mechanically induced structural rejuvenation on the deformation behaviour of CuZr based bulk metallic glass. Mater. Sci. Eng. A 2020, 773, 138848. [Google Scholar] [CrossRef]
  48. Stachurski, Z.H. Fundamentals of Amorphous Solids: Structure and Properties; John Wiley-VCH: Verlag, Germany, 2014. [Google Scholar]
  49. Li, N.; Chen, Q.; Liu, L. Size dependent plasticity of a Zr-based bulk metallic glass during room temperature compression. J. Alloys Compd. 2010, 493, 142–147. [Google Scholar] [CrossRef]
  50. Cao, Y.; Xie, X.; Antonagalia, J.; Winiarski, B.; Wang, G.; Shin, Y.C.; Withers, P.J.; Dahmen, K.A.; Liaw, P.K. Laser shock peening on Zr-based bulk metallic glass and its effect on plasticity: Experiment and modelling. Sci. Rep. 2015, 5, 10789. [Google Scholar] [CrossRef] [Green Version]
  51. Pan, J.; Wang, Y.X.; Guo, Q.; Zhang, D.; Greer, A.L.; Li, Y. Extreme rejuvenation and softening in a bulk metallic glass. Nat. Commun. 2018, 9, 560–569. [Google Scholar] [CrossRef]
  52. Turnbull, D.; Cohen, M.H. On the free-volume model of the liquid-glass transition. J. Chem. Phys. 1970, 52, 3038–3041. [Google Scholar] [CrossRef]
  53. Yang, F.; Geng, K.; Liaw, P.K.; Fan, G.; Choo, H. Deformation in a Zr57Ti5Cu20Ni8Al10 bulk metallic glass during nanoindentation. Acta Mater. 2007, 55, 321–327. [Google Scholar] [CrossRef]
  54. Liu, L.; Chan, K.C. Plastic deformation of Zr-based bulk metallic glasses under nanoindentation. Mater. Lett. 2005, 59, 3090–3094. [Google Scholar] [CrossRef]
  55. Bridgman, P.W.; Simon, I. Effects of Very High Pressures on Glass. J. Appl. Phys. 1953, 24, 405–413. [Google Scholar] [CrossRef]
  56. Rouxel, T.; Ji, H.; Hammouda, T.; Moréac, A. Poisson’s ratio and the densification of glass under high pressure. Phys. Rev. Lett. 2008, 100, 225501. [Google Scholar] [CrossRef] [PubMed]
  57. Drozdov, A.D. Stress-induced densification of glassy polymers in the subyield region. J. Appl. Polym. Sci. 1999, 74, 1705–1718. [Google Scholar] [CrossRef]
Figure 1. Schematic illustration of cold rolling and regions of normal-rolling (NR), rolling-width (RW), and normal-width (NW) planes for nanoindentation measurements.
Nanomaterials 11 01670 g001
Figure 2. X-ray diffraction (XRD) patterns of CR0 and CR31 showing amorphous humps confirming the glassy nature of the samples.
Nanomaterials 11 01670 g002
Figure 3. Schematic illustration of load (p)–time (t) plot used in the nanoindentation experiments.
Nanomaterials 11 01670 g003
Figure 4. (a) Differential scanning calorimeter (DSC) plots of CR0, CR4.5, CR10, CR20, and CR31 showing the glass transition event followed by crystallization. (b) 3D optical profile showing the evolution of shear bands with step-like features on the surface of CR10.
Nanomaterials 11 01670 g004
Figure 5. Histogram plot showing the distribution of (a) shear band spacing and (b) shear band offset height in CR specimens.
Nanomaterials 11 01670 g005
Figure 6. P-h plots at Pmax = 500 mN for NR, RW, and NW planes: (a) CR0, (b) CR4.5, (c) CR10, (d) CR20, and (e) CR31; pop-in events are more pronounced in CR0, which gradually decreases with the increase of cold rolling percentage.
Nanomaterials 11 01670 g006
Figure 7. Hardness (H) and Young’s modulus (E) variation with cold rolling percentage in the NR, RW, and NW planes at Pmax of (a) 50 mN, (b) 100 mN, (c) 200 mN, and (d) 500 mN.
Nanomaterials 11 01670 g007
Figure 8. SEM secondary electron (SE) images showing nanoindentation marks in (a) CR0 along with evolved shear bands on the NR plane upon cold rolling in (b) CR10 and (c) CR31. The magnified image of indentation impression at Pmax = 500 mN showing shear bands in (d) CR0, (e) CR10, and (f) CR31.
Nanomaterials 11 01670 g008
Figure 9. The hf/hmax ratio with cold rolling percentage for the NR, RW, and NW planes at Pmax of 50 mN, 100 mN, 200 mN, and 500 mN.
Nanomaterials 11 01670 g009
Figure 10. Schematic potential energy landscape (PEL) model illustrating different metastable energy states in the glassy phase.
Nanomaterials 11 01670 g010
Figure 11. Schematic illustration of (a) the atomic arrangement in the glassy structure, (b) local dilation causing enhanced free volume content, as well as (c) densification during cold rolling.
Nanomaterials 11 01670 g011
Table 1. H and E values of the NR plane in CR0, CR4.5, CR10, CR20, and CR31 at different Pmax values in between 50 and 500 mN.
H (GPa) NRE (GPa) NR
PMax (mN)50 mN100 mN200 mN500 mN50 mN100 mN200 mN500 mN
CR018.9 ± 0.615.9 ± 0.112.6 ± 0.99.5 ± 0.1187 ± 5163 ± 3140 ± 1117 ± 1
CR4.531.0 ± 0.626.3 ± 2.019.6 ± 0.414.7 ± 0.9241 ± 4189 ± 4159 ± 2121 ± 1
CR1016.9 ± 0.813.9 ± 0.510.9 ± 0.59.0 ± 0.1169 ± 2144 ± 2122 ± 1102 ± 2
CR2018.0 ± 0.315.3 ± 0.412.2 ± 0.69.5 ± 0.1175 ± 3154 ± 1133 ± 2107 ± 2
CR3132.6 ± 1.627.3 ± 0.620.3 ± 0.916.4 ± 1.2291 ± 12248 ± 4204 ± 4167 ± 6
Table 2. H and E values of the RW plane in the as-cast and differently cold rolled samples at different maximum loads of 50 mN, 100 mN, 200 mN, and 500 mN.
H (GPa) RWE (GPa) RW
PMax (mN)50 mN100 mN200 mN500 mN50 mN100 mN200 mN500 mN
CR021.9 ± 0.216.7 ± 3.313.8 ± 0.19.6 ± 2204 ± 4153 ± 3135 ± 1.5109 ± 8
CR4.532.1 ± 3.320.5 ± 0.817.5 ± 2.111.8 ± 0.5244 ± 11175 ± 2153 ± 8110 ± 2
CR1016.5 ± 0.213.2 ± 0.39.9 ± 0.18.0 ± 0.2161 ± 2141 ± 3111 ± 190 ± 0.3
CR2020.3 ± 1.616.0 ± 1.813.6 ± 0.18.9 ± 0.6186 ± 5161 ± 6141 ± 1106 ± 3
CR3126.8 ± 3.021.7 ± 2.118.2 ± 1.313.9 ± 0.7246 ± 12181 ± 3158 ± 6112 ± 1
Table 3. H and E values of the NW plane in CR0, CR4.5, CR10, CR20, and CR31 at various Pmax values in between 50 and 500 mN.
H (GPa) NWE (GPa) NW
PMax (mN)50 mN100 mN200 mN500 mN50 mN100 mN200 mN500 mN
CR07.9 ± 0.37.4 ± 0.36.8 ± 0.15.9 ± 0.2104 ± 297 ± 287 ± 173 ± 1
CR4.57.6 ± 0.76.8 ± 0.16.2 ± 0.25.7 ± 0.1100 ± 490 ± 0.274 ± 258 ± 0.4
CR107.9 ± 0.37.1 ± 0.46.2 ± 0.15.5 ± 0.1111 ± 2108 ± 3102 ± 294 ± 2
CR208.4 ± 0.57.7 ± 0.56.9 ± 0.36.3 ± 0.3109 ± 396 ± 282 ± 268 ± 2
CR317.9 ± 0.36.9 ± 0.36.3 ± 0.35.5 ± 0.194 ± 384 ± 274 ± 157 ± 0.5
Table 4. The affected deformed volume in CR specimens during nanoindentation on the NR, RW, and NW planes at different Pmax.
Affected Volume (µm)3
NRRWNW
Pmax (mN)501002005005010020050050100200500
CR00.631.031.833.630.530.931.733.331.231.832.634.33
CR4.50.430.831.332.630.430.831.433.131.231.732.634.43
CR100.631.132.033.630.631.232.133.831.231.832.734.53
CR200.631.131.833.530.531.031.733.731.231.832.734.23
CR310.430.731.332.630.430.831.432.831.331.832.634.33
Publisher’s Note: MDPI stays neutral with regard to jurisdictional claims in published maps and institutional affiliations.

