
Hierarchical Nanocauliflower Chemical Assembly Composed of Copper Oxide and Single-Walled Carbon Nanotubes for Enhanced Photocatalytic Dye Degradation

 ,
,  , ,
, ,
Abstract
1. Introduction
2. Materials and Methods
2.1. Chemicals
2.2. Design and Construction of CuOSC Nanocomposites
2.3. Characterization
2.4. Preparation of Pure CuO Nanocrystals
2.5. Photocatalytic Experiments
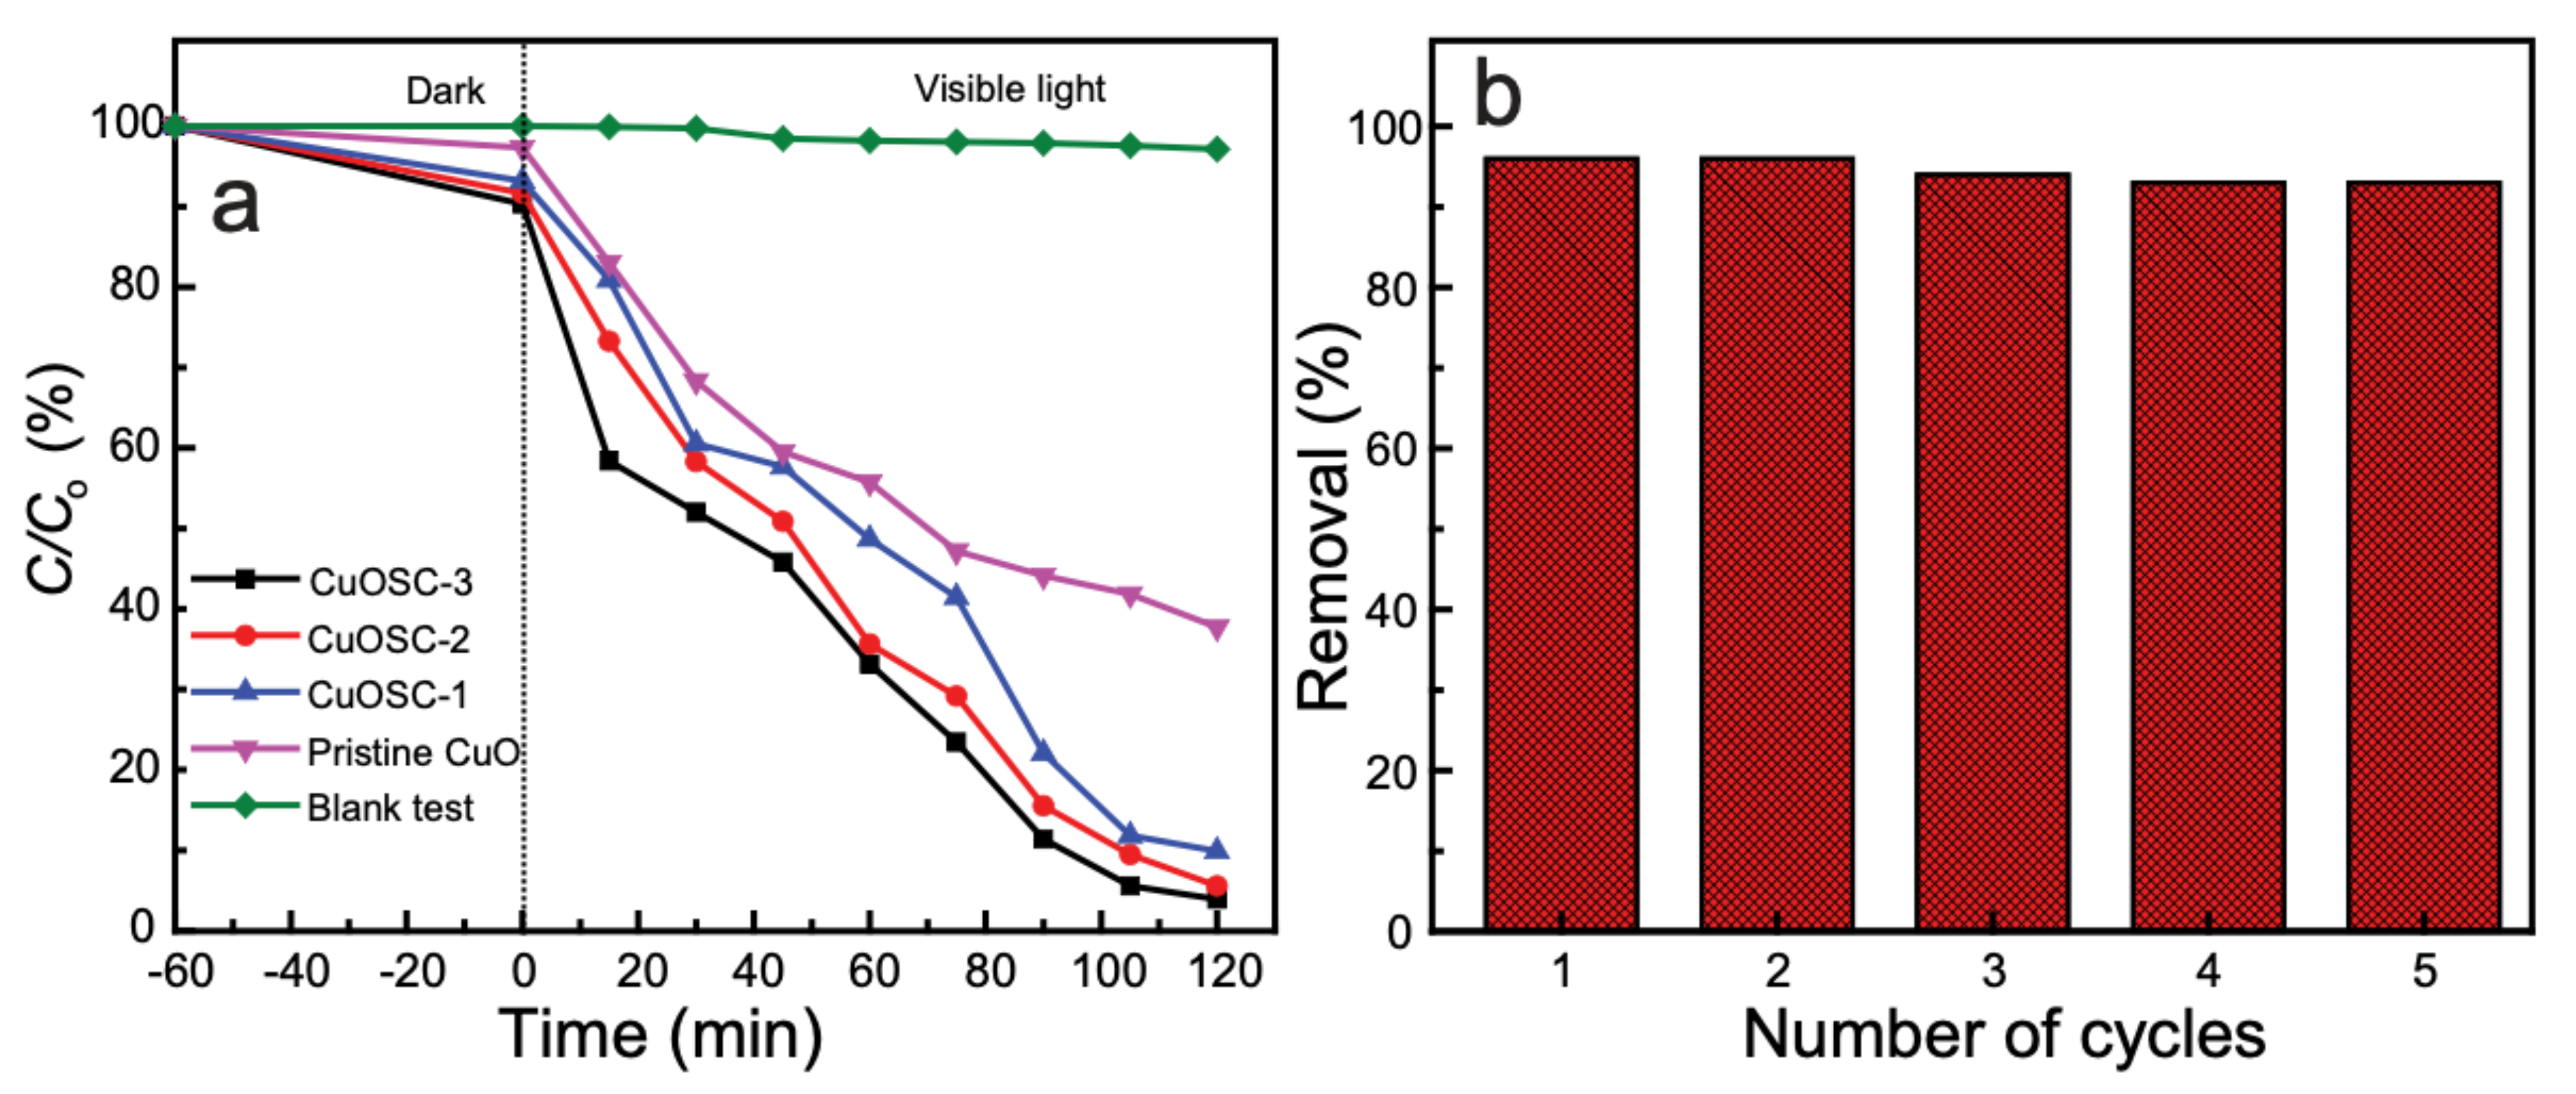
2.6. Evaluation of Recycling Effectiveness
2.7. Determination of Point of Zero Charge and pH Effect Studies
2.8. Charge Carriers Trapping Experiments
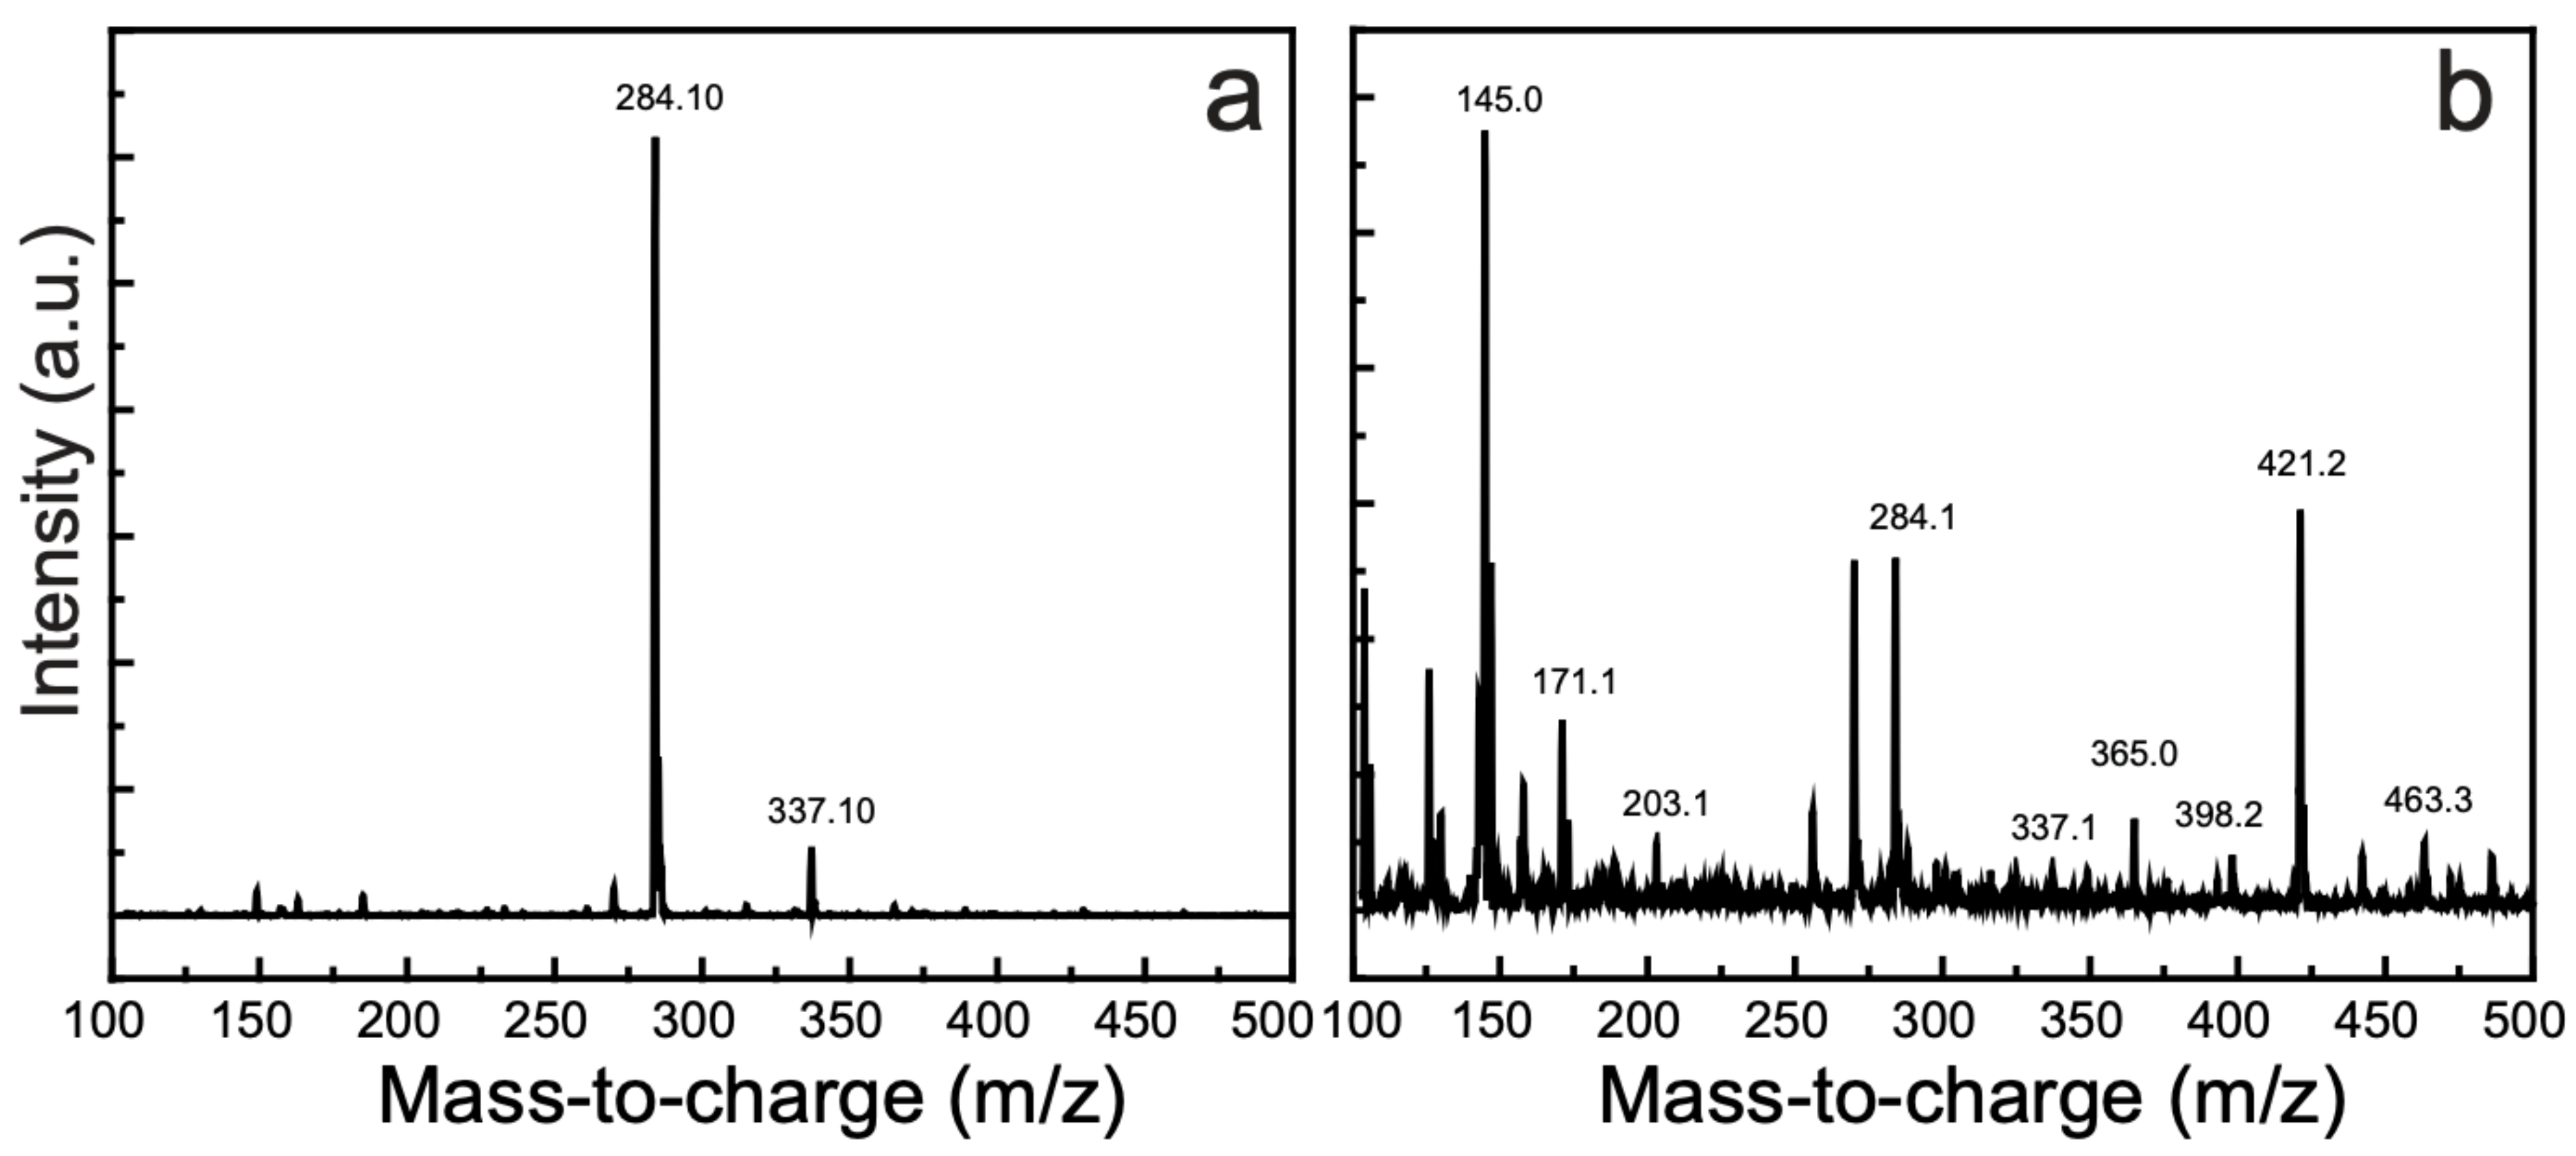
2.9. Liquid Chromatography–Mass Spectrometry (LC–MS) Analysis
3. Results and Discussion
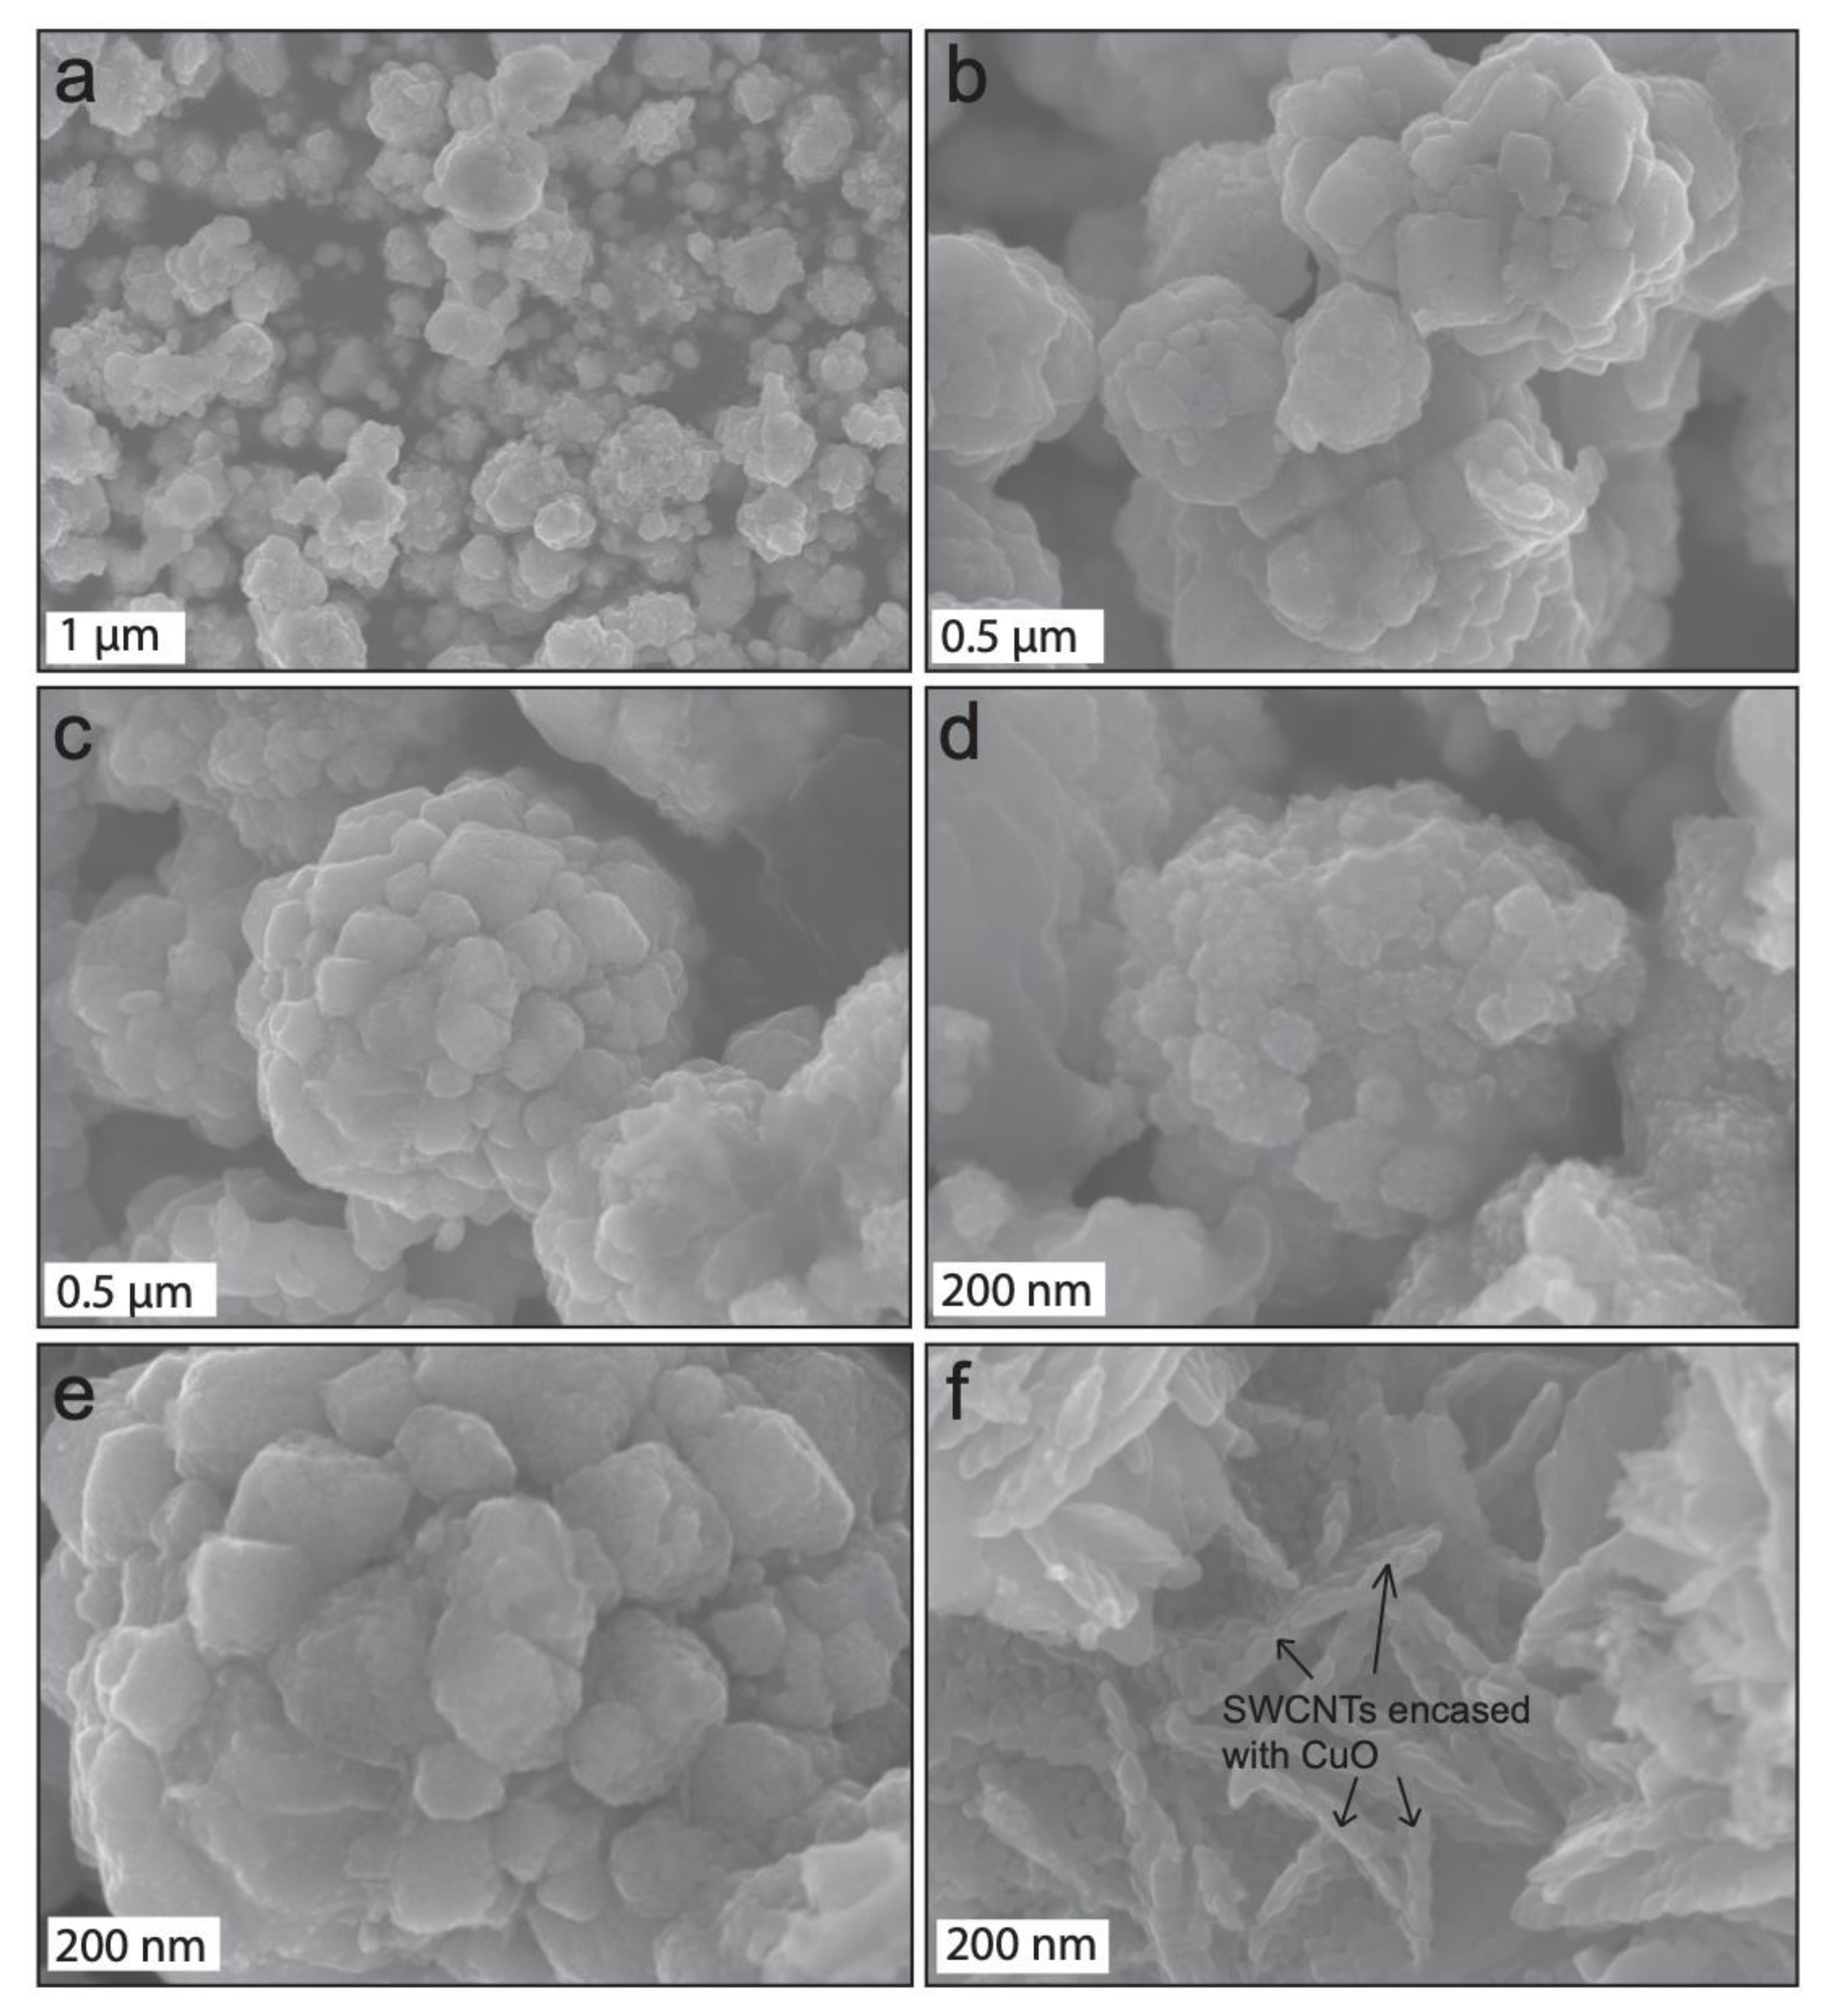
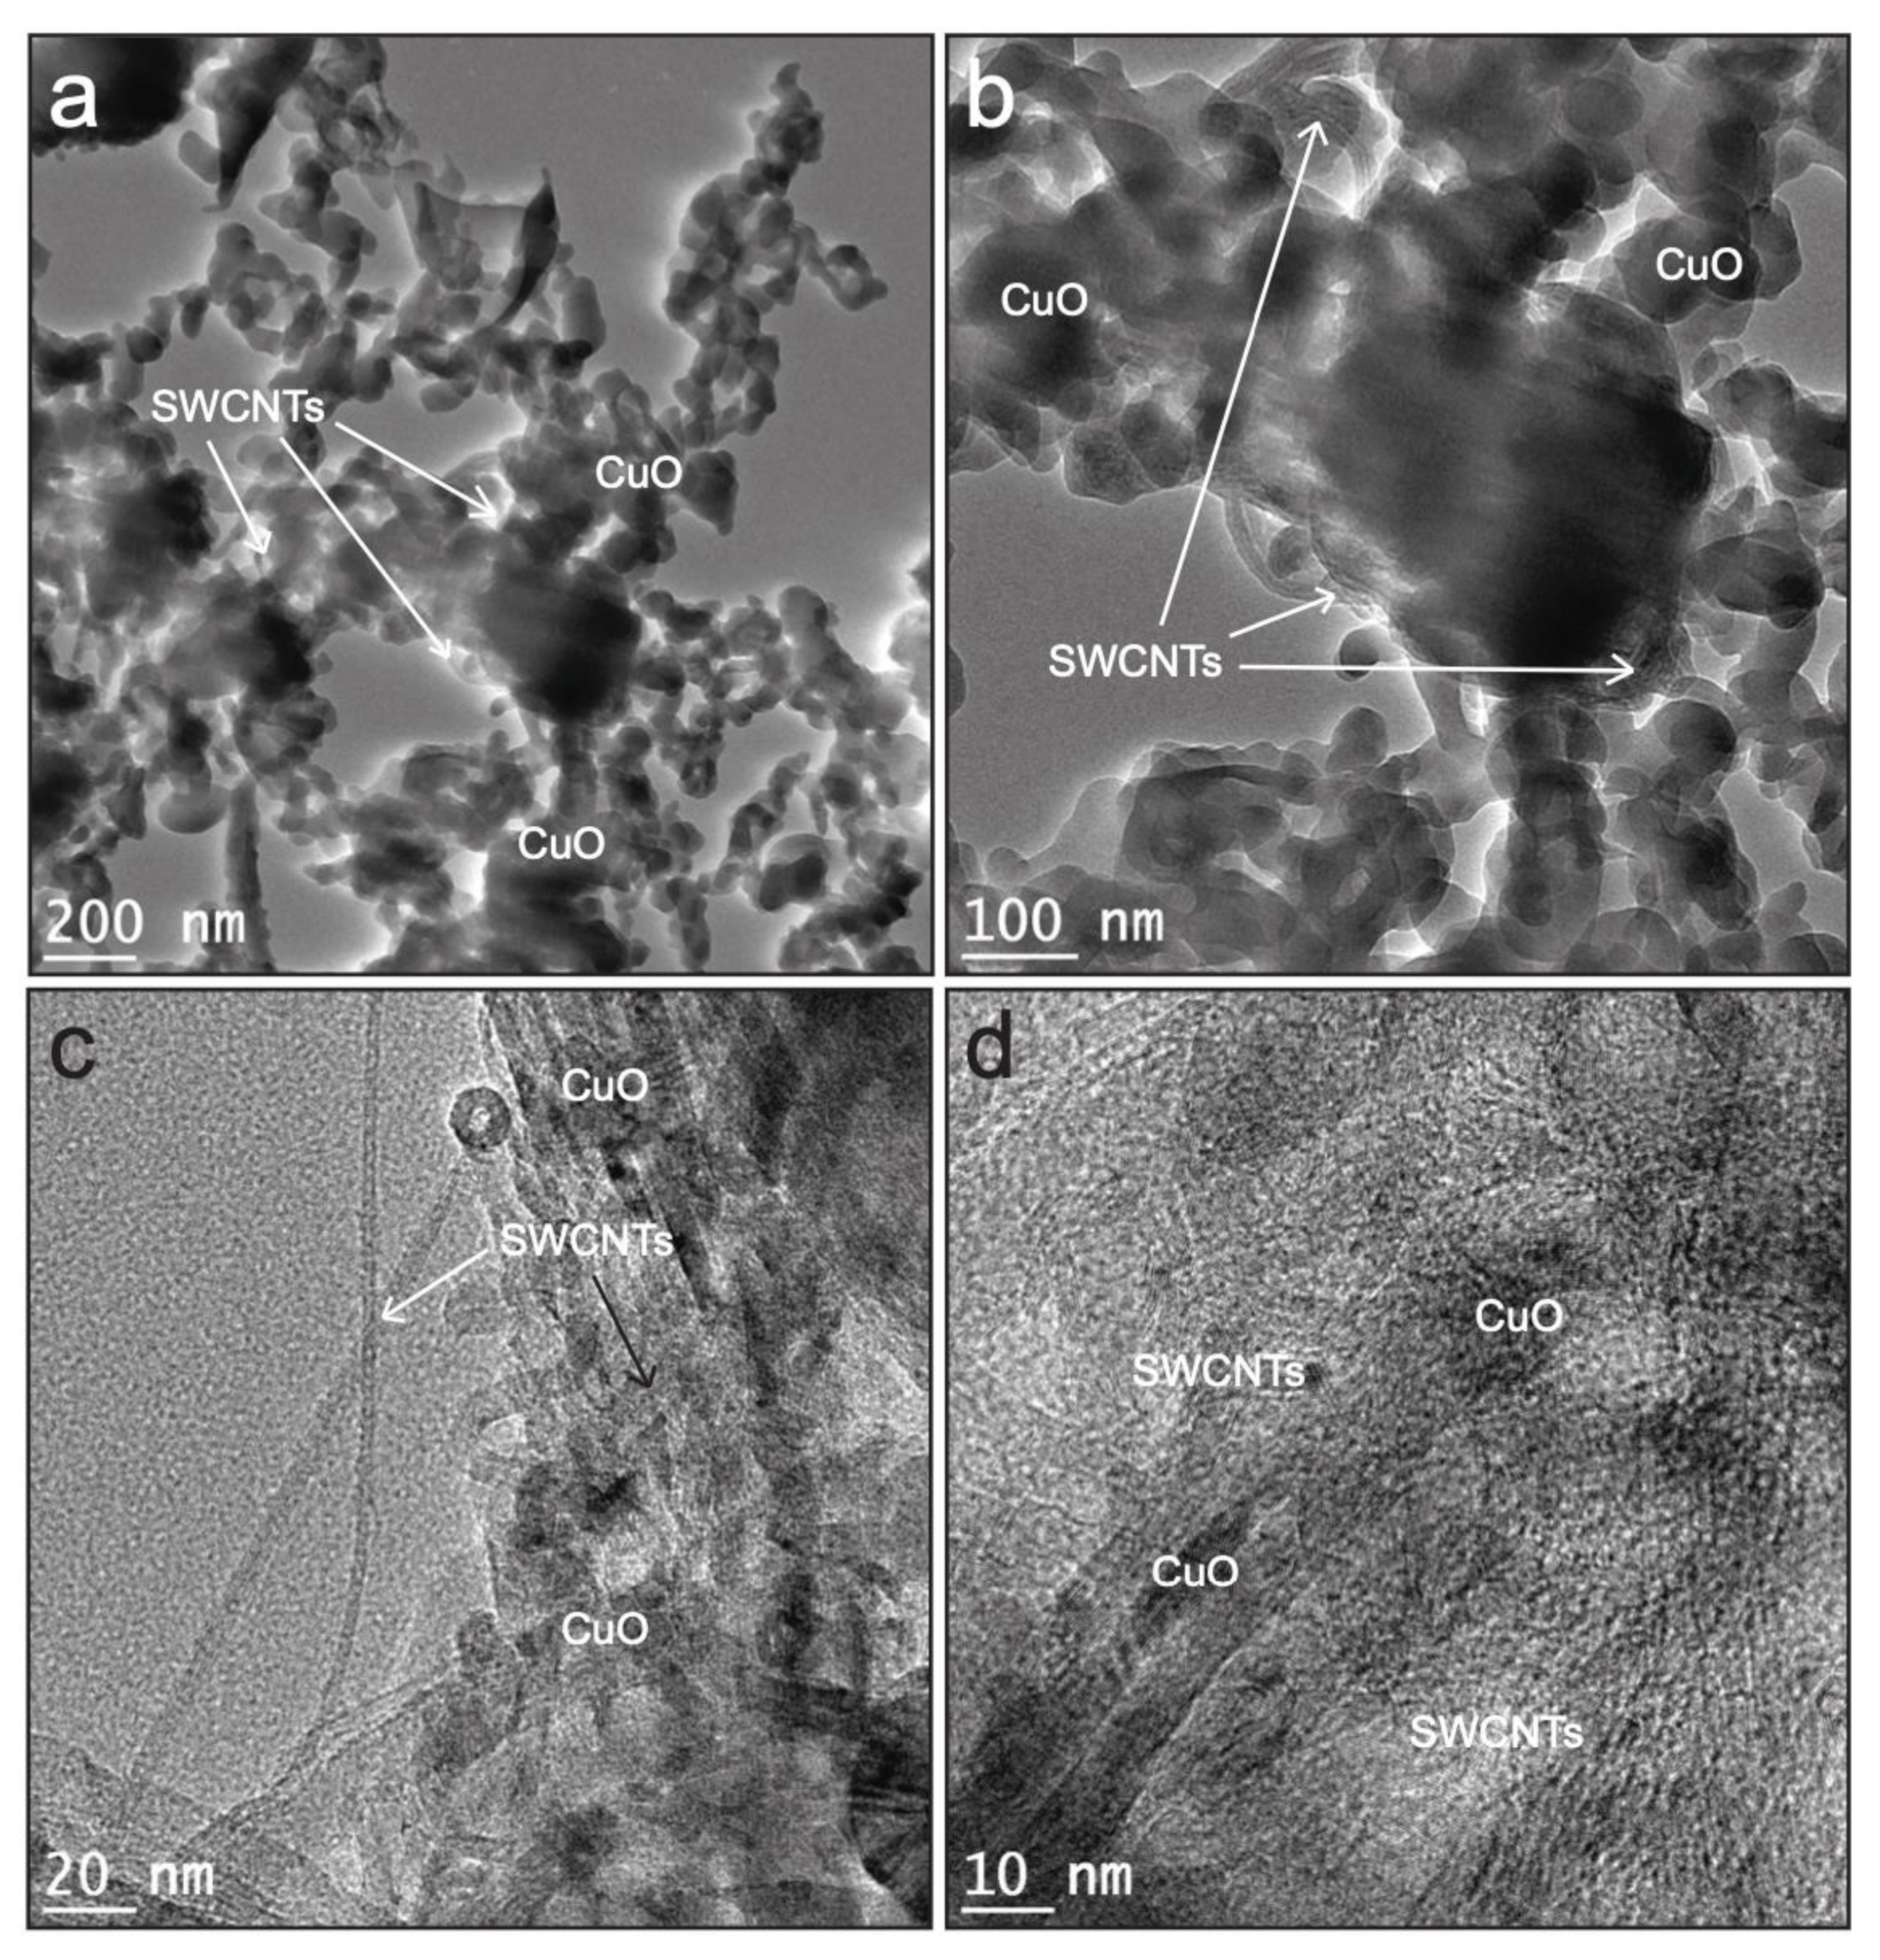
3.1. Morphological Properties
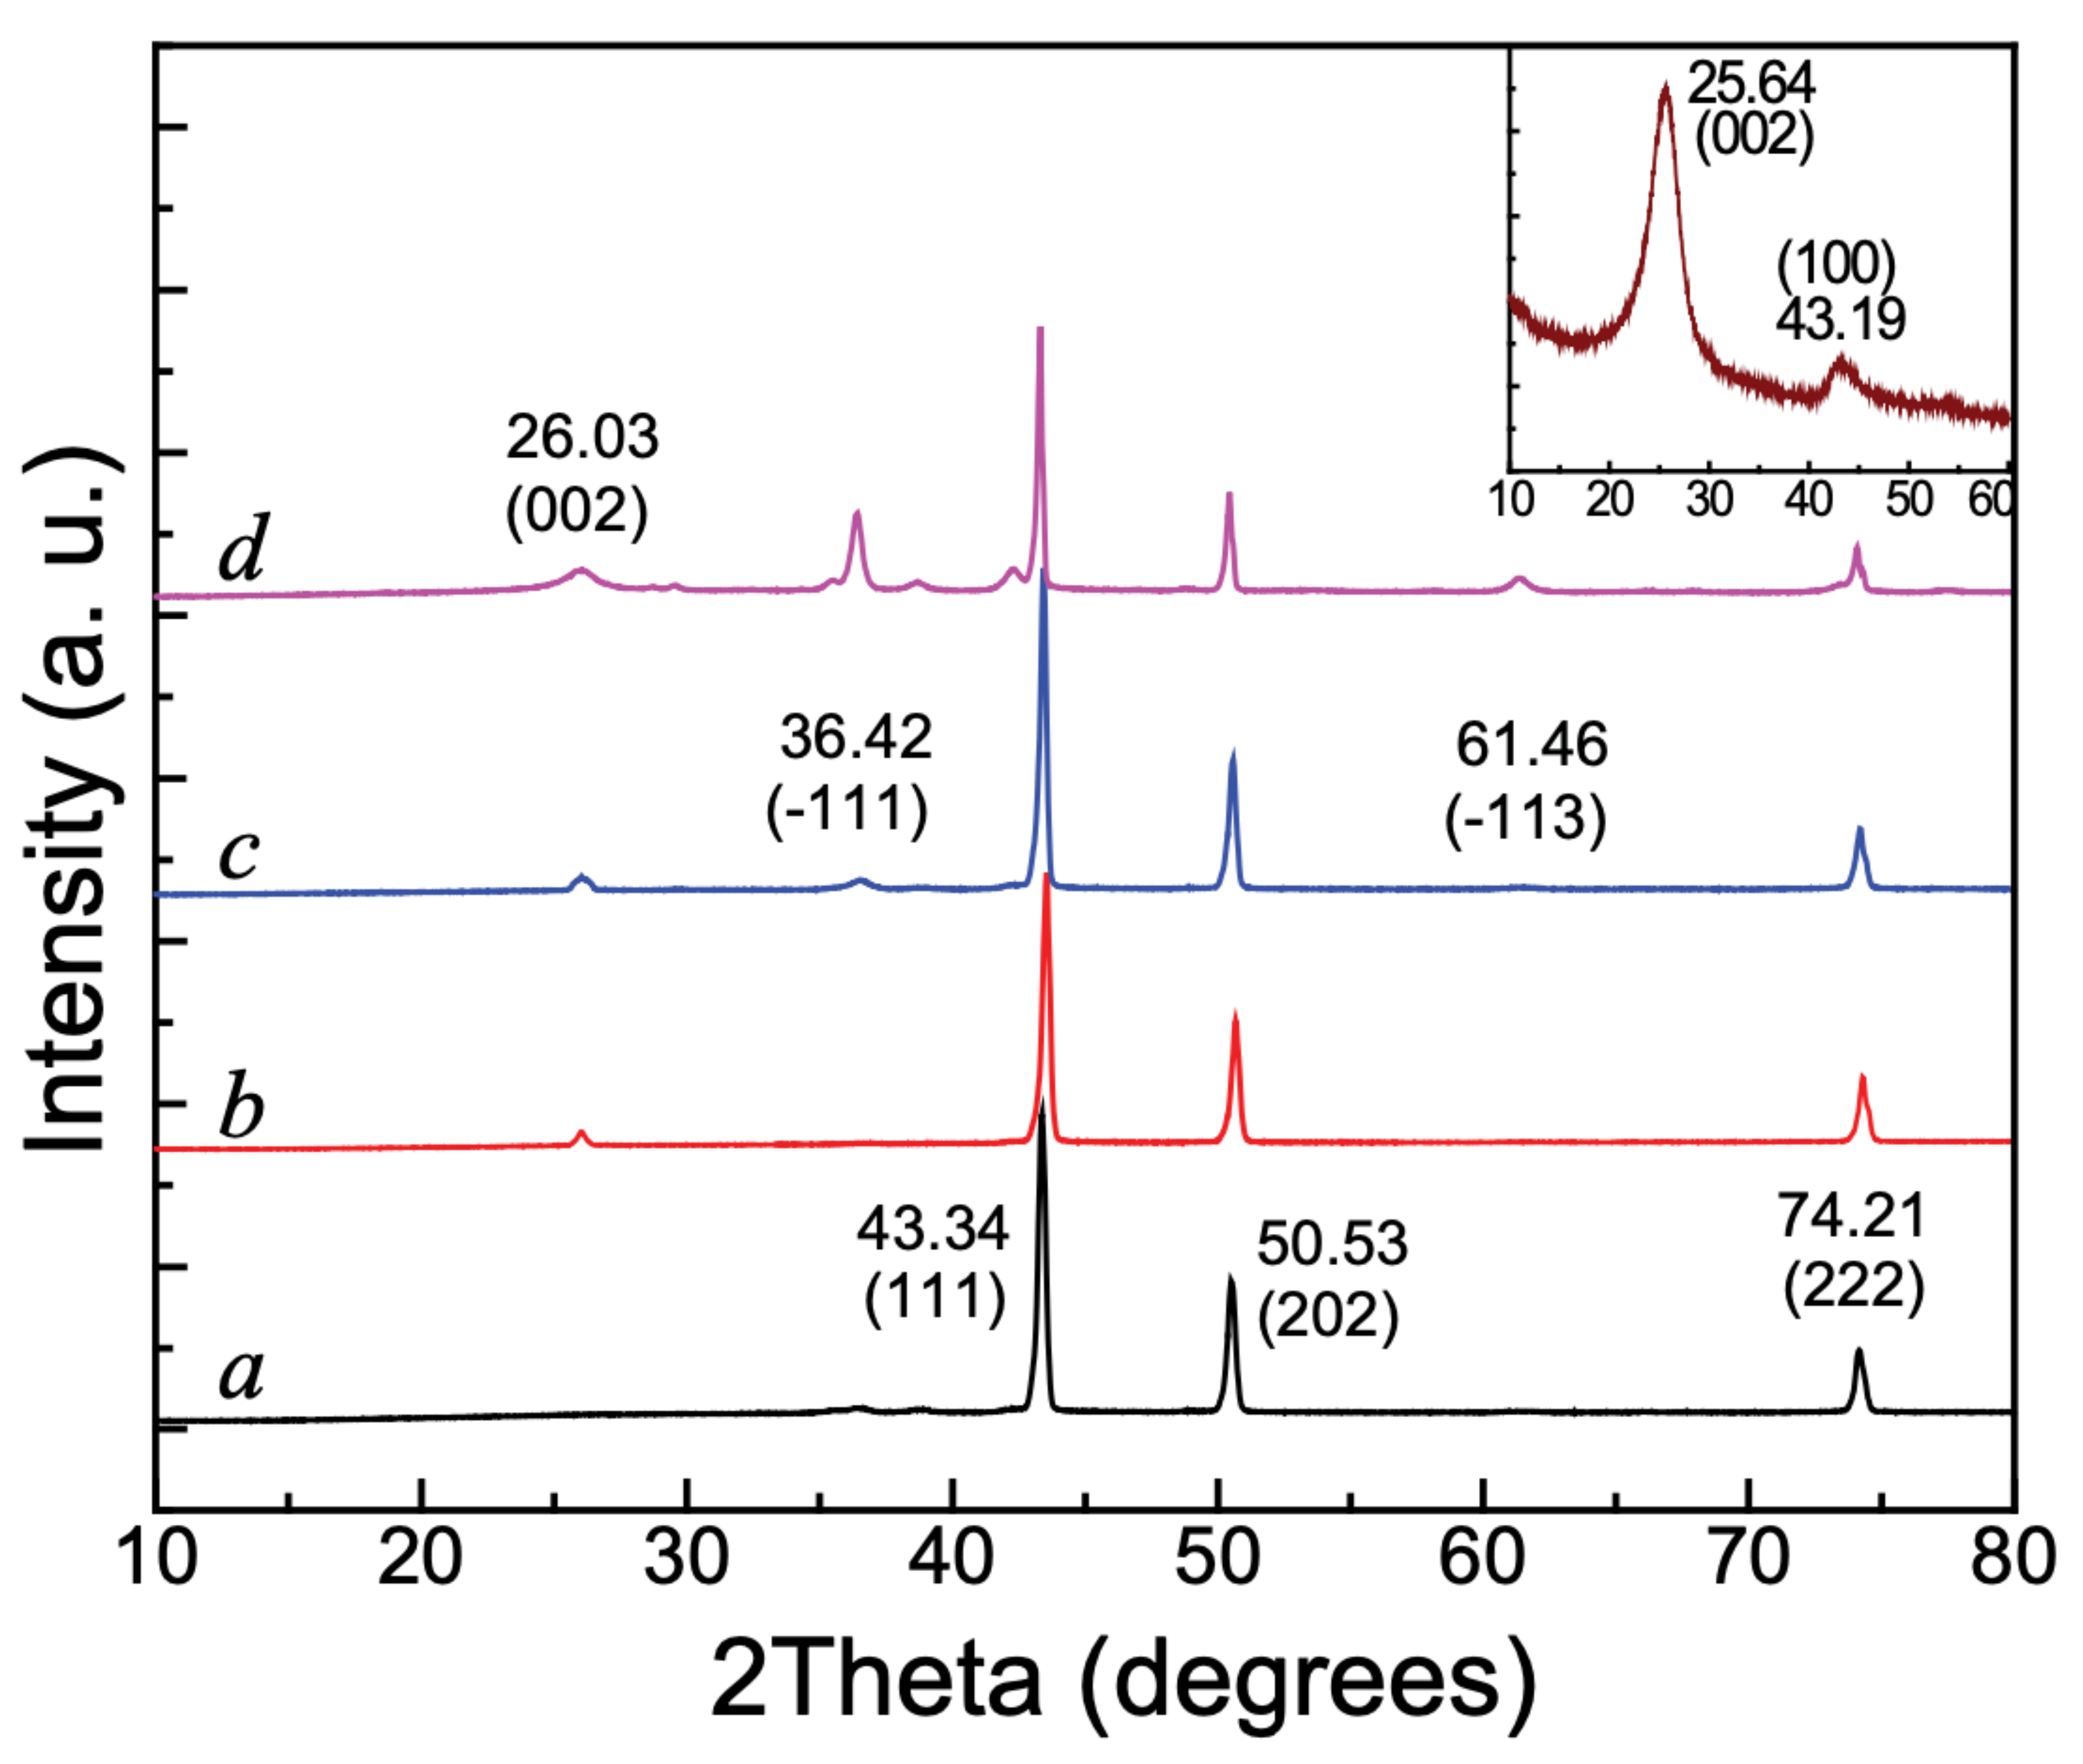
3.2. Structural Characterization
3.3. Thermal Properties
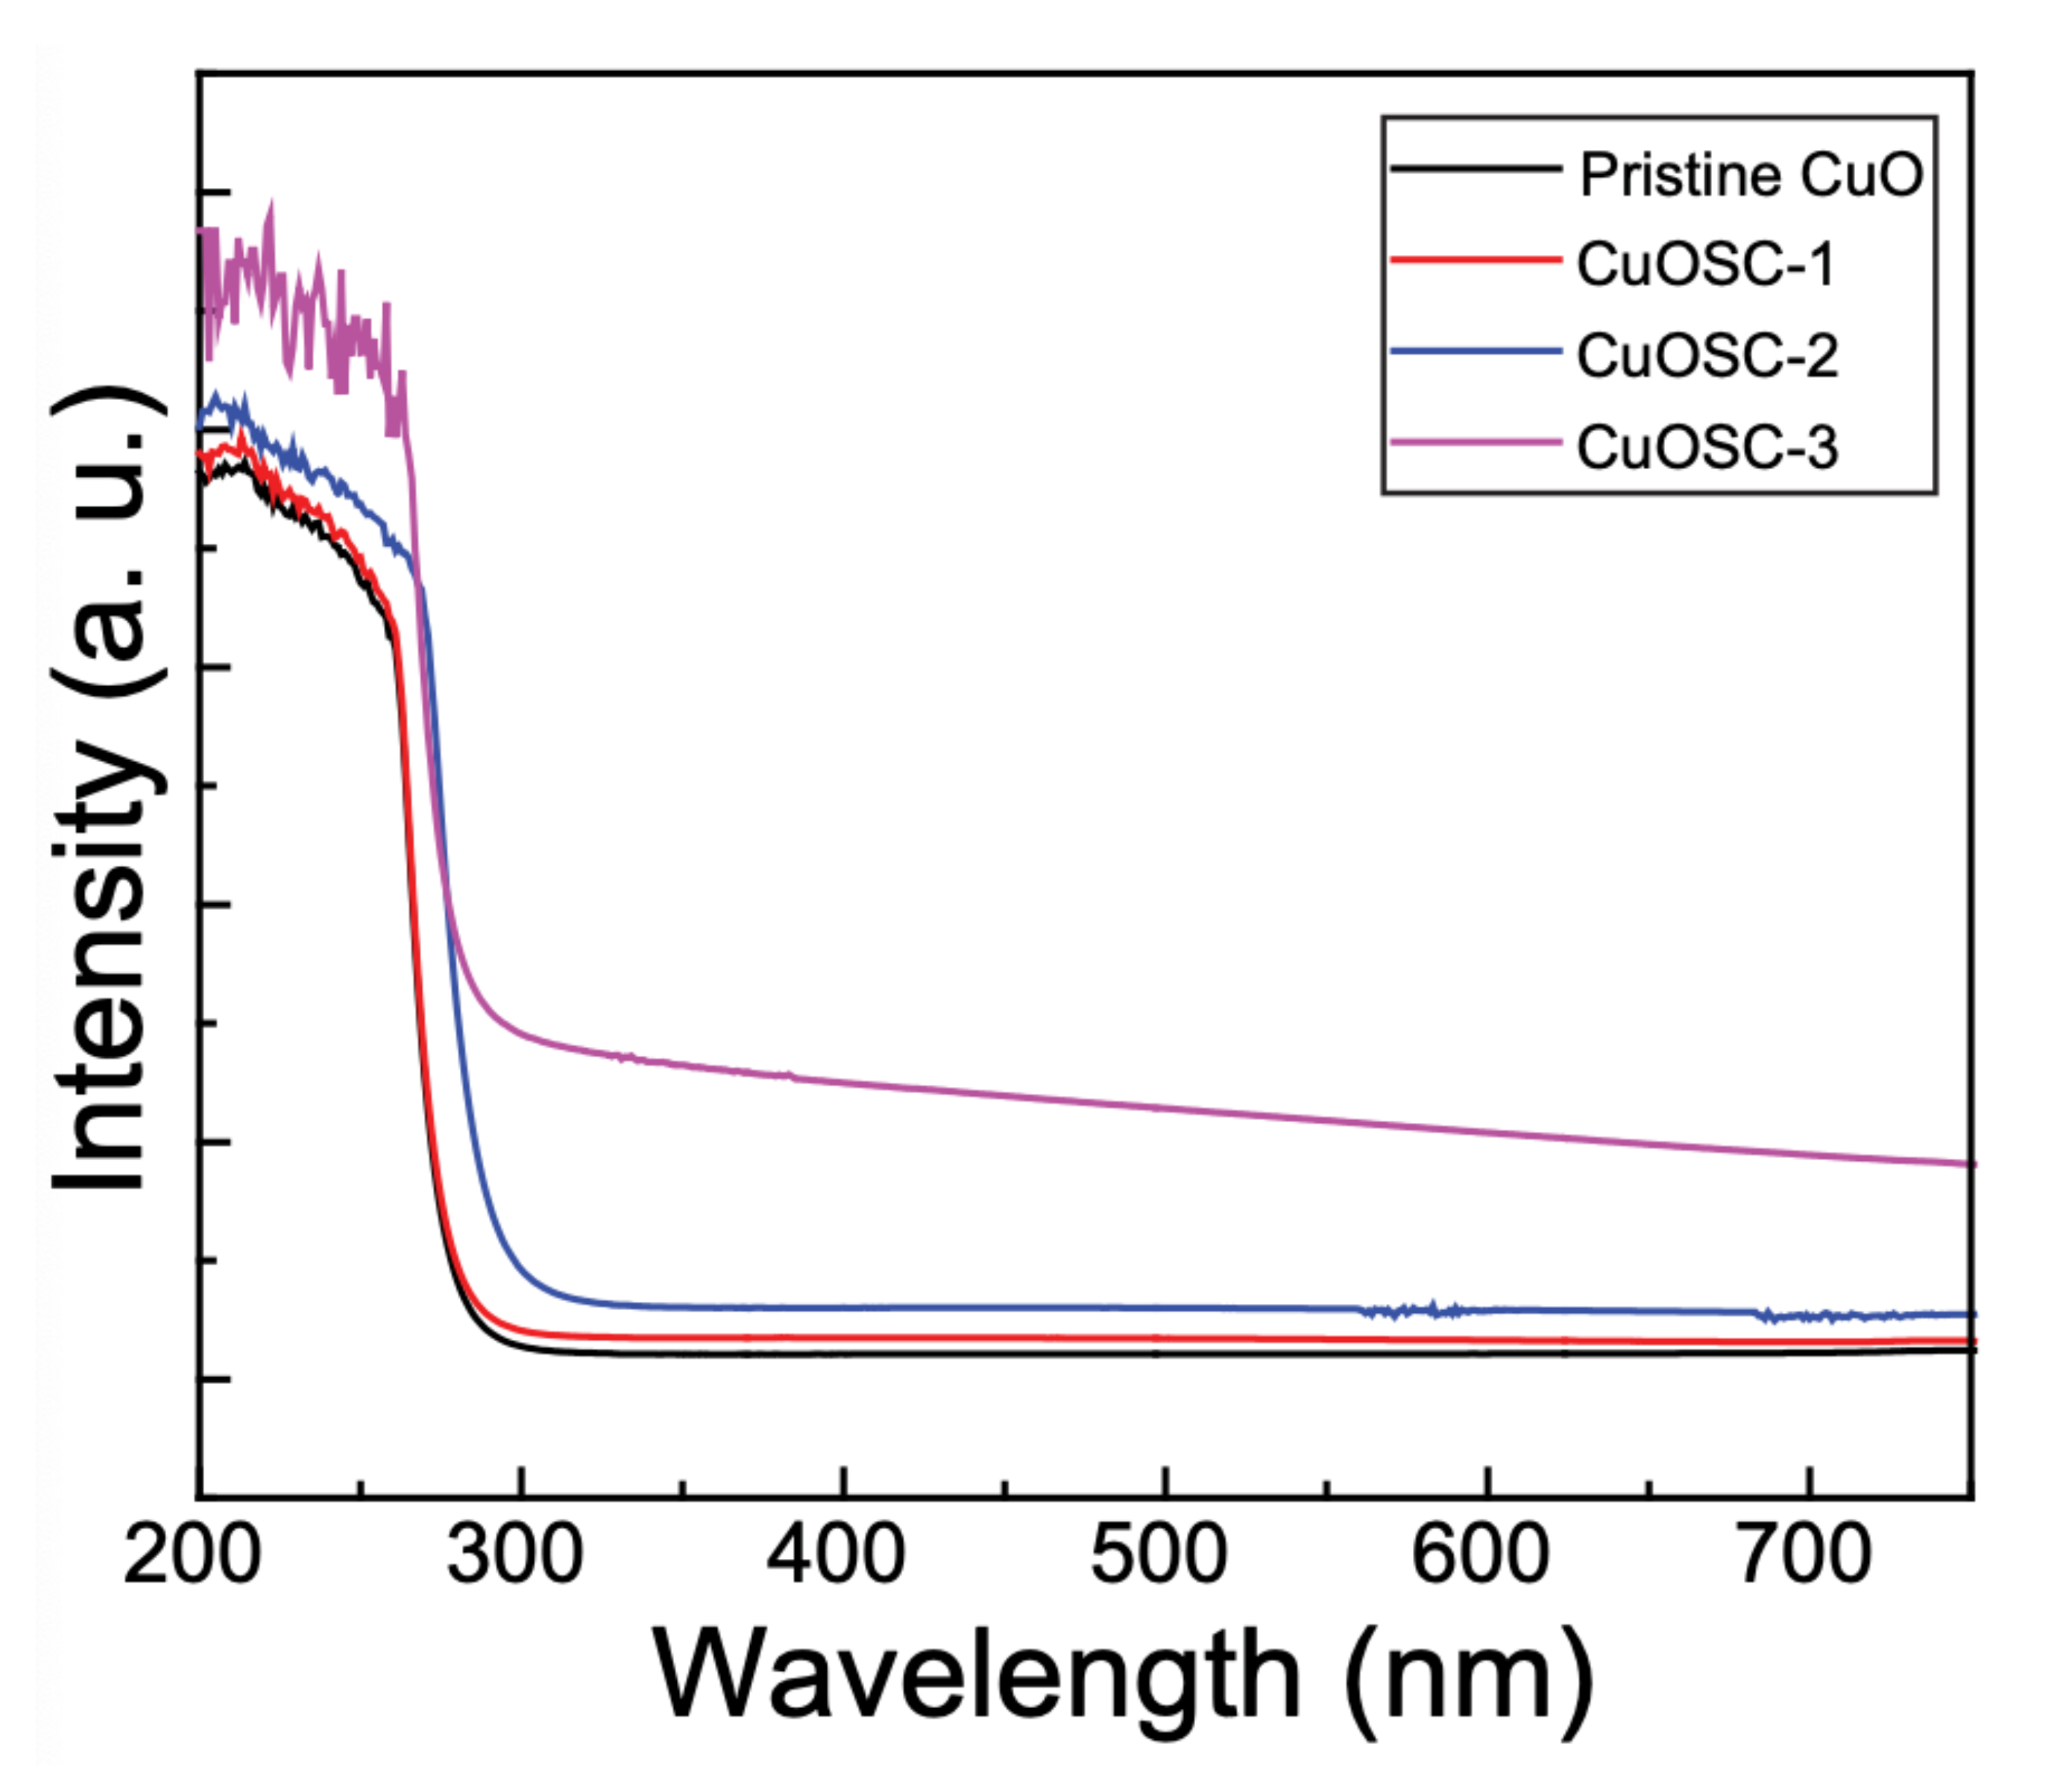
3.4. Optical Characteristics
3.5. Surface Area and Volume Studies
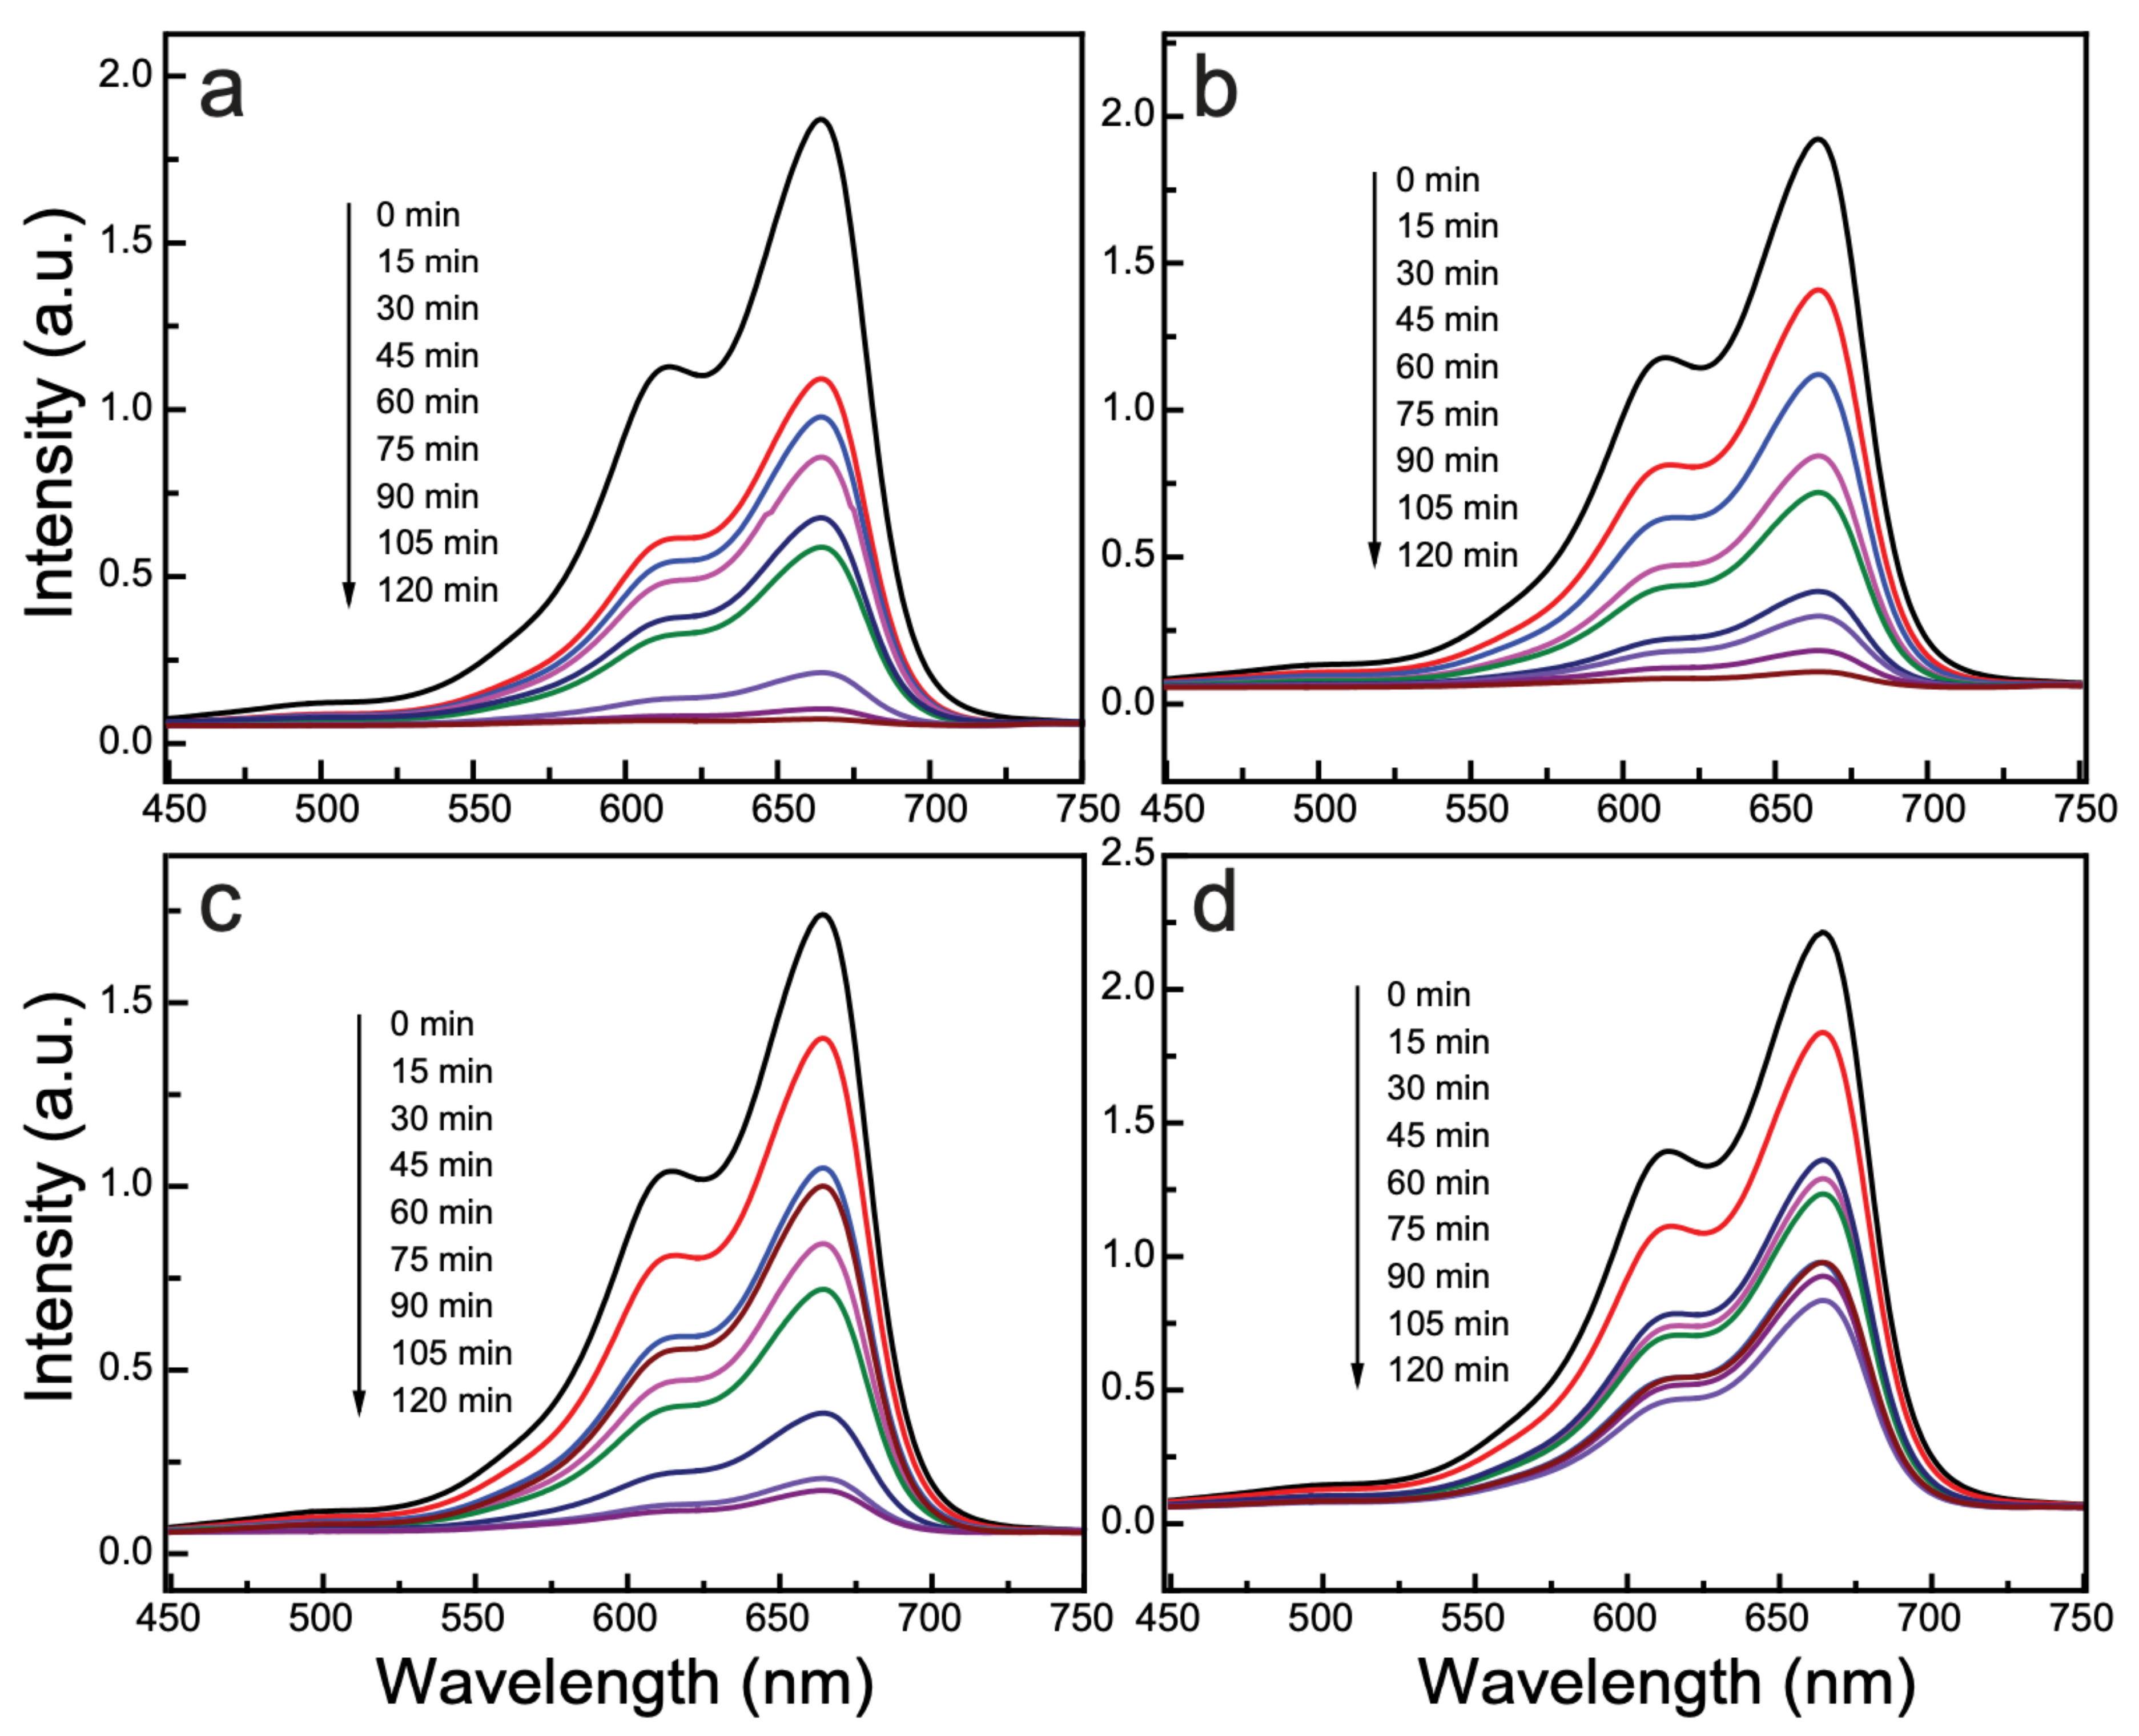
3.6. Photocatalytic Activity
3.7. Effect of Point of Zero Charge and pH on Photocatalytic MB Degradation
3.8. Mechanism of Photocatalytic Action
3.9. Charge Carriers Trapping Experiments
3.10. Detection of the Degradation Products
4. Conclusions
Supplementary Materials
Author Contributions
Funding
Conflicts of Interest
References
- Lyu, H.; Gao, B.; He, F.; Zimmerman, A.R.; Ding, C.; Tang, J.; Crittenden, J.C. Experimental and modeling investigations of ball-milled biochar for the removal of aqueous methylene blue. Chem. Eng. J. 2018, 335, 110–119. [Google Scholar] [CrossRef]
- Hu, X.-S.; Liang, R.; Sun, G. Super-adsorbent hydrogel for removal of methylene blue dye from aqueous solution. J. Mater. Chem. A 2018, 6, 17612–17624. [Google Scholar] [CrossRef]
- Othman, N.H.; Alias, N.H.; Shahruddin, M.Z.; Abu Bakar, N.F.; Him, N.R.N.; Lau, W.J. Adsorption kinetics of methylene blue dyes onto magnetic graphene oxide. J. Environ. Chem. Eng. 2018, 6, 2803–2811. [Google Scholar] [CrossRef]
- Mouni, L.; Belkhiri, L.; Bollinger, J.-C.; Bouzaza, A.; Assadi, A.; Tirri, A.; Dahmoune, F.; Madani, K.; Remini, H. Removal of Methylene Blue from aqueous solutions by adsorption on Kaolin: Kinetic and equilibrium studies. Appl. Clay Sci. 2018, 153, 38–45. [Google Scholar] [CrossRef]
- Yang, X.; Wang, D. Photocatalysis: From Fundamental Principles to Materials and Applications. ACS Appl. Energy Mater. 2018, 1, 6657–6693. [Google Scholar] [CrossRef]
- Li, H.; Su, Z.; Hu, S.; Yan, Y. Free-standing and flexible Cu/Cu2O/CuO heterojunction net: A novel material as cost-effective and easily recycled visible-light photocatalyst. Appl. Catal. B Environ. 2017, 207, 134–142. [Google Scholar] [CrossRef]
- Sapkota, K.P.; Lee, I.; Hanif, A.; Islam, A.; Akter, J.; Hahn, J.R. Enhanced Visible-Light Photocatalysis of Nanocomposites of Copper Oxide and Single-Walled Carbon Nanotubes for the Degradation of Methylene Blue. Catalysts 2020, 10, 297. [Google Scholar] [CrossRef]
- Al-Ghamdi, A.A.; Khedr, M.; Ansari, M.S.; Hasan, P.; Abdel-Wahab, M.; Farghali, A. RF sputtered CuO thin films: Structural, optical and photo-catalytic behavior. Phys. E Low Dimens. Syst. Nanostruct. 2016, 81, 83–90. [Google Scholar] [CrossRef]
- Hanif, A.; Lee, I.; Akter, J.; Islam, A.; Zahid, A.A.S.M.; Sapkota, K.P.; Hahn, J.R. Enhanced Photocatalytic and Antibacterial Performance of ZnO Nanoparticles Prepared by an Efficient Thermolysis Method. Catalysts 2019, 9, 608. [Google Scholar] [CrossRef]
- Zhao, Y.; Ikram, M.; Zhang, J.; Kan, K.; Wu, H.; Song, W.; Li, L.; Shi, K. Outstanding gas sensing performance of CuO-CNTs nanocomposite based on asymmetrical schottky junctions. Appl. Surf. Sci. 2018, 428, 415–421. [Google Scholar] [CrossRef]
- Fishman, Z.S.; Rudshteyn, B.; He, Y.; Liu, B.; Chaudhuri, S.; Askerka, M.; Haller, G.L.; Batista, V.S.; Pfefferle, L.D. Fundamental Role of Oxygen Stoichiometry in Controlling the Band Gap and Reactivity of Cupric Oxide Nanosheets. J. Am. Chem. Soc. 2016, 138, 10978–10985. [Google Scholar] [CrossRef] [PubMed]
- Maity, S.; Das, S.; Sen, D.; Chattopadhyay, K.K. Tailored CuO nanostructures decorated amorphous carbon nanotubes hybrid for efficient field emitter with theoretical validation. Carbon 2018, 127, 510–518. [Google Scholar] [CrossRef]
- Kim, G.-H.; Jeong, S.; Lee, I.; Hanif, A.; Islam, A.; Sapkota, K.P.; Hahn, J.R. Role of Electronic Structures and Dispersion Interactions in Adsorption Selectivity of Pyrimidine Molecules with a Si(5 5 12) Surface. J. Phys. Chem. C 2019, 123, 19506–19512. [Google Scholar] [CrossRef]
- Sapkota, K.P.; Hassan, M.; Shrestha, S.; Hanif, A.; Islam, A.; Akter, J.; Abbas, H.G.; Hahn, J.R. Heterojunction formation between copper(II) oxide nanoparticles and single-walled carbon nanotubes to enhance antibacterial performance. Int. J. Pharm. 2020, 590, 119937. [Google Scholar] [CrossRef] [PubMed]
- Dung, N.Q.; Patil, D.; Jung, H.; Kim, D. A high-performance nonenzymatic glucose sensor made of CuO–SWCNT nanocomposites. Biosens. Bioelectron. 2013, 42, 280–286. [Google Scholar] [CrossRef] [PubMed]
- Chinnappan, A.; Ji, D.; Baskar, C.; Qin, X.; Ramakrishna, S. 3-Dimensional MWCNT/CuO nanostructures use as an electro-chemical catalyst for oxygen evolution reaction. J. Alloys Compd. 2018, 735, 2311–2317. [Google Scholar] [CrossRef]
- Khusnun, N.; Jalil, A.; Triwahyono, S.; Hitam, C.; Hassan, N.; Jamian, F.; Nabgan, W.; Abdullah, T.; Kamaruddin, M.; Hartanto, D. Directing the amount of CNTs in CuO–CNT catalysts for enhanced adsorption-oriented visible-light-responsive photodegradation of p-chloroaniline. Powder Technol. 2018, 327, 170–178. [Google Scholar] [CrossRef]
- Mahmoodi, N.M.; Rezaei, P.; Ghotbei, C.; Kazemeini, M. Copper oxide-carbon nanotube (CuO/CNT) nanocomposite: Synthesis and photocatalytic dye degradation from colored textile wastewater. Fibers Polym. 2016, 17, 1842–1848. [Google Scholar] [CrossRef]
- Andersen, N.I.; Serov, A.; Atanassov, P. Metal oxides/CNT nano-composite catalysts for oxygen reduction/oxygen evolution in alkaline media. Appl. Catal. B Environ. 2015, 163, 623–627. [Google Scholar] [CrossRef]
- Sapkota, K.P.; Lee, I.; Hanif, M.; Islam, M.; Hahn, J.R. Solar-light-driven efficient ZnO–single-walled carbon nanotube photocatalyst for the degradation of a persistent water pollutant organic dye. Catalysts 2019, 9, 498. [Google Scholar] [CrossRef]
- He, X.; Yang, D.P.; Zhang, X.; Liu, M.; Kang, Z.; Lin, C.; Jia, N.; Luque, R. Waste eggshell membrane-templated CuO-ZnO nanocomposites with enhanced adsorption, catalysis and antibacterial properties for water purification. Chem. Eng. J. 2019, 369, 621–633. [Google Scholar] [CrossRef]
- Panthi, G.; Gyawali, K.R.; Park, M. Towards the Enhancement in Photocatalytic Performance of Ag3PO4 Nanoparticles through Sulfate Doping and Anchoring on Electrospun Nanofibers. Nanomaterials 2020, 10, 929. [Google Scholar] [CrossRef] [PubMed]
- Panthi, G.; Kwon, O.H.; Kuk, Y.S.; Gyawali, K.R.; Park, Y.W.; Park, M. Ternary Composite of Co-Doped CdSe@ electrospun Carbon Nanofibers: A Novel Reusable Visible Light-Driven Photocatalyst with Enhanced Performance. Catalysts 2020, 10, 348. [Google Scholar] [CrossRef]
- Ghaly, H.A.; El-Kalliny, A.S.; Gad-Allah, T.A.; El-Sattar, N.E.A.A.; Souaya, E.R. Stable plasmonic Ag/AgCl–polyaniline photoactive composite for degradation of organic contaminants under solar light. RSC Adv. 2017, 7, 12726–12736. [Google Scholar] [CrossRef]
- Wu, L.; Xie, Q.; Lv, Y.; Zhang, Z.; Wu, Z.; Liang, X.; Lu, M.; Nie, Y. Degradation of methylene blue by dielectric barrier discharge plasma coupled with activated carbon supported on polyurethane foam. RSC Adv. 2019, 9, 25967–25975. [Google Scholar] [CrossRef]
- Rauf, M.A.; Meetani, M.A.; Khaleel, A.; Ahmed, A. Photocatalytic degradation of Methylene Blue using a mixed catalyst and product analysis by LC/MS. Chem. Eng. J. 2010, 157, 373–378. [Google Scholar] [CrossRef]
- Dassanayake, R.S.; Rajakaruna, E.; Abidi, N. Preparation of aerochitin-TiO2 composite for efficient photocatalytic degradation of methylene blue. J. Appl. Polym. Sci. 2018, 135, 45908. [Google Scholar] [CrossRef]
- Liu, Y.; Jin, W.; Zhao, Y.; Zhang, G.; Zhang, W. Enhanced catalytic degradation of methylene blue by α-Fe2O3/graphene oxide via heterogeneous photo-Fenton reactions. Appl. Catal. B Environ. 2017, 206, 642–652. [Google Scholar] [CrossRef]


| Photocatalyst | SBET (m2 g−1) | Vpore (cm3 g−1) | Dpore (nm) |
|---|---|---|---|
| CuO | 33.96 ± 0.18 | 0.05 ± 0.001 | 3.36 |
| CuOSC-1 | 35.07 ± 0.10 | 0.02 ± 0.0003 | 8.23 |
| CuOSC-2 | 37.58 ± 0.18 | 0.04 ± 0.001 | 4.02 |
| CuOSC-3 | 41.32 ± 0.19 | 0.11 ± 0.002 | 4.86 |
| SWCNTs | 258.84 ± 3.13 | 0.51 ± 0.002 | 8.45 |
Publisher’s Note: MDPI stays neutral with regard to jurisdictional claims in published maps and institutional affiliations. |
© 2021 by the authors. Licensee MDPI, Basel, Switzerland. This article is an open access article distributed under the terms and conditions of the Creative Commons Attribution (CC BY) license (http://creativecommons.org/licenses/by/4.0/).
Share and Cite
Sapkota, K.P.; Islam, M.A.; Hanif, M.A.; Akter, J.; Lee, I.; Hahn, J.R. Hierarchical Nanocauliflower Chemical Assembly Composed of Copper Oxide and Single-Walled Carbon Nanotubes for Enhanced Photocatalytic Dye Degradation. Nanomaterials 2021, 11, 696. https://doi.org/10.3390/nano11030696
Sapkota KP, Islam MA, Hanif MA, Akter J, Lee I, Hahn JR. Hierarchical Nanocauliflower Chemical Assembly Composed of Copper Oxide and Single-Walled Carbon Nanotubes for Enhanced Photocatalytic Dye Degradation. Nanomaterials. 2021; 11(3):696. https://doi.org/10.3390/nano11030696
Chicago/Turabian StyleSapkota, Kamal Prasad, Md. Akherul Islam, Md. Abu Hanif, Jeasmin Akter, Insup Lee, and Jae Ryang Hahn. 2021. "Hierarchical Nanocauliflower Chemical Assembly Composed of Copper Oxide and Single-Walled Carbon Nanotubes for Enhanced Photocatalytic Dye Degradation" Nanomaterials 11, no. 3: 696. https://doi.org/10.3390/nano11030696
APA StyleSapkota, K. P., Islam, M. A., Hanif, M. A., Akter, J., Lee, I., & Hahn, J. R. (2021). Hierarchical Nanocauliflower Chemical Assembly Composed of Copper Oxide and Single-Walled Carbon Nanotubes for Enhanced Photocatalytic Dye Degradation. Nanomaterials, 11(3), 696. https://doi.org/10.3390/nano11030696