
Raman and XANES Spectroscopic Study of the Influence of Coordination Atomic and Molecular Environments in Biomimetic Composite Materials Integrated with Dental Tissue


Abstract
:1. Introduction
2. Materials and Methods
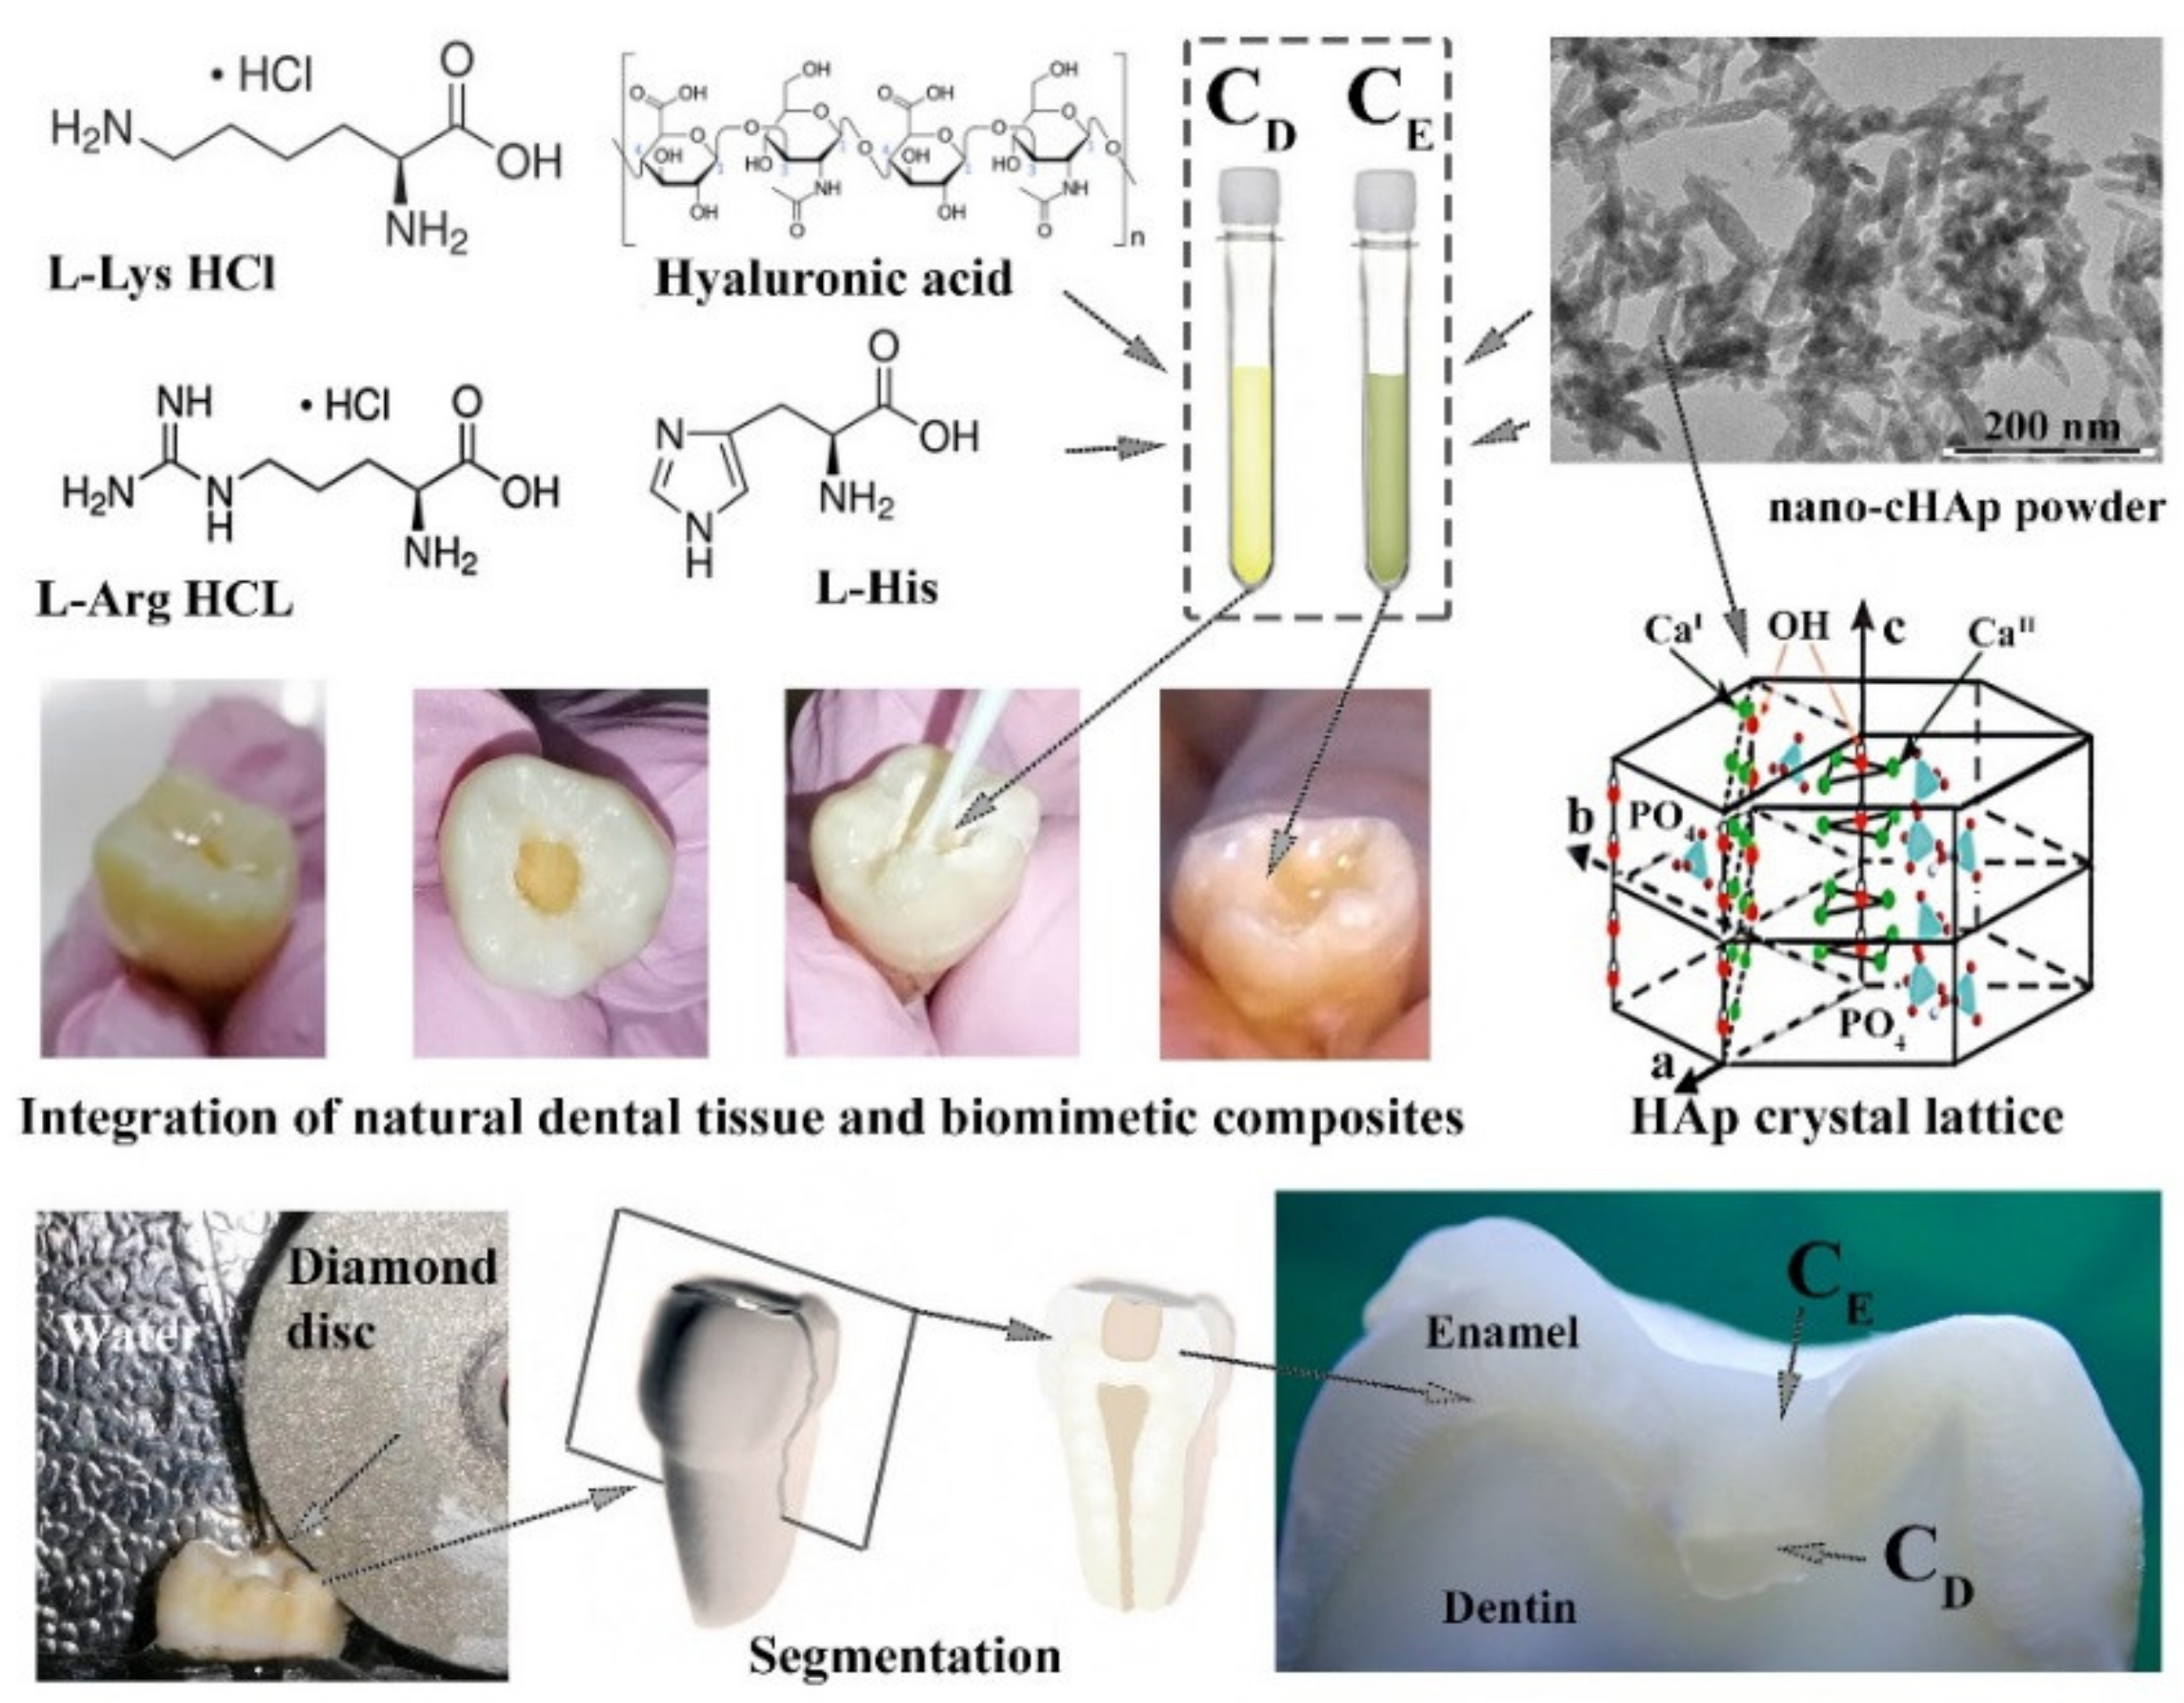
2.1. Materials
2.2. Creation of Biocomposites
2.3. Preparation of Natural Enamel and Dentine Samples
2.4. Integration of Natural Dental Tissue and Biomimetic Composites (Treatment)
2.5. Segmentation of Samples
2.6. Experimental Set-Up and Parameters
2.7. Data Collection and Spectral Processing
2.8. Description of the Samples Created and Investigated
3. Results
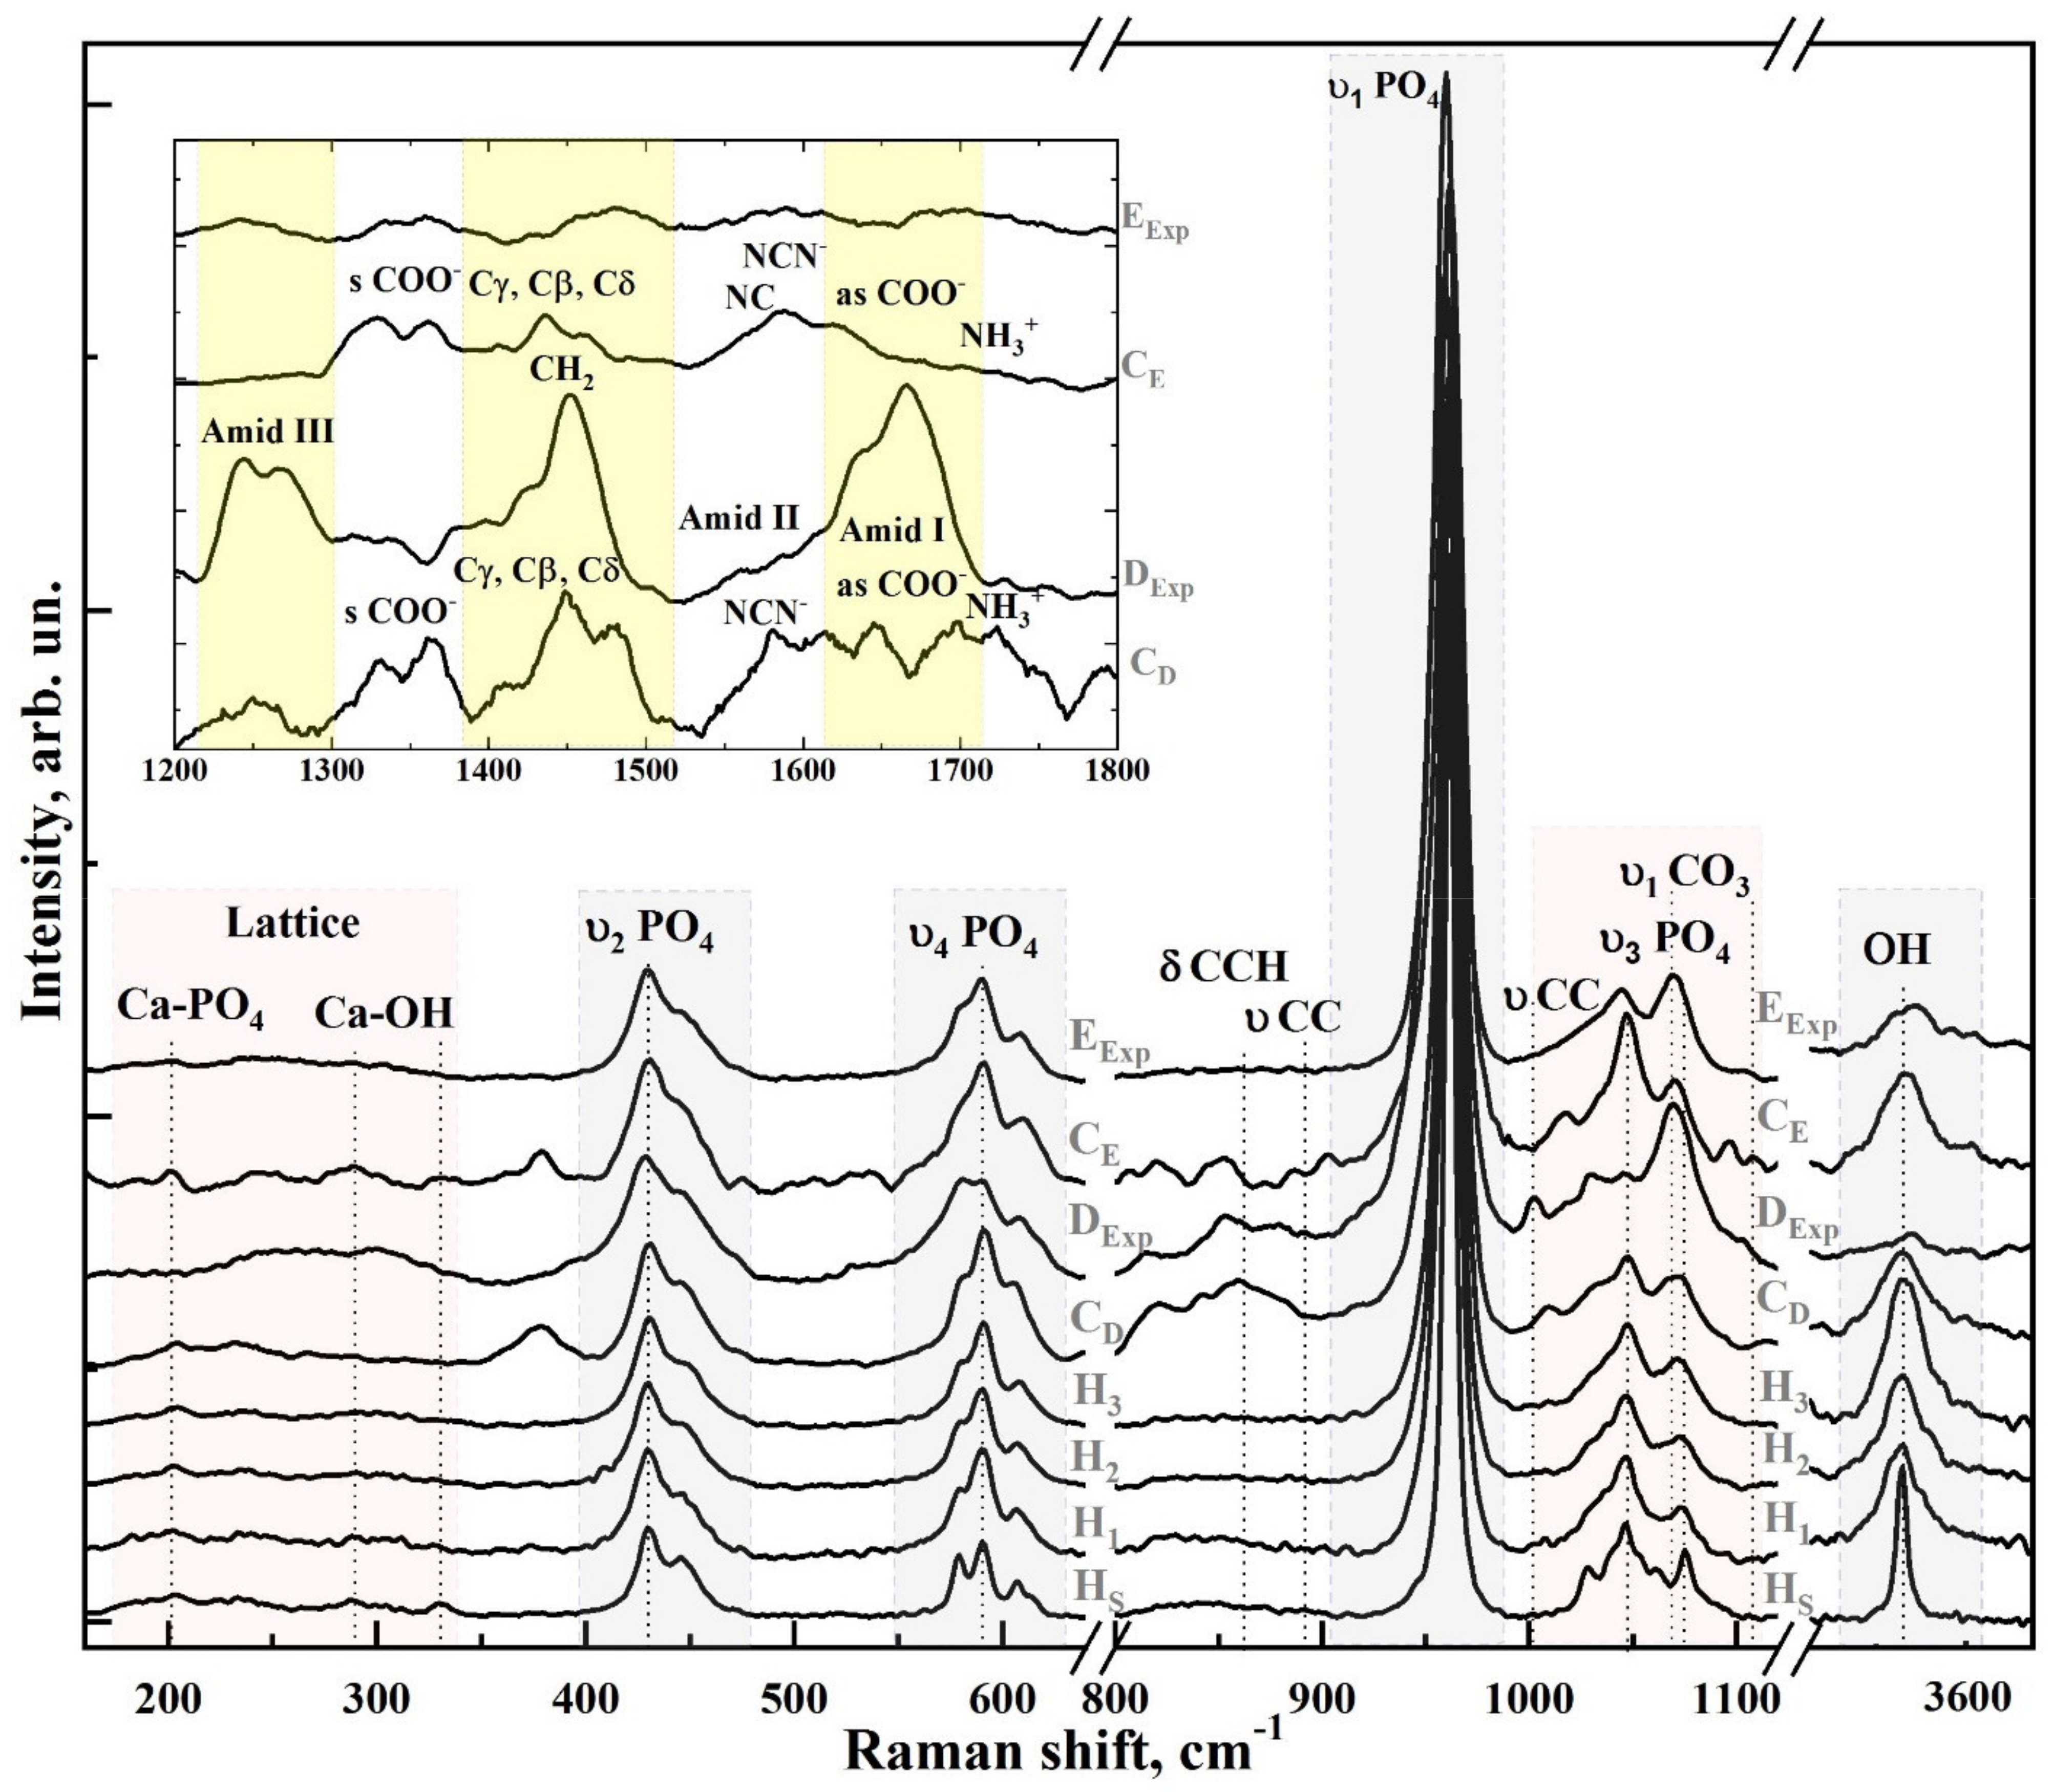
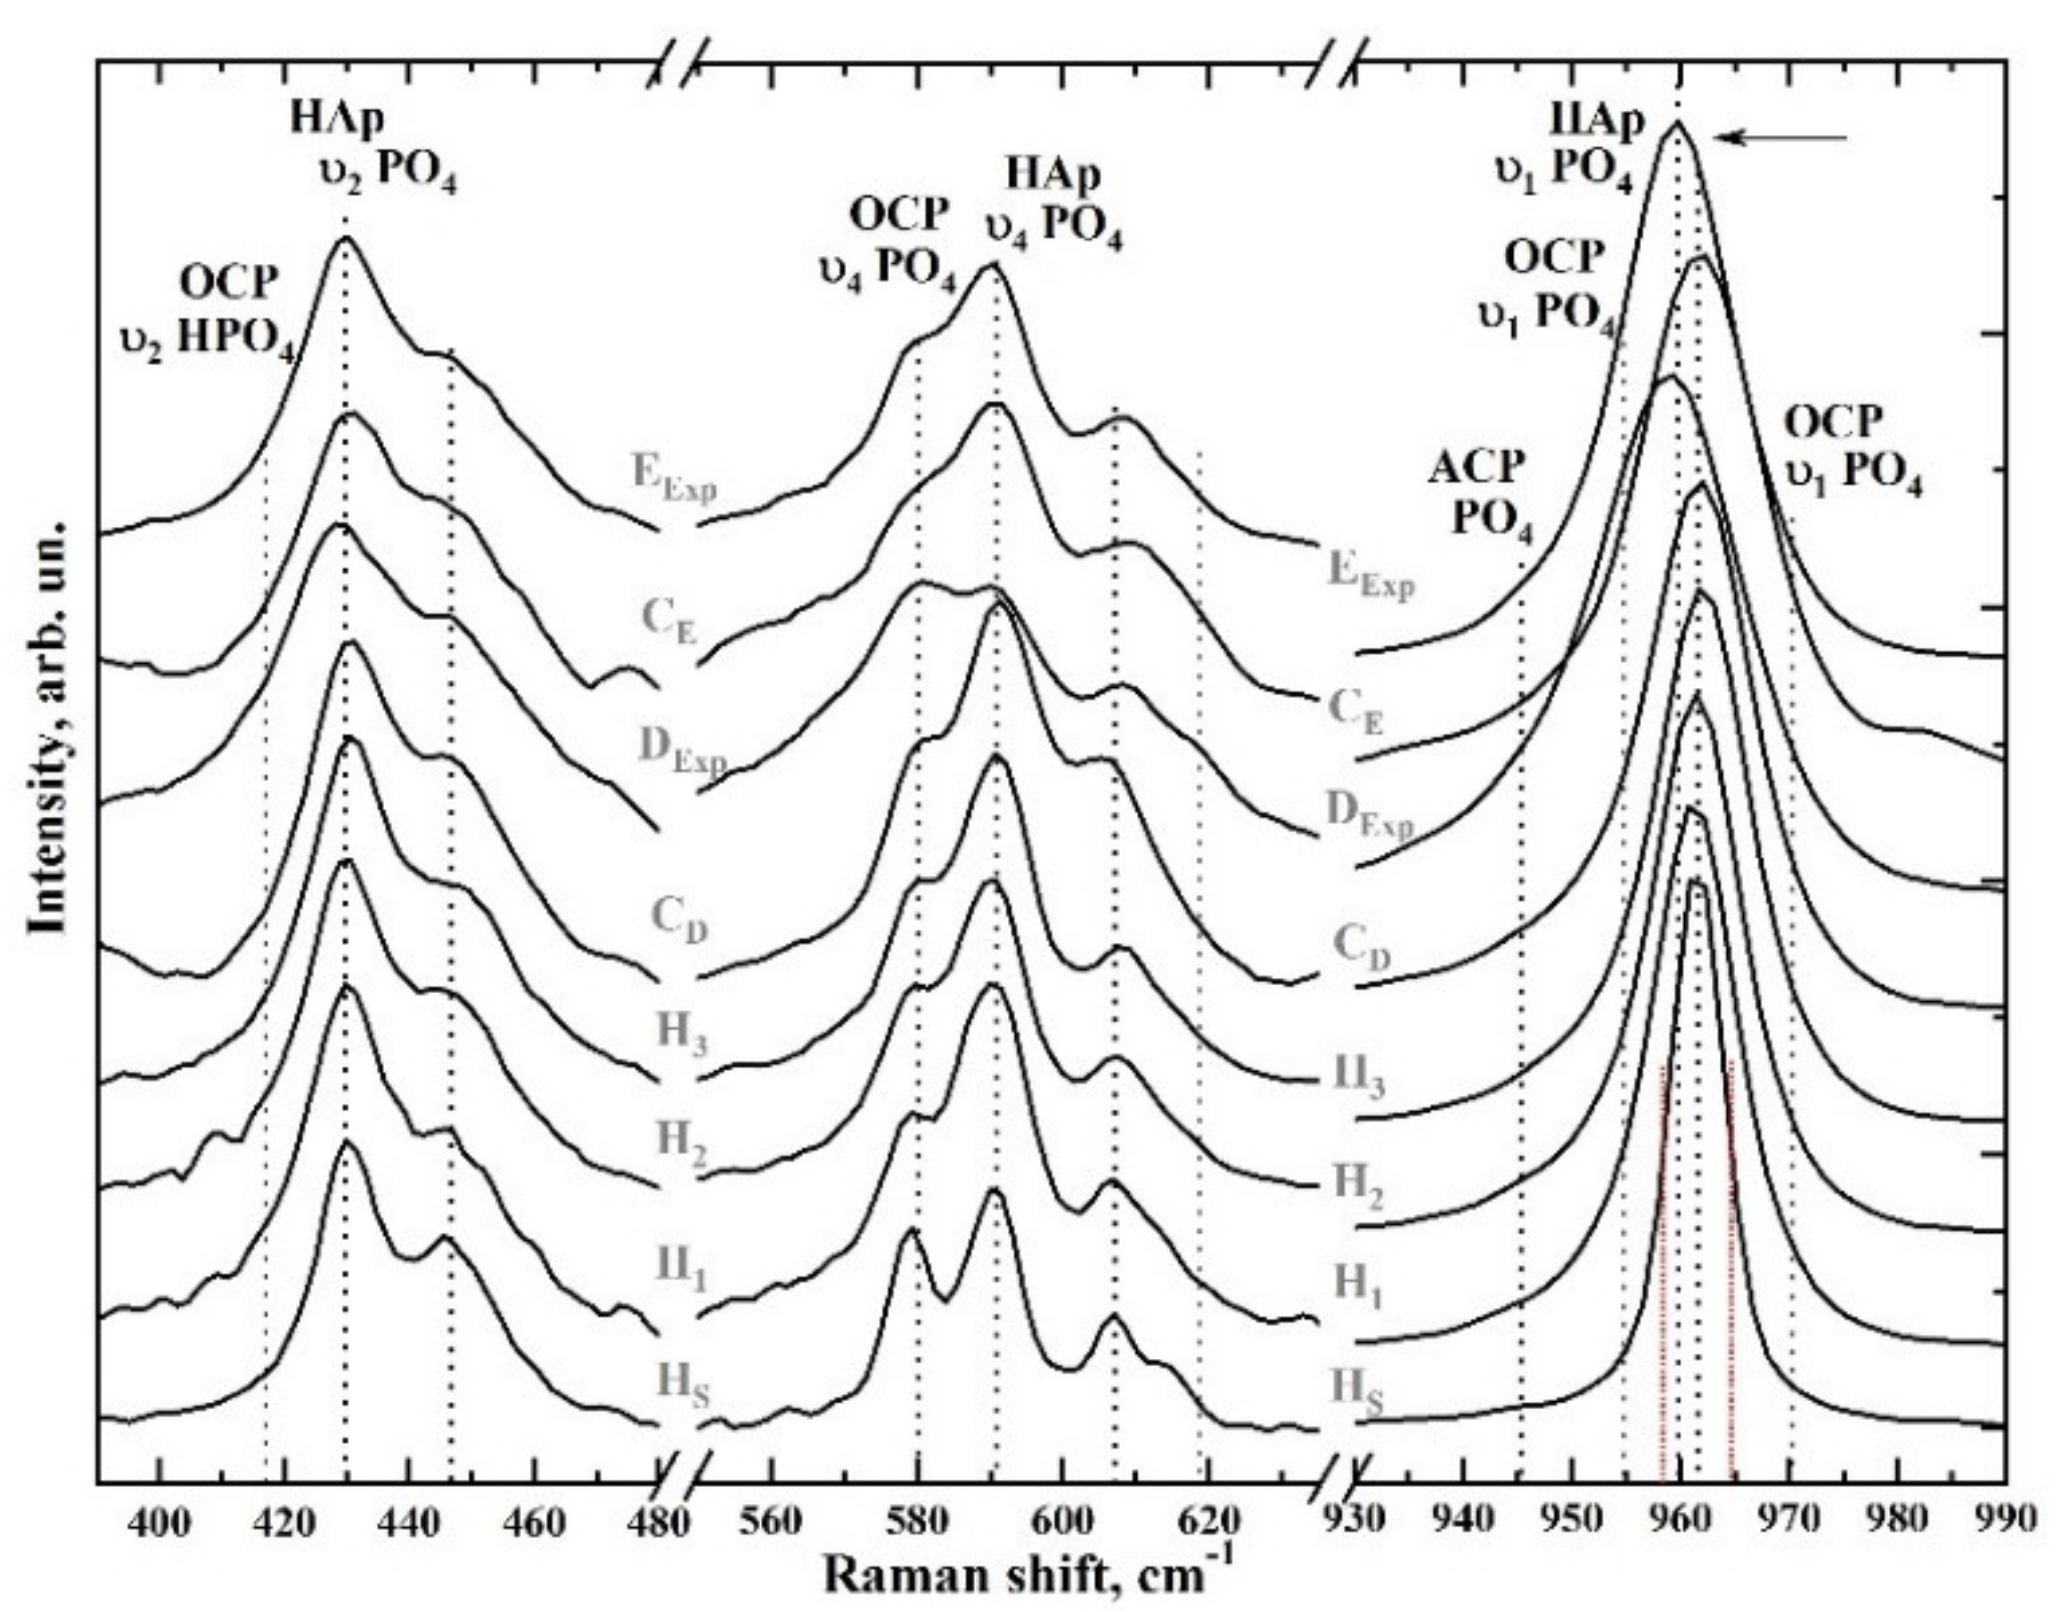
3.1. Raman Spectroscopy
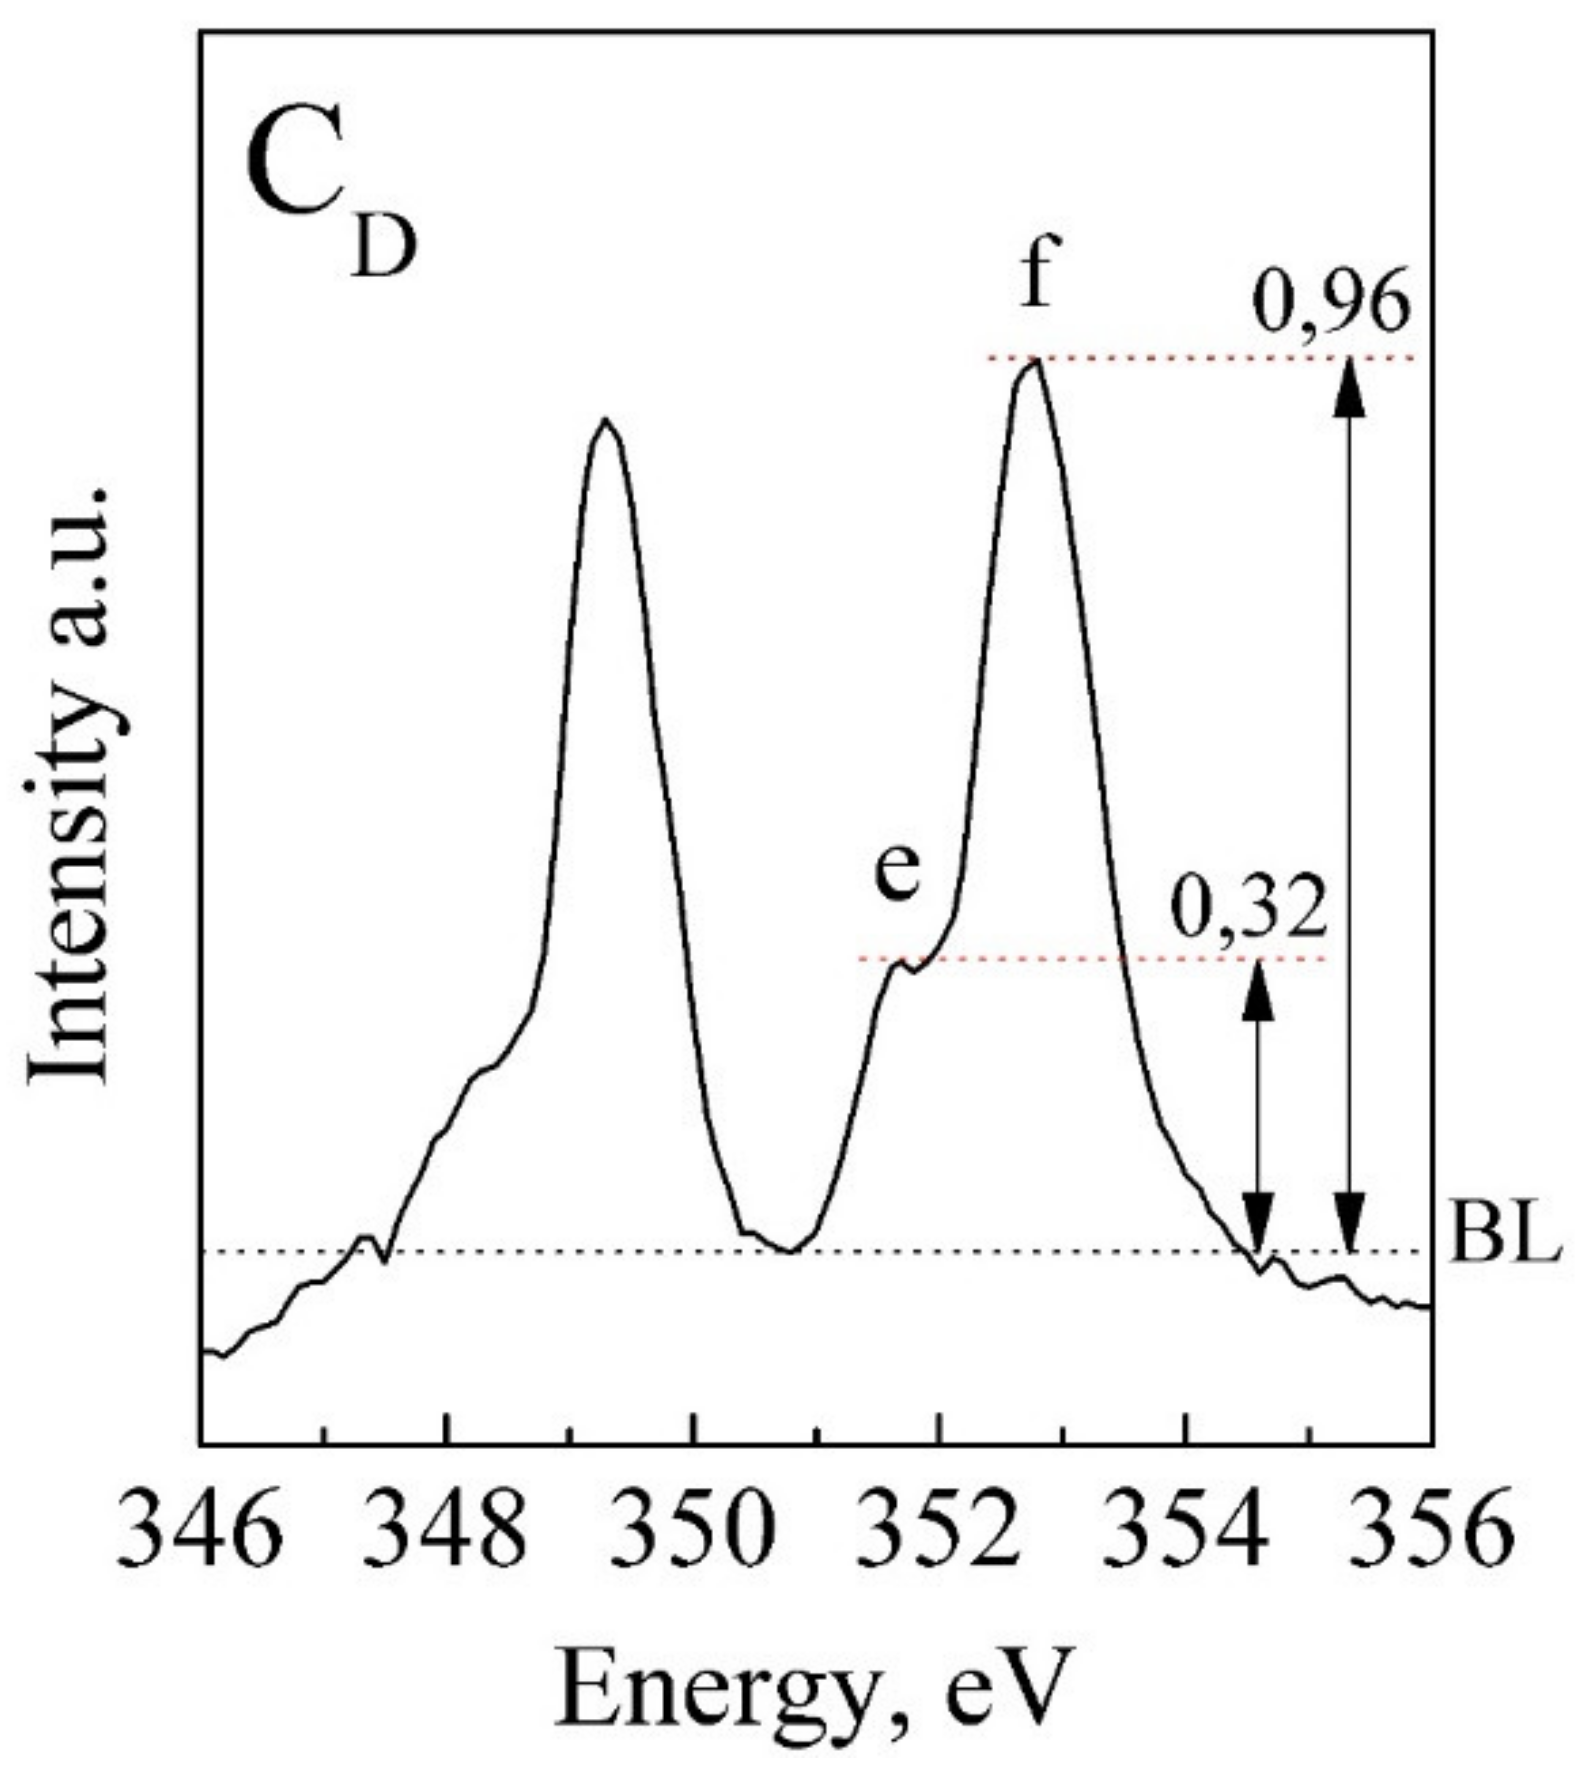
3.2. XANES Spectroscopy
4. Discussion
5. Limitations
6. Conclusions
Author Contributions
Funding
Institutional Review Board Statement
Data Availability Statement
Conflicts of Interest
Ethical Permission
References
- Wilmers, J.; Bargmann, S. Nature’s design solutions in dental enamel: Uniting high strength and extreme damage resistance. Acta Biomater. 2020, 107, 1–24. [Google Scholar] [CrossRef]
- Chieruzzi, M.; Pagano, S.; Moretti, S.; Pinna, R.; Milia, E.; Torre, L.; Eramo, S. Nanomaterials for Tissue Engineering In Dentistry. Nanomaterials 2016, 6, 134. [Google Scholar] [CrossRef] [PubMed]
- Shao, C.; Jin, B.; Mu, Z.; Lu, H.; Zhao, Y.; Wu, Z.; Yan, L.; Zhang, Z.; Zhou, Y.; Pan, H.; et al. Repair of tooth enamel by a biomimetic mineralization frontier ensuring epitaxial growth. Sci. Adv. 2019, 5, eaaw9569. [Google Scholar] [CrossRef] [PubMed] [Green Version]
- Riau, A.K.; Venkatraman, S.S.; Mehta, J.S. Biomimetic vs. Direct Approach to Deposit Hydroxyapatite on the Surface of Low Melting Point Polymers for Tissue Engineering. Nanomaterials 2020, 10, 2162. [Google Scholar] [CrossRef] [PubMed]
- Seredin, P.; Goloshchapov, D.; Ippolitov, Y.; Vongsvivut, J. Engineering of a Biomimetic Interface between a Native Dental Tissue and Restorative Composite and Its Study Using Synchrotron FTIR Microscopic Mapping. Int. J. Mol. Sci. 2021, 22, 6510. [Google Scholar] [CrossRef]
- Ding, L.; Han, S.; Wang, K.; Zheng, S.; Zheng, W.; Peng, X.; Niu, Y.; Li, W.; Zhang, L. Remineralization of enamel caries by an amelogenin-derived peptide and fluoride in vitro. Regen. Biomater. 2020, 7, 283–292. [Google Scholar] [CrossRef] [PubMed] [Green Version]
- Li, H.; Tao, S.; Yan, Y.; Lv, G.; Gu, Y.; Luo, X.; Yang, L.; Wei, J. Degradability and cytocompatibility of tricalcium phosphate/poly(amino acid) composite as bone tissue implants in orthopaedic surgery. J. Biomater. Sci. Polym. Ed. 2014, 25, 1194–1210. [Google Scholar] [CrossRef] [PubMed]
- Wu, X.; Zhao, X.; Li, Y.; Yang, T.; Yan, X.; Wang, K. In situ synthesis carbonated hydroxyapatite layers on enamel slices with acidic amino acids by a novel two-step method. Mater. Sci. Eng. C 2015, 54, 150–157. [Google Scholar] [CrossRef]
- Li, H.; Gong, M.; Yang, A.; Ma, J.; Li, X.; Yan, Y. Degradable biocomposite of nano calcium- deficient hydroxyapatite-multi(amino acid) copolymer. Int. J. Nanomed. 2012, 7, 1287–1295. [Google Scholar] [CrossRef] [Green Version]
- Fereshteh, Z.; Mallakpour, F.; Fathi, M.; Mallakpour, S.; Bagri, A. Surface modification of Mg-doped fluoridated hydroxyapatite nanoparticles using bioactive amino acids as the coupling agent for biomedical applications. Ceram. Int. 2015, 41, 10079–10086. [Google Scholar] [CrossRef]
- Wang, P.; Liu, P.; Peng, H.; Luo, X.; Yuan, H.; Zhang, J.; Yan, Y. Biocompatibility evaluation of dicalcium phosphate/calcium sulfate/poly (amino acid) composite for orthopedic tissue engineering in vitro and in vivo. J. Biomater. Sci. Polym. Ed. 2016, 27, 1170–1186. [Google Scholar] [CrossRef]
- Gómez-Morales, J.; Delgado-López, J.M.; Iafisco, M.; Hernández-Hernández, A.; Prat, M. Amino Acidic Control of Calcium Phosphate Precipitation by Using the Vapor Diffusion Method in Microdroplets. Cryst. Growth Des. 2011, 11, 4802–4809. [Google Scholar] [CrossRef]
- Tavafoghi, M.; Cerruti, M. The role of amino acids in hydroxyapatite mineralization. J. R. Soc. Interface 2016, 13, 20160462. [Google Scholar] [CrossRef] [Green Version]
- Rodríguez-Lozano, F.J.; Serrano-Belmonte, I.; Pérez Calvo, J.C.; Coronado-Parra, M.T.; Bernabeu-Esclapez, A.; Moraleda, J.M. Effects of two low-shrinkage composites on dental stem cells (viability, cell damaged or apoptosis and mesenchymal markers expression). J. Mater. Sci. Mater. Med. 2013, 24, 979–988. [Google Scholar] [CrossRef]
- Latta, M.A.; Tsujimoto, A.; Takamizawa, T.; Barkmeier, W.W. Enamel and Dentin Bond Durability of Self-Adhesive Restorative Materials. J. Adhes. Dent. 2020, 22, 99–105. [Google Scholar] [CrossRef]
- Upadhyay, A.; Pillai, S.; Khayambashi, P.; Sabri, H.; Lee, K.T.; Tarar, M.; Zhou, S.; Harb, I.; Tran, S.D. Biomimetic Aspects of Oral and Dentofacial Regeneration. Biomimetics 2020, 5, 51. [Google Scholar] [CrossRef]
- Perdigão, J. Current perspectives on dental adhesion: (1) Dentin adhesion—Not there yet. Jpn. Dent. Sci. Rev. 2020, 56, 190–207. [Google Scholar] [CrossRef]
- Barot, T.; Rawtani, D.; Kulkarni, P. Nanotechnology-based materials as emerging trends for dental applications. Rev. Adv. Mater. Sci. 2021, 60, 173–189. [Google Scholar] [CrossRef]
- Almahdy, A.; Downey, F.; Sauro, S.; Cook, R.; Sherriff, M.; Richards, D.; Watson, T.; Banerjee, A.; Festy, F. Microbiochemical Analysis of Carious Dentine Using Raman and Fluorescence Spectroscopy. Caries Res. 2012, 46, 432–440. [Google Scholar] [CrossRef]
- Chen, Q.G.; Zhu, H.H.; Xu, Y.; Lin, B.; Chen, H. Quantitative method to assess caries via fluorescence imaging from the perspective of autofluorescence spectral analysis. Laser Phys. 2015, 25, 85601. [Google Scholar] [CrossRef]
- Barani, A.; Bush, M.B.; Lawn, B.R. Effect of property gradients on enamel fracture in human molar teeth. J. Mech. Behav. Biomed. Mater. 2012, 15, 121–130. [Google Scholar] [CrossRef]
- Zheng, L.; Zheng, J.; Weng, L.; Qian, L.; Zhou, Z. Effect of remineralization on the nanomechanical properties and microtribological behaviour of acid-eroded human tooth enamel. Wear 2011, 271, 2297–2304. [Google Scholar] [CrossRef]
- Ember, K.J.I.; Hoeve, M.A.; McAughtrie, S.L.; Bergholt, M.S.; Dwyer, B.; Stevens, M.M.; Faulds, K.; Forbes, S.; Campbell, C.J. Raman spectroscopy and regenerative medicine: A review. NPJ Regen. Med. 2017, 2, 1–10. [Google Scholar] [CrossRef]
- Elumalai, S.; Managó, S.; De Luca, A.C. Raman Microscopy: Progress in Research on Cancer Cell Sensing. Sensors 2020, 20, 5525. [Google Scholar] [CrossRef]
- Srot, V.; Bussmann, B.; Salzberger, U.; Koch, C.T.; van Aken, P.A. Linking Microstructure and Nanochemistry in Human Dental Tissues. Microsc. Microanal. 2012, 18, 509–523. [Google Scholar] [CrossRef] [PubMed]
- Rajendran, J.; Gialanella, S.; Aswath, P. XANES analysis of dried and calcined bones. Mater. Sci. Eng. C 2013, 33, 3968–3979. [Google Scholar] [CrossRef]
- Goloshchapov, D.; Gushchin, M.; Kashkarov, V.; Seredin, P.; Ippolitov, Y.; Khmelevsky, N.; Aksenenko, A. XPS and XANES studies of biomimetic composites based on B-type nano-hydroxyapatite. Results Phys. 2018, 9, 1386–1387. [Google Scholar] [CrossRef]
- Hurtarte, L.C.C.; Amorim, H.C.S.; Kruse, J.; Cezar, J.C.; Klysubun, W.; Prietzel, J. A Novel Approach for the Quantification of Different Inorganic and Organic Phosphorus Compounds in Environmental Samples by P L2,3-Edge X-ray Absorption Near-Edge Structure (XANES) Spectroscopy. Environ. Sci. Technol. 2020, 54, 2812–2820. [Google Scholar] [CrossRef]
- Zougrou, I.M.; Katsikini, M.; Brzhezinskaya, M.; Pinakidou, F.; Papadopoulou, L.; Tsoukala, E.; Paloura, E.C. Ca L2,3-edge XANES and Sr K-edge EXAFS study of hydroxyapatite and fossil bone apatite. Naturwissenschaften 2016, 103, 1–12. [Google Scholar] [CrossRef]
- Sorrentino, A.; Malucelli, E.; Rossi, F.; Cappadone, C.; Farruggia, G.; Moscheni, C.; Perez-Berna, A.; Conesa, J.; Colletti, C.; Roveri, N.; et al. Calcite as a Precursor of Hydroxyapatite in the Early Biomineralization of Differentiating Human Bone-Marrow Mesenchymal Stem Cells. Int. J. Mol. Sci. 2021, 22, 4939. [Google Scholar] [CrossRef]
- Goloshchapov, D.; Lenshin, A.; Savchenko, D.; Seredin, P. Importance of defect nanocrystalline calcium hydroxyapatite characteristics for developing the dental biomimetic composites. Results Phys. 2019, 13, 102158. [Google Scholar] [CrossRef]
- Spizzirri, P.; Cochrane, N.; Prawer, S.; Reynolds, E. A Comparative Study of Carbonate Determination in Human Teeth Using Raman Spectroscopy. Caries Res. 2012, 46, 353–360. [Google Scholar] [CrossRef] [PubMed]
- Jegova, G.; Titorenkova, R.; Rashkova, M.; Mihailova, B. Raman and IR reflection micro-spectroscopic study of Er:YAG laser treated permanent and deciduous human teeth. J. Raman Spectrosc. 2013, 44, 1483–1490. [Google Scholar] [CrossRef]
- Goloshchapov, D.; Kashkarov, V.; Rumyantseva, N.; Seredin, P.; Lenshin, A.; Agapov, B.; Domashevskaya, E. Synthesis of nanocrystalline hydroxyapatite by precipitation using hen’s eggshell. Ceram. Int. 2012, 39, 4539–4549. [Google Scholar] [CrossRef]
- Yusufoğlu, Y.; Akinc, M. Effect of pH on the Carbonate Incorporation into the Hydroxyapatite Prepared by an Oxidative Decomposition of Calcium-EDTA Chelate. J. Am. Ceram. Soc. 2007, 91, 77–82. [Google Scholar] [CrossRef]
- McElderry, J.-D.P.; Zhu, P.; Mroue, K.; Xu, J.; Pavan, B.; Fang, M.; Zhao, G.; McNerny, E.; Kohn, D.H.; Franceschi, R.T.; et al. Crystallinity and compositional changes in carbonated apatites: Evidence from 31P solid-state NMR, Raman, and AFM analysis. J. Solid State Chem. 2013, 206, 192–198. [Google Scholar] [CrossRef] [Green Version]
- Stojanović, Z.S.; Veselinović, L.; Marković, S.; Ignjatovic, N.; Uskokovic, D. Hydrothermal Synthesis of Nanosized Pure and Cobalt-Exchanged Hydroxyapatite. Mater. Manuf. Process. 2009, 24, 1096–1103. [Google Scholar] [CrossRef]
- Seredin, P.; Goloshchapov, D.; Kashkarov, V.; Ippolitov, Y.; Ippolitov, I.; Vongsvivut, J. To the Question on the Use of Multivariate Analysis and 2D Visualisation of Synchrotron ATR-FTIR Chemical Imaging Spectral Data in the Diagnostics of Biomimetic Sound Dentin/Dental Composite Interface. Diagnostics 2021, 11, 1294. [Google Scholar] [CrossRef]
- Antonakos, A.; Liarokapis, E.; Leventouri, T. Micro-Raman and FTIR studies of synthetic and natural apatites. Biomaterials 2007, 28, 3043–3054. [Google Scholar] [CrossRef]
- Bērziņš, K.; Sutton, J.J.; Loch, C.; Beckett, D.; Wheeler, B.J.; Drummond, B.K.; Fraser-Miller, S.J.; Gordon, K.C. Application of low-wavenumber Raman spectroscopy to the analysis of human teeth. J. Raman Spectrosc. 2019, 50, 1375–1387. [Google Scholar] [CrossRef]
- Calderín, L.; Dunfield, D.; Stott, M.J. Shell-model study of the lattice dynamics of hydroxyapatite. Phys. Rev. B 2005, 72, 224304. [Google Scholar] [CrossRef]
- Markovic, M.; Fowler, B.; Tung, M. Preparation and comprehensive characterization of a calcium hydroxyapatite reference material. J. Res. Natl. Inst. Stand. Technol. 2004, 109, 553–568. [Google Scholar] [CrossRef] [PubMed]
- Zelic, K.; Milovanovic, P.; Rakočević, Z.; Aškrabić, S.; Potočnik, J.; Popovic, M.; Djuric, M. Nano-structural and compositional basis of devitalized tooth fragility. Dent. Mater. 2014, 30, 476–486. [Google Scholar] [CrossRef] [PubMed]
- Shah, F.A. Micro-Raman Spectroscopy Reveals the Presence of Octacalcium Phosphate and Whitlockite in Association with Bacteria-Free Zones Within the Mineralized Dental Biofilm. Microsc. Microanal. 2019, 25, 129–134. [Google Scholar] [CrossRef]
- Robin, M.; Von Euw, S.; Renaudin, G.; Gomes, S.; Krafft, J.-M.; Nassif, N.; Azaïs, T.; Costentin, G. Insights into OCP identification and quantification in the context of apatite biomineralization. CrystEngComm 2020, 22, 2728–2742. [Google Scholar] [CrossRef]
- Penel, G.; Leroy, G.; Rey, C.; Bres, E. MicroRaman Spectral Study of the PO 4 and CO 3 Vibrational Modes in Synthetic and Biological Apatites. Calcif. Tissue Int. 1998, 63, 475–481. [Google Scholar] [CrossRef]
- Mihály, J.; Gombás, V.; Afishah, A.; Mink, J. FT-Raman investigation of human dental enamel surfaces. J. Raman Spectrosc. 2009, 40, 898–902. [Google Scholar] [CrossRef]
- Pezzotti, G.; Zhu, W.; Boffelli, M.; Adachi, T.; Ichioka, H.; Yamamoto, T.; Marunaka, Y.; Kanamura, N. Vibrational algorithms for quantitative crystallographic analyses of hydroxyapatite-based biomaterials: I, theoretical foundations. Anal. Bioanal. Chem. 2015, 407, 3325–3342. [Google Scholar] [CrossRef]
- Sowa, M.G.; Popescu, D.P.; Werner, J.; Hewko, M.; Ko, A.C.-T.; Payette, J.; Dong, C.C.S.; Cleghorn, B.; Choo-Smith, L.-P. Precision of Raman depolarization and optical attenuation measurements of sound tooth enamel. Anal. Bioanal. Chem. 2006, 387, 1613–1619. [Google Scholar] [CrossRef]
- Alebrahim, M.A.; Krafft, C.; Sekhaneh, W.; Sigusch, B.; Popp, J. ATR-FTIR and Raman spectroscopy of primary and permanent teeth. Biomed. Spectrosc. Imaging 2014, 3, 15–27. [Google Scholar] [CrossRef]
- Crane, N.J.; Popescu, V.; Morris, M.D.; Steenhuis, P.; Ignelzi, M.A. Raman spectroscopic evidence for octacalcium phosphate and other transient mineral species deposited during intramembranous mineralization. Bone 2006, 39, 434–442. [Google Scholar] [CrossRef]
- Xu, C.; Karan, K.; Yao, X.; Wang, Y. Molecular structural analysis of noncarious cervical sclerotic dentin using Raman spectroscopy. J. Raman Spectrosc. 2009, 40, 1780–1785. [Google Scholar] [CrossRef]
- Awonusi, A.; Morris, M.D.; Tecklenburg, M.M.J. Carbonate Assignment and Calibration in the Raman Spectrum of Apatite. Calcif. Tissue Int. 2007, 81, 46–52. [Google Scholar] [CrossRef]
- Taylor, E.A.; Mileti, C.J.; Ganesan, S.; Kim, J.H.; Donnelly, E. Measures of Bone Mineral Carbonate Content and Mineral Maturity/Crystallinity for FT-IR and Raman Spectroscopic Imaging Differentially Relate to Physical–Chemical Properties of Carbonate-Substituted Hydroxyapatite. Calcif. Tissue Int. 2021, 109, 77–91. [Google Scholar] [CrossRef]
- Wang, Y.; Yao, X. Morphological/chemical imaging of demineralized dentin layer in its natural, wet state. Dent. Mater. 2010, 26, 433–442. [Google Scholar] [CrossRef] [Green Version]
- Stammeier, J.A.; Purgstaller, B.; Hippler, D.; Mavromatis, V.; Dietzel, M. In-situ Raman spectroscopy of amorphous calcium phosphate to crystalline hydroxyapatite transformation. MethodsX 2018, 5, 1241–1250. [Google Scholar] [CrossRef]
- Calzolari, A.; Pavan, B.; Curtarolo, S.; Nardelli, M.B.; Fornari, M. Vibrational spectral fingerprinting for chemical recognition of biominerals. ChemPhysChem 2020, 21, 770–778. [Google Scholar] [CrossRef]
- Nicholls, M.; Bancroft, G.; Kasrai, M.; Norton, P.; Frazer, B.; De Stasio, G. Improvement of PEEM images from thick inhomogeneous antiwear films using a thin Pt coating. Tribol. Lett. 2005, 18, 453–462. [Google Scholar] [CrossRef]
- Kruse, J.; Leinweber, P.; Eckhardt, K.-U.; Godlinski, F.; Hu, Y.; Zuin, L. Phosphorus L 2,3-edge XANES: Overview of reference compounds. J. Synchrotron Radiat. 2009, 16, 247–259. [Google Scholar] [CrossRef]
- Sutherland, D.G.J.; Kasrai, M.; Bancroft, G.M.; Liu, Z.F.; Tan, K.H. SiL- andK-edge x-ray-absorption near-edge spectroscopy of gas-phase Si(CH3)x(OCH3)4−x: Models for solid-state analogs. Phys. Rev. B 1993, 48, 14989–15001. [Google Scholar] [CrossRef]
- Cosmidis, J.; Benzerara, K.; Nassif, N.; Tyliszczak, T.; Bourdelle, F. Characterization of Ca-phosphate biological materials by scanning transmission X-ray microscopy (STXM) at the Ca L2,3-, P L2,3- and C K-edges. Acta Biomater. 2015, 12, 260–269. [Google Scholar] [CrossRef] [Green Version]
- Pereira, G.; Lachenwitzer, A.; Munoz-Paniagua, D.; Kasrai, M.; Norton, P.R.; Abrecht, M.; Gilbert, P. The role of the cation in antiwear films formed from ZDDP on 52100 steel. Tribol. Lett. 2006, 23, 109–119. [Google Scholar] [CrossRef]
- Kahil, K.; Varsano, N.; Sorrentino, A.; Pereiro, E.; Rez, P.; Weiner, S.; Addadi, L. Cellular pathways of calcium transport and concentration toward mineral formation in sea urchin larvae. Proc. Natl. Acad. Sci. USA 2020, 117, 30957–30965. [Google Scholar] [CrossRef]
- Metzler, R.A.; Rez, P. Polarization Dependence of Aragonite Calcium L-Edge XANES Spectrum Indicates c and b Axes Orientation. J. Phys. Chem. B 2014, 118, 6758–6766. [Google Scholar] [CrossRef]
- Politi, Y.; Metzler, R.A.; Abrecht, M.; Gilbert, B.; Wilt, F.H.; Sagi, I.; Addadi, L.; Weiner, S.; Gilbert, P.U.P.A. Transformation mechanism of amorphous calcium carbonate into calcite in the sea urchin larval spicule. Proc. Natl. Acad. Sci. USA 2008, 105, 17362–17366. [Google Scholar] [CrossRef] [Green Version]
- Goloshchapov, D.; Kashkarov, V.; Ippolitov, Y.; Prutskij, T.; Seredin, P. Early screening of dentin caries using the methods of Micro-Raman and laser-induced fluorescence spectroscopy. Results Phys. 2018, 10, 346–347. [Google Scholar] [CrossRef]
- Demirkiran, H.; Hu, Y.; Zuin, L.; Appathurai, N.; Aswath, P.B. XANES analysis of calcium and sodium phosphates and silicates and hydroxyapatite–Bioglass®45S5 co-sintered bioceramics. Mater. Sci. Eng. C 2011, 31, 134–143. [Google Scholar] [CrossRef]
- Patel, M.; Aswath, P.B. Morphology, structure and chemistry of extracted diesel soot: Part II: X-ray absorption near edge structure (XANES) spectroscopy and high resolution transmission electron microscopy. Tribol. Int. 2012, 52, 17–28. [Google Scholar] [CrossRef]
- Yin, Z.; Kasrai, M.; Bancroft, G.M.; Tan, K.H.; Feng, X. X-Ray-Absorption Spectroscopic Studies of Sodium Polyphosphate Glasses. Phys. Rev. B Condens. Matter 1995, 51, 742–750. [Google Scholar] [CrossRef]
- Naftel, S.J.; Sham, T.K.; Yiu, Y.M.; Yates, B.W. Calcium L-edge XANES study of some calcium compounds. J. Synchrotron Radiat. 2001, 8, 255–257. [Google Scholar] [CrossRef] [Green Version]
- Geng, G.; Myers, R.J.; Kilcoyne, A.L.; Ha, J.; Monteiro, P.J. Ca L 2,3—edge near edge X-ray absorption fine structure of tricalcium aluminate, gypsum, and calcium (sulfo)aluminate hydrates. Am. Mineral. 2017, 102, 900–908. [Google Scholar] [CrossRef] [Green Version]
- Benzerara, K.; Yoon, T.H.; Tyliszczak, T.; Constantz, B.; Spormann, A.M.; Brown, G.E. Scanning transmission X-ray microscopy study of microbial calcification. Geobiology 2004, 2, 249–259. [Google Scholar] [CrossRef]
- Stifler, C.A.; Wittig, N.K.; Sassi, M.; Sun, C.-Y.; Marcus, M.A.; Birkedal, H.; Beniash, E.; Rosso, K.M.; Gilbert, P.U.P.A. X-ray Linear Dichroism in Apatite. J. Am. Chem. Soc. 2018, 140, 11698–11704. [Google Scholar] [CrossRef] [PubMed] [Green Version]
- Beniash, E.; Metzler, R.A.; Lam, R.S.; Gilbert, P. Transient amorphous calcium phosphate in forming enamel. J. Struct. Biol. 2009, 166, 133–143. [Google Scholar] [CrossRef] [PubMed] [Green Version]
- Konashuk, A.S.; Samoilenko, D.; Klyushin, Y.; Svirskiy, G.I.; Sakhonenkov, S.S.; Brykalova, X.O.; Kuz’Mina, M.A.; Filatova, E.O.; Vinogradov, A.S.; Pavlychev, A. Thermal changes in young and mature bone nanostructure probed with Ca 2p excitations. Biomed. Phys. Eng. Express 2018, 4, 035031. [Google Scholar] [CrossRef]
- Rulis, P.; Ouyang, L.; Ching, W.Y. Electronic structure and bonding in calcium apatite crystals: Hydroxyapatite, fluorapatite, chlorapatite, and bromapatite. Phys. Rev. B 2004, 70, 155104. [Google Scholar] [CrossRef]
- Zahn, D.; Hochrein, O. On the composition and atomic arrangement of calcium-deficient hydroxyapatite: An ab-initio analysis. J. Solid State Chem. 2008, 181, 1712–1716. [Google Scholar] [CrossRef]
- Adar, F. Depth Resolution of the Raman Microscope: Optical Limitations and Sample Characteristics. Spectrosc. Springf. Eugene Duluth 2010, 25, 16–23. [Google Scholar]


| Designation | Description |
|---|---|
| HS | Stoichiometric hydroxyapatite Ca5(PO4)3(OH)2 Ca/P~1.67 |
| H1 | Carbonate-substituted hydroxyapatite , Ca/P~1.77 ratio |
| H2 | Carbonate-substituted hydroxyapatite , Ca/P~1.85 ratio |
| H3 | Carbonate-substituted hydroxyapatite , Ca/P~2.04 ratio |
| CE | A synthesised biomimetic composite that imitates the properties of tooth enamel, with 5% organic component and 95% carbonate-substituted hydroxyapatite |
| CD | A synthesised biomimetic composite that imitates the properties of dental dentine with 25% organic component and 75% carbonate-substituted hydroxyapatite |
| Eexp | Natural tooth enamel |
| Dexp | The natural dentine of the tooth |
| Eref | Tooth enamel, according to [25] |
| Dref | The dentine of the tooth, according to [25] |
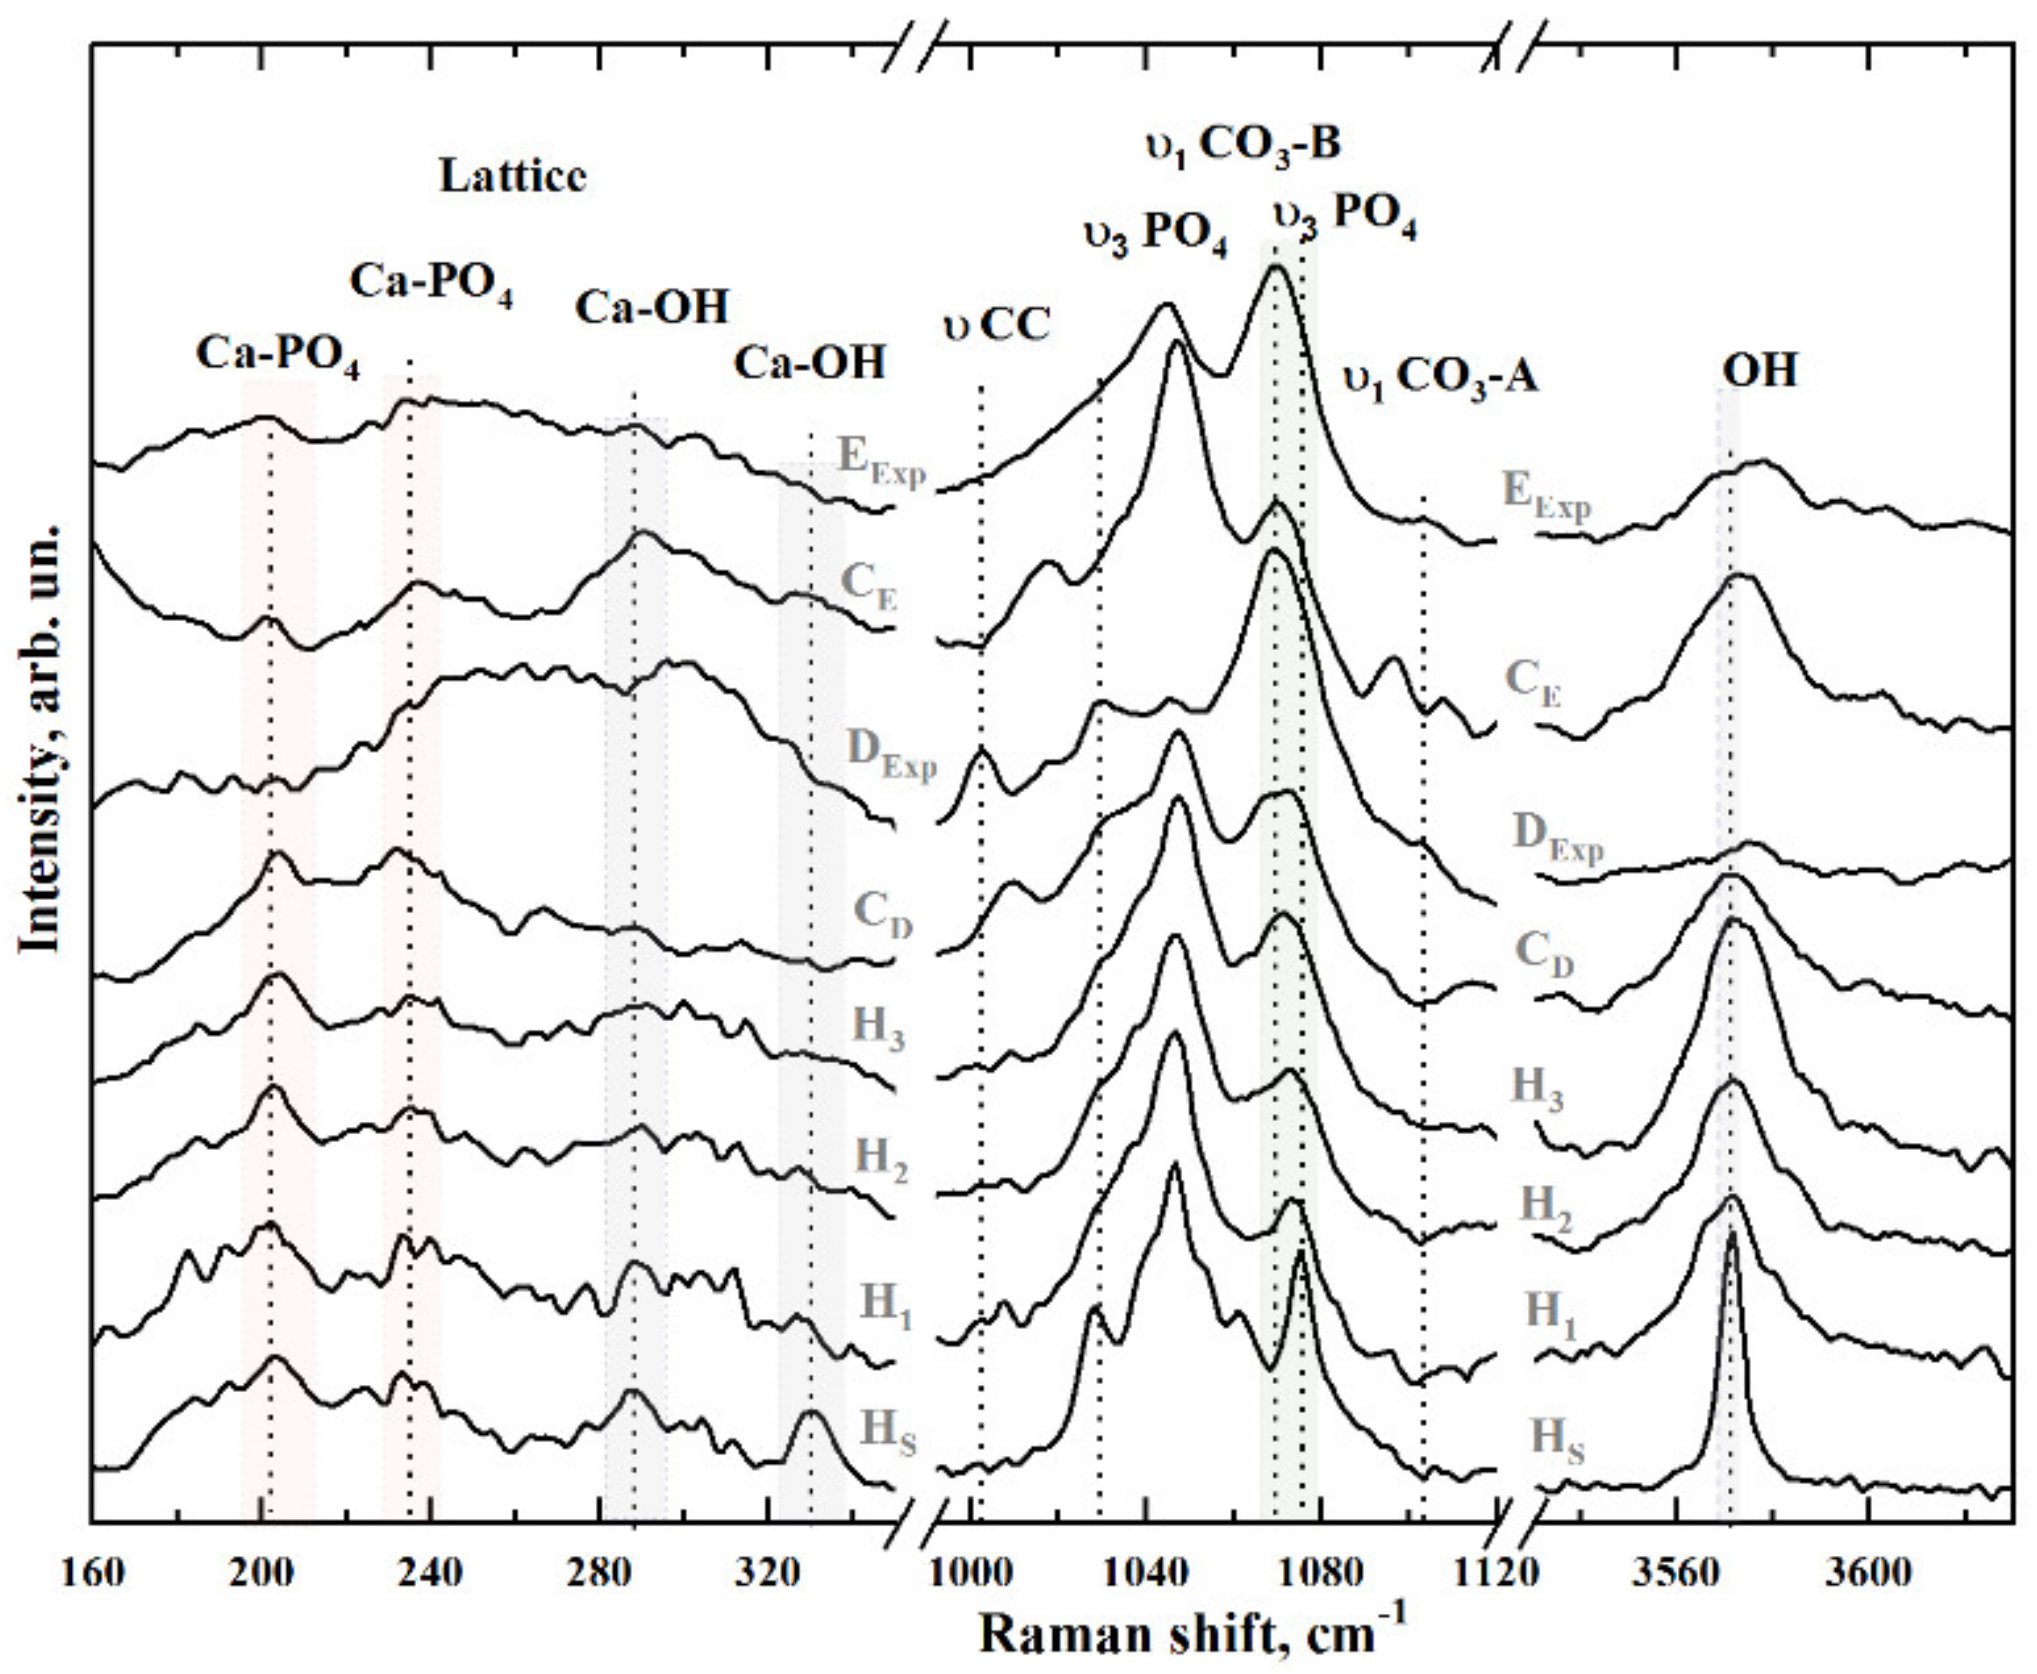
| Bond | Wavenumber, cm−1 | Assignment | References |
|---|---|---|---|
| СаII–OH | 183 | Lattice | [39] |
| Са–PO4 | 204 | Lattice | [39,40,41] |
| Са–PO4 | 233 | Lattice | [39,40,41] |
| Са–PO4 | 265 | Lattice | [39,40,41] |
| СаII–OH | 276 | Translation | [39,40,41] |
| Са–PO4 | 285–289 | Libration | [39,40,41] |
| СаII–OH | 305–312 | Translation | [39,40,41,42] |
| СаII–OH | 330 | Translation | [40,42] |
| υ2 HPO4 | 413 | OCP, dentine | [43,44,45] |
| υ2 PO4 | 431 | O-P-O bending, υ2 | [40,43,46,47,48,49] |
| υ2 PO4 | 447 | O-P-O bending, υ2 | [40,43,46,47,48,49] |
| υ4 PO4 | 579 | O-P-O bending, υ4 | [40,43,46,47,48,49] |
| υ4 PO4 | 590 | O-P-O bending, υ4 | [40,43,46,47,48,49] |
| υ4 PO4 | 607 | O-P-O bending, υ4 | [40,43,46,47,48,49] |
| υ4 PO4 | 614 | O-P-O bending, υ4 | [40,43,46,47,48,49] |
| δ(CCH) | 854–857 | Proline, collagen (Pro, Tyr) | [40,50] |
| ν(CC) | 875 | aromatic (Hyp, Tyr) | [40,50] |
| υ1 PO4 | 945–925 | OCP, dentine | [43,44,45,51] |
| υ1 PO4 | 959 | Enamel, dentine | [40,50] |
| υ1 PO4 | 962 | P-O stretching | [40,43,46,47,48,49] |
| ν (CC) | 1003.5 | phenyl ring, dentine | [50,52] |
| HPO4 | 1005 | OCP Sym stretching | [40,50] |
| υ3 PO4 | 1028 | P-O asymmetric stretching | [32,33,40,46,53,54] |
| Pyridine ring | 1034.2 | Pyridine ring, dentine | [32,33,40,46,53,54] |
| υ3 PO4 | 1040 | P-O asymmetric stretching | [32,33,40,46,53,54] |
| υ3 PO4 | 1047 | P-O asymmetric stretching | [32,33,40,46,53,54] |
| υ3 PO4 | 1052 | P-O asymmetric stretching | [32,33,40,46,53,54] |
| υ1 СO3 B-type | 1070–1072 | PO4 by CO3 substitution | [32,33,40,46,53,54] |
| υ3 PO4 | 1076–1077 | P-O asymmetric stretching | [32,33,40,46,53,54] |
| υ1 СO3 A-type | 1106 | OH by CO3 substitution | [32,43,46] |
| δ(NH) | 1241–1245, 1268 | Amide III | [33,40,55] |
| δ(CH) | 1450 | C-H Deformation | [33,40,55] |
| (C=O)/NH | 1670 m 1668 w ν | (C=O) Stretch, Amide I | [33,40,55] |
| OH | 3570 | OH stretch | [33,46] |
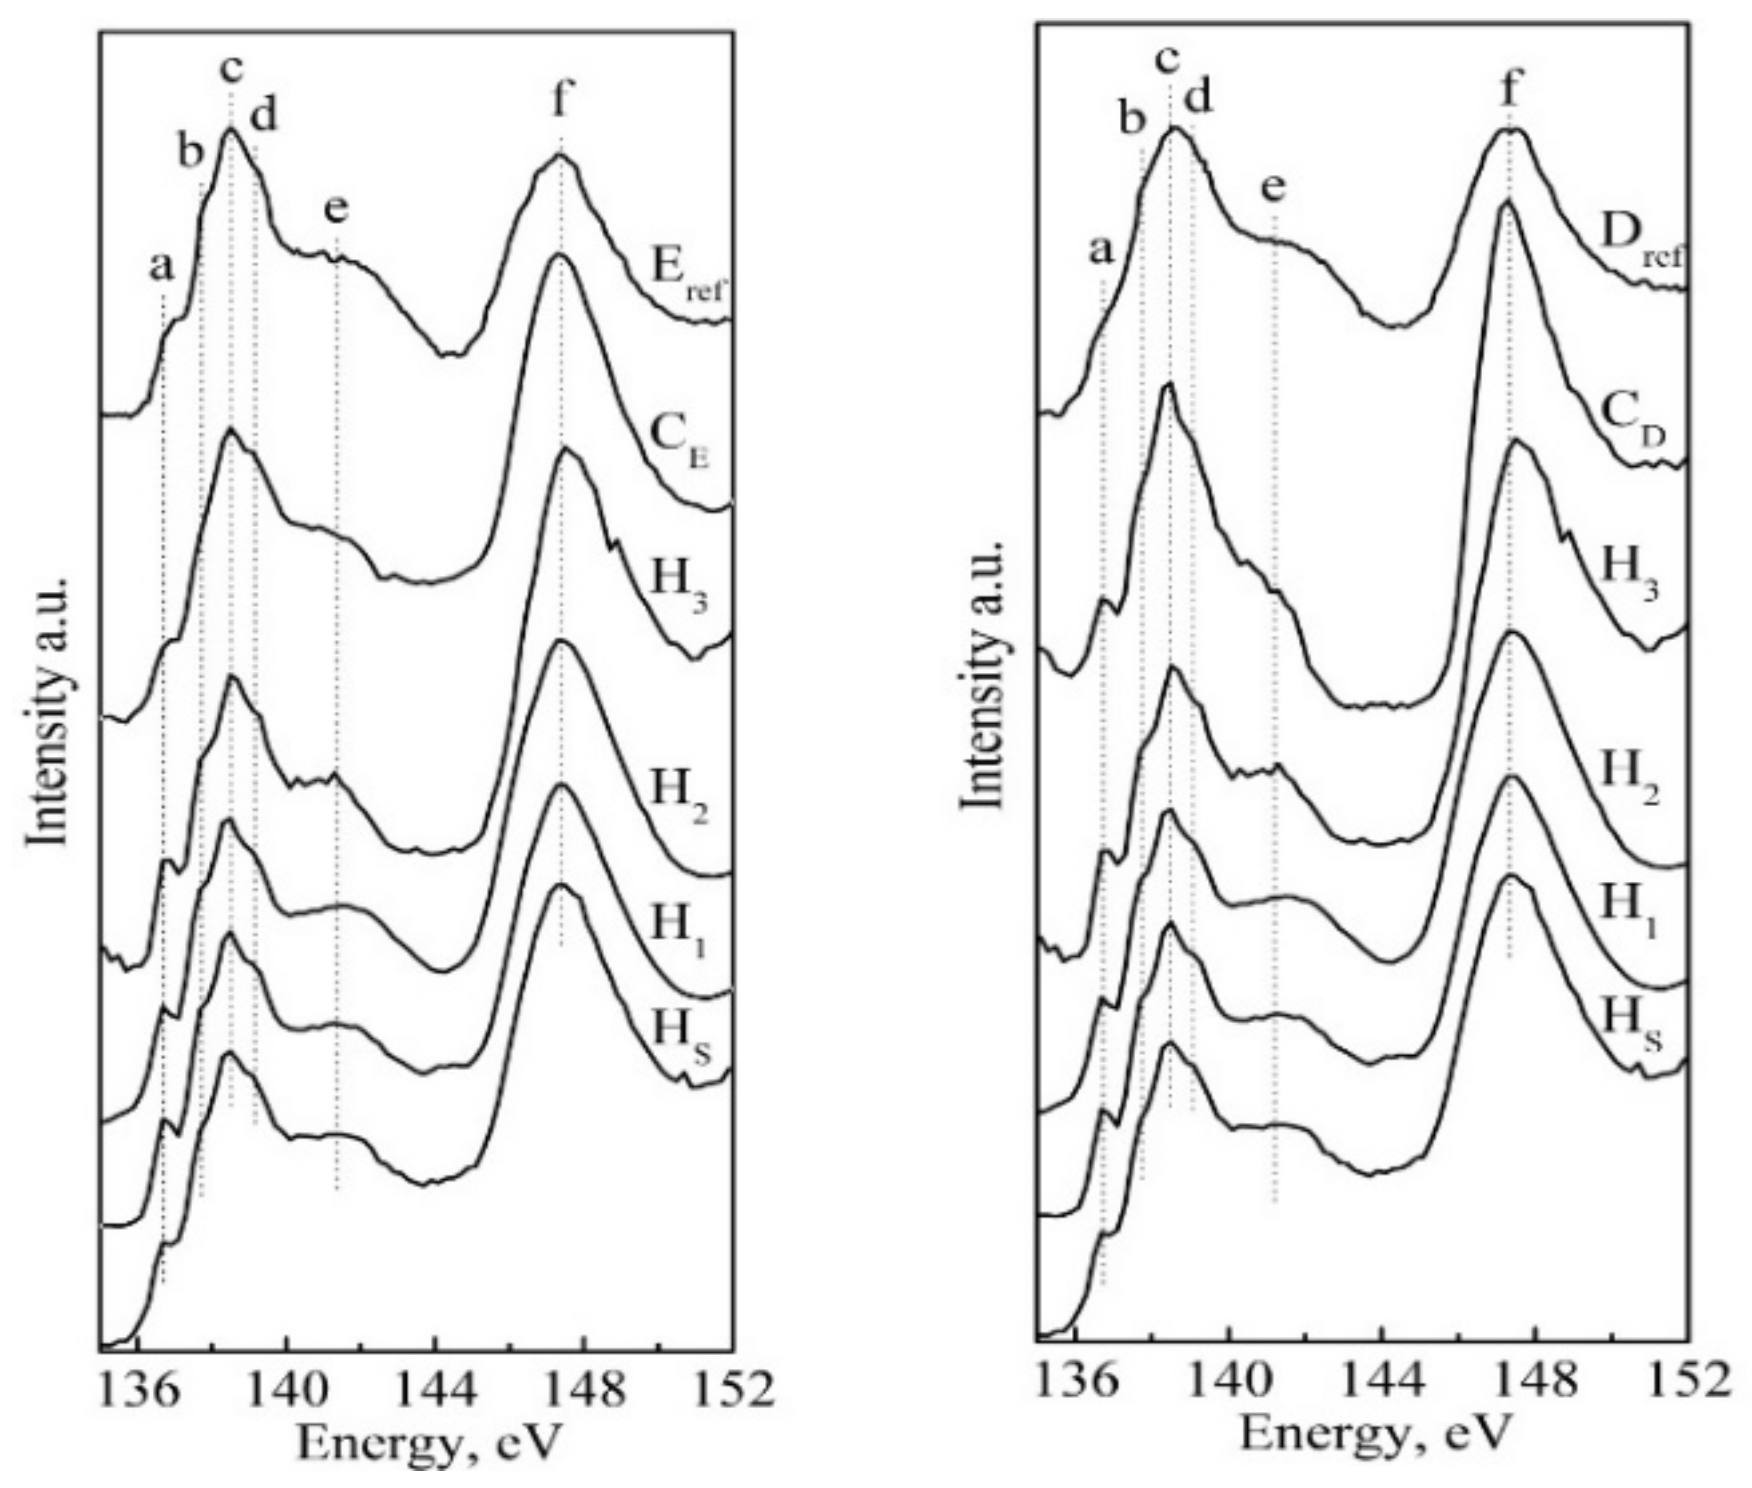
| Sample | Positions of Features, eV | |||||
|---|---|---|---|---|---|---|
| a | b | c | d | e | f | |
| HS | 136.7 | 137.7 | 138.5 | 139.1 | 141.8 | 147.5 |
| H1 | 136.8 | 137.8 | 138.4 | 139.2 | 141.8 | 147.4 |
| H2 | 136.7 | 137.7 | 138.4 | 139.2 | 141.8 | 147.5 |
| H3 | 136.8 | 137.8 | 138.6 | 139.2 | 141.4 | 147.6 |
| ERef [25] | 136.8 | 137.8 | 138.5 | 139.2 | 141.9 | 147.3 |
| CE | 136.8 | 137.7 | 138.5 | 139.2 | 141.8 | 147.4 |
| DRef [25] | 136.6 | 137.8 | 138.5 | 139.4 | 142.1 | 147.3 |
| CD | 136.7 | 137.8 | 138.5 | 139.1 | 141.4 | 147.3 |
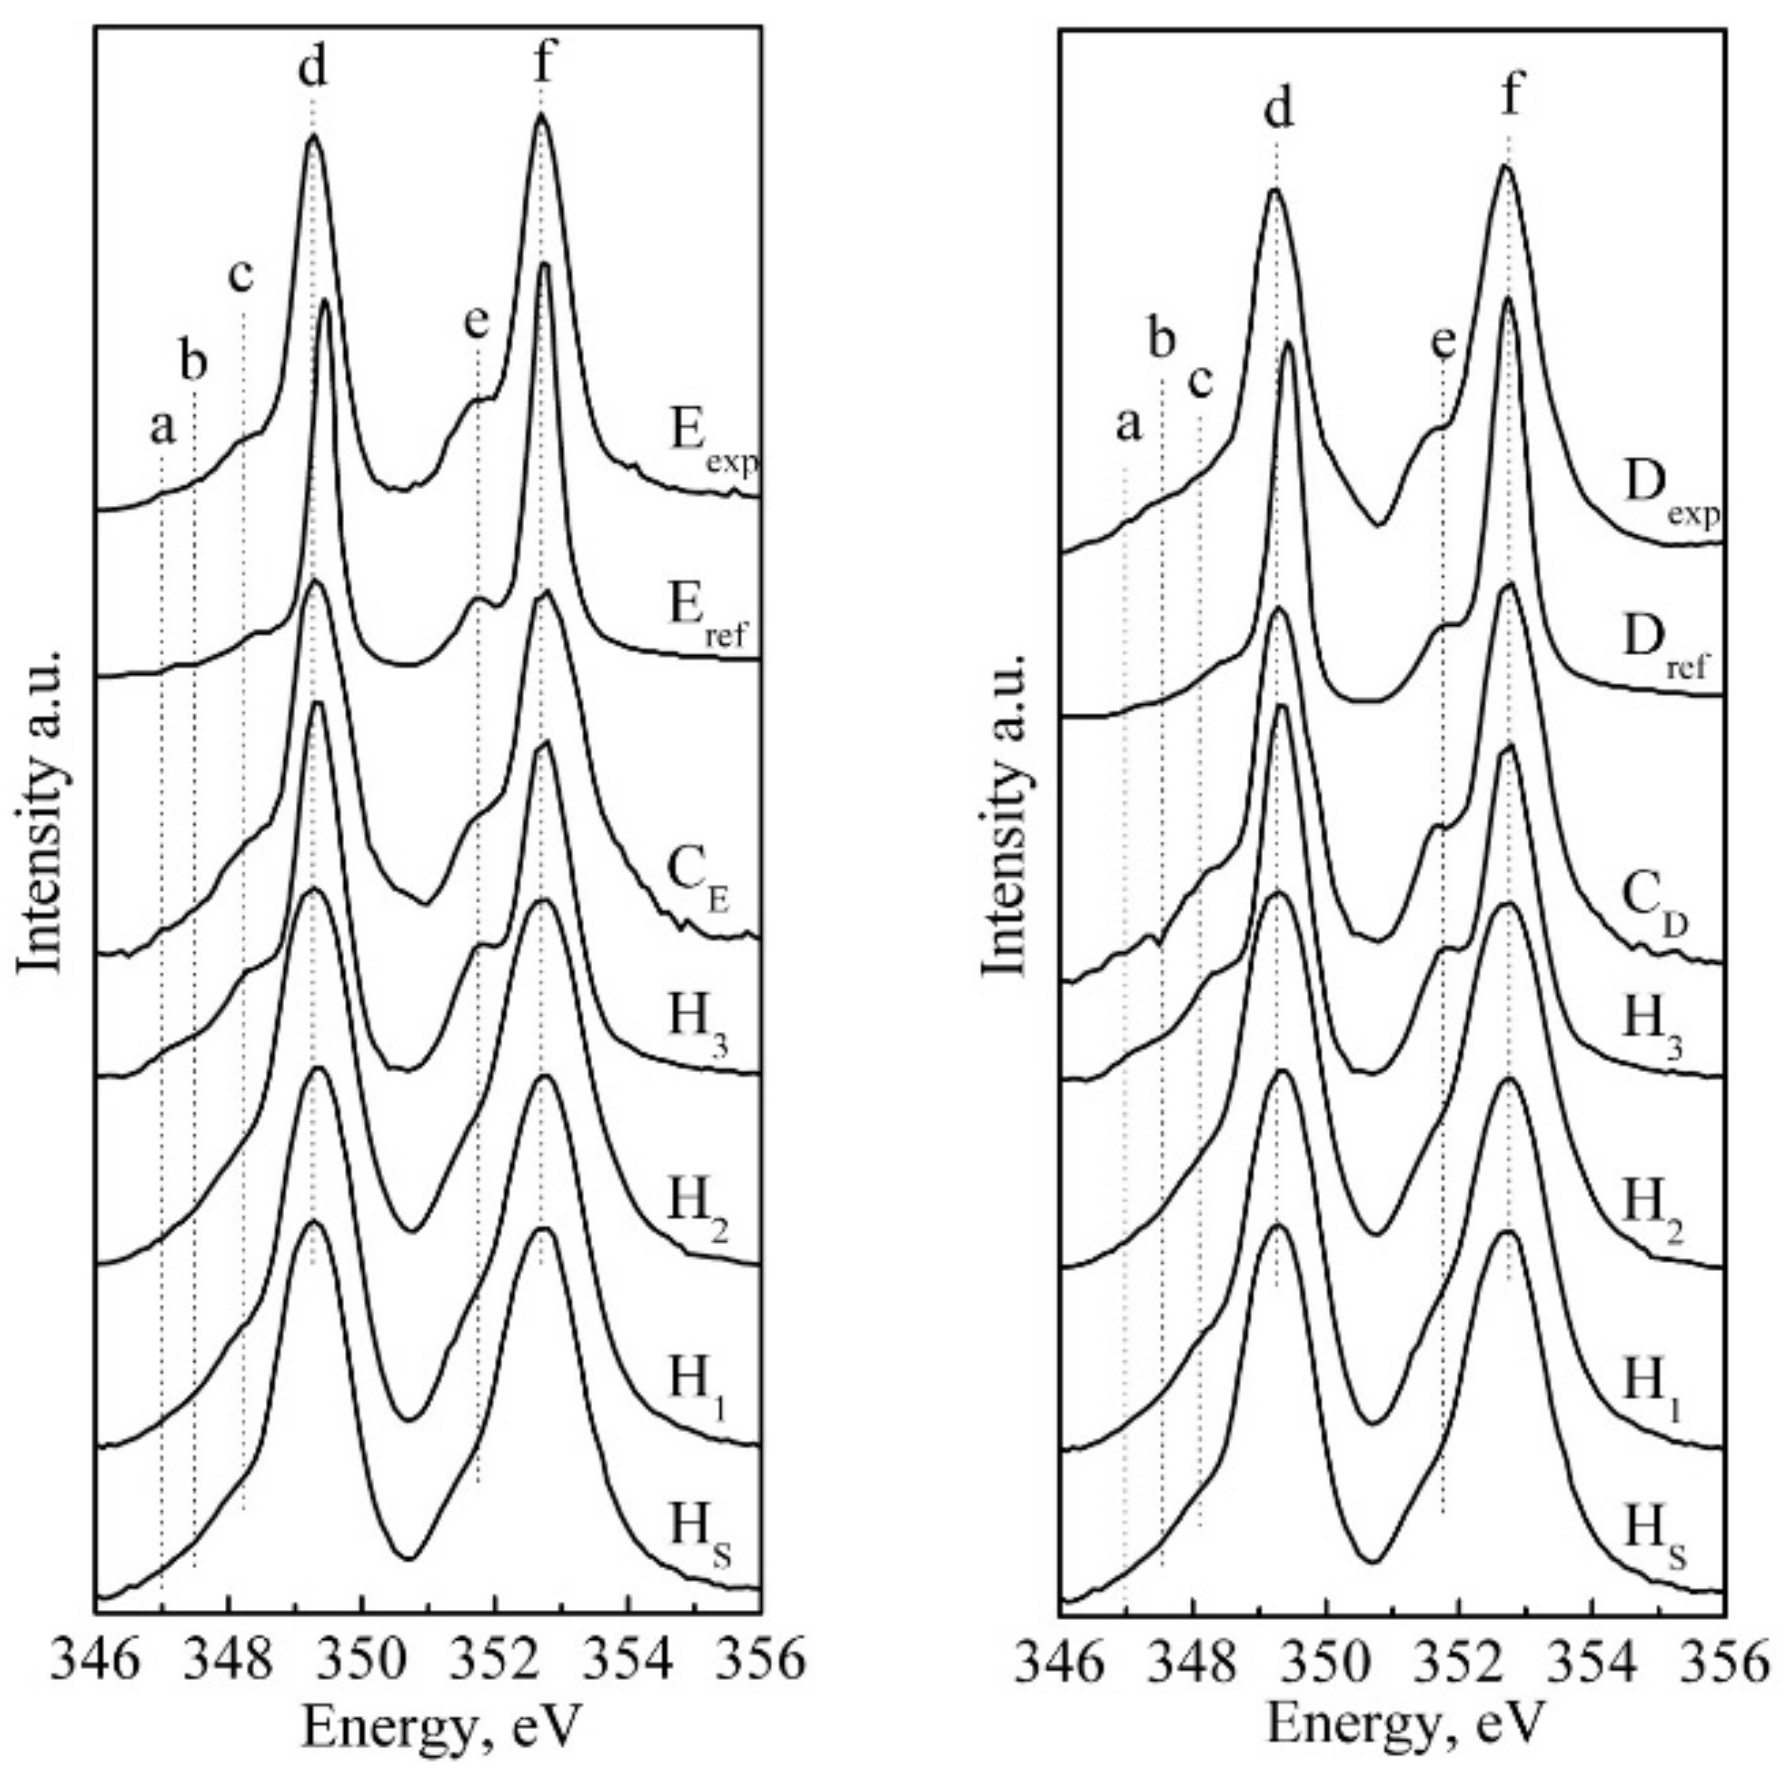
| Sample | Positions of Features, eV | |||||
|---|---|---|---|---|---|---|
| a | b | c | d | e | f | |
| HS | - | - | 348.1 | 349.3 | 351.6 | 352.7 |
| H1 | - | - | 348.1 | 349.3 | 351.6 | 352.7 |
| H2 | - | - | 348.1 | 349.3 | 351.6 | 352.7 |
| H3 | 347.0 | - | 348.2 | 349.3 | 351.8 | 352.7 |
| Eexp | 347.0 | 347.5 | 348.2 | 349.3 | 351.6 | 352.7 |
| ERef [25] | 347.2 | - | 348.4 | 349.1 | 351.8 | 352.7 |
| CE | 347.0 | 347.5 | 348.2 | 349.3 | 351.6 | 352.7 |
| Dexp | 347.0 | 347.5 | 348.3 | 349.3 | 351.8 | 352.7 |
| DRef [25] | - | - | 348.3 | 349.4 | 351.7 | 352.7 |
| CD | 346.8 | 347.2 | 348.0 | 349.3 | 351.6 | 352.7 |
Publisher’s Note: MDPI stays neutral with regard to jurisdictional claims in published maps and institutional affiliations. |
© 2021 by the authors. Licensee MDPI, Basel, Switzerland. This article is an open access article distributed under the terms and conditions of the Creative Commons Attribution (CC BY) license (https://creativecommons.org/licenses/by/4.0/).
Share and Cite
Goloshchapov, D.; Buylov, N.; Emelyanova, A.; Ippolitov, I.; Ippolitov, Y.; Kashkarov, V.; Khudyakov, Y.; Nikitkov, K.; Seredin, P. Raman and XANES Spectroscopic Study of the Influence of Coordination Atomic and Molecular Environments in Biomimetic Composite Materials Integrated with Dental Tissue. Nanomaterials 2021, 11, 3099. https://doi.org/10.3390/nano11113099
Goloshchapov D, Buylov N, Emelyanova A, Ippolitov I, Ippolitov Y, Kashkarov V, Khudyakov Y, Nikitkov K, Seredin P. Raman and XANES Spectroscopic Study of the Influence of Coordination Atomic and Molecular Environments in Biomimetic Composite Materials Integrated with Dental Tissue. Nanomaterials. 2021; 11(11):3099. https://doi.org/10.3390/nano11113099
Chicago/Turabian StyleGoloshchapov, Dmitry, Nikita Buylov, Anna Emelyanova, Ivan Ippolitov, Yuri Ippolitov, Vladimir Kashkarov, Yuri Khudyakov, Kirill Nikitkov, and Pavel Seredin. 2021. "Raman and XANES Spectroscopic Study of the Influence of Coordination Atomic and Molecular Environments in Biomimetic Composite Materials Integrated with Dental Tissue" Nanomaterials 11, no. 11: 3099. https://doi.org/10.3390/nano11113099
APA StyleGoloshchapov, D., Buylov, N., Emelyanova, A., Ippolitov, I., Ippolitov, Y., Kashkarov, V., Khudyakov, Y., Nikitkov, K., & Seredin, P. (2021). Raman and XANES Spectroscopic Study of the Influence of Coordination Atomic and Molecular Environments in Biomimetic Composite Materials Integrated with Dental Tissue. Nanomaterials, 11(11), 3099. https://doi.org/10.3390/nano11113099