
APTES-Based Silica Nanoparticles as a Potential Modifier for the Selective Sequestration of CO2 Gas Molecules

 , , , , ,
Abstract
:
1. Introduction
2. Materials and Methods
2.1. Materials
2.2. F3-Aminepropyltriethoxysilaneization of 50 nm SiO2 Nanoparticles
2.3. Quantification of APTES
Kaiser Test on APTES@SiO2 (50 nm)
2.4. Surface Characterization
2.4.1. XPS
2.4.2. Infrared Spectroscopy
2.4.3. SEM Microscopy
2.4.4. AFM Microscopy
2.5. Thermogravimetric Analisys (TGA)
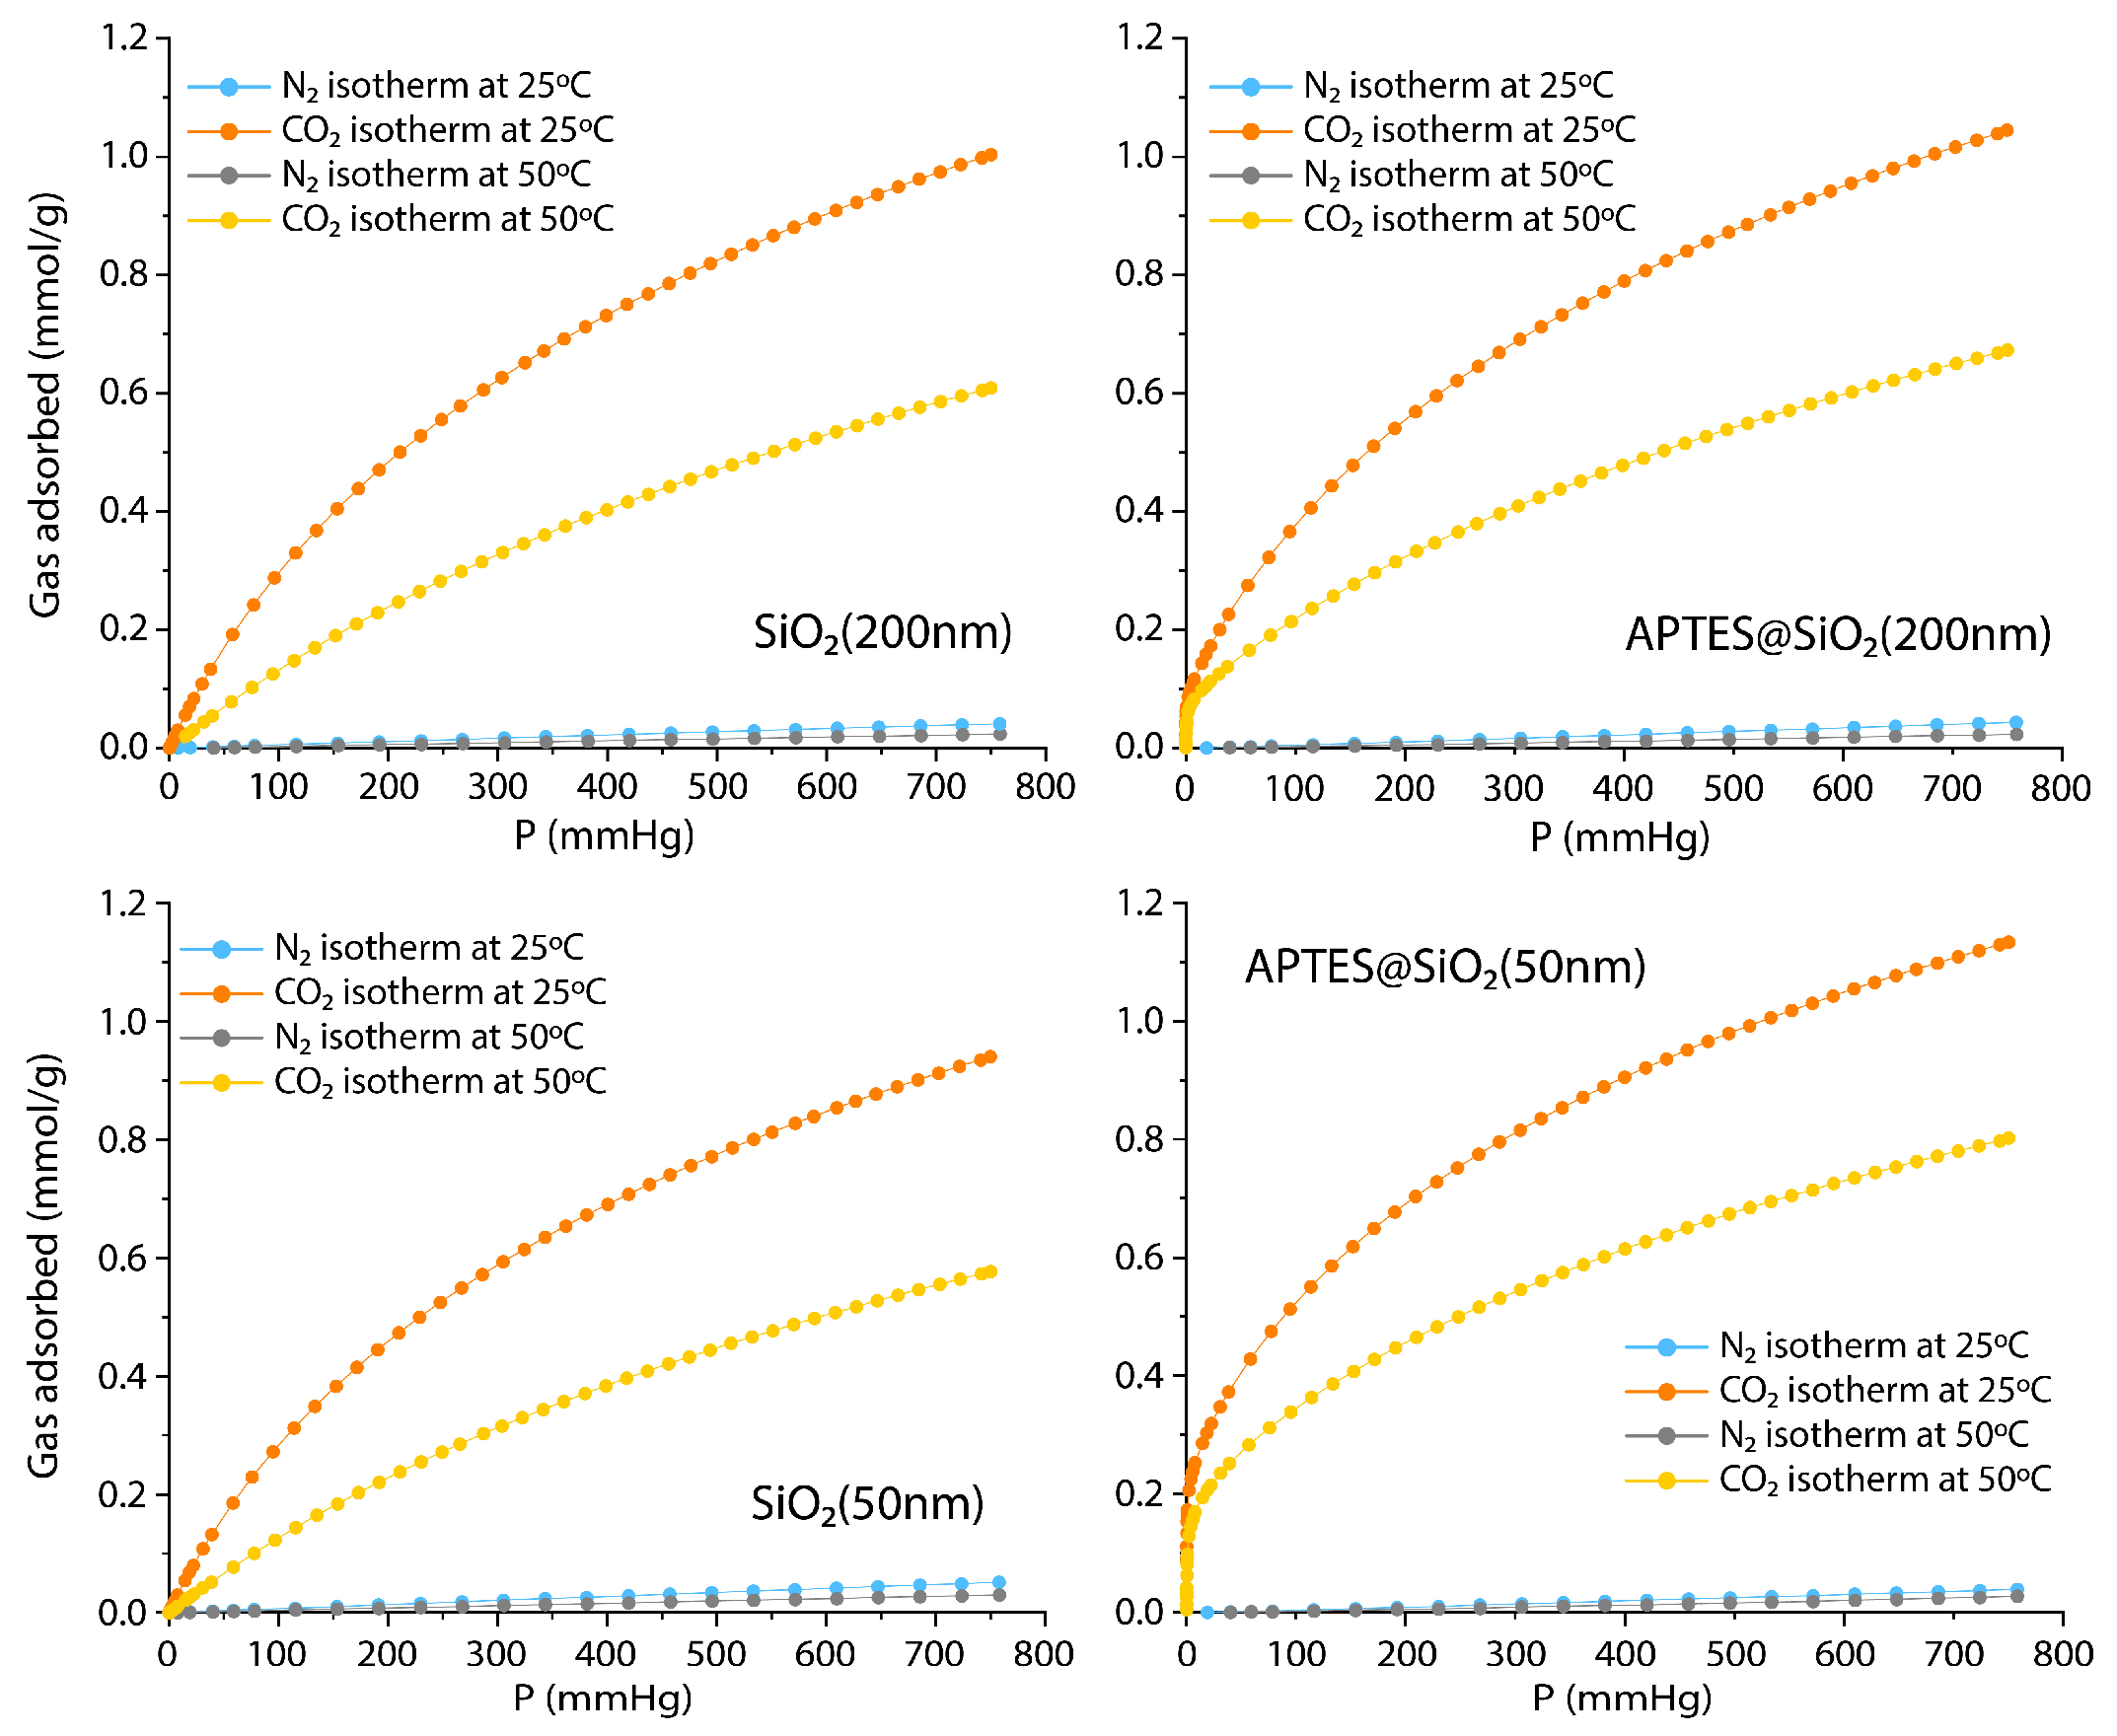
2.6. CO2 Adsorption and N2 Adsorption Isotherms
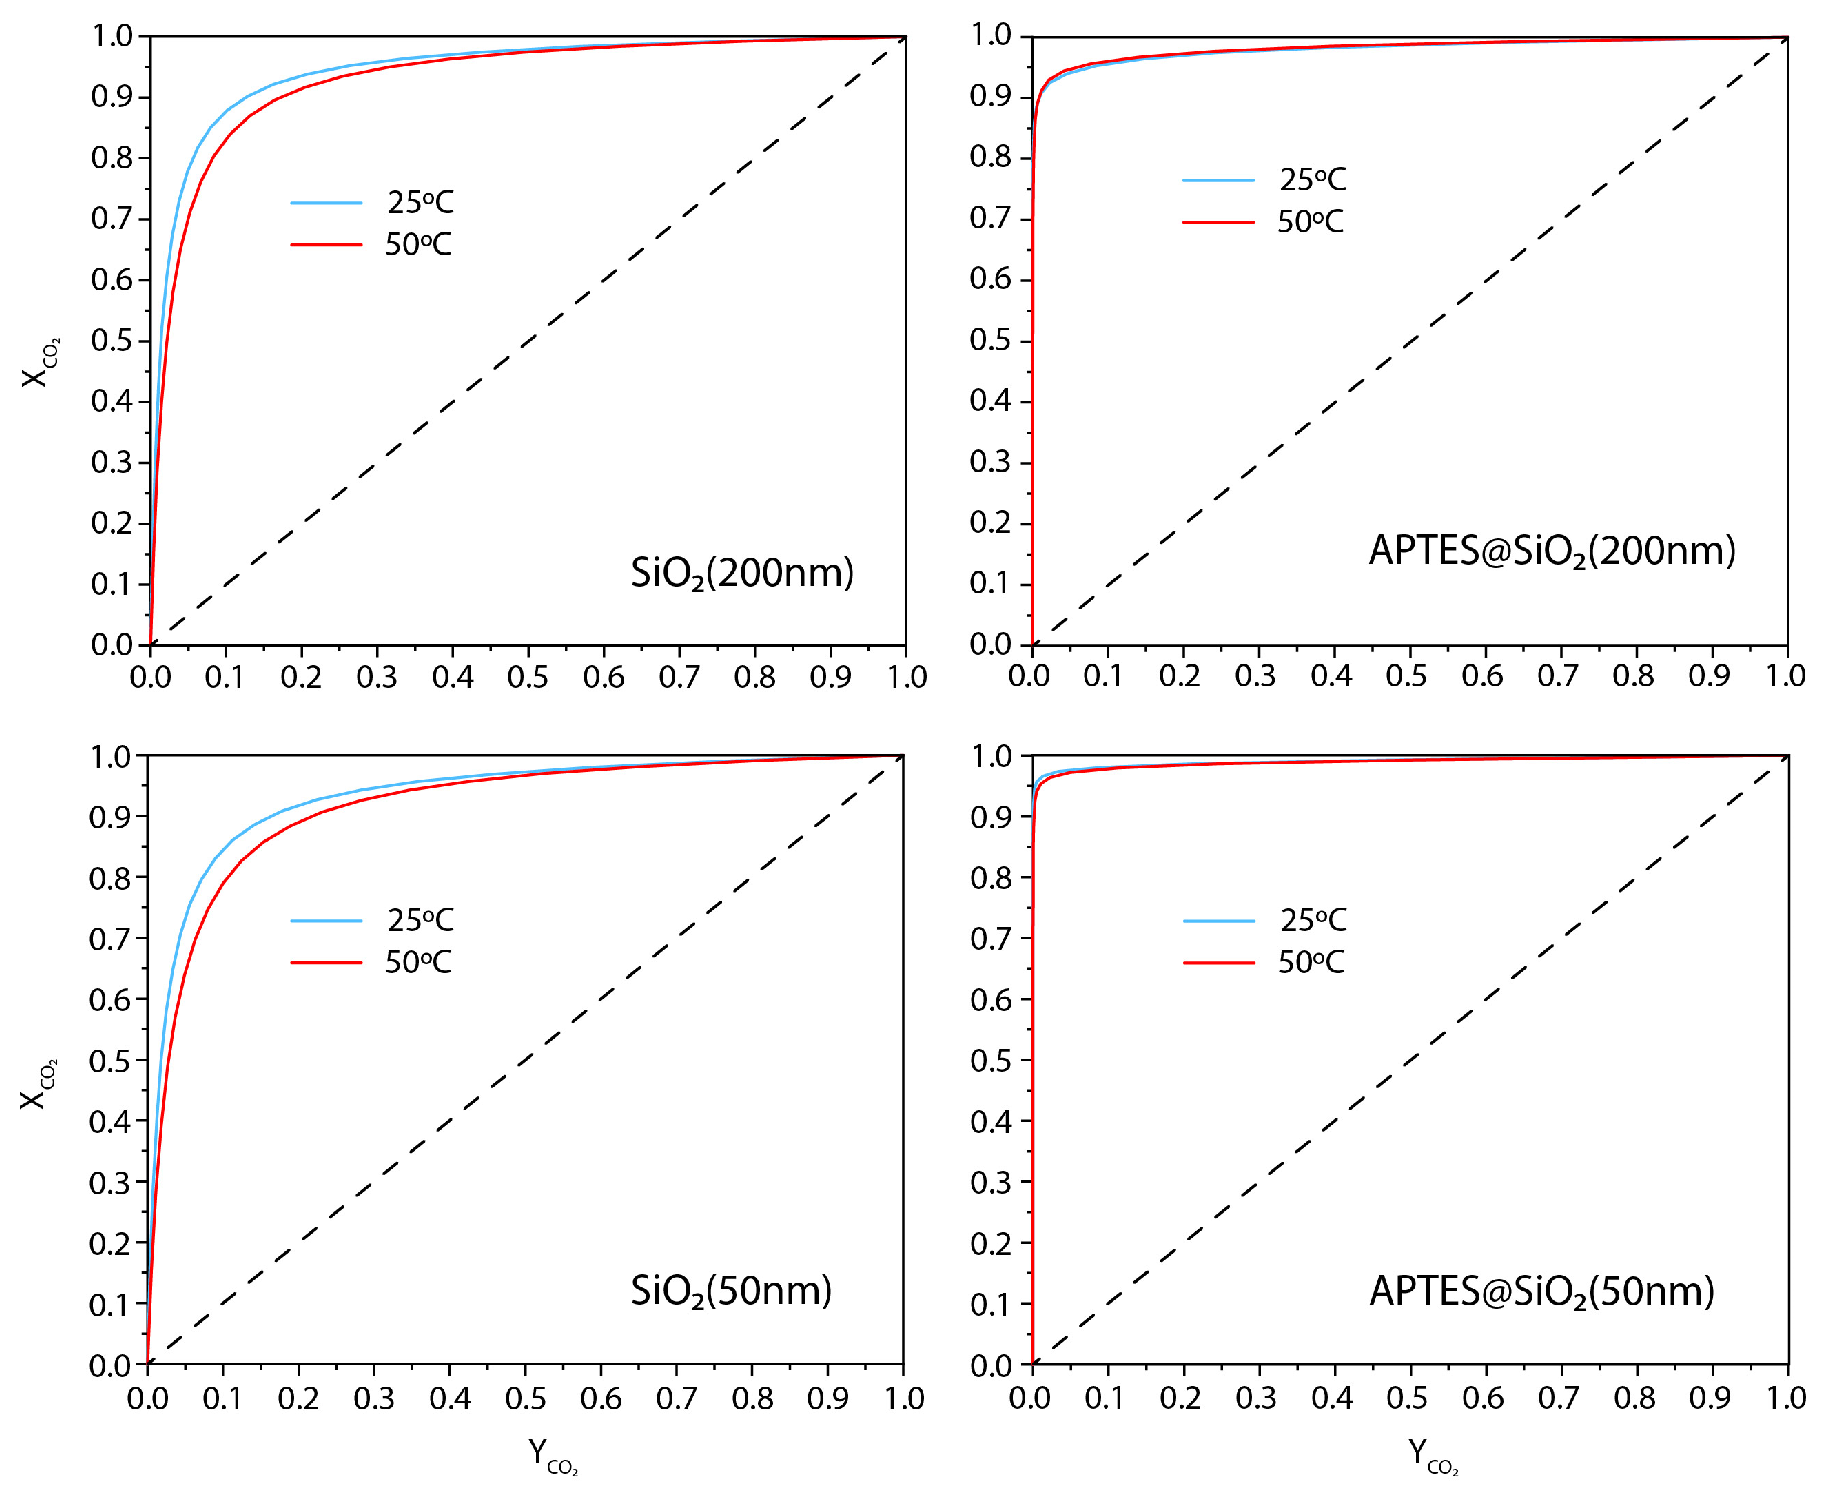
2.7. Adsorption Selectivity of Binary Mixtures of CO2/N2
3. Results
3.1. Characterization of the Nanomaterials
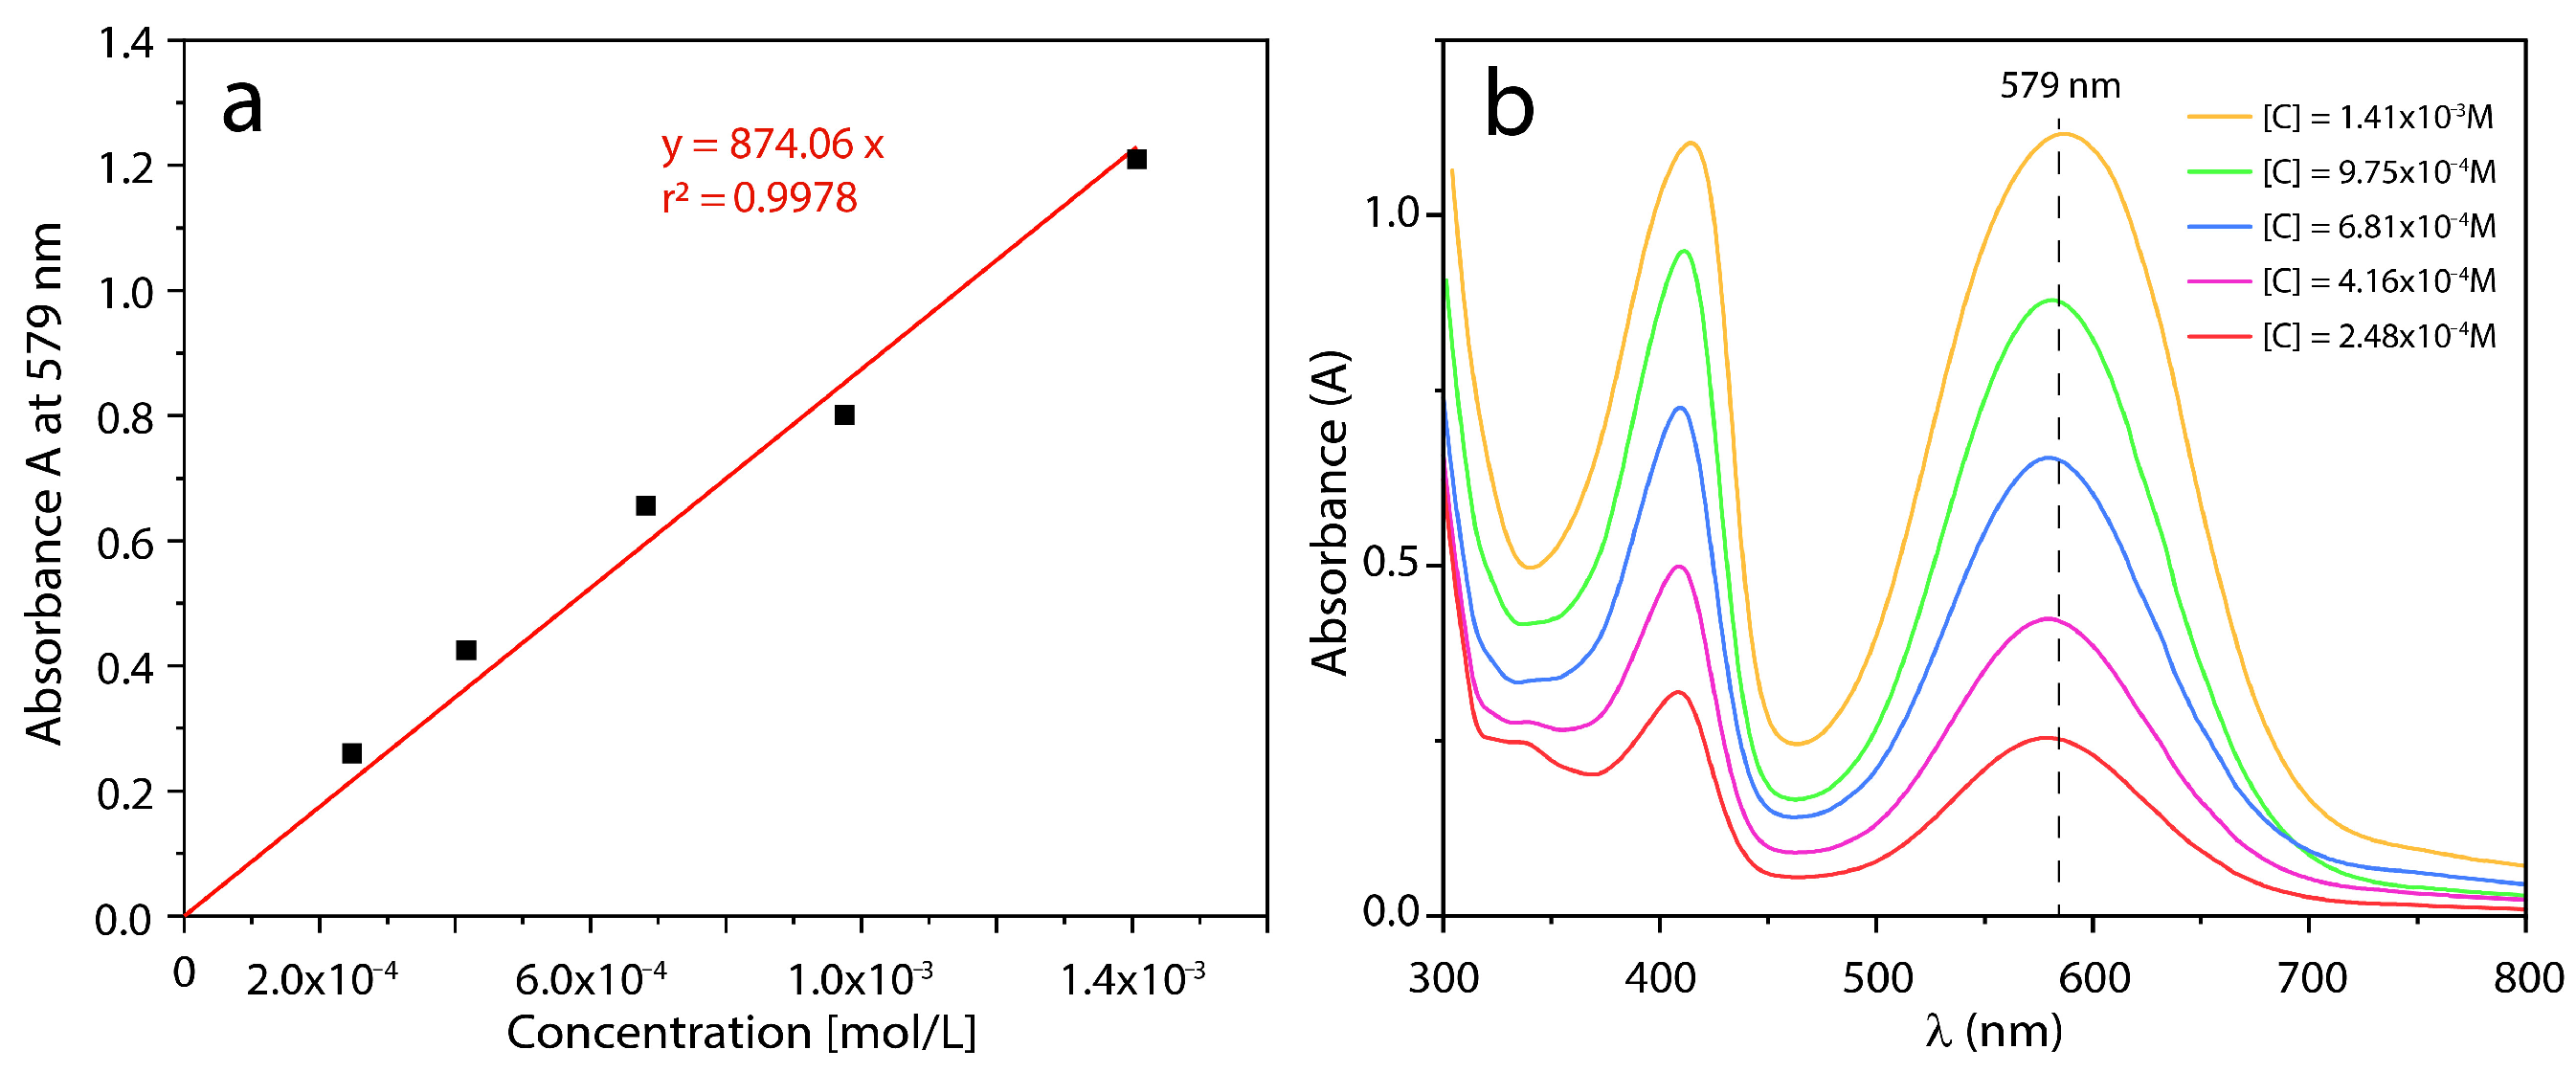
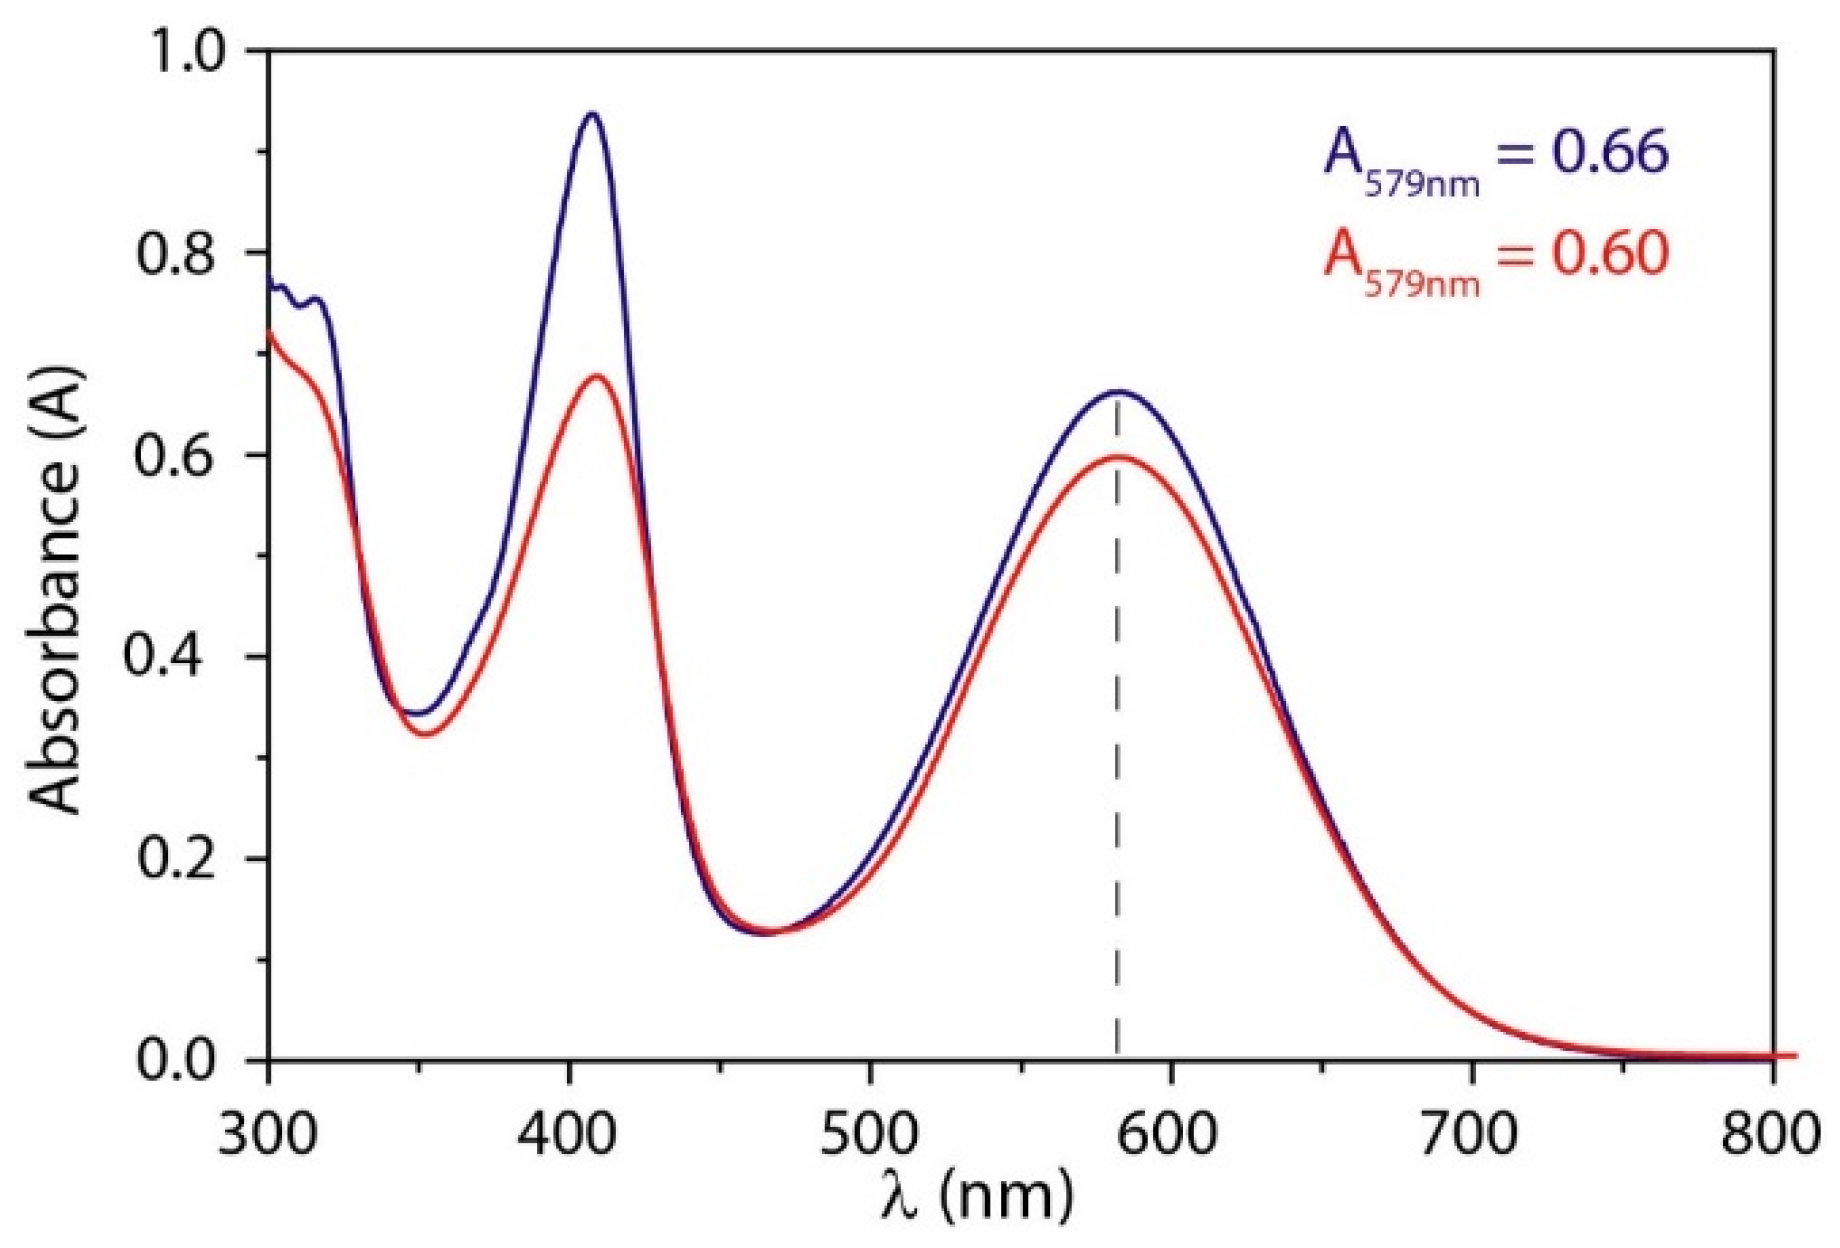
3.1.1. Colorimetric Assay
3.1.2. X-ray Photoelectron Spectroscopy
3.1.3. ATR-FTIR
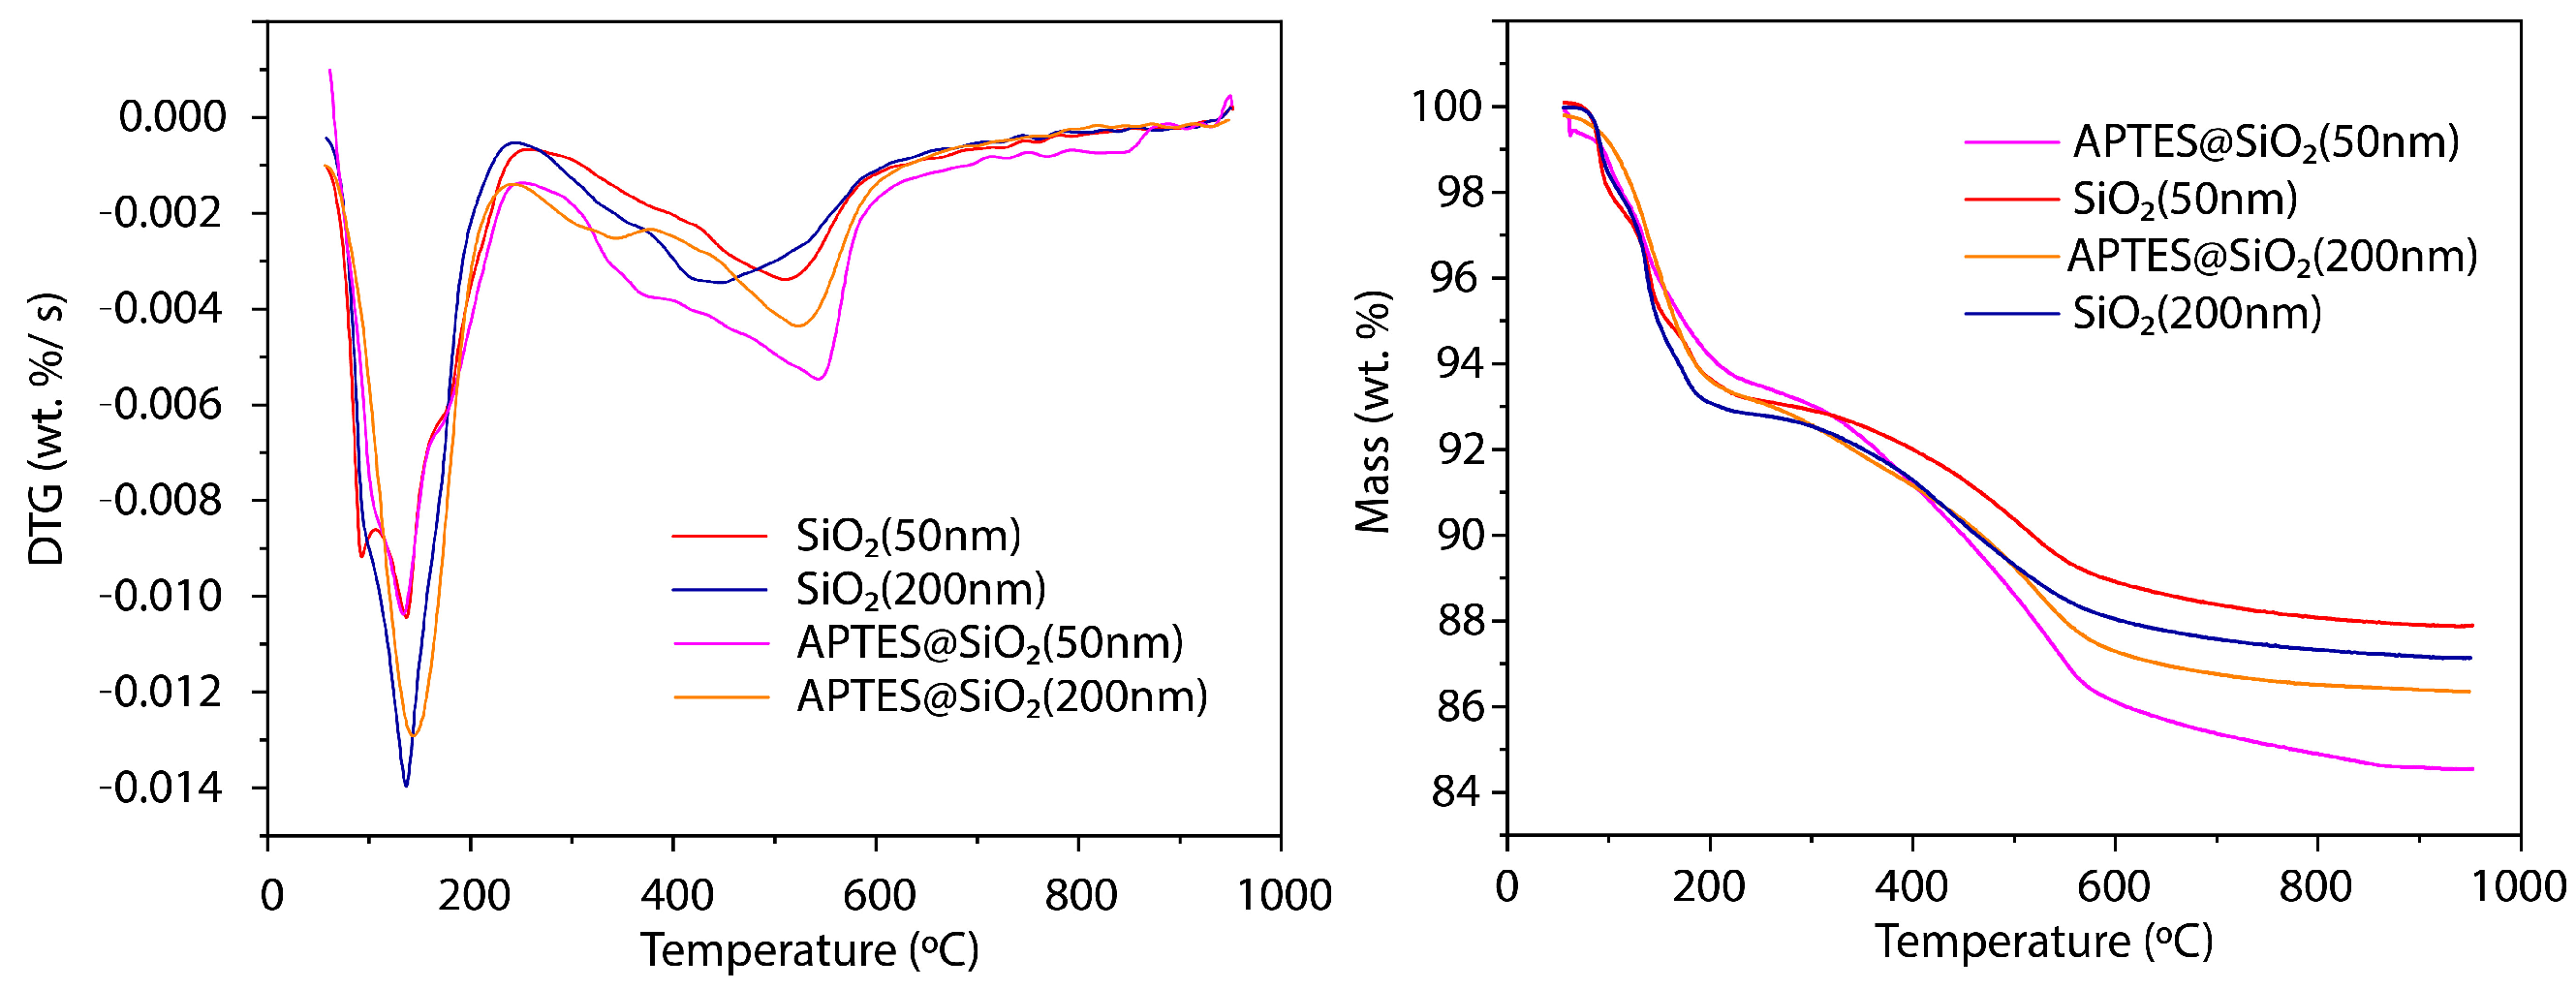
3.1.4. TGA Analysis
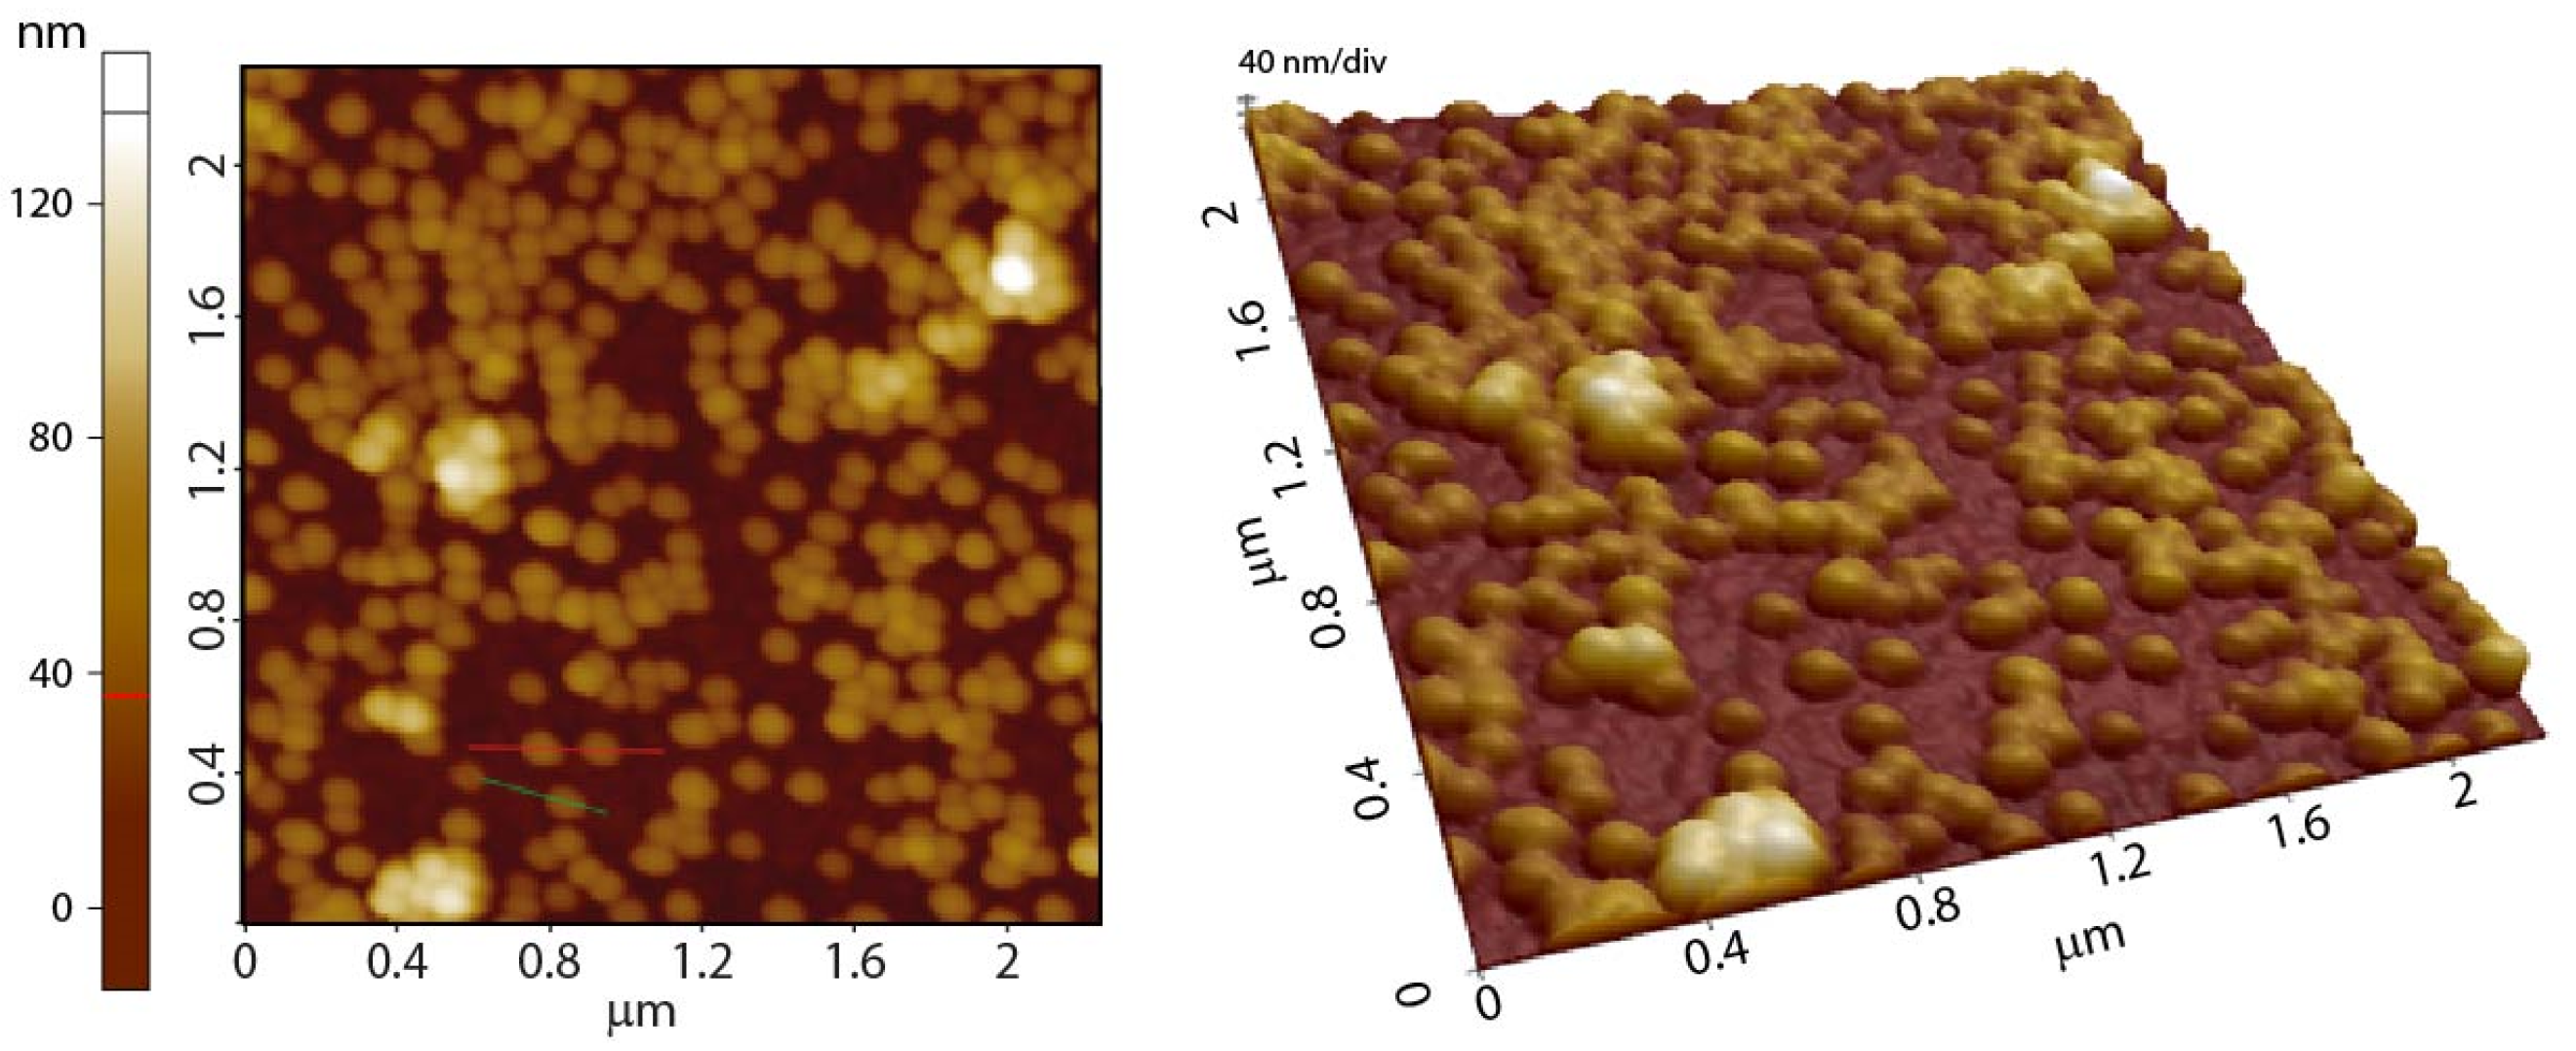
3.1.5. Morphology of the Nanoparticles
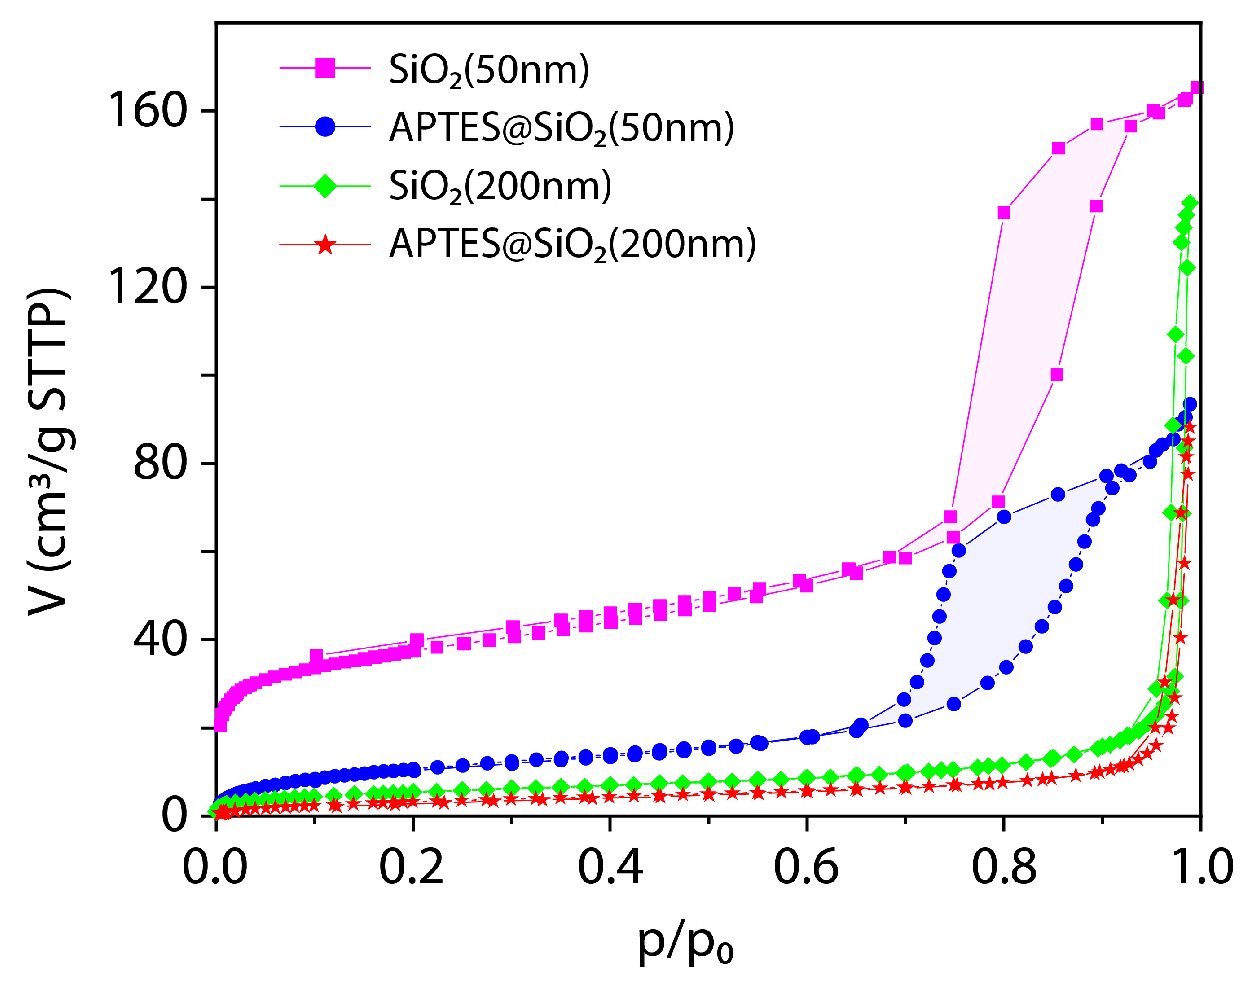
3.1.6. Textural Characterization of the SiO2 (50 nm) and SiO2 (200 nm)-Based Nanoparticles
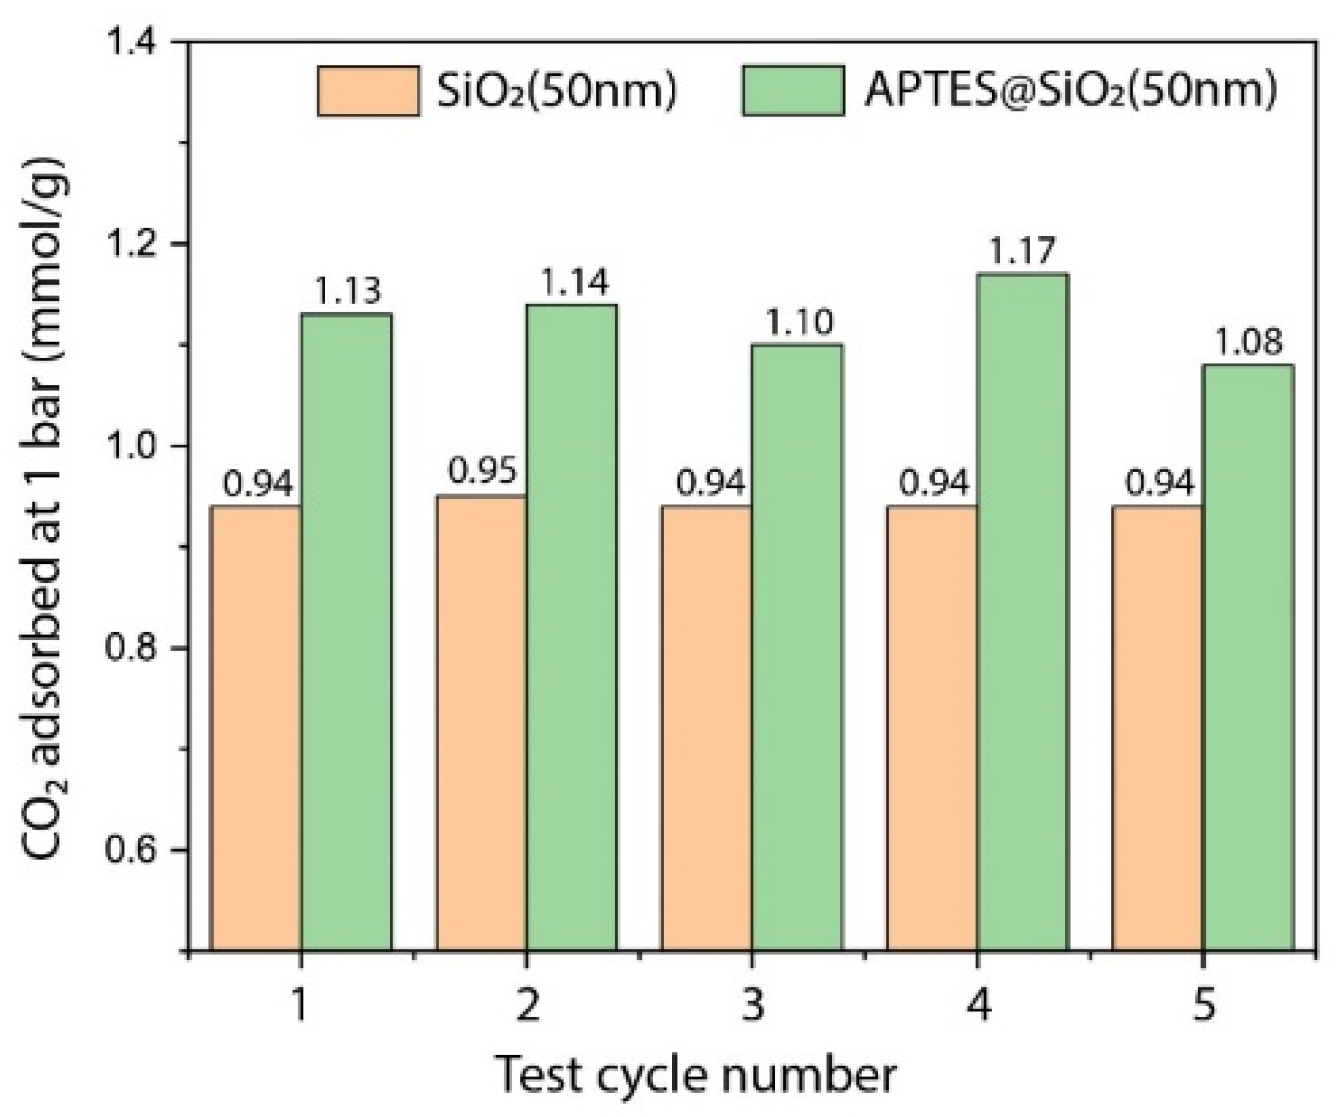
3.2. CO2 Adsorption Studies
4. Concluding Discussion
Supplementary Materials
Author Contributions
Funding
Institutional Review Board Statement
Informed Consent Statement
Data Availability Statement
Acknowledgments
Conflicts of Interest
References
- Roser, H.R. CO2 and Greenhouse Gas Emissions. Our World in Data. Available online: https://ourworldindata.org/co2-and-other-greenhouse-gas-emissions#citation (accessed on 31 August 2020).
- Breidenich, C.; Magraw, D.; Rowley, A.; Rubin, J.W. The Kyoto Protocol to the United Nations Framework Convention on Climate Change. Am. J. Int. Law 2017, 92, 315–331. [Google Scholar] [CrossRef]
- Peters, G.P.; Minx, J.C.; Weber, C.L.; Edenhofer, O. Growth in emission transfers via international trade from 1990 to 2008. Proc. Natl. Acad. Sci. USA 2011, 108, 8903. [Google Scholar] [CrossRef] [Green Version]
- Mi, Z.; Meng, J.; Guan, D.; Shan, Y.; Song, M.; Wei, Y.-M.; Liu, Z.; Hubacek, K. Chinese CO(2) emission flows have reversed since the global financial crisis. Nat. Commun 2017, 8, 1712. [Google Scholar] [CrossRef] [PubMed]
- BP Statistical Review of World Energy 2020. Country Analysis Executive Summary: China. Available online: https://www.eia.gov/international/analysis/country/CHN (accessed on 30 September 2020).
- Isaacs, E.E.; Otto, F.D.; Mather, A.E. Solubility of mixtures of hydrogen sulfide and carbon dioxide in a monoethanolamine solution at low partial pressures. J. Chem. Eng. Data 1980, 25, 118–120. [Google Scholar] [CrossRef]
- Abu-Zahra, M.R.M.; Niederer, J.P.M.; Feron, P.H.M.; Versteeg, G.F. CO2 capture from power plants: Part II. A parametric study of the economical performance based on mono-ethanolamine. Int. J. Greenh. Gas. Control. 2007, 1, 135–142. [Google Scholar] [CrossRef]
- Kittel, J.; Idem, R.; Gelowitz, D.; Tontiwachwuthikul, P.; Parrain, G.; Bonneau, A. Corrosion in MEA units for CO2 capture: Pilot plant studies. Energy Procedia 2009, 1, 791–797. [Google Scholar] [CrossRef] [Green Version]
- Strazisar, B.; Anderson, R.; White, C. Degradation of Monoethanolamine Used in Carbon Dioxide Capture from Flue Gas of a Coal-Fired Electric Power Generating Station. Available online: https://citeseerx.ist.psu.edu/viewdoc/download?doi=10.1.1.204.9249&rep=rep1&type=pdf (accessed on 15 May 2001).
- Liu, X.; Zhou, G.; Zhang, S.; Yao, X. Molecular dynamics simulation of dual amino-functionalized imidazolium-based ionic liquids. Fluid Phase Equilibria 2009, 284, 44–49. [Google Scholar] [CrossRef]
- Yan, X.; Komarneni, S.; Yan, Z. CO2 adsorption on Santa Barbara Amorphous-15 (SBA-15) and amine-modified Santa Barbara Amorphous-15 (SBA-15) with and without controlled microporosity. J. Colloid Interface Sci. 2013, 390, 217–224. [Google Scholar] [CrossRef]
- Li, J.-R.; Ma, Y.; McCarthy, M.C.; Sculley, J.; Yu, J.; Jeong, H.-K.; Balbuena, P.B.; Zhou, H.-C. Carbon dioxide capture-related gas adsorption and separation in metal-organic frameworks. Coord. Chem. Rev. 2011, 255, 1791–1823. [Google Scholar] [CrossRef]
- Millward, A.R.; Yaghi, O.M. Metal−Organic Frameworks with Exceptionally High Capacity for Storage of Carbon Dioxide at Room Temperature. J. Am. Chem. Soc. 2005, 127, 17998–17999. [Google Scholar] [CrossRef]
- Querejeta, N.; Plaza, M.G.; Rubiera, F.; Pevida, C. Water Vapor Adsorption on Biomass Based Carbons under Post-Combustion CO2 Capture Conditions: Effect of Post-Treatment. Materials 2016, 9, 359. [Google Scholar] [CrossRef] [PubMed] [Green Version]
- Sánchez-Sánchez, Á.; Suárez-García, F.; Martínez-Alonso, A.; Tascón, J.M.D. Influence of Porous Texture and Surface Chemistry on the CO2 Adsorption Capacity of Porous Carbons: Acidic and Basic Site Interactions. ACS Appl. Mater. Interfaces 2014, 6, 21237–21247. [Google Scholar] [CrossRef] [PubMed]
- Walton, K.S.; Abney, M.B.; Douglas LeVan, M. CO2 adsorption in Y and X zeolites modified by alkali metal cation exchange. Microporous Mesoporous Mater. 2006, 91, 78–84. [Google Scholar] [CrossRef]
- Yang, S.-T.; Kim, J.; Ahn, W.-S. CO2 adsorption over ion-exchanged zeolite beta with alkali and alkaline earth metal ions. Microporous Mesoporous Mater. 2010, 135, 90–94. [Google Scholar] [CrossRef]
- Samanta, A.; Zhao, A.; Shimizu, G.K.H.; Sarkar, P.; Gupta, R. Post-Combustion CO2 Capture Using Solid Sorbents: A Review. Ind. Eng. Chem. Res. 2012, 51, 1438–1463. [Google Scholar] [CrossRef]
- Sayari, A.; Belmabkhout, Y.; Serna-Guerrero, R. Flue gas treatment via CO2 adsorption. Chem. Eng. J. 2011, 171, 760–774. [Google Scholar] [CrossRef]
- Yong, Z.; Mata, V.; Rodrigues, A.r.E. Adsorption of carbon dioxide at high temperature—A review. Sep. Purif. Technol. 2002, 26, 195–205. [Google Scholar] [CrossRef]
- Sánchez-Vicente, Y.; Stevens, L.; Pando, C.; Cabañas, A. Functionalization of Silica SBA-15 with [3-(2-Aminoethylamino)Propyl] Trimethoxysilane in Supercritical CO2 Modified with Methanol or Ethanol for Carbon Capture. Energies 2020, 13, 5804. [Google Scholar] [CrossRef]
- Xiao, J.; Wang, Y.; Zhang, T.C.; Yuan, S. N,S-containing polycondensate-derived porous carbon materials for superior CO2 adsorption and supercapacitor. Appl. Surf. Sci. 2021, 562, 150128. [Google Scholar] [CrossRef]
- Wang, Y.; Xiao, J.; Wang, H.; Zhang, T.C.; Yuan, S. Binary doping of nitrogen and phosphorus into porous carbon: A novel di-functional material for enhancing CO2 capture and super-capacitance. J. Mater. Sci. Technol. 2022, 99, 73–81. [Google Scholar] [CrossRef]
- Adeniran, B.; Mokaya, R. Is N-Doping in Porous Carbons Beneficial for CO2 Storage? Experimental Demonstration of the Relative Effects of Pore Size and N-Doping. Chem. Mater. 2016, 28, 994–1001. [Google Scholar] [CrossRef]
- Li, K.; Jiang, J.; Tian, S.; Yan, F.; Chen, X. Polyethyleneimine–nano silica composites: A low-cost and promising adsorbent for CO2 capture. J. Mater. Chem. A 2015, 3, 2166–2175. [Google Scholar] [CrossRef]
- Kim, J. CO2 separation using surface-functionalized SiO2 nanoparticles incorporated ultra-thin film composite mixed matrix membranes for post-combustion carbon capture. J. Membr. Sci. 2016, 515, 54–62. [Google Scholar] [CrossRef]
- Rafigh, S.M.; Heydarinasab, A. Mesoporous Chitosan–SiO2 Nanoparticles: Synthesis, Characterization, and CO2 Adsorption Capacity. ACS Sustain. Chem. Eng. 2017, 5, 10379–10386. [Google Scholar] [CrossRef]
- Didas, S.A.; Choi, S.; Chaikittisilp, W.; Jones, C.W. Amine–Oxide Hybrid Materials for CO2 Capture from Ambient Air. Acc. Chem. Res. 2015, 48, 2680–2687. [Google Scholar] [CrossRef] [PubMed]
- Didas, S.A.; Sakwa-Novak, M.A.; Foo, G.S.; Sievers, C.; Jones, C.W. Effect of Amine Surface Coverage on the Co-Adsorption of CO2 and Water: Spectral Deconvolution of Adsorbed Species. J. Phys. Chem. Lett. 2014, 5, 4194–4200. [Google Scholar] [CrossRef] [PubMed]
- Jahandar Lashaki, M.; Khiavi, S.; Sayari, A. Stability of amine-functionalized CO2 adsorbents: A multifaceted puzzle. Chem. Soc. Rev. 2019, 48, 3320–3405. [Google Scholar] [CrossRef]
- Yoosuk, B.; Wongsanga, T.; Prasassarakich, P. CO2 and H2S binary sorption on polyamine modified fumed silica. Fuel 2016, 168, 47–53. [Google Scholar] [CrossRef]
- Cueto-Díaz, E.J.S.-G.; Gálvez-Martínez, S.; Vallés-González, M.P.; Mateo-Martí, E. CO2 adsorption capacities in amine-functionalized microporous silica nanoparticles. React. Funct. Polym. 2021. Accepted. [Google Scholar]
- Chaix, A.; Cueto-Diaz, E.; Delalande, A.; Knezevic, N.; Midoux, P.; Durand, J.-O.; Pichon, C.; Cunin, F. Amino-acid functionalized porous silicon nanoparticles for the delivery of pDNA. RSC Adv. 2019, 9, 31895–31899. [Google Scholar] [CrossRef] [Green Version]
- Poli, E.; Chaleix, V.; Damia, C.; Hjezi, Z.; Champion, E.; Sol, V. Efficient quantification of primary amine functions grafted onto apatite ceramics by using two UV-Vis spectrophotometric methods. Anal. Methods 2014, 6, 9622–9627. [Google Scholar] [CrossRef]
- Cueto Díaz, E.J.; Gálvez-Martínez, S.; Torquemada Vico, M.C.; Valles González, M.P.; Mateo-Martí, E. 2-D organization of silica nanoparticles on gold surfaces: CO2 marker detection and storage. RSC Adv. 2020, 10, 31758–31764. [Google Scholar] [CrossRef]
- Dubinin, M.M. Fundamentals of the theory of adsorption in micropores of carbon adsorbents: Characteristics of their adsorption properties and microporous structures. Carbon 1989, 27, 457–467. [Google Scholar] [CrossRef]
- Czepirski, L.; JagieŁŁo, J. Virial-type thermal equation of gas—Solid adsorption. Chem. Eng. Sci. 1989, 44, 797–801. [Google Scholar] [CrossRef]
- Nuhnen, A.; Janiak, C. A practical guide to calculate the isosteric heat/enthalpy of adsorption via adsorption isotherms in metal–organic frameworks, MOFs. Dalton Trans. 2020, 49, 10295–10307. [Google Scholar] [CrossRef]
- Thommes, M.; Kaneko, K.; Neimark, A.V.; Olivier, J.P.; Rodriguez-Reinoso, F.; Rouquerol, J.; Sing, K.S.W. Physisorption of gases, with special reference to the evaluation of surface area and pore size distribution (IUPAC Technical Report). Pure Appl. Chem. 2015, 87, 1051–1069. [Google Scholar] [CrossRef] [Green Version]
- Myers, A.L.; Prausnitz, J.M. Thermodynamics of mixed-gas adsorption. AIChE J. 1965, 11, 121–127. [Google Scholar] [CrossRef]
- Bartholdy, S.; Bjørner, M.G.; Solbraa, E.; Shapiro, A.; Kontogeorgis, G.M. Capabilities and Limitations of Predictive Engineering Theories for Multicomponent Adsorption. Ind. Eng. Chem. Res. 2013, 52, 11552–11563. [Google Scholar] [CrossRef]
- Simon, C.M.; Smit, B.; Haranczyk, M. pyIAST: Ideal adsorbed solution theory (IAST) Python package. Comput. Phys. Commun. 2016, 200, 364–380. [Google Scholar] [CrossRef] [Green Version]
- Ye, L.; Cai, Q.; Xu, B.; Di, Z.; Zhang, M.; Yang, J. High sensitivity biosensors based on germanium nanowires fabricated by Ge condensation technique. Mater. Lett. 2016, 172, 142–145. [Google Scholar] [CrossRef]
- Maaz, M.; Elzein, T.; Dragoe, D.; Bejjani, A.; Jarroux, N.; Poulard, C.; Aubry-Barroca, N.; Nsouli, B.; Roger, P. Poly(4-vinylpyridine)-modified silica for efficient oil/water separation. J. Mater. Sci. 2019, 54, 1184–1196. [Google Scholar] [CrossRef]
- Tian, R.; Seitz, O.; Li, M.; Hu, W.; Chabal, Y.J.; Gao, J. Infrared Characterization of Interfacial Si−O Bond Formation on Silanized Flat SiO2/Si Surfaces. Langmuir 2010, 26, 4563–4566. [Google Scholar] [CrossRef]
- Mateo Marti, E.; Methivier, C.; Pradier, C.M. (S)-cysteine chemisorption on Cu110, from the gas or liquid phase: An FT-RAIRS and XPS study. Langmuir 2004, 20, 10223–10230. [Google Scholar] [CrossRef]
- Kasprzhitskii, A.; Lazorenko, G.; Kruglikov, A.; Kuchkina, I.; Gorodov, V. Effect of Silane Functionalization on Properties of Poly(Lactic Acid)/Palygorskite Nanocomposites. Inorganics 2021, 9. [Google Scholar] [CrossRef]
- Landmesser, H.; Kosslick, H.; Storek, W.; Fricke, R. Interior surface hydroxyl groups in ordered mesoporous silicates. Solid State Ion. 1997, 101-103, 271–277. [Google Scholar] [CrossRef]
- Araujo, A.S.; Jaroniec, M. Thermogravimetric monitoring of the MCM-41 synthesis. Thermochim. Acta 2000, 363, 175–180. [Google Scholar] [CrossRef]
- Chen, Y.; Qiao, Z.; Huang, J.; Wu, H.; Xiao, J.; Xia, Q.; Xi, H.; Hu, J.; Zhou, J.; Li, Z. Unusual Moisture-Enhanced CO2 Capture within Microporous PCN-250 Frameworks. ACS Appl. Mater. Interfaces 2018, 10, 38638–38647. [Google Scholar] [CrossRef] [PubMed]
- Qian, D.; Lei, C.; Hao, G.-P.; Li, W.-C.; Lu, A.-H. Synthesis of Hierarchical Porous Carbon Monoliths with Incorporated Metal–Organic Frameworks for Enhancing Volumetric Based CO2 Capture Capability. ACS Appl. Mater. Interfaces 2012, 4, 6125–6132. [Google Scholar] [CrossRef]
- Wang, Y.; Wang, H.; Zhang, T.C.; Yuan, S.; Liang, B. N-doped porous carbon derived from rGO-Incorporated polyphenylenediamine composites for CO2 adsorption and supercapacitors. J. Power Sources 2020, 472, 228610. [Google Scholar] [CrossRef]
- Xiong, Y.; Wang, Y.; Jiang, H.; Yuan, S. MWCNT Decorated Rich N-Doped Porous Carbon with Tunable Porosity for CO2 Capture. Molecules 2021, 26. [Google Scholar] [CrossRef]
- Wang, Y.; Xiao, J.; Wang, H.; Zhang, T.C.; Yuan, S. N-Doped Porous Carbon Derived from Solvent-Free Synthesis of Cross-Linked Triazine Polymers for Simultaneously Achieving CO2 Capture and Supercapacitors. Chem. A Eur. J. 2021, 27, 7908–7914. [Google Scholar] [CrossRef] [PubMed]
- Lopez-Iglesias, B.; Suárez-García, F.; Aguilar-Lugo, C.; González Ortega, A.; Bartolomé, C.; Martínez-Ilarduya, J.M.; de la Campa, J.G.; Lozano, Á.E.; Álvarez, C. Microporous Polymer Networks for Carbon Capture Applications. ACS Appl. Mater. Interfaces 2018, 10, 26195–26205. [Google Scholar] [CrossRef]
- Rabbani, M.G.; El-Kaderi, H.M. Synthesis and Characterization of Porous Benzimidazole-Linked Polymers and Their Performance in Small Gas Storage and Selective Uptake. Chem. Mater. 2012, 24, 1511–1517. [Google Scholar] [CrossRef]
- Wu, X.; Guan, R.; Zheng, W.-T.; Huang, K.; Liu, F. Developing porous organic polymers as precursors of nitrogen-decorated micro-mesoporous carbons for efficient capture and conversion of carbon dioxide. J. Mater. Sci. 2021, 56, 9315–9329. [Google Scholar] [CrossRef]
- Abdelmoaty, Y.H.; Tessema, T.-D.; Norouzi, N.; El-Kadri, O.M.; Turner, J.B.M.; El-Kaderi, H.M. Effective Approach for Increasing the Heteroatom Doping Levels of Porous Carbons for Superior CO2 Capture and Separation Performance. ACS Appl. Mater. Interfaces 2017, 9, 35802–35810. [Google Scholar] [CrossRef] [PubMed]
- Kim, Y.K.; Kim, G.M.; Lee, J.W. Highly porous N-doped carbons impregnated with sodium for efficient CO2 capture. J. Mater. Chem. A 2015, 3, 10919–10927. [Google Scholar] [CrossRef]
- Lourenço, M.A.O.; Fontana, M.; Jagdale, P.; Pirri, C.F.; Bocchini, S. Improved CO2 adsorption properties through amine functionalization of multi-walled carbon nanotubes. Chem. Eng. J. 2021, 414, 128763. [Google Scholar] [CrossRef]
- To, J.W.F.; He, J.; Mei, J.; Haghpanah, R.; Chen, Z.; Kurosawa, T.; Chen, S.; Bae, W.-G.; Pan, L.; Tok, J.B.H.; et al. Hierarchical N-Doped Carbon as CO2 Adsorbent with High CO2 Selectivity from Rationally Designed Polypyrrole Precursor. J. Am. Chem. Soc. 2016, 138, 1001–1009. [Google Scholar] [CrossRef]
- Wang, J.; Krishna, R.; Yang, J.; Deng, S. Hydroquinone and Quinone-Grafted Porous Carbons for Highly Selective CO2 Capture from Flue Gases and Natural Gas Upgrading. Environ. Sci. Technol. 2015, 49, 9364–9373. [Google Scholar] [CrossRef] [PubMed]
- Wang, S.; Miao, J.; Liu, M.; Zhang, L.; Liu, Z. Hierarchical porous N-doped carbon xerogels for high performance CO2 capture and supercapacitor. Colloids Surf. A Physicochem. Eng. Asp. 2021, 616, 126285. [Google Scholar] [CrossRef]
- Rehman, A.; Nazir, G.; Yop Rhee, K.; Park, S.-J. A rational design of cellulose-based heteroatom-doped porous carbons: Promising contenders for CO2 adsorption and separation. Chem. Eng. J. 2021, 420, 130421. [Google Scholar] [CrossRef]
- Banerjee, R.; Furukawa, H.; Britt, D.; Knobler, C.; O’Keeffe, M.; Yaghi, O.M. Control of Pore Size and Functionality in Isoreticular Zeolitic Imidazolate Frameworks and their Carbon Dioxide Selective Capture Properties. J. Am. Chem. Soc. 2009, 131, 3875–3877. [Google Scholar] [CrossRef]
- Li, L.; Xue, H.; Wang, Y.; Zhao, P.; Zhu, D.; Jiang, M.; Zhao, X. Solvothermal Metal Metathesis on a Metal–Organic Framework with Constricted Pores and the Study of Gas Separation. ACS Appl. Mater. Interfaces 2015, 7, 25402–25412. [Google Scholar] [CrossRef] [PubMed]
- Vo, T.K.; Vu, P.V.; Nguyen, V.C.; Kim, J. Construction of OH sites within MIL-101(Cr)-NH2 framework for enhanced CO2 adsorption and CO2/N2 selectivity. Korean J. Chem. Eng. 2021, 38, 1676–1685. [Google Scholar] [CrossRef]
- Hefti, M.; Marx, D.; Joss, L.; Mazzotti, M. Adsorption equilibrium of binary mixtures of carbon dioxide and nitrogen on zeolites ZSM-5 and 13X. Microporous Mesoporous Mater. 2015, 215, 215–228. [Google Scholar] [CrossRef]
- Liu, B.; Smit, B. Comparative Molecular Simulation Study of CO2/N2 and CH4/N2 Separation in Zeolites and Metal−Organic Frameworks. Langmuir 2009, 25, 5918–5926. [Google Scholar] [CrossRef]
- Pham, T.D.; Xiong, R.; Sandler, S.I.; Lobo, R.F. Experimental and computational studies on the adsorption of CO2 and N2 on pure silica zeolites. Microporous Mesoporous Mater. 2014, 185, 157–166. [Google Scholar] [CrossRef]
- Pham, T.-H.; Lee, B.-K.; Kim, J.; Lee, C.-H. Enhancement of CO2 capture by using synthesized nano-zeolite. J. Taiwan Inst. Chem. Eng. 2016, 64, 220–226. [Google Scholar] [CrossRef]
- Cecilia, J.A.; Vilarrasa-García, E.; Morales-Ospino, R.; Bastos-Neto, M.; Azevedo, D.C.S.; Rodríguez-Castellón, E. Insights into CO2 adsorption in amino-functionalized SBA-15 synthesized at different aging temperature. Adsorption 2020, 26, 225–240. [Google Scholar] [CrossRef]
- D’Alessandro, D.M.; Smit, B.; Long, J.R. Carbon Dioxide Capture: Prospects for New Materials. Angew. Chem. Int. Ed. 2010, 49, 6058–6082. [Google Scholar] [CrossRef] [Green Version]
- Hwang, K.-J.; Hwang, M.J.; Balathanigaimani, M.S.; Nwe, K.; Youn, Y.; Choi, W.-S.; Kim, H.-A.; Nah, J.W.; Shim, W.G. Adsorption characteristics of light gases on basalt rock-based zeolite 4A. Adsorption 2019, 25, 833–842. [Google Scholar] [CrossRef]
- Park, J.M.; Yoo, D.K.; Jhung, S.H. Selective CO2 adsorption over functionalized Zr-based metal organic framework under atmospheric or lower pressure: Contribution of functional groups to adsorption. Chem. Eng. J. 2020, 402, 126254. [Google Scholar] [CrossRef]


| Material | N2 Adsorption | CO2 Adsorption | ||||
|---|---|---|---|---|---|---|
| SBET | Sext | VT | VDR, N2 | VDR, CO2 | Total CO2 Adsorption | |
| (m2/g) | (m2/g) | (cm3/g) | (cm3/g) | (cm3/g) | (mmol/g) a | |
| SiO2 (50 nm) | 129 | 76 | 0.25 | 0.06 | 0.11 | 0.94 b |
| APTES@SiO2 (50 nm) | 41 | 36 | 0.13 | 0.02 | 0.09 | 1.14 b |
| SiO2 (200 nm) | 20 | 20 | 0.03 | 0.006 | 0.13 | 1.00 b |
| APTES@SiO2 (200 nm) | 13 | 13 | 0.02 | 0.005 | 0.10 | 1.05 b |
| MOFs [50] | 1387 | - | - | - | - | 4.88 b |
| MOFs [51] | 516 | - | 0.26 | - | - | 2.75 b |
| N-doped porous C [52] | 860.4 | - | - | - | - | 4.65 c |
| N-doped porous C [53] | 1017 | - | - | - | - | 2.63 c |
| N-doped porous C [54] | 1353 | - | - | - | - | 5.67 c |
Publisher’s Note: MDPI stays neutral with regard to jurisdictional claims in published maps and institutional affiliations. |
© 2021 by the authors. Licensee MDPI, Basel, Switzerland. This article is an open access article distributed under the terms and conditions of the Creative Commons Attribution (CC BY) license (https://creativecommons.org/licenses/by/4.0/).
Share and Cite
Cueto-Díaz, E.J.; Castro-Muñiz, A.; Suárez-García, F.; Gálvez-Martínez, S.; Torquemada-Vico, M.C.; Valles-González, M.P.; Mateo-Martí, E. APTES-Based Silica Nanoparticles as a Potential Modifier for the Selective Sequestration of CO2 Gas Molecules. Nanomaterials 2021, 11, 2893. https://doi.org/10.3390/nano11112893
Cueto-Díaz EJ, Castro-Muñiz A, Suárez-García F, Gálvez-Martínez S, Torquemada-Vico MC, Valles-González MP, Mateo-Martí E. APTES-Based Silica Nanoparticles as a Potential Modifier for the Selective Sequestration of CO2 Gas Molecules. Nanomaterials. 2021; 11(11):2893. https://doi.org/10.3390/nano11112893
Chicago/Turabian StyleCueto-Díaz, Eduardo J., Alberto Castro-Muñiz, Fabián Suárez-García, Santos Gálvez-Martínez, Mª Carmen Torquemada-Vico, Mª Pilar Valles-González, and Eva Mateo-Martí. 2021. "APTES-Based Silica Nanoparticles as a Potential Modifier for the Selective Sequestration of CO2 Gas Molecules" Nanomaterials 11, no. 11: 2893. https://doi.org/10.3390/nano11112893
APA StyleCueto-Díaz, E. J., Castro-Muñiz, A., Suárez-García, F., Gálvez-Martínez, S., Torquemada-Vico, M. C., Valles-González, M. P., & Mateo-Martí, E. (2021). APTES-Based Silica Nanoparticles as a Potential Modifier for the Selective Sequestration of CO2 Gas Molecules. Nanomaterials, 11(11), 2893. https://doi.org/10.3390/nano11112893