
Excellent UV-Light Triggered Photocatalytic Performance of ZnO.SiO2 Nanocomposite for Water Pollutant Compound Methyl Orange Dye

 ,
,  ,
,  ,
,  and
and
Abstract
:1. Introduction
2. Experimental Details
2.1. Materials Used
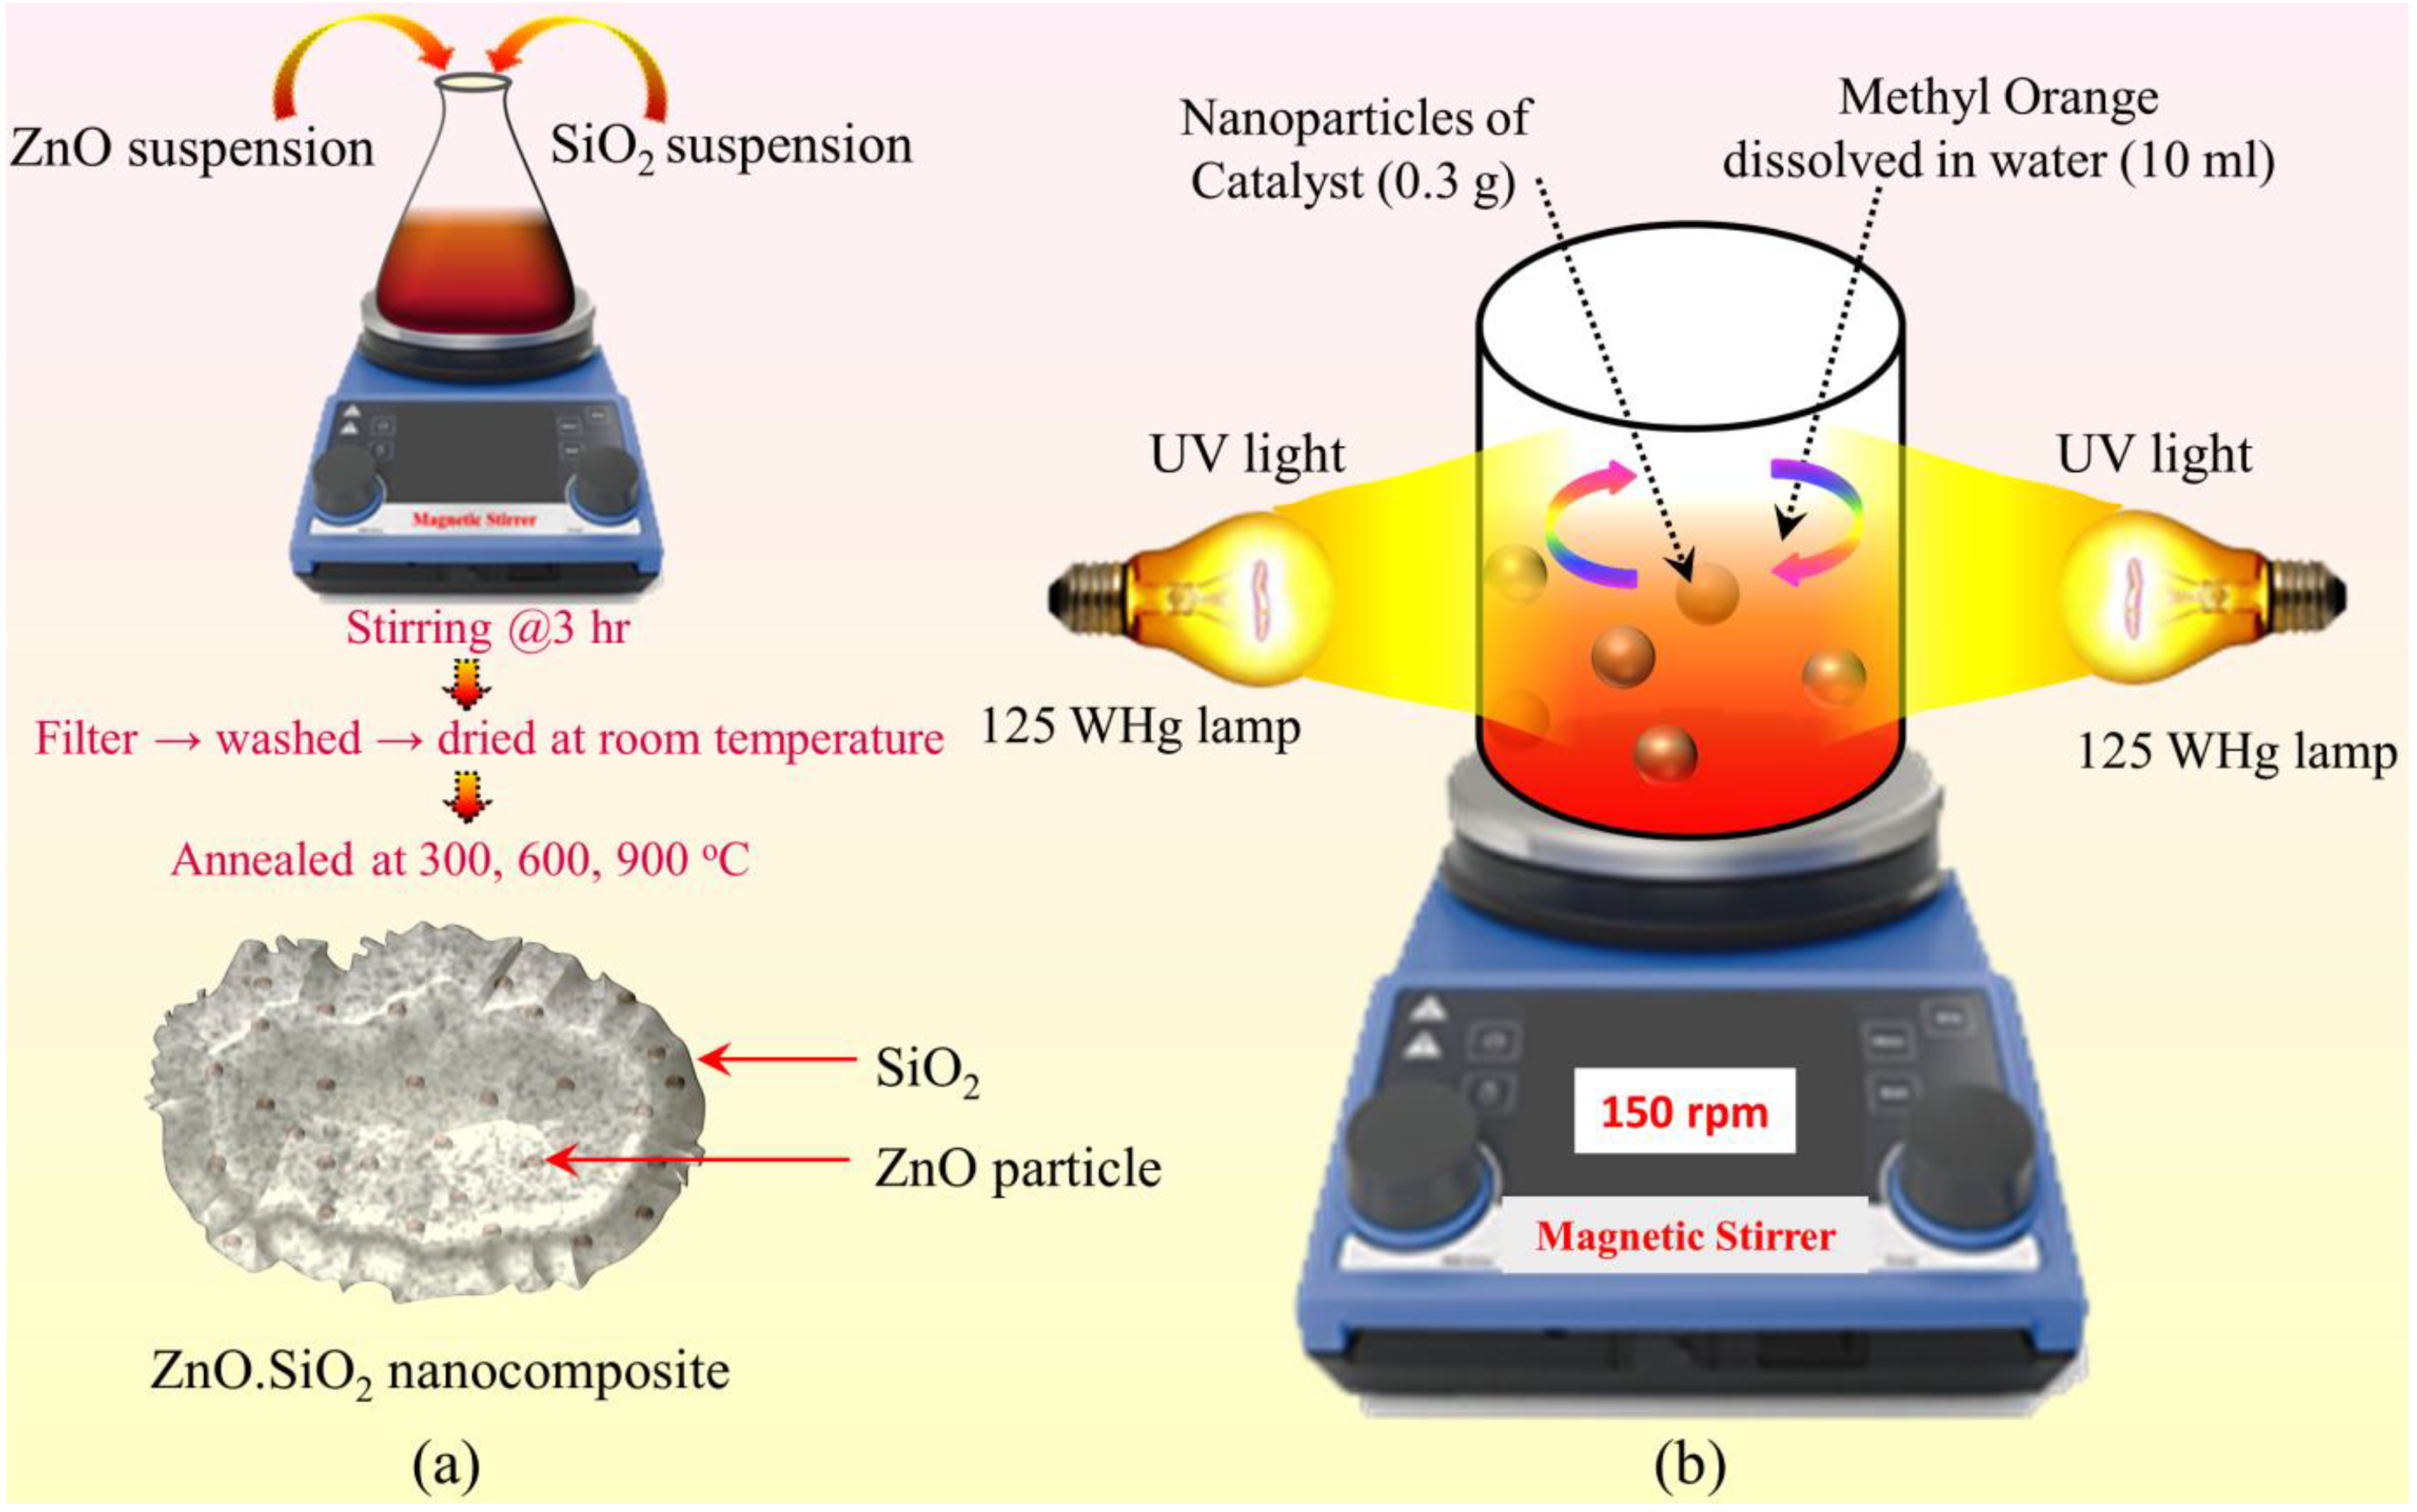
2.2. Synthesis
2.3. Characterization
2.4. Photocatalytic Activity
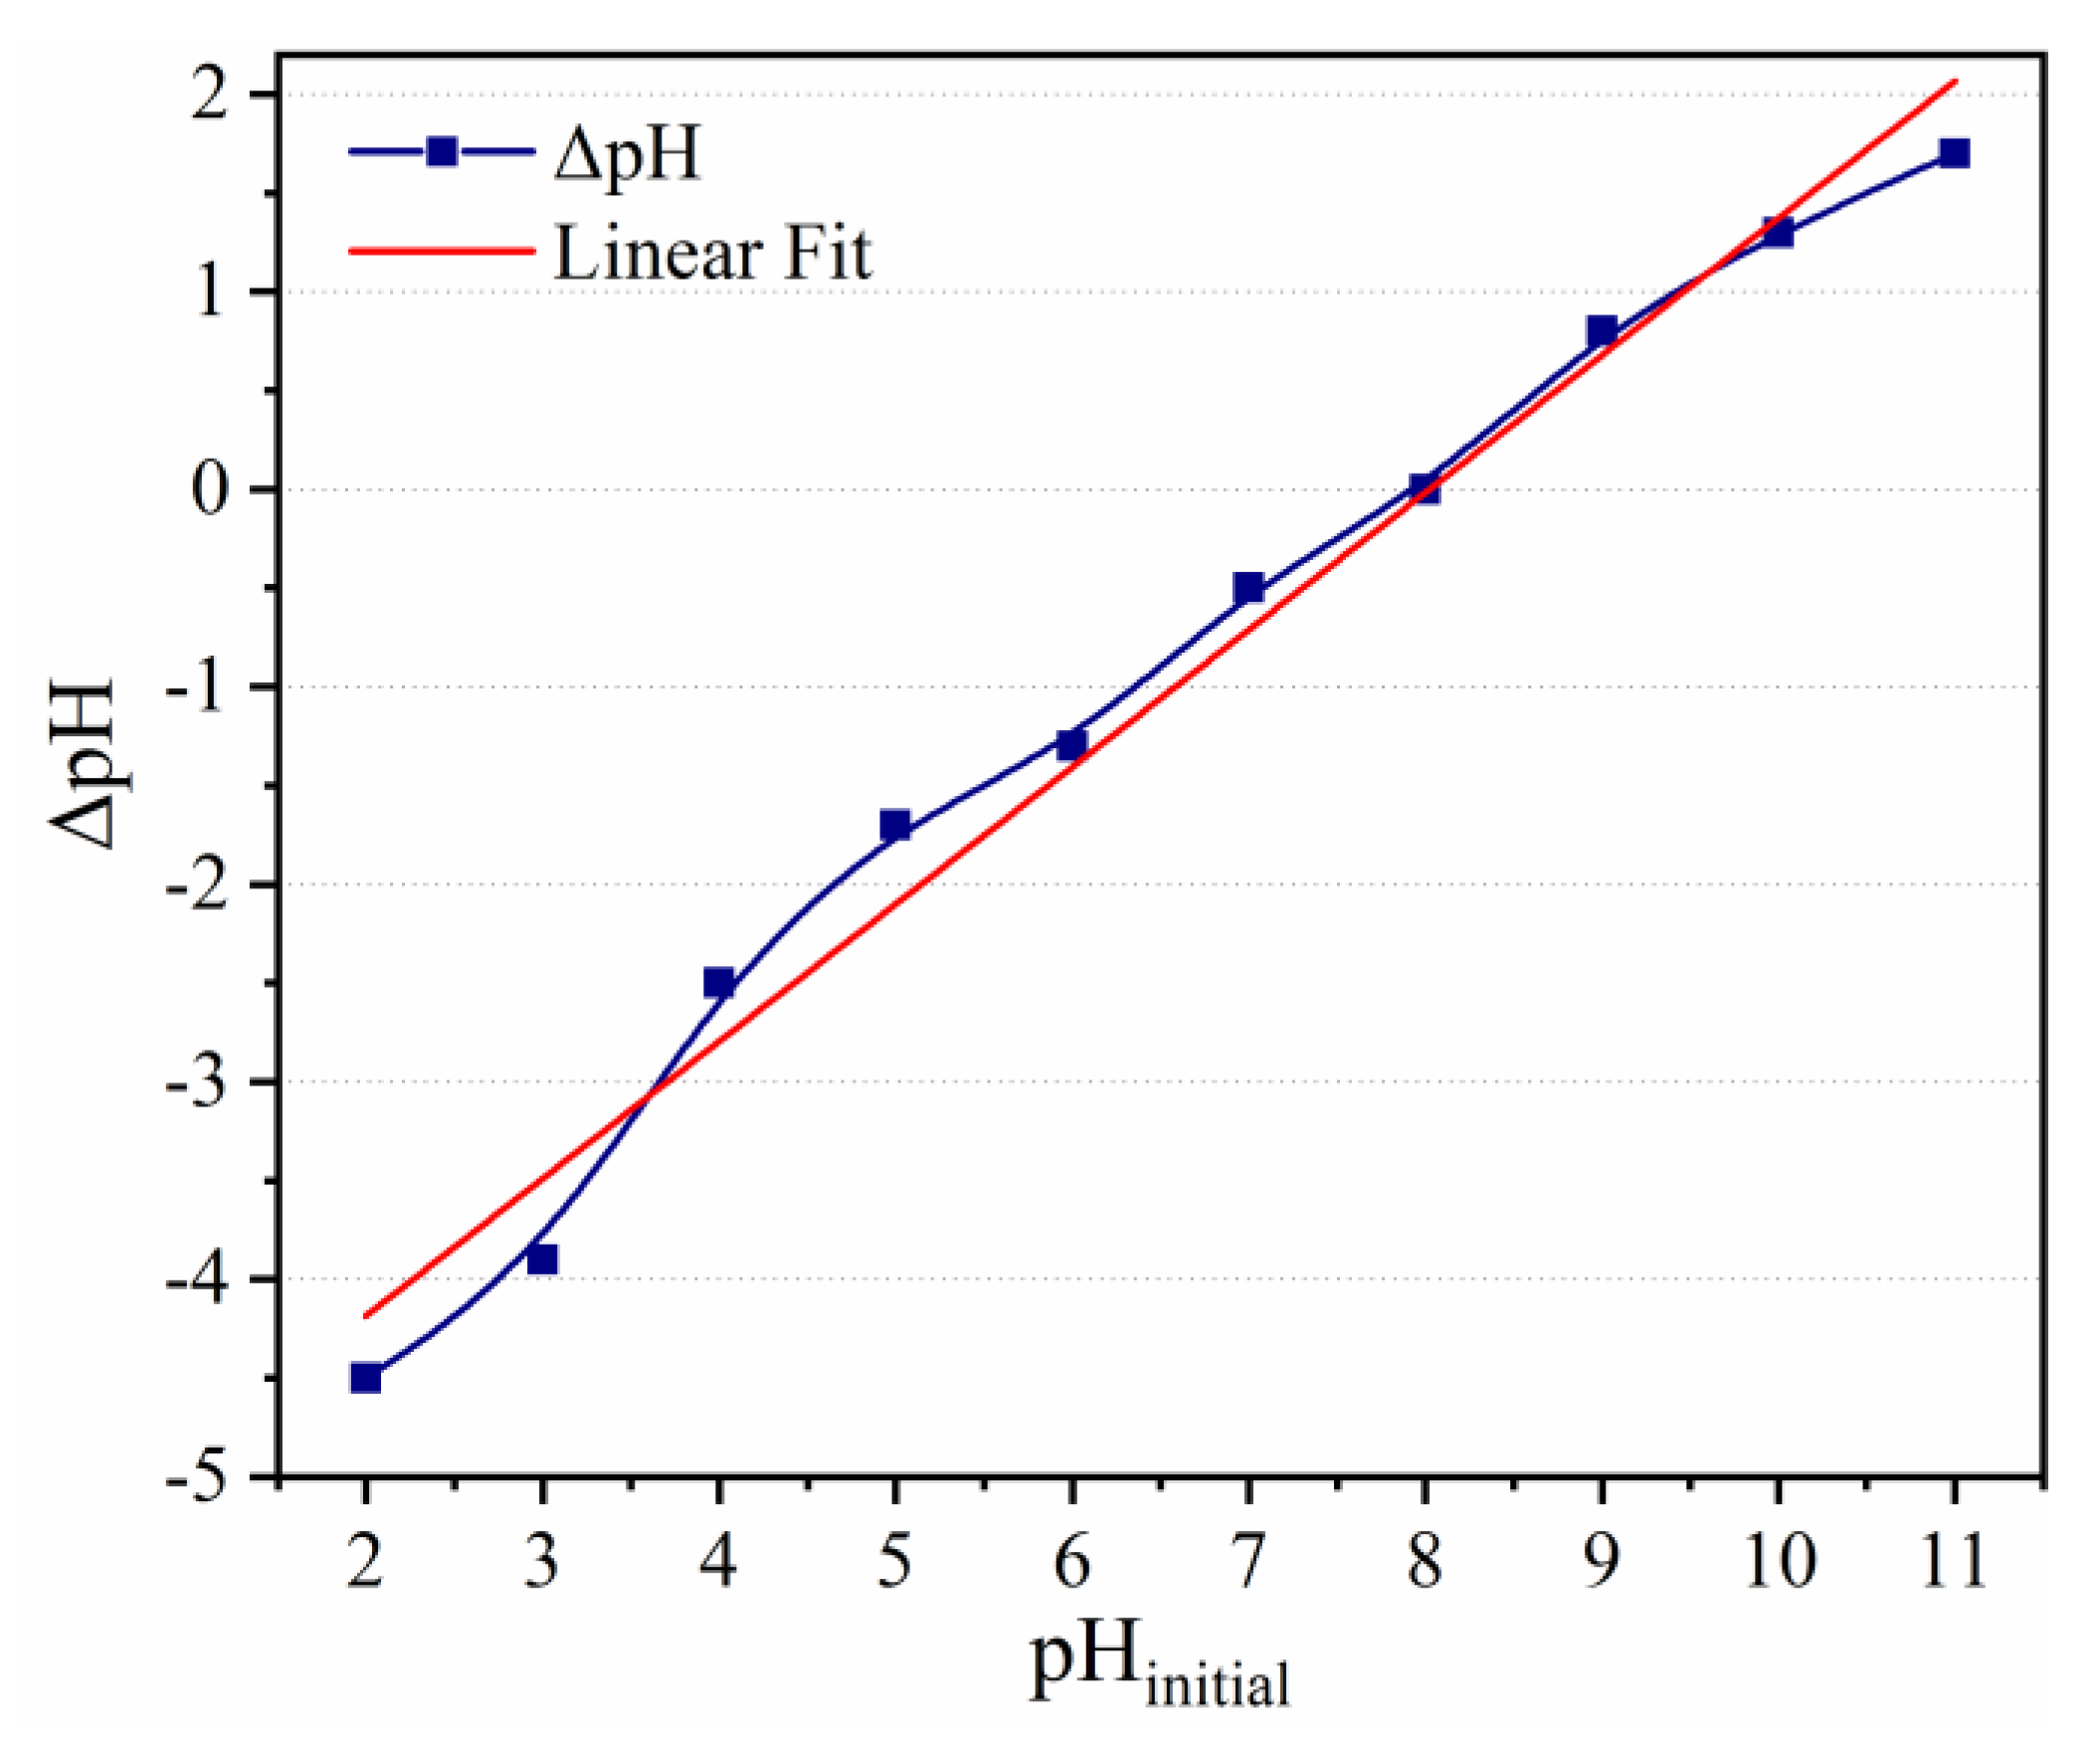
2.5. Zero-Point Charge
3. Results and Discussion
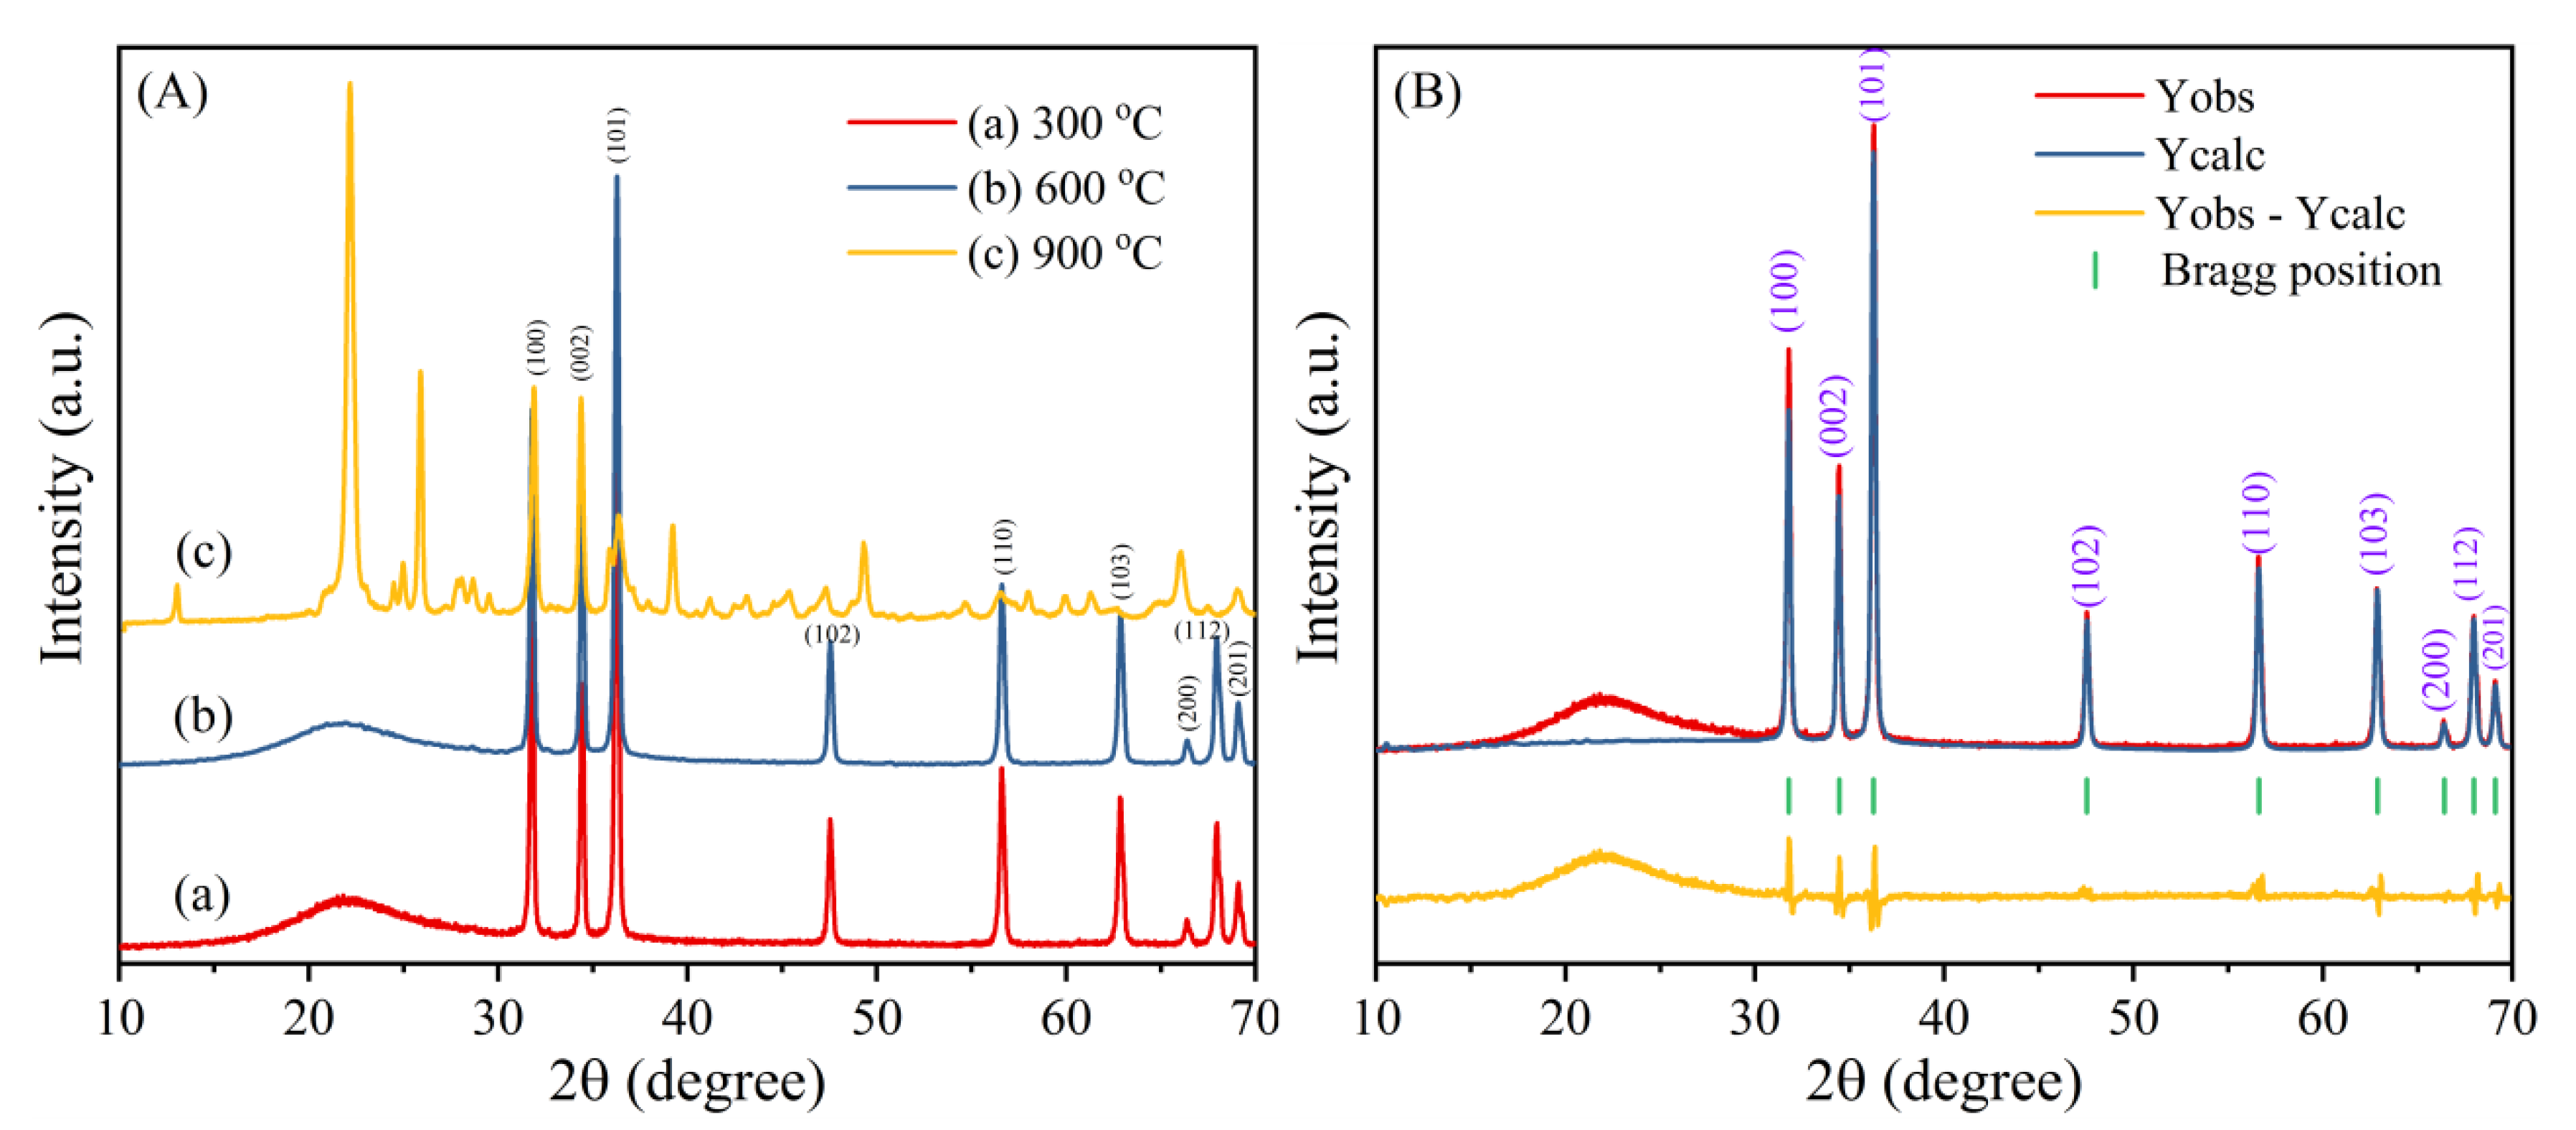
3.1. XRD Analysis
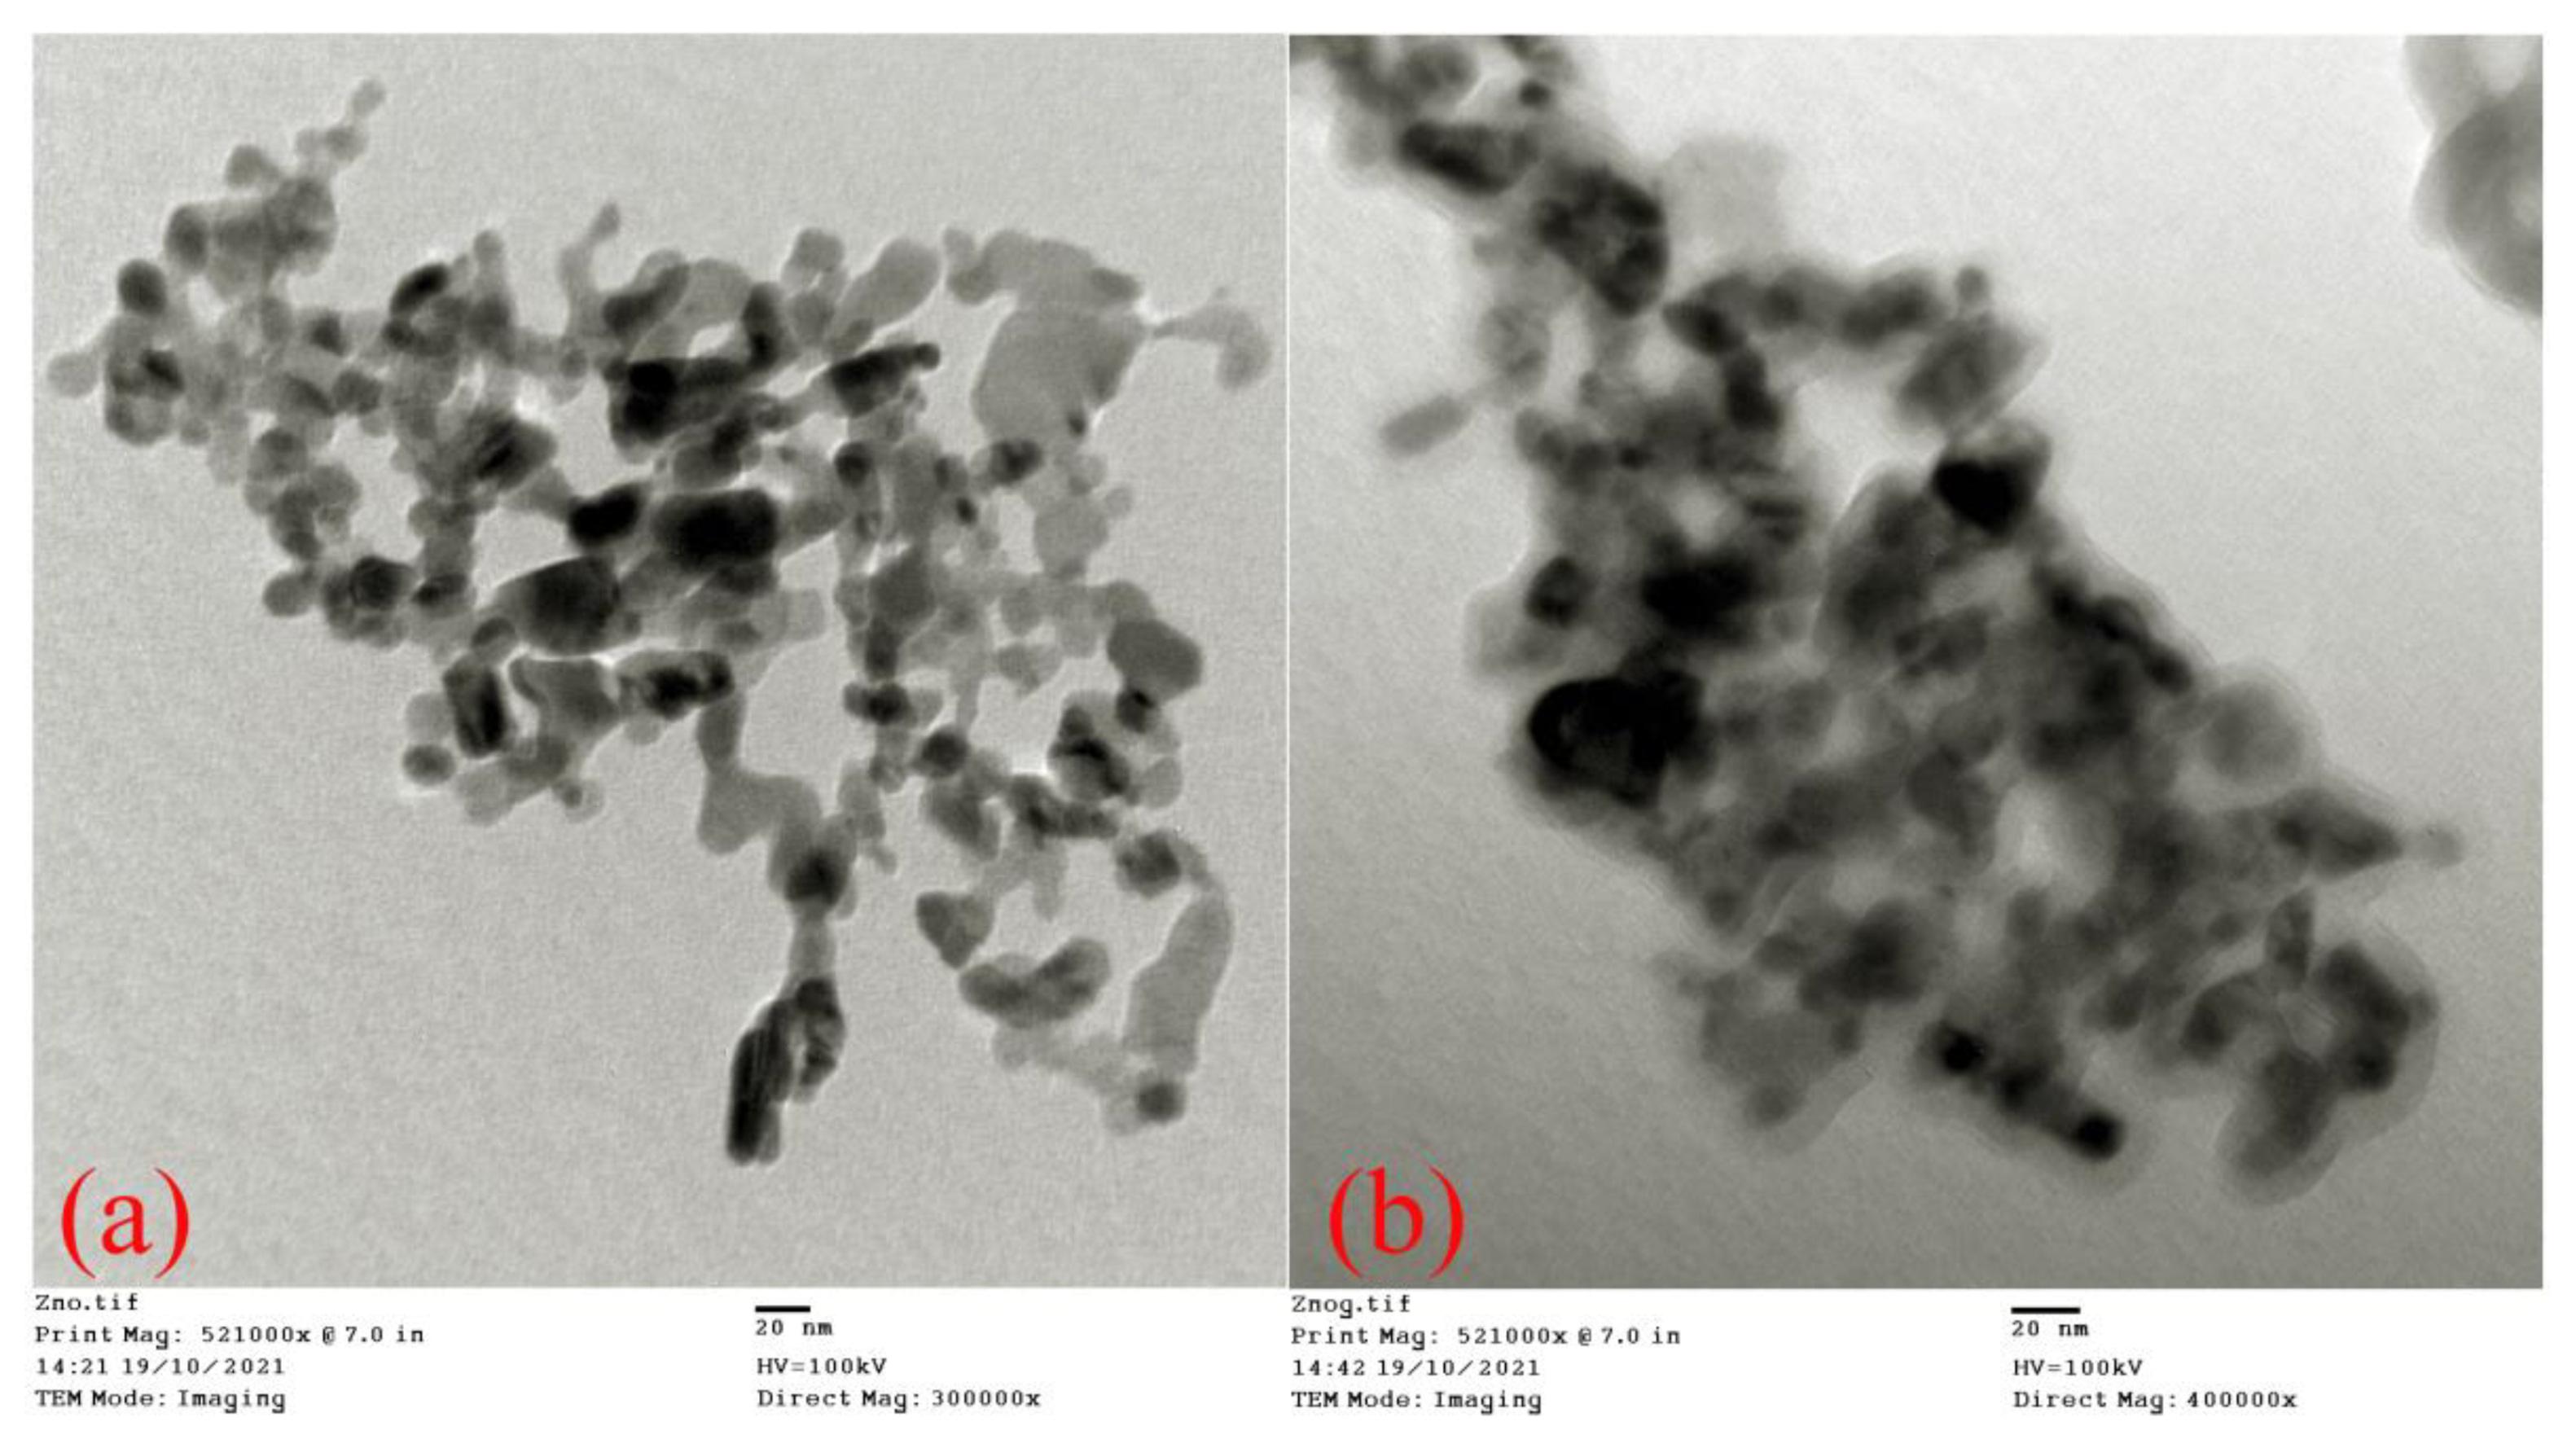
3.2. TEM Analysis
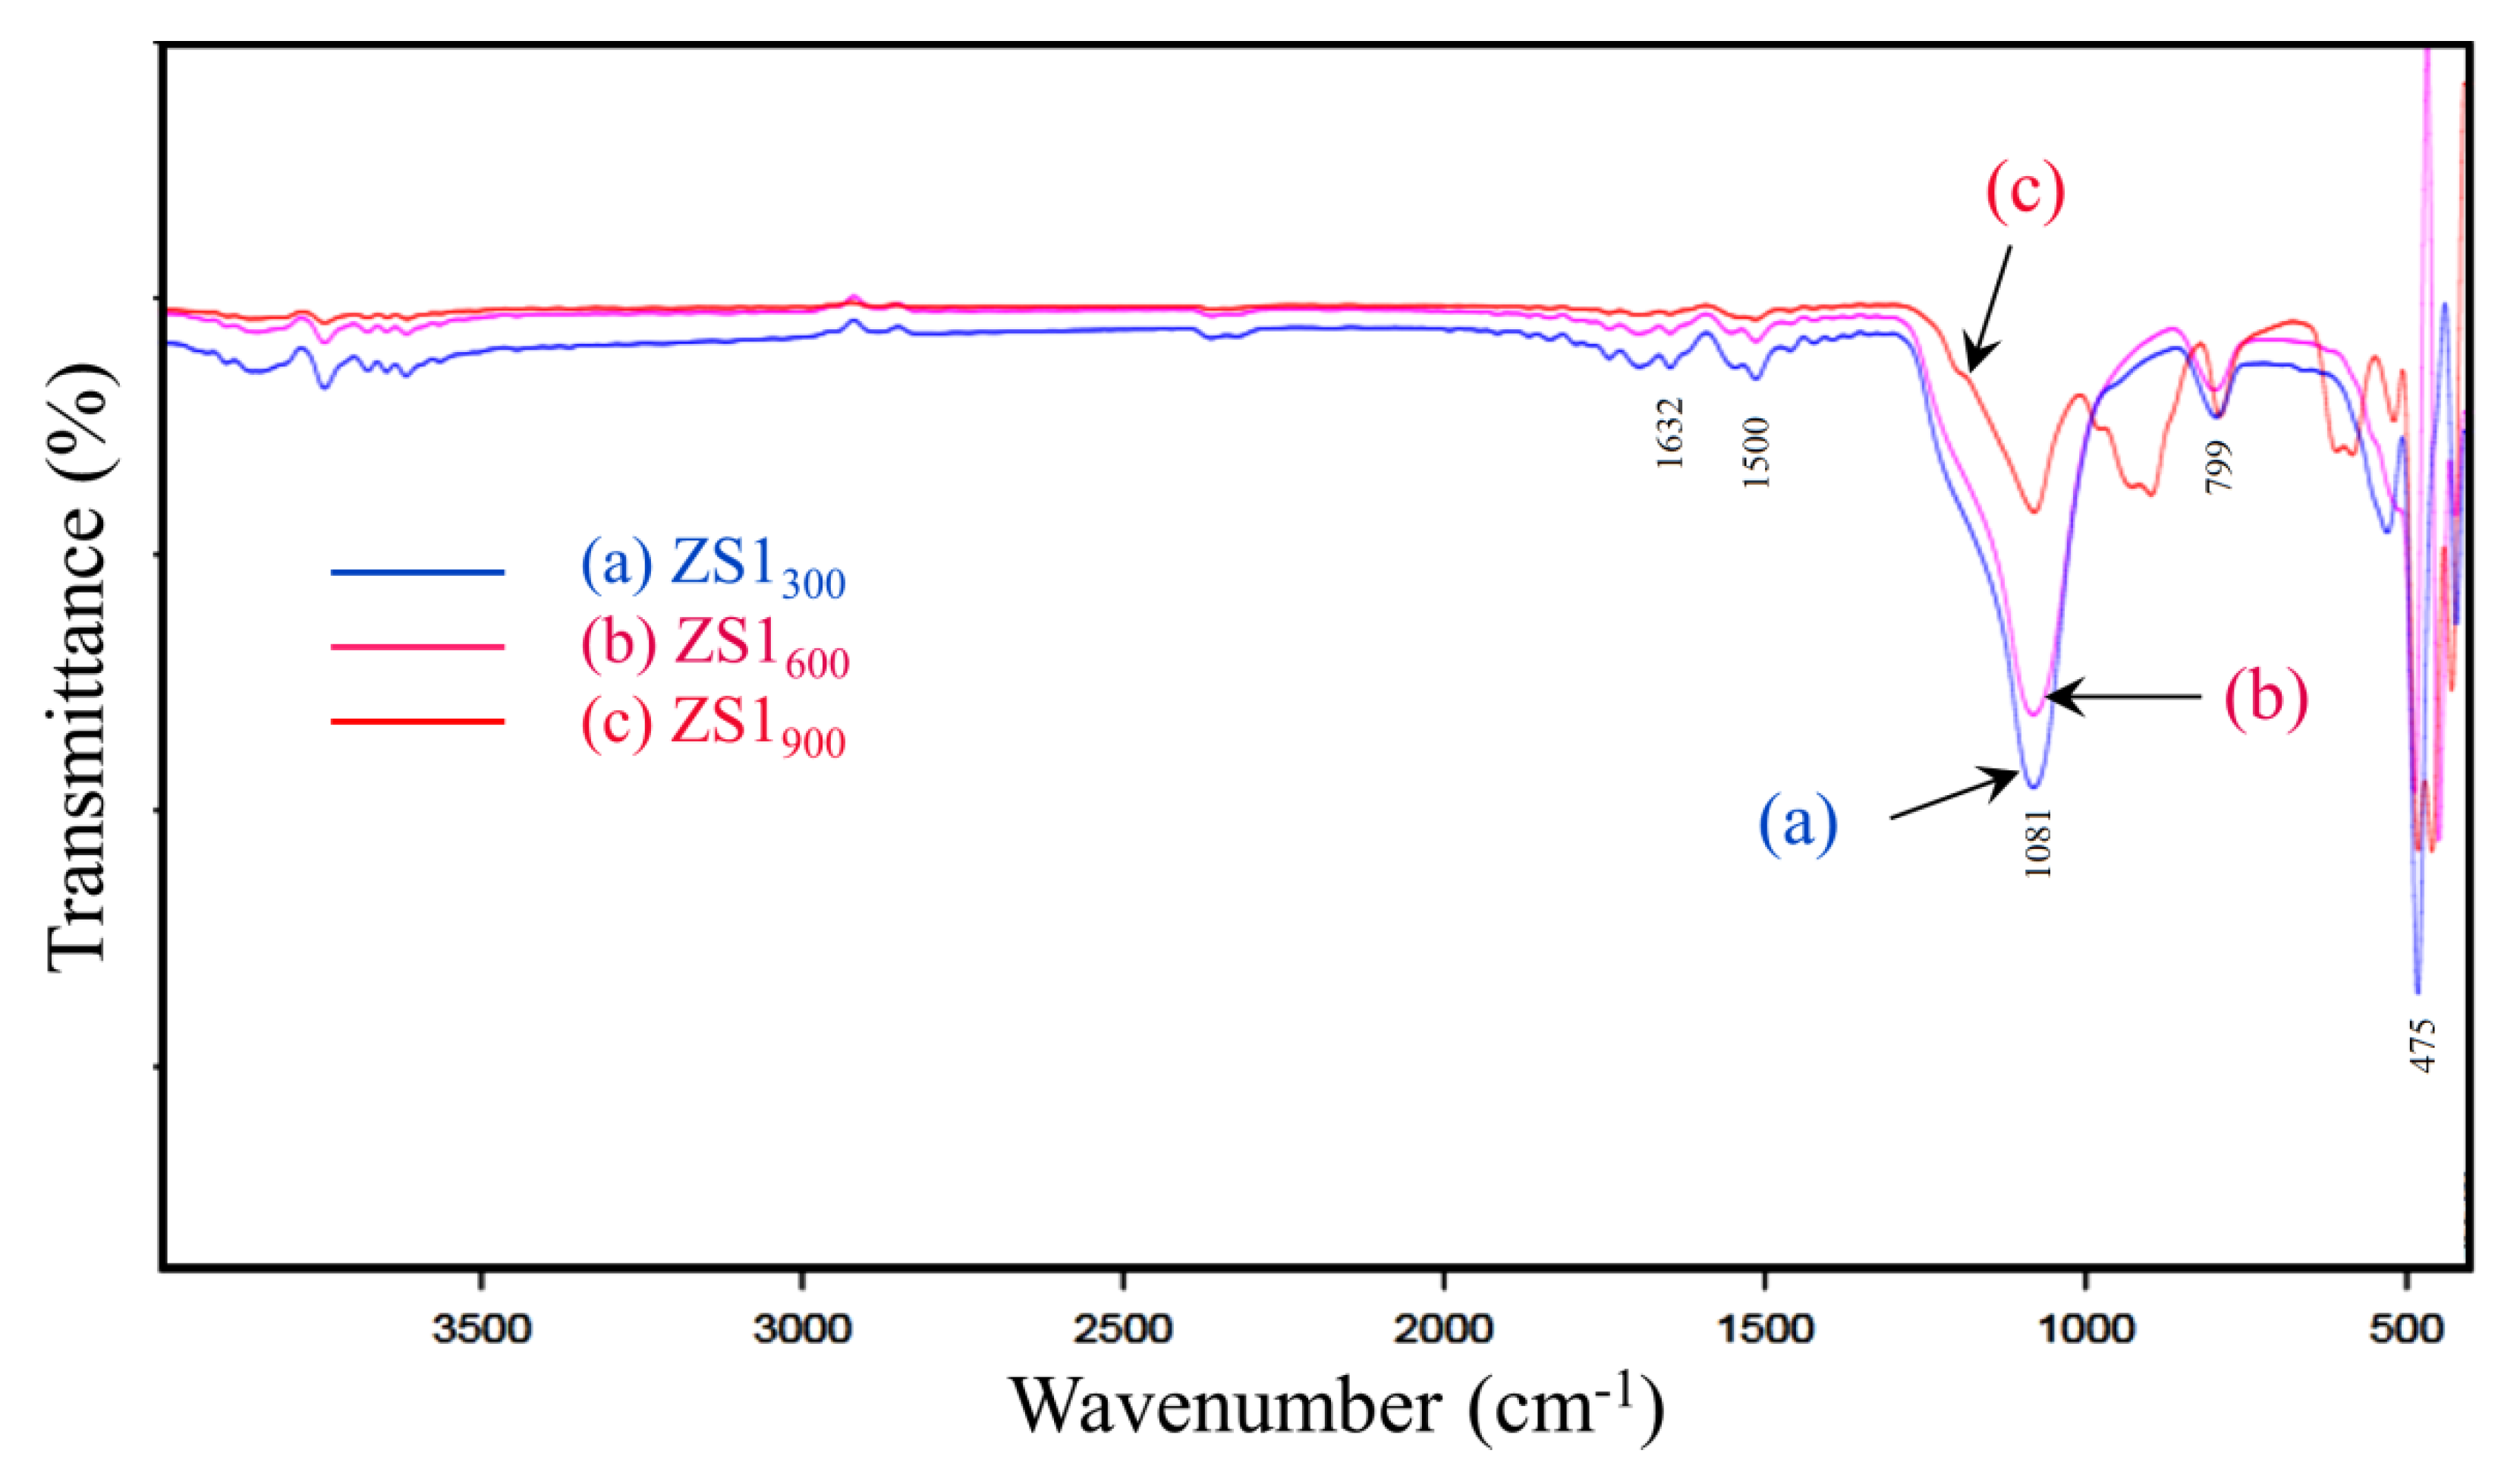
3.3. FTIR Analysis
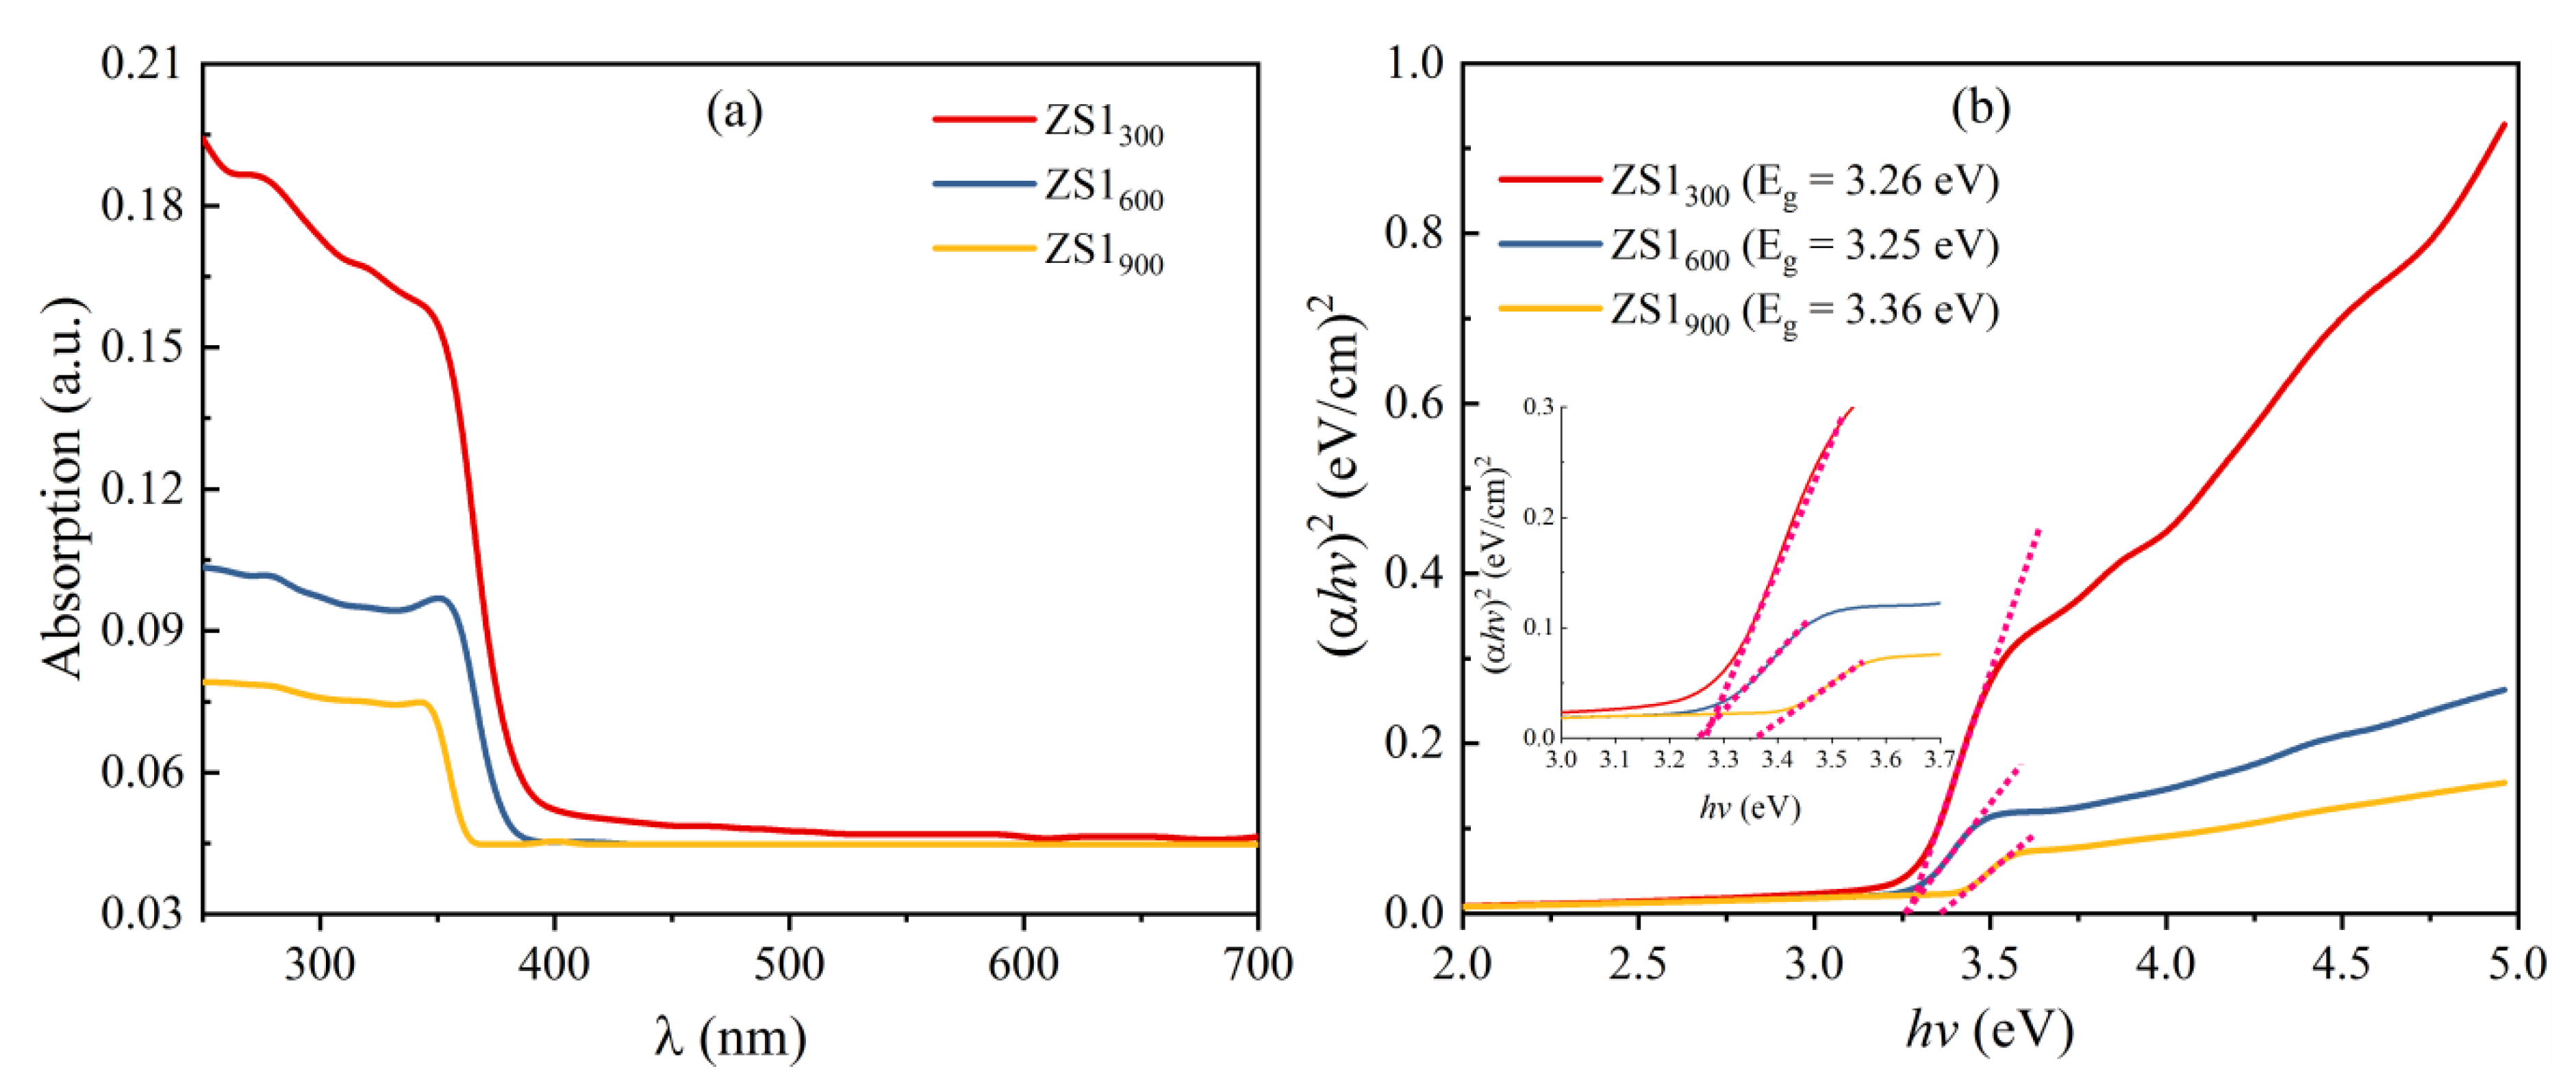
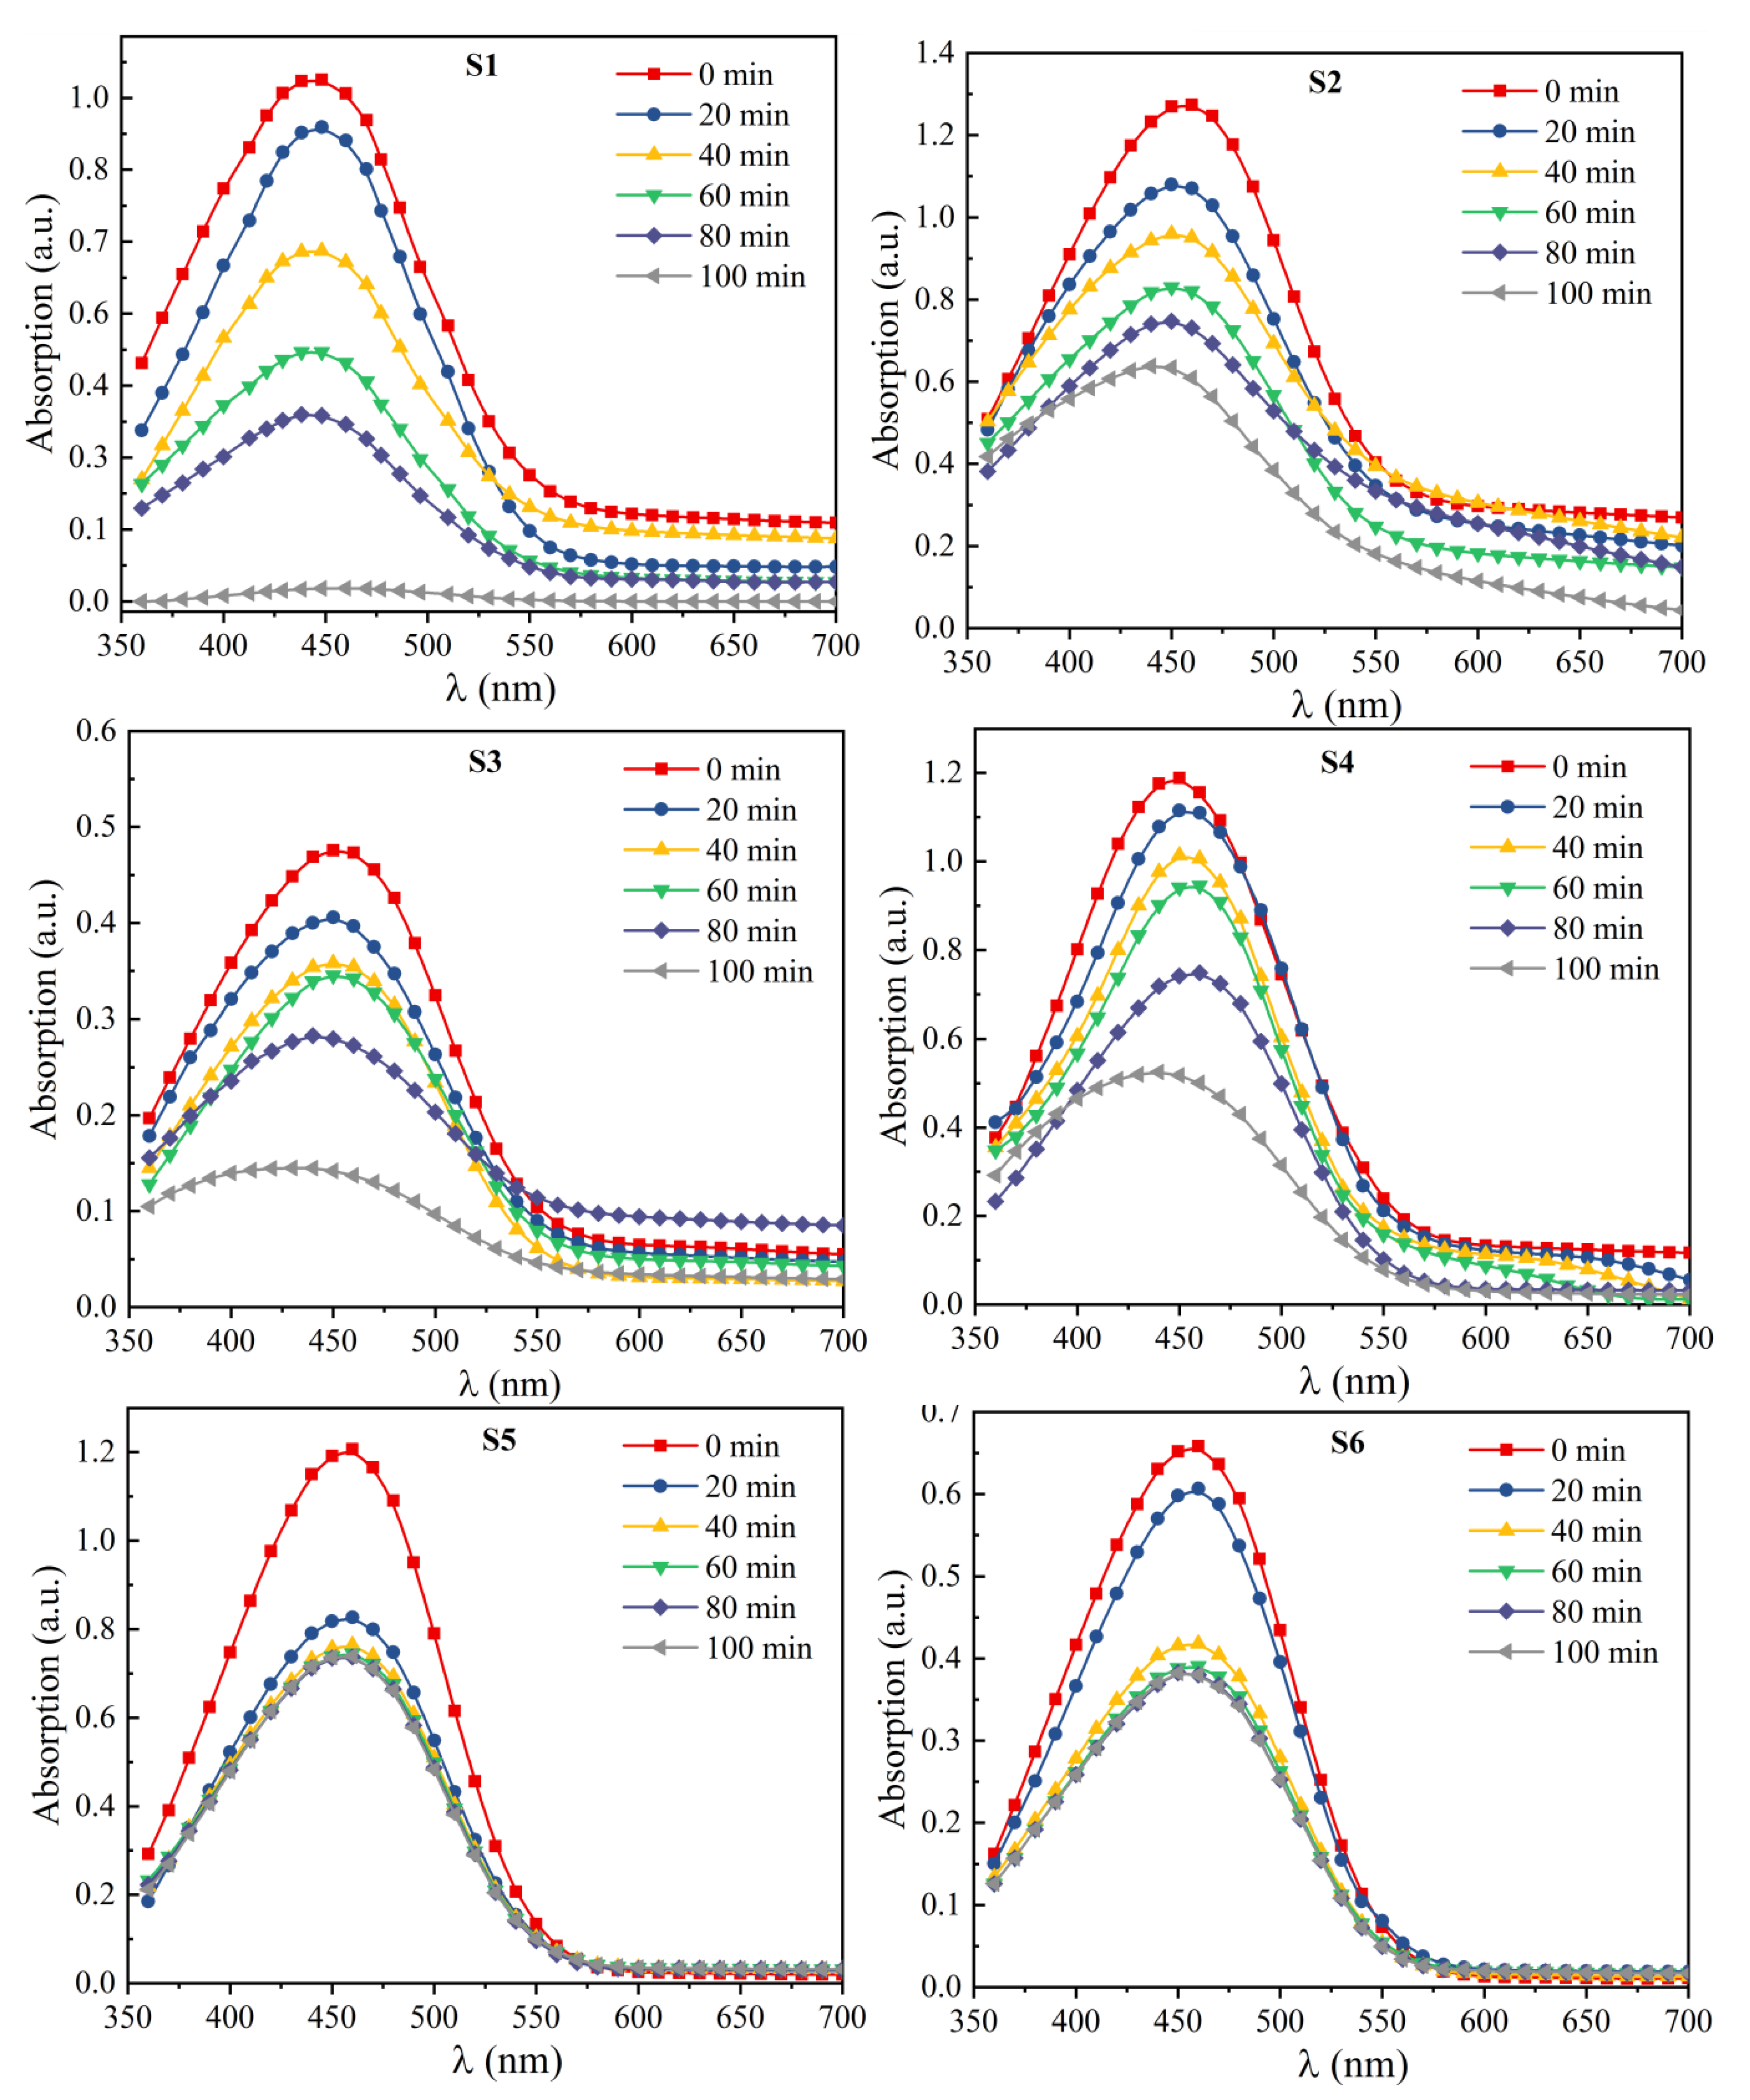
3.4. UV-Visible Analysis
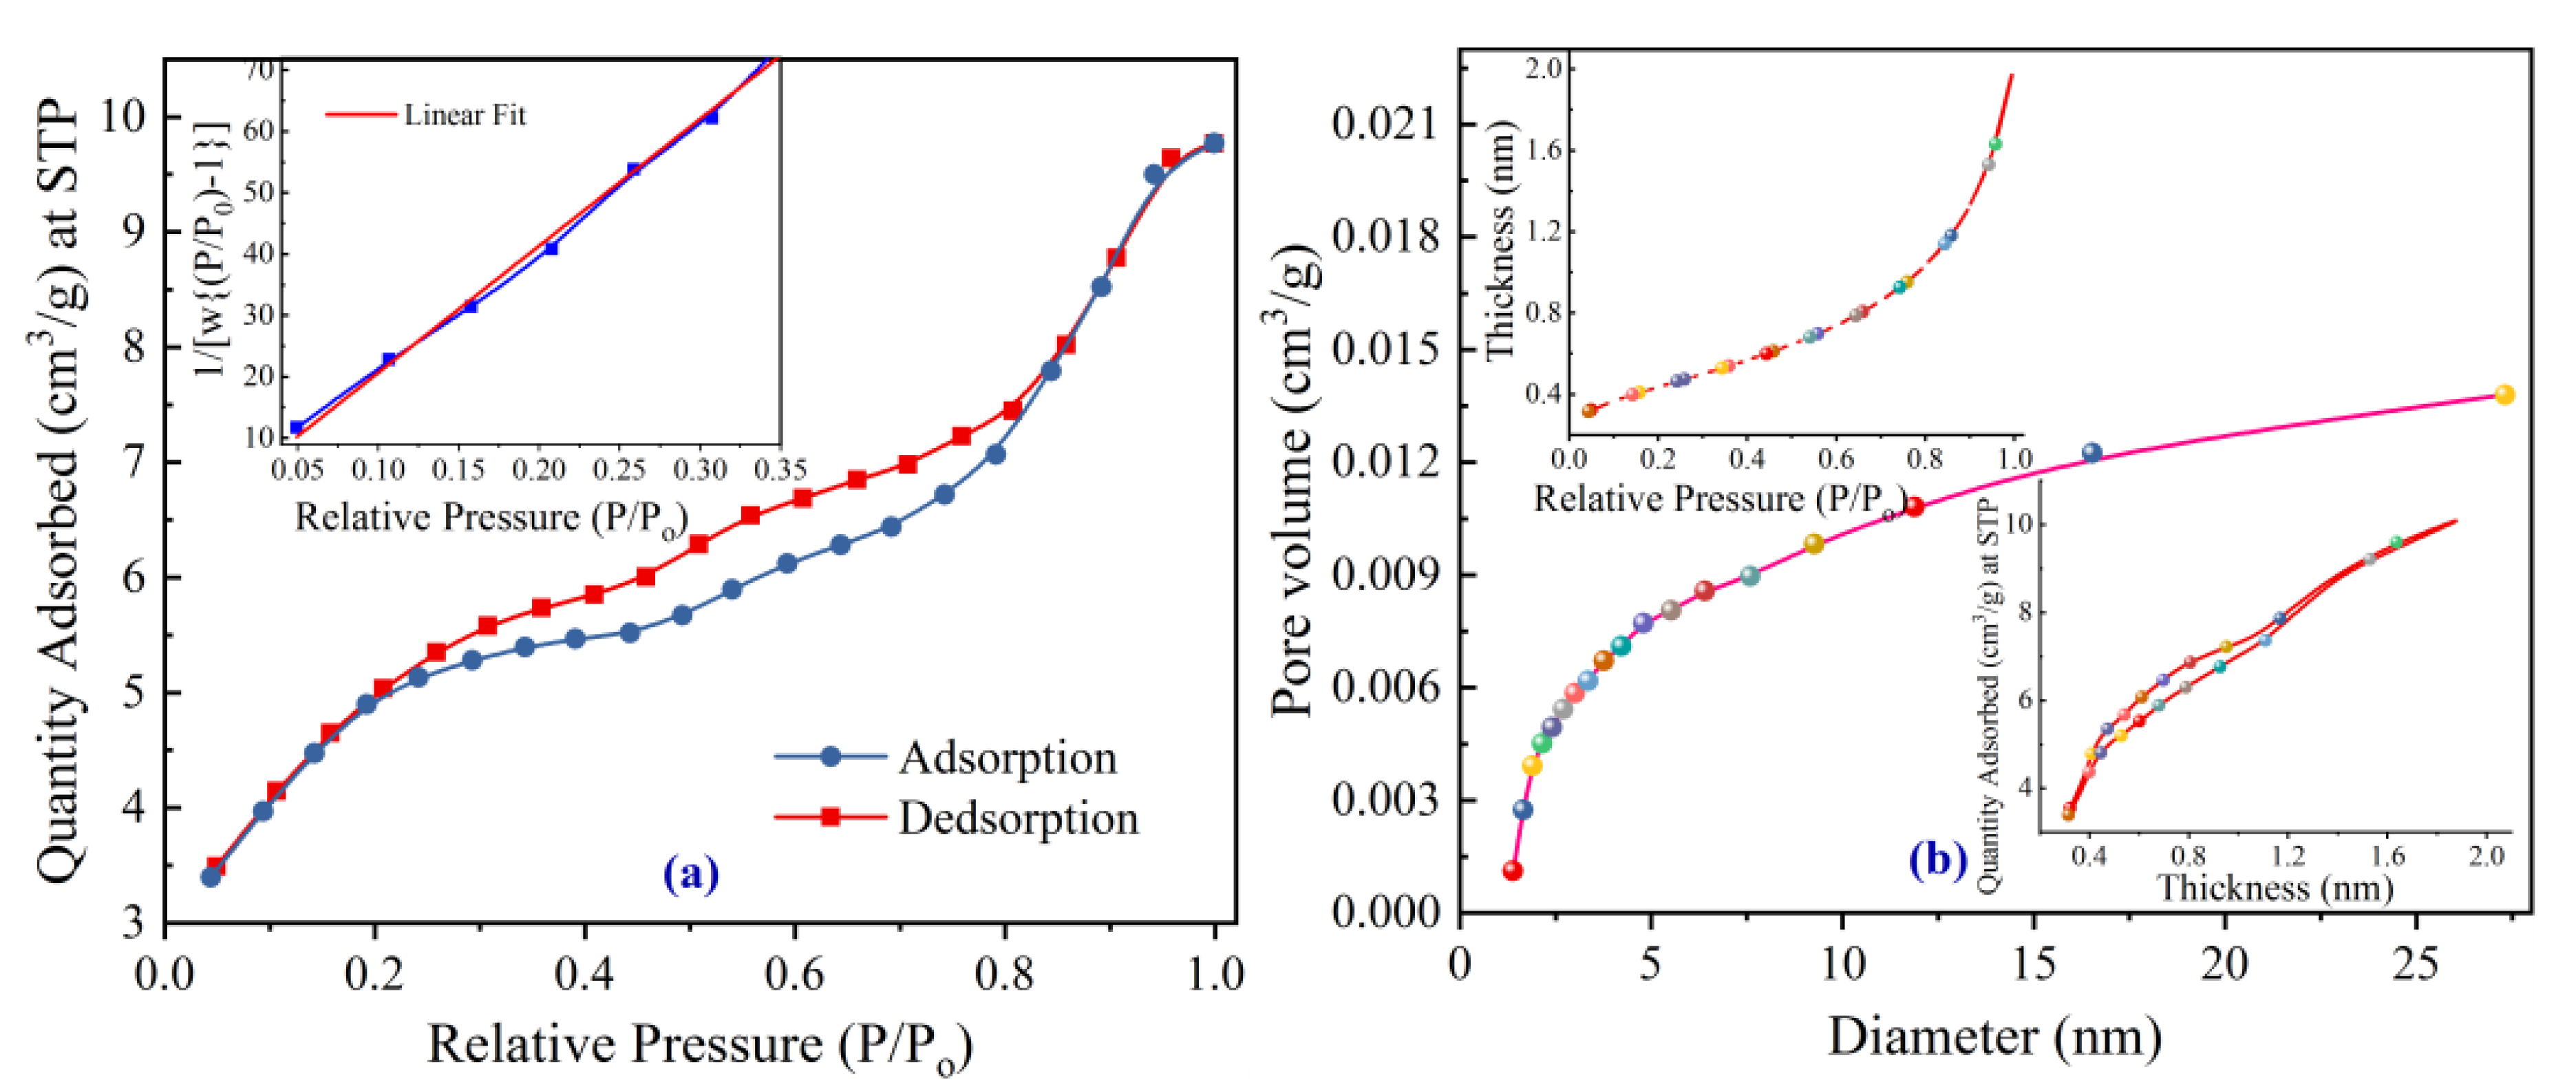
3.5. BET Analysis
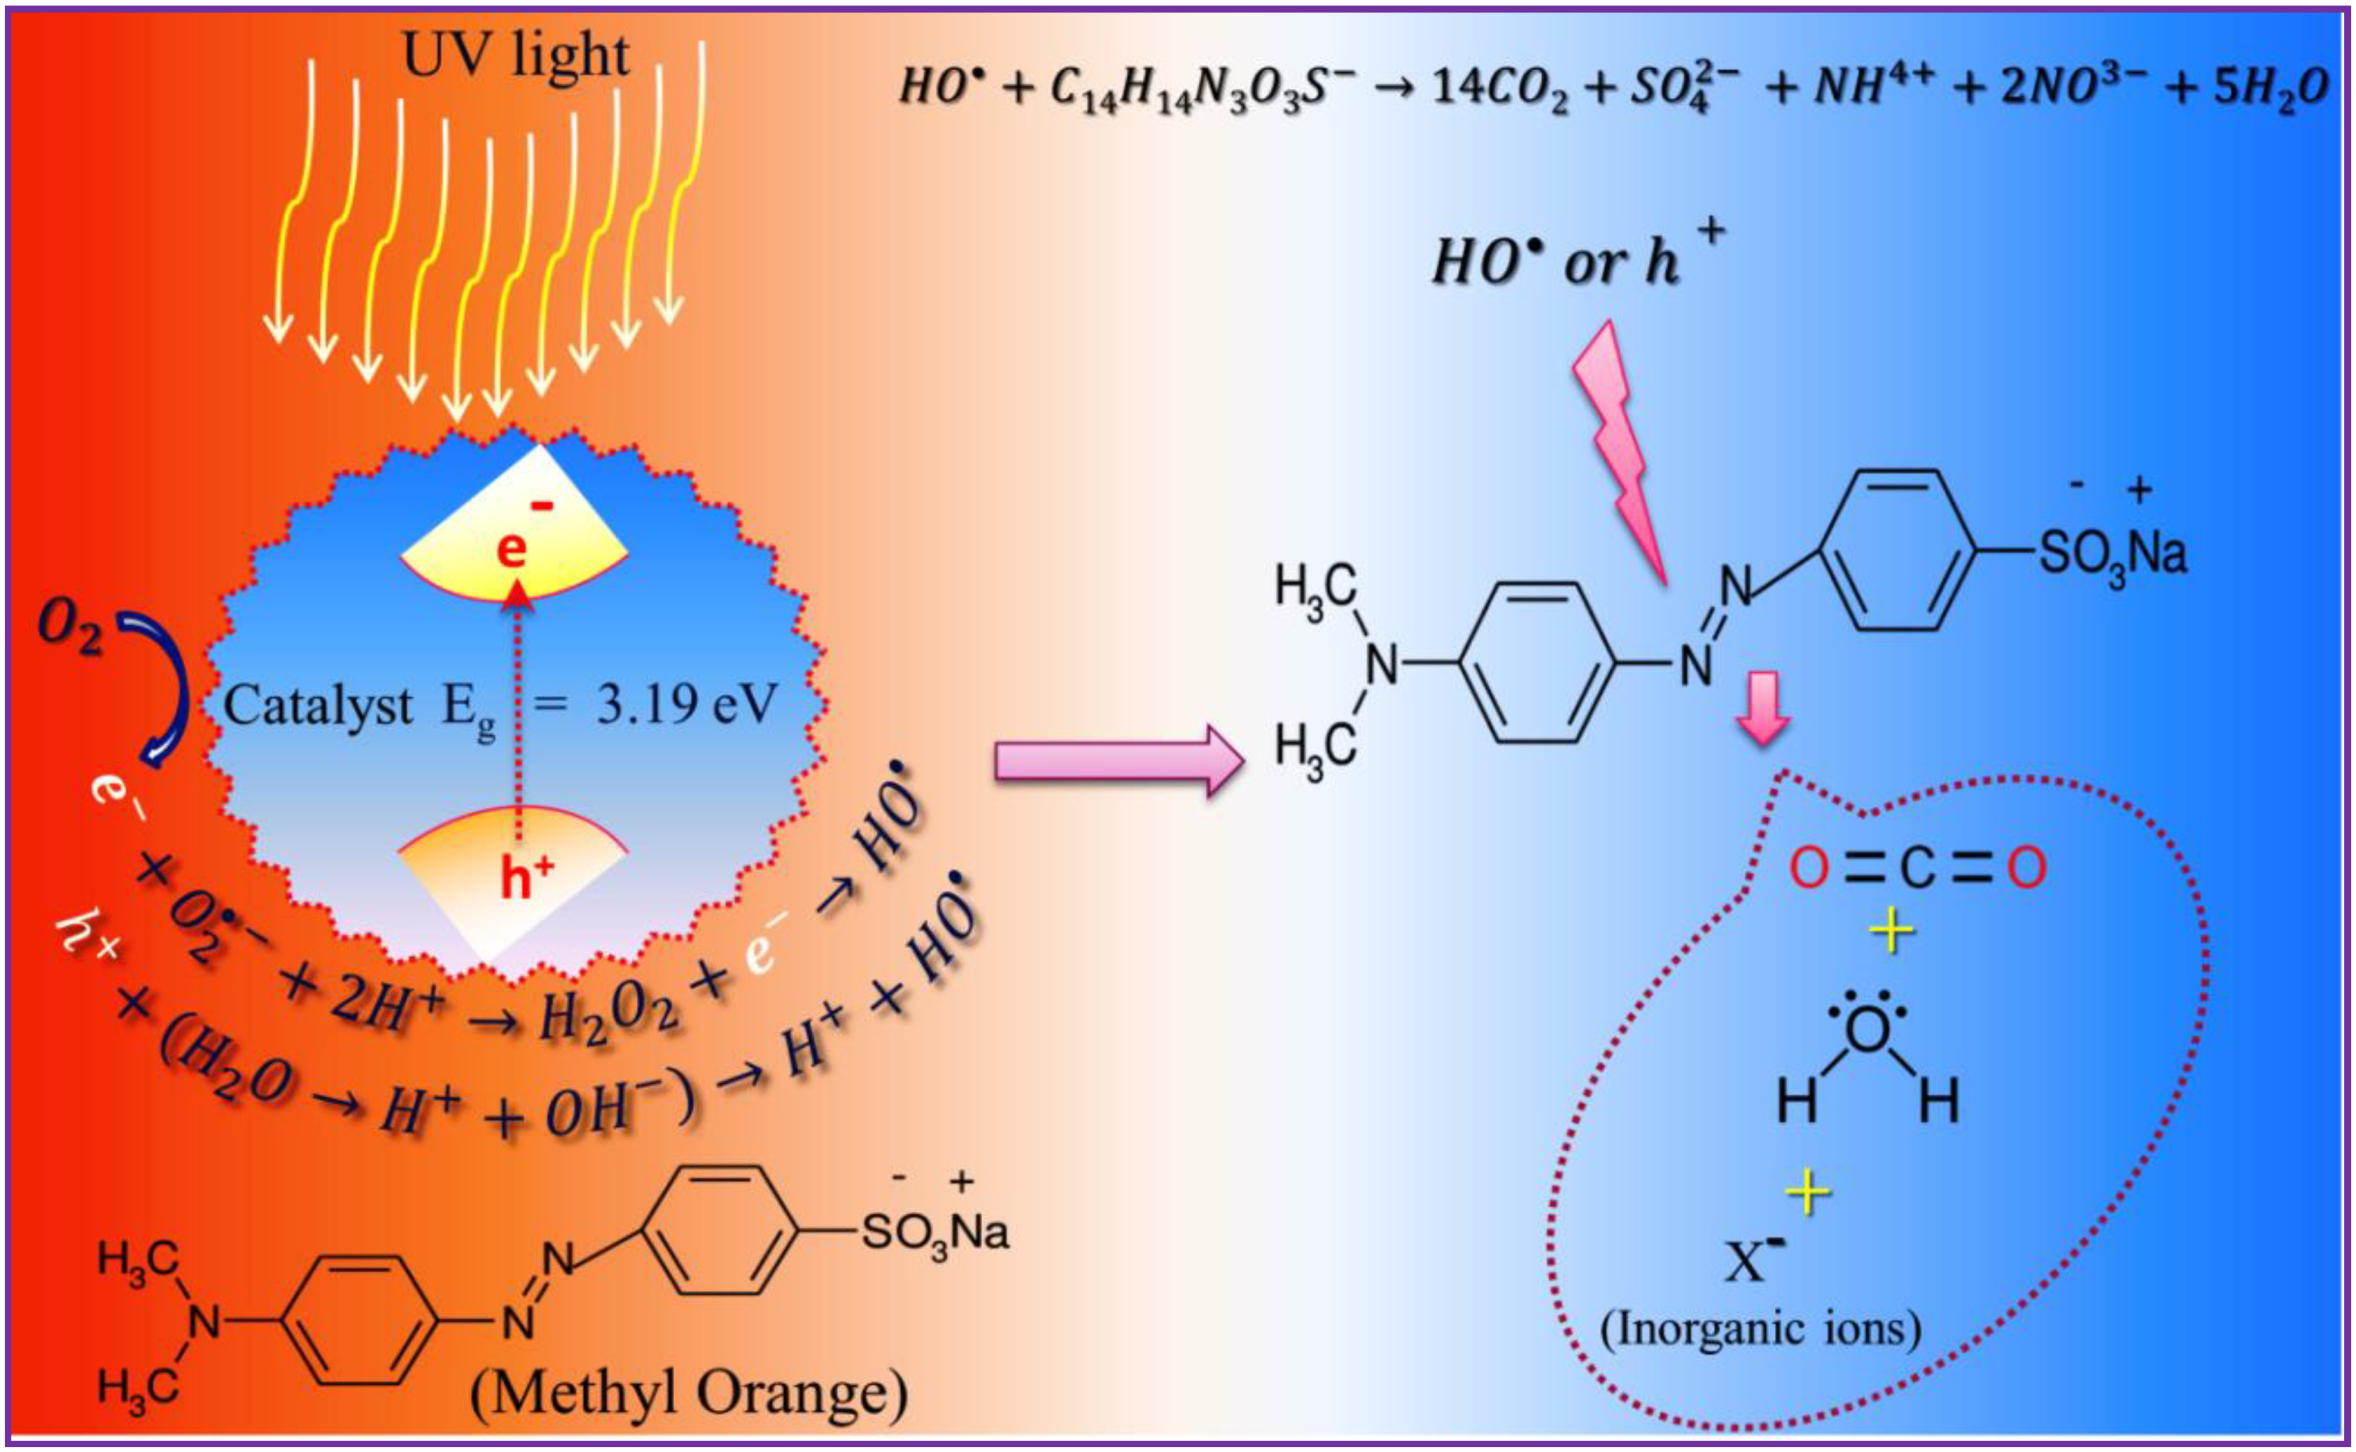
3.6. Photocatalytic Studies
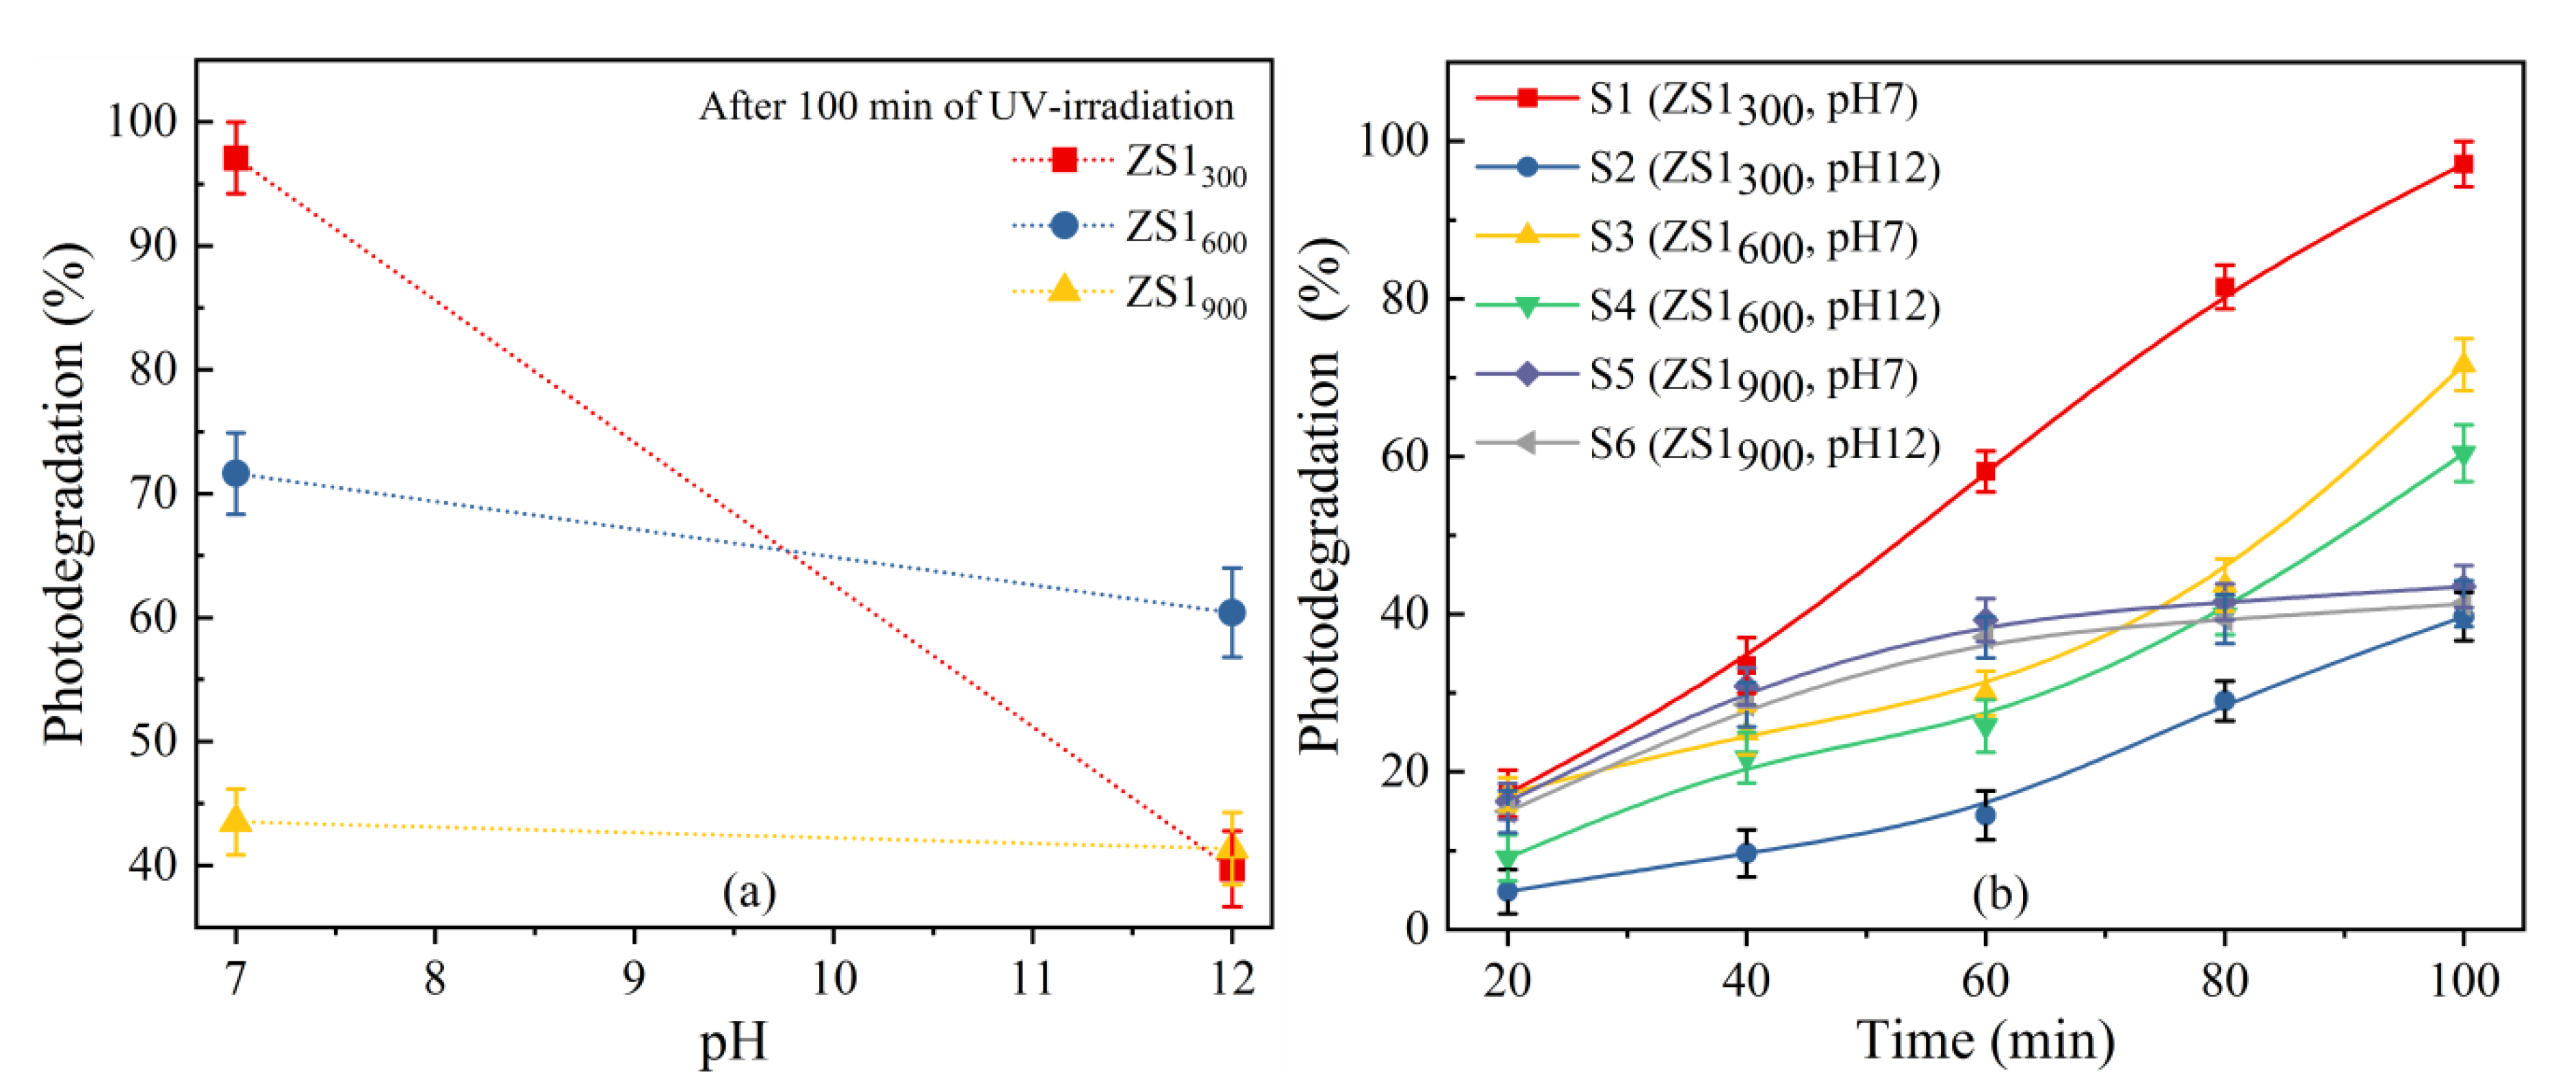
3.6.1. Effect of pH and Irradiation Time
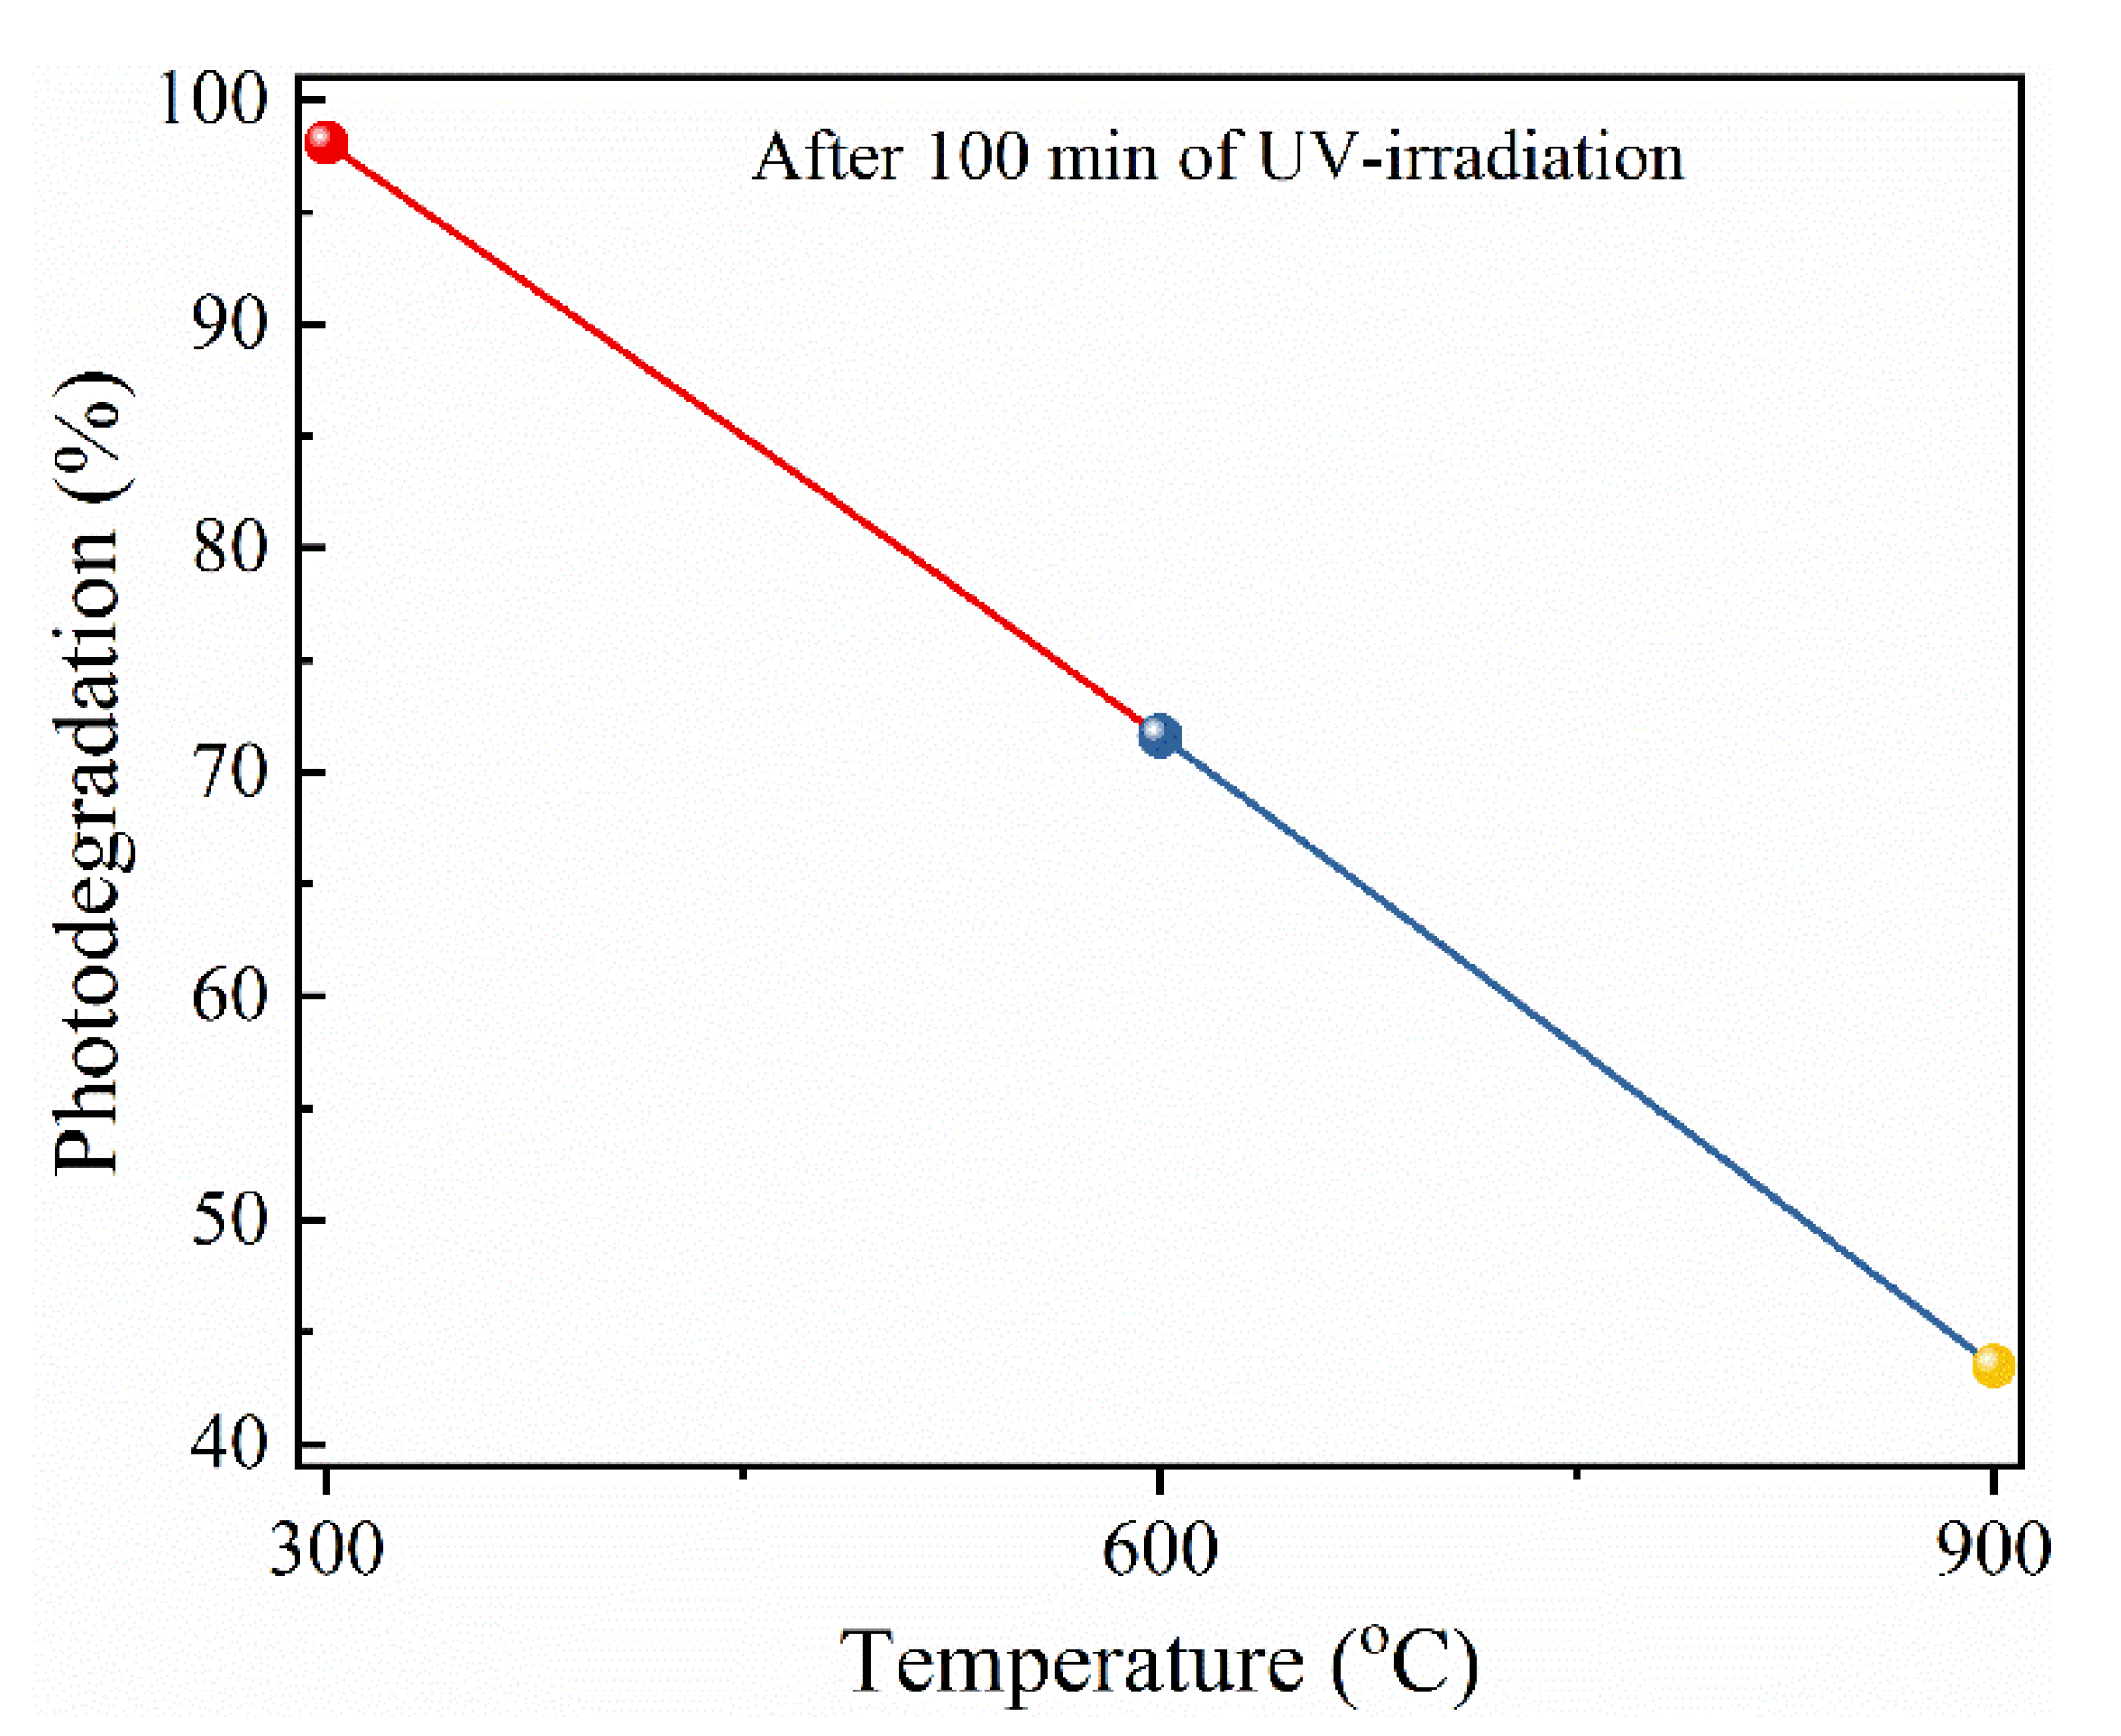
3.6.2. Effect of Annealing Temperatures
3.6.3. Effect of NaOH Concentration
4. Conclusions
Supplementary Materials
Author Contributions
Funding
Conflicts of Interest
References
- Karimi, A.; Kazeminezhad, I.; Azizi, S. Ag/αFe2O3-rGO novel ternary nanocomposites: Synthesis, characterization, and pho-tocatalytic activity. Ceram. Int. 2019, 45, 3441–3448. [Google Scholar] [CrossRef]
- Robinson, T.; McMullan, G.; Marchant, R.; Nigam, P. Remediation of dyes in textile effluent: A critical review on current treatment technologies with a proposed alternative. Bioresour. Technol. 2001, 77, 247–255. [Google Scholar] [CrossRef]
- Ajmal, A.; Majeed, I.; Malik, R.N.; Idriss, H.; Nadeem, M.A. Principles and mechanisms of photocatalytic dye degradation on TiO2 based photocatalysts: A comparative overview. RSC Adv. 2014, 4, 37003–37026. [Google Scholar] [CrossRef]
- Rakhshaee, R.; Giahi, M.; Pourahmad, A. Removal of methyl orange from aqueous solution by Azolla filicoloides: Synthesis of Fe3O4 nano-particles and its surface modification by the extracted pectin of Azolla. Chin. Chem. Lett. 2011, 22, 501–504. [Google Scholar] [CrossRef]
- Al-Qaradawi, S.; Salman, S.R. Photocatalytic degradation of methyl orange as a model compound. J. Photochem. Photobiol. A Chem. 2002, 148, 161–168. [Google Scholar] [CrossRef]
- Katsuda, T.; Ooshima, H.; Azuma, M.; Kato, J. New detection method for hydrogen gas for screening hydrogen-producing microorganisms using water-soluble wilkinson’s catalyst derivative. J. Biosci. Bioeng. 2006, 102, 220–226. [Google Scholar] [CrossRef]
- Chung, K.-T. Azo dyes and human health: A review. J. Environ. Sci. Heal. Part C 2016, 34, 233–261. [Google Scholar] [CrossRef]
- Sha, Y.; Mathew, I.; Cui, Q.; Clay, M.; Gao, F.; Zhang, X.J.; Gu, Z. Rapid degradation of azo dye methyl orange using hollow cobalt nanoparticles. Chemosphere 2016, 144, 1530–1535. [Google Scholar] [CrossRef]
- Chamjangali, M.A.; Bagherian, G.; Javid, A.; Boroumand, S.; Farzaneh, N. Synthesis of Ag-ZnO with multiple rods (multipods) morphology and its application in the simultaneous photo-catalytic degradation of methyl orange and methylene blue. Spectrochim. Acta Part A Mol. Biomol. Spectrosc. 2015, 150, 230–237. [Google Scholar] [CrossRef]
- Paul, K.K.; Ghosh, R.; Giri, P.K. Mechanism of strong visible light photocatalysis by Ag2O-nanoparticle-decorated monoclinic TiO2(B) porous nanorods. Nanotechnology 2016, 27, 315703. [Google Scholar] [CrossRef] [Green Version]
- Theerthagiri, J.; Chandrasekaran, S.; Salla, S.; Elakkiya, V.; Senthil, R.A.; Nithyadharseni, P.; Maiyalagan, T.; Micheal, K.; Ayeshamariam, A.; Arasu, A.M.; et al. Recent developments of metal oxide based heterostructures for photocatalytic applica-tions towards environmental remediation. J. Solid State Chem. 2018, 267, 35–52. [Google Scholar] [CrossRef]
- Zaleska-Medynska, A. Metal Oxide-Based Photocatalysis: Fundamentals and Prospects for Application; Elsevier: Amsterdam, The Netherlands, 2018. [Google Scholar]
- Lee, K.M.; Lai, C.W.; Ngai, K.S.; Juan, J.C. Recent developments of zinc oxide based photocatalyst in water treatment technology: A review. Water Res. 2016, 88, 428–448. [Google Scholar] [CrossRef] [PubMed]
- Siddiquey, I.A.; Furusawa, T.; Sato, M.; Bahadur, N.M.; Alam, M.; Suzuki, N. Sonochemical synthesis, photocatalytic activity and optical properties of silica coated ZnO nanoparticles. Ultrason. Sonochem. 2012, 19, 750–755. [Google Scholar] [CrossRef] [PubMed]
- Inamuddin. Xanthan gum/titanium dioxide nanocomposite for photocatalytic degradation of methyl orange dye. Int. J. Biol. Macromol. 2019, 121, 1046–1053. [Google Scholar] [CrossRef]
- Kumar, A.; Dalal, J.; Dahiya, S.; Chowdhury, A.; Khandual, A.; Ohlan, A.; Punia, R.; Maan, A.S. Coating of multi-walled carbon nanotubes on cotton fabric via conventional dyeing for enhanced electrical and mechanical properties. AIP Conf. Proc. 2019, 2142, 140019. [Google Scholar] [CrossRef]
- Lu, L.; Shan, R.; Shi, Y.; Wang, S.; Yuan, H. A novel TiO2/biochar composite catalysts for photocatalytic degradation of methyl orange. Chemosphere 2019, 222, 391–398. [Google Scholar] [CrossRef]
- Molkenova, A.; Sarsenov, S.; Atabaev, S.; Khamkhash, L.; Atabaev, T.S. Hierarchically-structured hollow CuO microparticles for efficient photo-degradation of a model pollutant dye under the solar light illumination. Environ. Nanotechnol. Monit. Manag. 2021, 16, 100507. [Google Scholar] [CrossRef]
- Qu, Y.; Huang, R.; Qi, W.; Shi, M.; Su, R.; He, Z. Controllable synthesis of ZnO nanoflowers with structure-dependent photo-catalytic activity. Catal. Today 2020, 355, 397–407. [Google Scholar] [CrossRef]
- Wang, L.; Li, Z.; Chen, J.; Huang, Y.; Zhang, H.; Qiu, H. Enhanced photocatalytic degradation of methyl orange by porous graphene/ZnO nanocomposite. Environ. Pollut. 2019, 249, 801–811. [Google Scholar] [CrossRef] [PubMed]
- Ali, W.; Ullah, H.; Zada, A.; Alamgir, M.K.; Muhammad, W.; Ahmad, M.J.; Nadhman, A. Effect of calcination temperature on the photoactivities of ZnO/SnO2 nanocomposites for the degradation of methyl orange. Mater. Chem. Phys. 2018, 213, 259–266. [Google Scholar] [CrossRef]
- Albiss, B.; Abu-Dalo, M. Photocatalytic Degradation of Methylene Blue Using Zinc Oxide Nanorods Grown on Activated Carbon Fibers. Sustainability 2021, 13, 4729. [Google Scholar] [CrossRef]
- Mohamed, R.M.; Barakat, M.A. Enhancement of photocatalytic activity of ZnO/SiO2 by nanosized Pt for photocatalytic degradation of phenol in wastewater. Int. J. Photoenergy 2012, 2012, 103672. [Google Scholar] [CrossRef] [Green Version]
- Kumari, S.; Malik, S.; Kumar, S.; Dalal, J.; Dahiya, S.; Ohlan, A.; Punia, R.; Maan, A.S. Excellent photoelectrical properties of ZnO thin film based on ZnO/epoxy-resin ink for UV-light detectors. AIP Conf. Proc. 2019, 2142, 120004. [Google Scholar]
- Feng, Q.; Chen, K.; Ma, D.; Lin, H.; Liu, Z.; Qin, S.; Luo, Y. Synthesis of high specific surface area silica aerogel from rice husk ash via ambient pressure drying. Colloids Surf. A Physicochem. Eng. Asp. 2018, 539, 399–406. [Google Scholar] [CrossRef]
- Galedari, N.A.; Rahmani, M.; Tasbihi, M. Preparation, characterization, and application of ZnO@SiO2 core-shell structured catalyst for photocatalytic degradation of phenol. Environ. Sci. Pollut. Res. 2017, 24, 12655–12663. [Google Scholar] [CrossRef]
- Rohilla, S.; Lal, B.; Sunder, S.; Aghamkar, P.; Kumar, S.; Aggarwal, A. Synthesis of Fe4[Fe(CN)6]3·14H2O Nanopowder by Co-Precipitation Technique and Effect of Heat Treatment. Acta Phys. Pol. A 2010, 118, 696. [Google Scholar] [CrossRef]
- Rohilla, S.; Kumar, S.; Aghamkar, P.; Sunder, S.; Agarwal, A. Investigations on structural and magnetic properties of cobalt ferrite/silica nanocomposites prepared by the coprecipitation method. J. Magn. Magn. Mater. 2011, 323, 897–902. [Google Scholar] [CrossRef]
- Li, N.; Yang, B.; Xu, L.; Xu, G.; Sun, W.; Yu, S. Simple synthesis of Cu2O/Na-bentonite composites and their excellent photocatalytic properties in treating methyl orange solution. Ceram. Int. 2016, 42, 5979–5984. [Google Scholar] [CrossRef]
- Mahmood, T.; Saddique, M.T.; Naeem, A.; Westerhoff, P.; Mustafa, S.; Alum, A. Comparison of Different Methods for the Point of Zero Charge Determination of NiO. Ind. Eng. Chem. Res. 2011, 50, 10017–10023. [Google Scholar] [CrossRef]
- Benhebal, H.; Chaib, M.; Salmon, T.; Geens, J.; Leonard, A.; Lambert, S.D.; Crine, M.; Heinrichs, B. Photocatalytic degradation of phenol and benzoic acid using zinc oxide powders prepared by the sol–gel process. Alex. Eng. J. 2013, 52, 517–523. [Google Scholar] [CrossRef] [Green Version]
- Alam, U.; Khan, A.; Ali, D.; Bahnemann, D.; Muneer, M. Comparative photocatalytic activity of sol–gel derived rare earth metal (La, Nd, Sm and Dy)-doped ZnO photocatalysts for degradation of dyes. RSC Adv. 2018, 8, 17582–17594. [Google Scholar] [CrossRef] [Green Version]
- Ali, A.M.; Ismail, A.A.; Najmy, R.; Al-Hajry, A. Preparation and characterization of ZnO-SiO2 thin films as highly efficient photocatalyst. J. Photochem. Photobiol. A Chem. 2014, 275, 37–46. [Google Scholar] [CrossRef]
- Muthulingam, S.; Bin Bae, K.; Khan, R.; Lee, I.-H.; Uthirakumar, P. Improved daylight-induced photocatalytic performance and suppressed photocorrosion of N-doped ZnO decorated with carbon quantum dots. RSC Adv. 2015, 5, 46247–46251. [Google Scholar] [CrossRef]
- Nogueira, I.C.; Cavalcante, L.S.; Pereira, P.F.S.; De Jesus, M.M.; Rivas Mercury, J.M.; Batista, N.C.; Li, M.S.; Longo, E. Rietveld refinement, morphology and optical properties of (Ba1−xSrx).MoO4 crystals. J. Appl. Crystallogr. 2013, 46, 1434–1446. [Google Scholar] [CrossRef] [Green Version]
- Singh, K.; Rawal, I.; Gautam, P.; Sharma, N.; Dhar, R. Diluted magnetic semiconducting properties of nanocrystalline Zn0.98X0.02O (X = Fe, Ga, Ni) thin films deposited by PLD technique for spintronic applications. J. Magn. Magn. Mater. 2018, 468, 259–268. [Google Scholar] [CrossRef]
- Zeng, X.; Yu, S.; Sun, R.; Xu, J. Mechanical reinforcement while remaining electrical insulation of glass fibre/polymer composites using core-shell CNT@SiO2 hybrids as fillers. Compos. Part A Appl. Sci. Manuf. 2015, 73, 260–268. [Google Scholar] [CrossRef]
- Tinio, J.V.G.; Simfroso, K.T.; Peguit, A.D.M.V.; Candidato, R.T. Influence of OH-ion concentration on the surface morphology of zno-SiO2 nanostructure. J. Nanotechnol. 2015, 2015, 686021. [Google Scholar] [CrossRef] [Green Version]
- Sharma, D.; Jha, R. Analysis of structural, optical and magnetic properties of Fe/Co co-doped ZnO nanocrystals. Ceram. Int. 2017, 43, 8488–8496. [Google Scholar] [CrossRef]
- Zhong, J.B.; Li, J.Z.; He, X.Y.; Zeng, J.; Lu, Y.; He, J.J.; Zhong, F. Fabrication and Catalytic Performance of SiO2-ZnO Composite Photocatalyst. Synth. React. Inorg. Met. Nano-Met. Chem. 2014, 44, 1203–1207. [Google Scholar] [CrossRef]
- Wang, W.-Y.; Ku, Y. Effect of solution pH on the adsorption and photocatalytic reaction behaviors of dyes using TiO2 and Nafion-coated TiO2. Colloids Surf. A Physicochem. Eng. Asp. 2007, 302, 261–268. [Google Scholar] [CrossRef]
- Huang, M.; Xu, C.; Wu, Z.; Huang, Y.; Lin, J.; Wu, J. Photocatalytic discolorization of methyl orange solution by Pt modified TiO2 loaded on natural zeolite. Dye. Pigment. 2008, 77, 327–334. [Google Scholar] [CrossRef]
- Moignard, M.; James, R.; Healy, T. Adsorption of calcium at the zinc sulphide-water interface. Aust. J. Chem. 1977, 30, 733–740. [Google Scholar] [CrossRef]
- Ghaderi, A.; Abbasi, S.; Farahbod, F. Synthesis, characterization and photocatalytic performance of modified ZnO nanoparticles with SnO2 nanoparticles. Mater. Res. Express 2018, 5, 065908. [Google Scholar] [CrossRef]
- Liu, S.; Zhao, Z.; Wang, Z. Photocatalytic reduction of carbon dioxide using sol–gel derived titania-supported CoPc catalysts. Photochem. Photobiol. Sci. 2007, 6, 695–700. [Google Scholar] [CrossRef] [PubMed]
- Reedijk, J. Reference Module in Chemistry, Molecular Sciences and Chemical Engineering; Elsevier BV: Amsterdam, The Netherlands, 2013. [Google Scholar]
- Ouyang, K.; Xie, S. Effect of key operational factors on decolorization of methyl orange by multi-walled carbon nanotubes (MWCNTs)/TiO2/CdS composite under simulated solar light irradiation. Ceram. Int. 2013, 39, 8035–8042. [Google Scholar] [CrossRef]
- Tripathy, N.; Ahmad, R.; Song, J.E.; Ko, H.A.; Hahn, Y.-B.; Khang, G. Photocatalytic degradation of methyl orange dye by ZnO nanoneedle under UV irradiation. Mater. Lett. 2014, 136, 171–174. [Google Scholar] [CrossRef]
- Khan, R.; Hassan, M.S.; Jang, L.-W.; Yun, J.H.; Ahn, H.-K.; Khil, M.-S.; Lee, I.-H. Low-temperature synthesis of ZnO quantum dots for photocatalytic degradation of methyl orange dye under UV irradiation. Ceram. Int. 2014, 40, 14827–14831. [Google Scholar] [CrossRef]
- Dhanalakshmi, J.; Padiyan, D.P. Photocatalytic degradation of methyl orange and bromophenol blue dyes in water using sol–gel synthesized TiO2 nanoparticles. Mater. Res. Express 2017, 4, 095020. [Google Scholar] [CrossRef]
- Chowdhury, M.I.H.; Hossain, M.S.; Azad, M.A.S.; Islam, M.Z.; Dewan, M.A. Photocatalytic degradation of methyl orange under UV using ZnO as catalyst. Int. J. Sci. Eng. Res. 2018, 9, 1646–1649. [Google Scholar]


| Annealing Temp (°C) | D (nm) | Sa (m2·m−3) | Eg (eV) |
|---|---|---|---|
| 300 | 36.20 | 4.455 × 10⁷ | 3.26 |
| 600 | 38.81 | 4.251 × 10⁷ | 3.25 |
| 900 | 43.42 | 3.800 × 10⁷ | 3.36 |
| Catalyst Composite | Method of Synthesis | Light Used for Irradiation | Irradiation Time (min) | Photo-Degradation (%) | Refs. |
|---|---|---|---|---|---|
| ZnO nano-needles on Si substrates | Hydrothermal | UV light | 140 | 95.4 | [48] |
| ZnO quantum dots | Flame spray pyrolysis | UV light | 160 | 97 | [49] |
| TiO2/biochar | Hydrolysis | UV light | 160 | 96.88 | [17] |
| Xanthan gum/TiO2 | Hydro-gel | Visible light | 90 | 89 | [15] |
| Anatase TiO2 | Sol-gel | Visible light | 240 | 67.12 | [50] |
| ZnO catalyst | Hydrothermal | UV light | 180 | 99.7 | [51] |
| Rare earth metal doped ZnO | Sol-gel | UV light | 180 | 98 | [32] |
| ZnO.SiO2 | Co-precipitation | UV light | 100 | 98.1 | Present work |
Publisher’s Note: MDPI stays neutral with regard to jurisdictional claims in published maps and institutional affiliations. |
© 2021 by the authors. Licensee MDPI, Basel, Switzerland. This article is an open access article distributed under the terms and conditions of the Creative Commons Attribution (CC BY) license (https://creativecommons.org/licenses/by/4.0/).
Share and Cite
Rohilla, S.; Gupta, A.; Kumar, V.; Kumari, S.; Petru, M.; Amor, N.; Noman, M.T.; Dalal, J. Excellent UV-Light Triggered Photocatalytic Performance of ZnO.SiO2 Nanocomposite for Water Pollutant Compound Methyl Orange Dye. Nanomaterials 2021, 11, 2548. https://doi.org/10.3390/nano11102548
Rohilla S, Gupta A, Kumar V, Kumari S, Petru M, Amor N, Noman MT, Dalal J. Excellent UV-Light Triggered Photocatalytic Performance of ZnO.SiO2 Nanocomposite for Water Pollutant Compound Methyl Orange Dye. Nanomaterials. 2021; 11(10):2548. https://doi.org/10.3390/nano11102548
Chicago/Turabian StyleRohilla, Sunil, Ankita Gupta, Vibhor Kumar, Suman Kumari, Michal Petru, Nesrine Amor, Muhammad Tayyab Noman, and Jasvir Dalal. 2021. "Excellent UV-Light Triggered Photocatalytic Performance of ZnO.SiO2 Nanocomposite for Water Pollutant Compound Methyl Orange Dye" Nanomaterials 11, no. 10: 2548. https://doi.org/10.3390/nano11102548
APA StyleRohilla, S., Gupta, A., Kumar, V., Kumari, S., Petru, M., Amor, N., Noman, M. T., & Dalal, J. (2021). Excellent UV-Light Triggered Photocatalytic Performance of ZnO.SiO2 Nanocomposite for Water Pollutant Compound Methyl Orange Dye. Nanomaterials, 11(10), 2548. https://doi.org/10.3390/nano11102548