Article

αvβ3-Specific Gold Nanoparticles for Fluorescence Imaging of Tumor Angiogenesis

1
Department of Nuclear Medicine, University Hospital Carl Gustav Carus, TU Dresden, 01307 Dresden, Germany
2
Molecular Imaging and Radiochemistry, Department of Clinical Radiology and Nuclear Medicine, Medical Faculty Mannheim of Heidelberg University, 68167 Mannheim, Germany
3
Helmholtz-Zentrum Dresden-Rossendorf, Institute of Ion Beam Physics and Materials Research, 01328 Dresden, Germany
4
Department of Oncology, Division of Oncological Imaging, University of Alberta, Edmonton, AB T6G 2R3, Canada
5
Biomedical Chemistry, Department of Clinical Radiology and Nuclear Medicine, Medical Faculty Mannheim of Heidelberg University, 68167 Mannheim, Germany
*
Author to whom correspondence should be addressed.
Nanomaterials 2021, 11(1), 138; https://doi.org/10.3390/nano11010138
Submission received: 25 November 2020 / Revised: 22 December 2020 / Accepted: 30 December 2020 / Published: 8 January 2021
(This article belongs to the Special Issue Nanomaterials for Contrast Agent and Biomedical Imaging)

Abstract

:
This paper reports on the development of tumor-specific gold nanoparticles (AuNPs) as theranostic tools intended for target accumulation and the detection of tumor angiogenesis via optical imaging (OI) before therapy is performed, being initiated via an external X-ray irradiation source. The AuNPs were decorated with a near-infrared dye, and RGD peptides as the tumor targeting vector for αvβ3-integrin, which is overexpressed in tissue with high tumor angiogenesis. The AuNPs were evaluated in an optical imaging setting in vitro and in vivo exhibiting favorable diagnostic properties with regards to tumor cell accumulation, biodistribution, and clearance. Furthermore, the therapeutic properties of the AuNPs were evaluated in vitro on pUC19 DNA and on A431 cells concerning acute and long-term toxicity, indicating that these AuNPs could be useful as radiosensitizers in therapeutic concepts in the future.

Graphical Abstract

1. Introduction

In recent years, gold nanoparticles (AuNPs) have gained serious attention since their first use as radioactive 198Au-nanocolloid in the early 1950s for nanobrachytherapy [1,2,3]. Since then, the focus has shifted to the development of ultra-small target-specific AuNPs with a very narrow size distribution and, ultimately, tailored shapes for use in various imaging modalities such as CT [4], Raman [5], or photoacoustic imaging [6]. On the one hand AuNPs represent a perfect platform for multimerization of target-specific effectors on their surface and on the other hand they offer the possibility of detection using multimodal imaging techniques by surface modification [7], as well as for theranostic purposes [8,9,10,11]. Many approaches of AuNPs with a size of >10 nm are based on a phenomenon typically known as ‘enhanced permeability and retention’ (EPR) effect due to passive extravasation of nanoparticles across the perforated vasculature of tumors [12]. Rapid renal clearance is preferable for radioactive diagnostic nanoparticles to avoid a high radiation burden on healthy organs and tissues, which can be achieved for AuNPs smaller than 6 nm in diameter [13]. The development of methods for the synthesis of ultrasmall (<5 nm) AuNPs [14] followed by surface-modification for enhanced stability and homogenization [15,16,17] paved the way for functionalization [18]. The high affinity of sulfur for gold surfaces and the formation of stable and covalent Au-S bonds [19] enable a fast and facile functionalization of AuNPs with thiol-modified (bio-)molecules. Furthermore, PEGylation of the AuNPs leads to a higher bioavailability, as it hinders in vivo formation of a protein corona around the AuNPs [20,21]. Therefore, ultra-small target-specific AuNPs can be developed and functionalized with small molecules [11], antibodies [22], peptides [23], and natural products [24,25]. For molecular imaging, AuNPs can be functionalized with near-infrared dyes [26,27], with radionuclides like fluorine-18, copper-64 or gallium-68 for positron emission tomography (PET) [28,29,30,31,32], and with Magnetic Resonance Imaging (MRI)-relevant metals like gadolinium [33,34]. Additionally, their therapeutic application [35], and particularly their ability to be applicable as a radiosensitizer by Auger-Meitner electron (AME) emission induced by external gamma activation [36,37,38] or β- emission of 412 keV electrons induced by neutron activation of natural 197Au generating [198Au]AuNPs [23,25,39,40,41] are of special interest.
The focus of this work is based on the development of theragnostic agents using targeted gold nanoparticles for near-infrared (NIR) fluorescent optical imaging (OI) [42]. Surface-functionalization was easily achieved by ligand exchange, introducing, in addition to different reporter or targeting moieties, functional groups for further chemoselective conjugation to which complementary functionalized targeting vectors are then attached [43]. The RGD peptide motif is known to bind to the transmembrane αvβ3 integrin, which is overexpressed during tumor angiogenesis for example on glioma (U87MG) or on epidermoid (A431) cells [44,45,46,47]. To achieve target-specific accumulation in tissue with high tumor angiogenesis, the AuNPs were functionalized with a c(RGDfK) derivative [41,48].

2. Materials and Methods

General procedures. All reagents and solvents were purchased from commercial suppliers and were used without further purification. NIR-dye (SIDAG precursor [49]) was purchased from Chess, Mannheim, Germany. NMR spectra were recorded on a 300 MHz Varian Mercury Plus or a 500 MHz Varian NMR System spectrometer (Palo Alto, CA, USA). Chemical shifts (δ) are given in ppm and are relative to (CH3)4Si (1H, 13C). Mass spectra were obtained on a Bruker Daltonics microflex MALDI-TOF mass spectrometer (Bremen, Germany). Preparative column chromatography was performed on Merck silica gel 60. Reactions were monitored by thin-layer chromatography (TLC) on Merck silica gel F254 aluminum plates, with visualization under UV (λ = 254 nm) or by evaluation using ninhydrin and heating. If necessary, the purity was determined by high performance liquid chromatography (HPLC). The purity of all final compounds was 95% or higher. HPLC was performed on a Dionex UltiMate 3000 HPLC system (Thermo Scientific, Dreieich, Germany), equipped with a reverse phase column (Analytical: Merck Chromolith RP-18e; 100 × 4.6 mm plus a guard column 5 × 4.6 mm; semipreparative: Chromolith RP-18e; 100 × 10 mm plus a guard column 10 × 4.6 mm), and a UV-diode array detector (210 nm, 254 nm). The solvent system used was a gradient of acetonitrile:water (containing 0.1% TFA) (0–5 min: 0–100% MeCN) at a flow rate of 4 mL/min unless otherwise stated. The purification of AuNPs was performed via dialysis (molecular weight cut-off of 14,000 g/mol, Visking, Roth) against distilled water and via size-exclusion chromatography using Sephadex G25 PD10 columns and distilled water as eluent. The purity of the AuNPs was verified by size exclusion HPLC using a Phenomenex PolySep™-SEC GFC-P 4000, LC Column 300 × 7.8 mm and a 35 mm PolySep guard column with water (0.8 mL/min) as eluent on a Thermofisher Ulti HPLC system. Irradiation experiments were performed in an X-ray chamber on a Maxishot Y.TU 320-D03 (Yxlon, Hamburg, Germany) (200 kV, 20 mA, dose rate D = 1.24 Gy/min). Re-188-solution was obtained by elution with 0.9% NaCl from an 188W/188Re-generator (OncoBeta, Garching, Germany). The eluat was concentrated by a QMA cartridge (WAT023525, Waters, Eschborn, Germany), and eventually eluted W-188 was trapped on an alumina cartridge (WAT023561, Waters).
Thiol-PEG3-OH and furan-protected thiol-PEG4-maleimide [50] were synthesized according to Zhu et al. [42] without any modification. A brief description of the AuNP syntheses can be found in the supporting information.
Affinity experiments. The αvβ3-binding affinities of the RGD peptides and the respectiviely modified AuNPs were determined on A431 tumor cells by in vitro competitive displacement experiments. A431 cells were seeded onto 24-well plates 2–3 days prior to assay start to reach 0.4–0.5 × 10⁶ cells per well. A special binding buffer (Tris·HCl 25 mM, NaCl 150 mM, CaCl2 1 mM, MgCl2 0.5 mM, MnCl2 1 mM, pH 7.4, BSA 0.5%) was used for incubation with 0.13 nM 125I-Echistatin (81.4 GBq/μmol) as the αvβ3-specific radioligand in the presence of increasing concentrations (0–100 μM) of competing c(RGDfK) peptide or c(RGDfK)-modified AuNPs (0–30 µM). The IC50 values were obtained using the software Origin v9.6.0.172 (Nonlinear Fit, Growth/Sigmoidal, DoseResp, Levenberg Marquardt Fit).
Fluorescence microscopy on Leica TCS SP8. For fluorescence microscopy, cells were seeded onto coverslips for more than 2 days, then washed with PBS and incubated for 1, 3, 6, and 24 h at 37 °C in 5% CO2 with the respective media containing AuNPs (100 µg/mL, 0.33 µM). For blocking experiments, c(RGDfK) (150 µg/mL, 0.25 mM) was added to the wells together with the AuNPs. Afterwards, the cells were washed with PBS and incubated with CellMask Orange-solution (1 × working solution) for 15 min at 37 °C. Cells were fixed with 1:1 medium: 4% formaldehyde in PBS for 2 min at ambient temperature and then with 4% formaldehyde in PBS for 15 min at ambient temperature. Cells were then washed 3 × with PBS, and coverslips were prepared onto an object plate with Sytox Green-solution (8.3 µM, 10 µL). Fluorescence microscopy was performed on a Leica TCS SP8 confocal microscope with lasers at λ = 488, 552 and 638 nm. Overlays of microscopies were generated using the FIJI software (v1.50e).
Colony formation assay. Three days prior to the experiments, 150,000 cells were seeded into a 6-well plate. A431 cells were incubated for 24 h in the presence or absence of the αvβ3-specific or non-specific AuNPs. After incubation in the presence or absence of the AuNPs, the cells were washed, and the cell medium was refreshed. Subsequently, the cells were irradiated with X-rays (Maxishot Y.TU, Yxlon, Hamburg) up to 12 min to reach a maximum dose of 10 Gy. After irradiation, the cells were harvested, and a colony formation assay was performed in triplicate for each irradiation point with 1000 cells per well in a 6-well plate. Colonies were cultivated in cell medium for 7 days and then washed with 1 mL PBS, fixed with 2 mL 80% ethanol for 10 min and incubated with 2 mL crystal violet dye solution for 30 min. Afterwards, colonies were washed with distilled water, dried, and counted by light microscopy. Colonies of more than 50 cells were deemed to be survivors, and the plating efficiency for each sample was estimated based on the initial number of seeded cells. The clonogenic cell survival was calculated as the relative plating efficiency of treated vs. untreated samples. Triplicate samples were prepared for each treatment and experimental condition.
In vivo experiments. The in vivo proof-of-concept was performed using male athymic nude mice (Rj:ATHYM-Foxn1nu/nu) obtained from Janvier Labs. 5 × 10⁶ A431 cells (100 µL, PBS with or without matrigel:PBS v:v = 1:1, unsieved) were inoculated subcutaneously in the left thigh when the mice were 57 weeks old. Mouse health and tumor growth were checked daily until the tumor reached a diameter of 2–5 mm (3–6 weeks for A431). Tumor growth was slower for the matrigel injection and the tumor was smaller. After the tumors reached a sufficient size for imaging, the AuNPs were injected intravenously into the tail vein and their distribution in vivo was monitored after 1, 2, 4, 24, 28, 48, and 72 h via optical imaging (excitation 730 nm, emission 790 nm, 60 s) followed by X-ray imaging (0.8 mm filter, 45 kV, 5 s) (In Vivo Xtreme, Bruker, Ettlingen). After the last time point, animals were sacrificed, the organs were harvested, and measured ex vivo with the In Vivo Xtreme system. The region of interest (ROI) was drawn by hand on the organs for calculation of the uptake of the AuNPs in the respective organs. Amide (v1.0.4) was used for the fusion of the images. All injections and measurements with mice were performed under anesthesia (2–3% isoflurane/O2, 2–3 mL/min).

3. Results

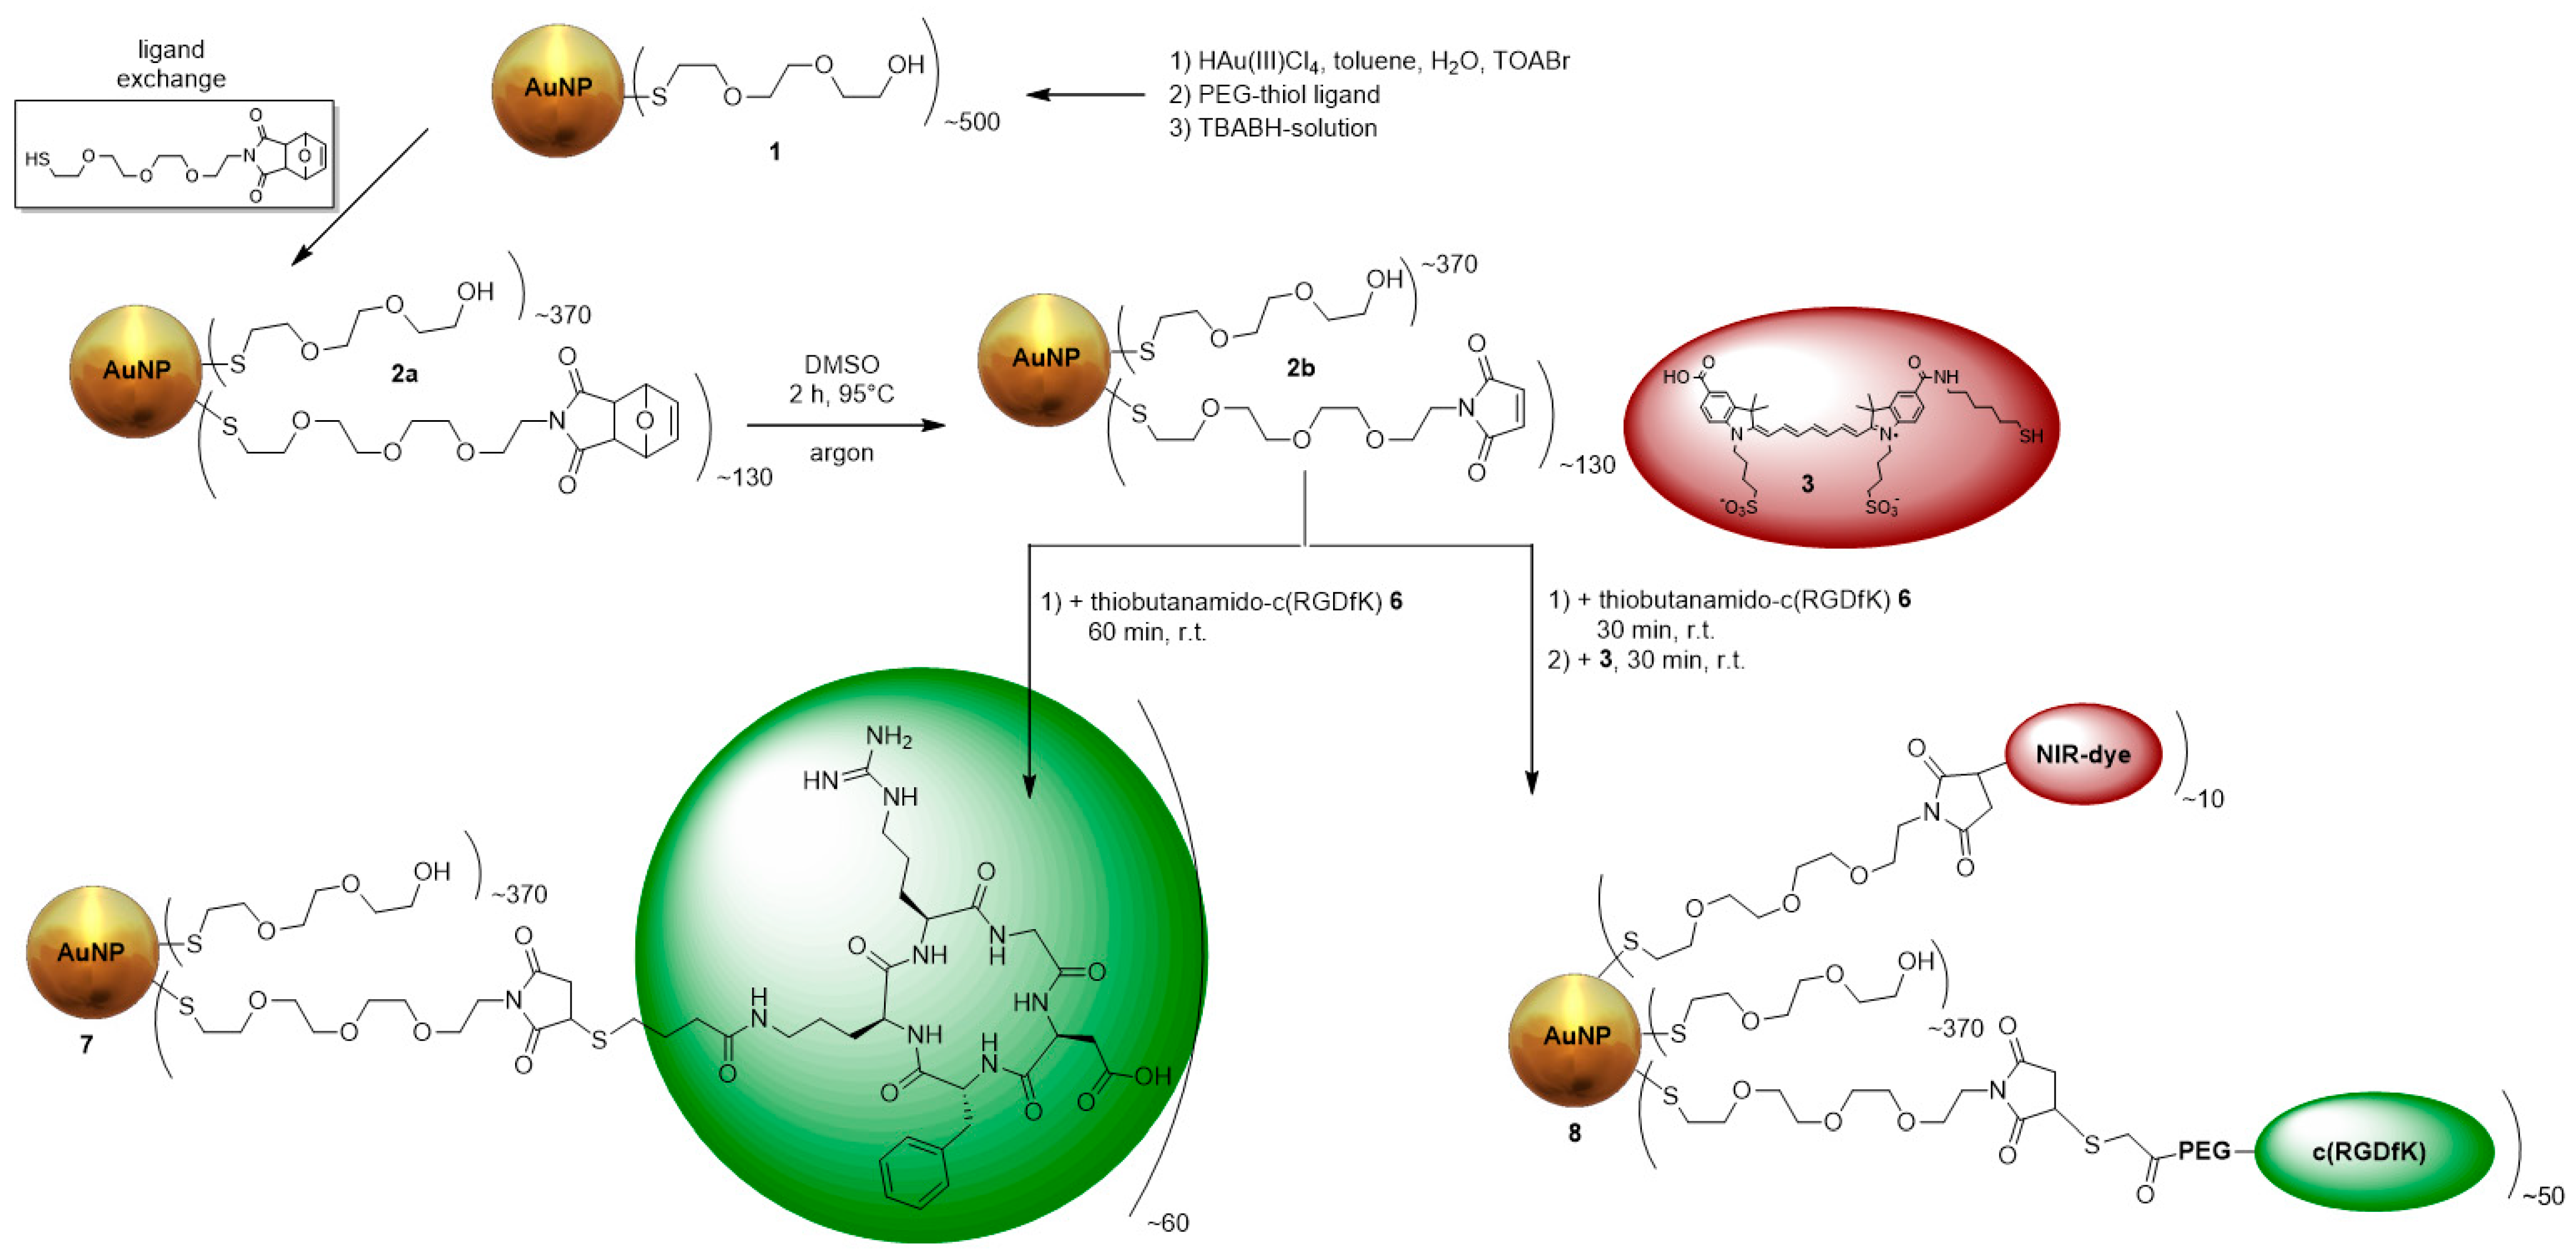
3.1. Synthesis and Functionalization of Gold Nanoparticles

Integrin αvβ3, a transmembrane protein expressed on endothelial cells, and binds the Arg-Gly-Asp (RGD) triple peptide motif of extracellular matrix proteins. Growing malignant tumors continuously requires angiogenesis, and for this purpose the integrin αvβ3 is overexpressed. As a result, αvβ3 is preferentially expressed in tumor angiogenesis and is a potential target for AuNPs decorated with RGD peptides [47]. Therefore, ultra-small AuNPs (3 ± 2 nm) were synthesized by the Brust-Schiffrin-method [15] with thiol-PEG3-OH used as the stabilizing ligand and to achieve an increased biocompatibility. The AuNPs were further functionalized via ligand exchange with furan-protected maleimide-PEG4-thiol (Figure 1). Afterwards, the furan-maleimide-AuNPs 2a were deprotected at 95 °C in DMSO for 2 h (2b), followed by the attachement with the thiol-functionalized αvβ3-specific ligand thiol-c(RGDfK) 6 (Figure A1) and the thiol-functionalized fluorescent dye 3 (Figure A2) [43,51]. For the use in OI, the AuNPs were functionalized with 3, which was performed at a ratio of 40:1 (AuNPs:dye). Using more NIR-dye resulted in the aggregation of the AuNPs as well as decreased fluorescence signals due to self-quenching. The purification of the AuNPs was performed via dialysis and size-exclusion chromatography. The AuNPs 7 and 8 were incubated with PBS, rat plasma, and cell media for at least 24 h at 37 °C, and no aggregation was found. Their stability was confirmed by UV/Vis spectroscopy and HPLC. The AuNP-RGD-NIR-dye 8 exhibited very low photobleaching (<3% within 24 h at 37 °C) and enabled biocompatible fluorescence in the optical window of tissue, with absorption of 600–800 nm (AbsMax = 750 nm) and emission at 750–820 nm (EmMax = 780 nm) (Figure A13).
The loss of mass of the AuNPs was determined by thermogravimetric analyses for each functionalization step. The measurements were compared between the product and educt to determine the additional loading of the respective functionalization step. Therefore, the difference in the loss of mass of product and educt gave the total mass of newly attached molecules. The mean number of newly attached molecules could be estimated by dividing the mass difference by the molar mass of the respective molecule. After knowing the number of the newly attached molecules, a formula from Zhu et al. was used to calculate the total molar mass of the AuNPs [42] (Table 1). A brief description of the synthesis and characterization can be found in the appendix. All AuNPs were fully characterized by thermogravimetric analysis (TGA) (Figure A3, Figure A4, Figure A5 and Figure A6), UV/Vis spectroscopy (Figure A7, Figure A8 and Figure A9), electron microscopy (EM) (Figure A10 and Figure A11), HPLC (Table 1), dynamic light scattering (DLS) (Table 2), and NMR (Figure A12, Figure A13, Figure A14 and Figure A15). The dynamic light scattering was performed on a Malvern Zetasizer ZS90. AuNPs were dissolved in distilled H2O at a concentration of 1 µg/mL. All values are the mean value of at least three different measurements. If the polydispersity index (PDI) is >0.5 the size by number is more relevant than the size by volume. The size by number is best comparable to the size measured by EM. The AuNPs could be stored in lyophilized form for >12 months at −20 °C without losing their integrity. In contrast, if stored in solution at room temperature, aggregation in form of precipitation occurred within weeks, especially for peptide- or NIR-decorated particles [33].

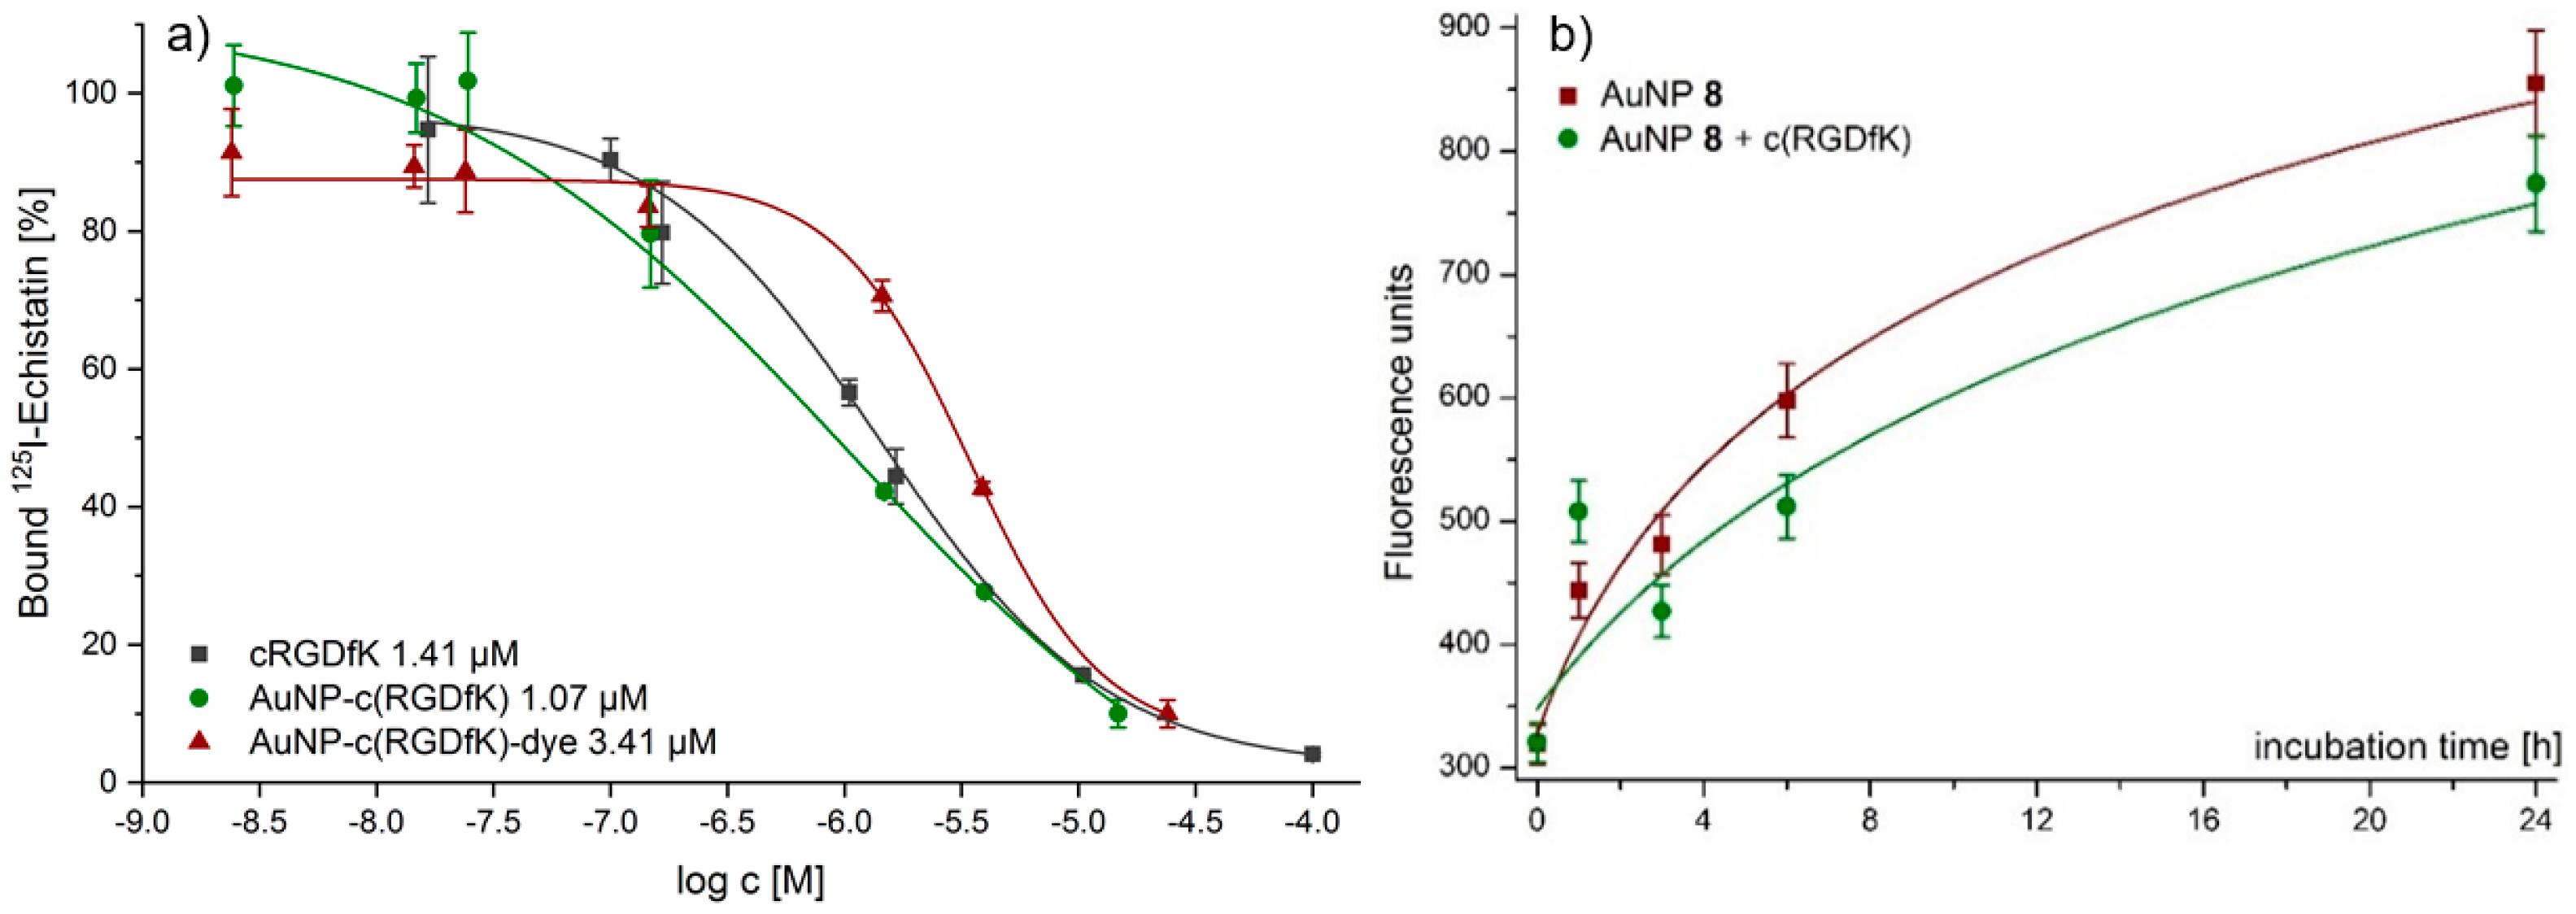
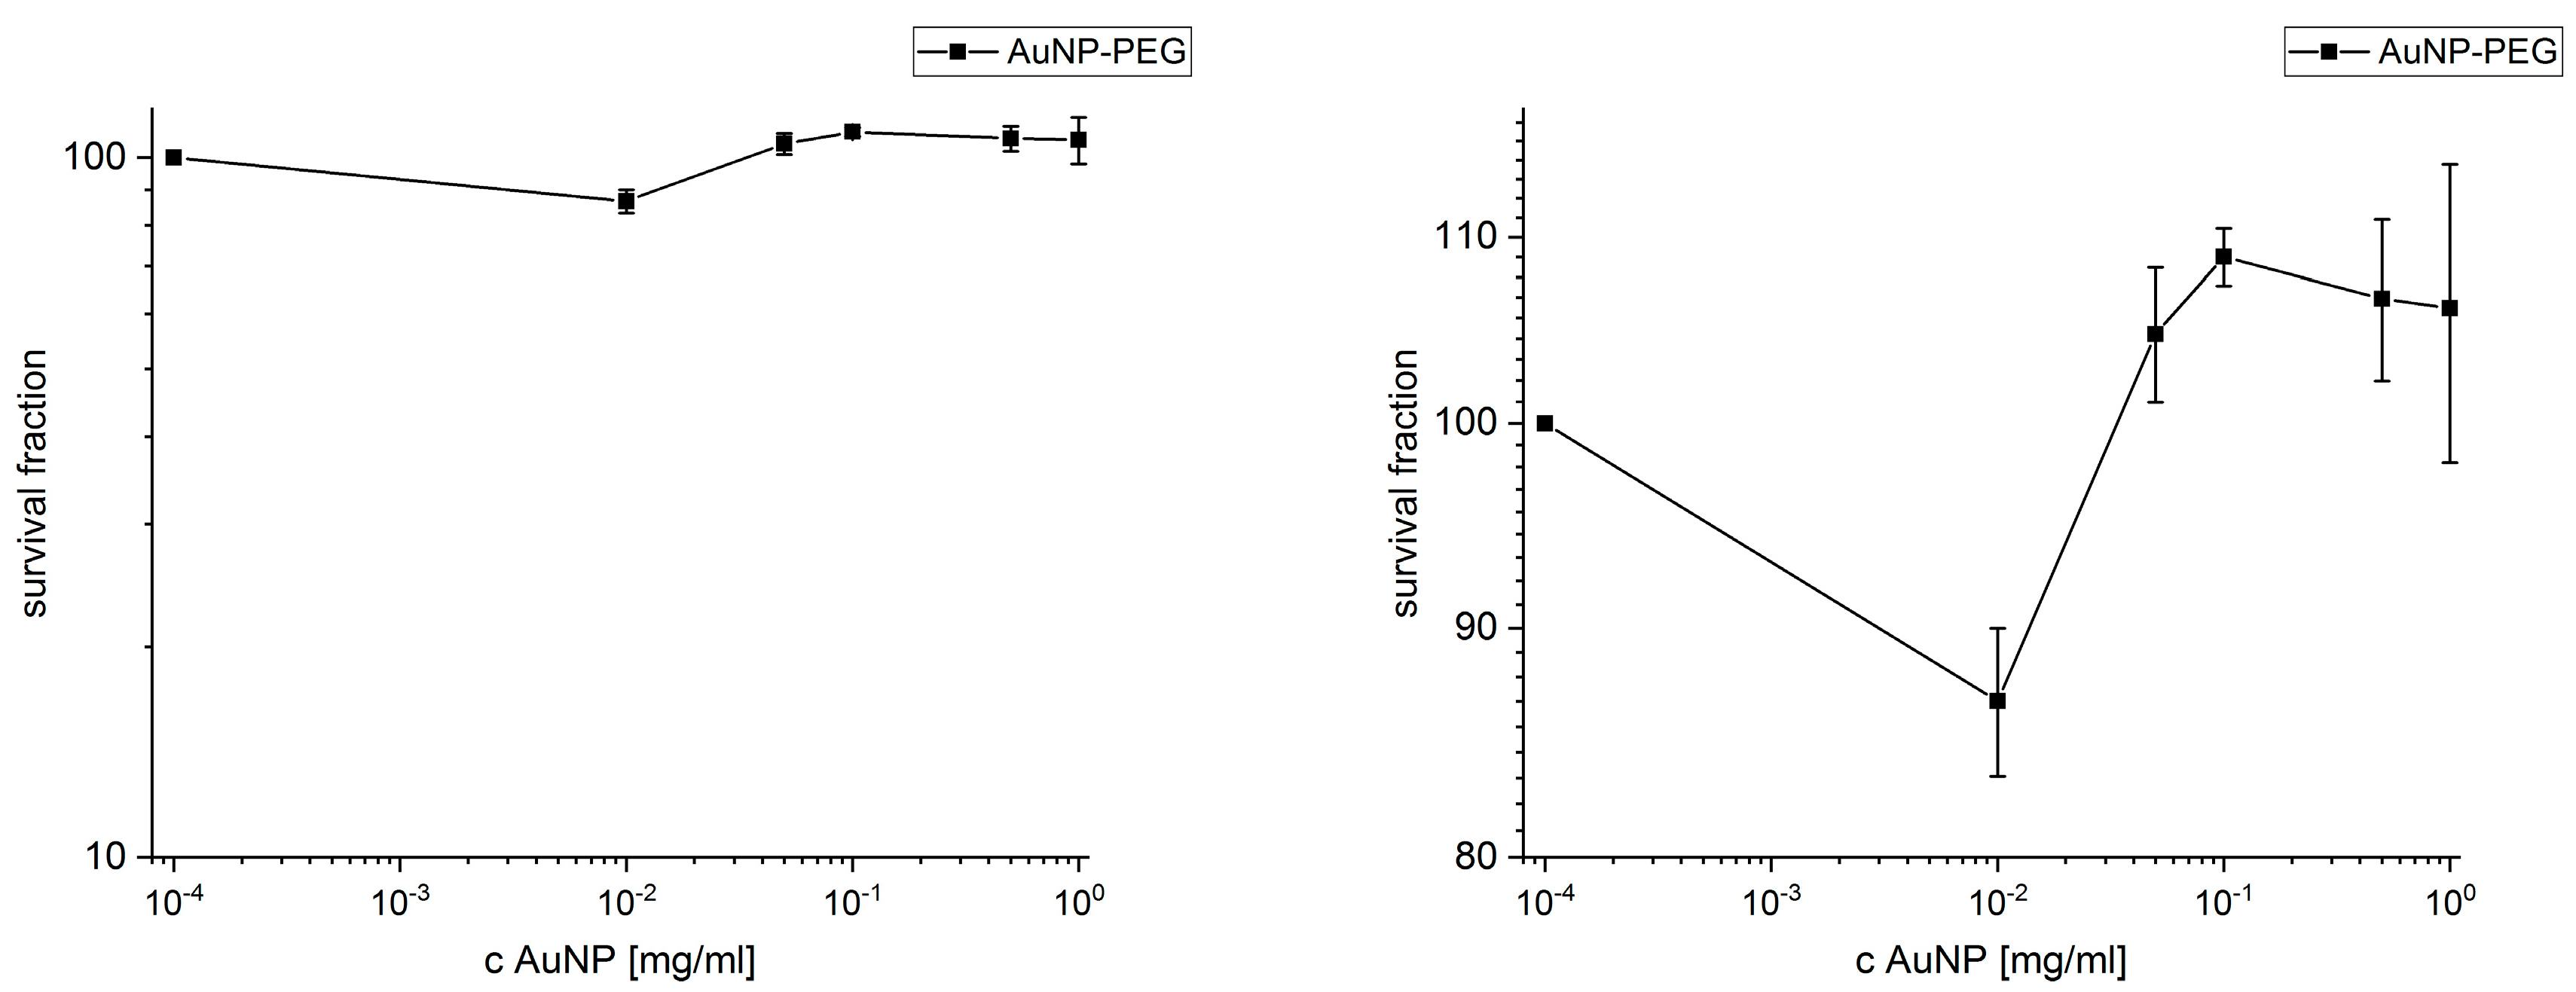
3.2. Cell Experiments

Several different IC50 values for RGD derivatives are already available in literature, ranging from 0.1 nM up to 6.7 µM. The main reason for the observed differences is the assay method used to determine the IC50 values. IC50 values of 0.1–1 nM can be found for RGD peptides having been determined by ELISA assays [45] and IC50 values around 20 nM were reported for solid-phase αvβ3 binding assays for monomeric RGD derivatives [44]. Those IC50 values were derived by non-living experiments. Cell experiments are closer to in vivo condition. Therefore, for the AuNPs 7 and 8, the αvβ3-avidities were determined by competitive displacement experiments on αvβ3-expressing A431 cells using 125I-Echistatin as αvβ3-specific radioligand and competitor (Figure 2a). As internal reference, the RGD monomer c(RGDfK) was evaluated. With the evaluation of RGD derivatives by displacement experiments, IC50 values comparable with those in existing literature were found [48]. For c(RGDfK) an IC50 value of (1.75 ± 0.84) µM was found. The multi-RGD decoration at the surface of AuNP 7 led to a lower IC50 value of (1.07 ± 0.74) µM compared to the isolated RGD monomer. Further functionalization of the AuNPs with cyanine dye 3 led to a slightly higher IC50 value of (3.37 ± 0.73) µM for AuNP 8.
Next, the cellular uptake of AuNPs 8 was evaluated on A431 cells at different time-points from 1–24 h. An at least partly receptor-specific uptake was found for the AuNPs (Figure 2b), as the cellular uptake of the dually modified particles could be partly blocked by pre-incubation using a 10-fold excess of c(RGDfK) 1 h before incubation with AuNPs.
Furthermore, the AuNPs 8 were tested for their behavior in vitro on A431 cells via fluorescence microscopy. First, the concentration for optimal microscopy was evaluated in a concentration range between 10–100 µmol/mL after an incubation time of 24 h. These initial cell studies revealed an optimized concentration of 50 µg/mL of AuNPs 8 for cell imaging. Next, via confocal fluorescence microscopy, the cell internalization, and the fate of the AuNPs were observed at different time points from 1–24 h (Figure A16). The confocal microscopy images revealed several findings: The number of observed fluorescence foci in the cells rises within the observation time from 1–24 h indicating an accumulation of AuNPs within the cell plasma. Further, these foci become bigger after 1 h of incubation. The AuNPs accumulated most probably in vesicles within the cells. At later time points, the vesicles appeared to become smaller containing less particles, whereas several new and much smaller foci showed up outside the cells. This is perhaps explained by the formation (and their later excretion) of vesicles containing the AuNPs. The conclusion that the mentioned dots represent vesicles is confirmed by the fact that the structures can be stained with membrane Orange, but not with the nuclei marker Sytox Green. This means that the vesicles should consist of excreted cell plasma compartments, underlining that the AuNPs are not accumulating within the cell nuclei. Moreover, the vesicles within in the cells showed a higher fluorescence signal for both membrane Orange and NIR dye.

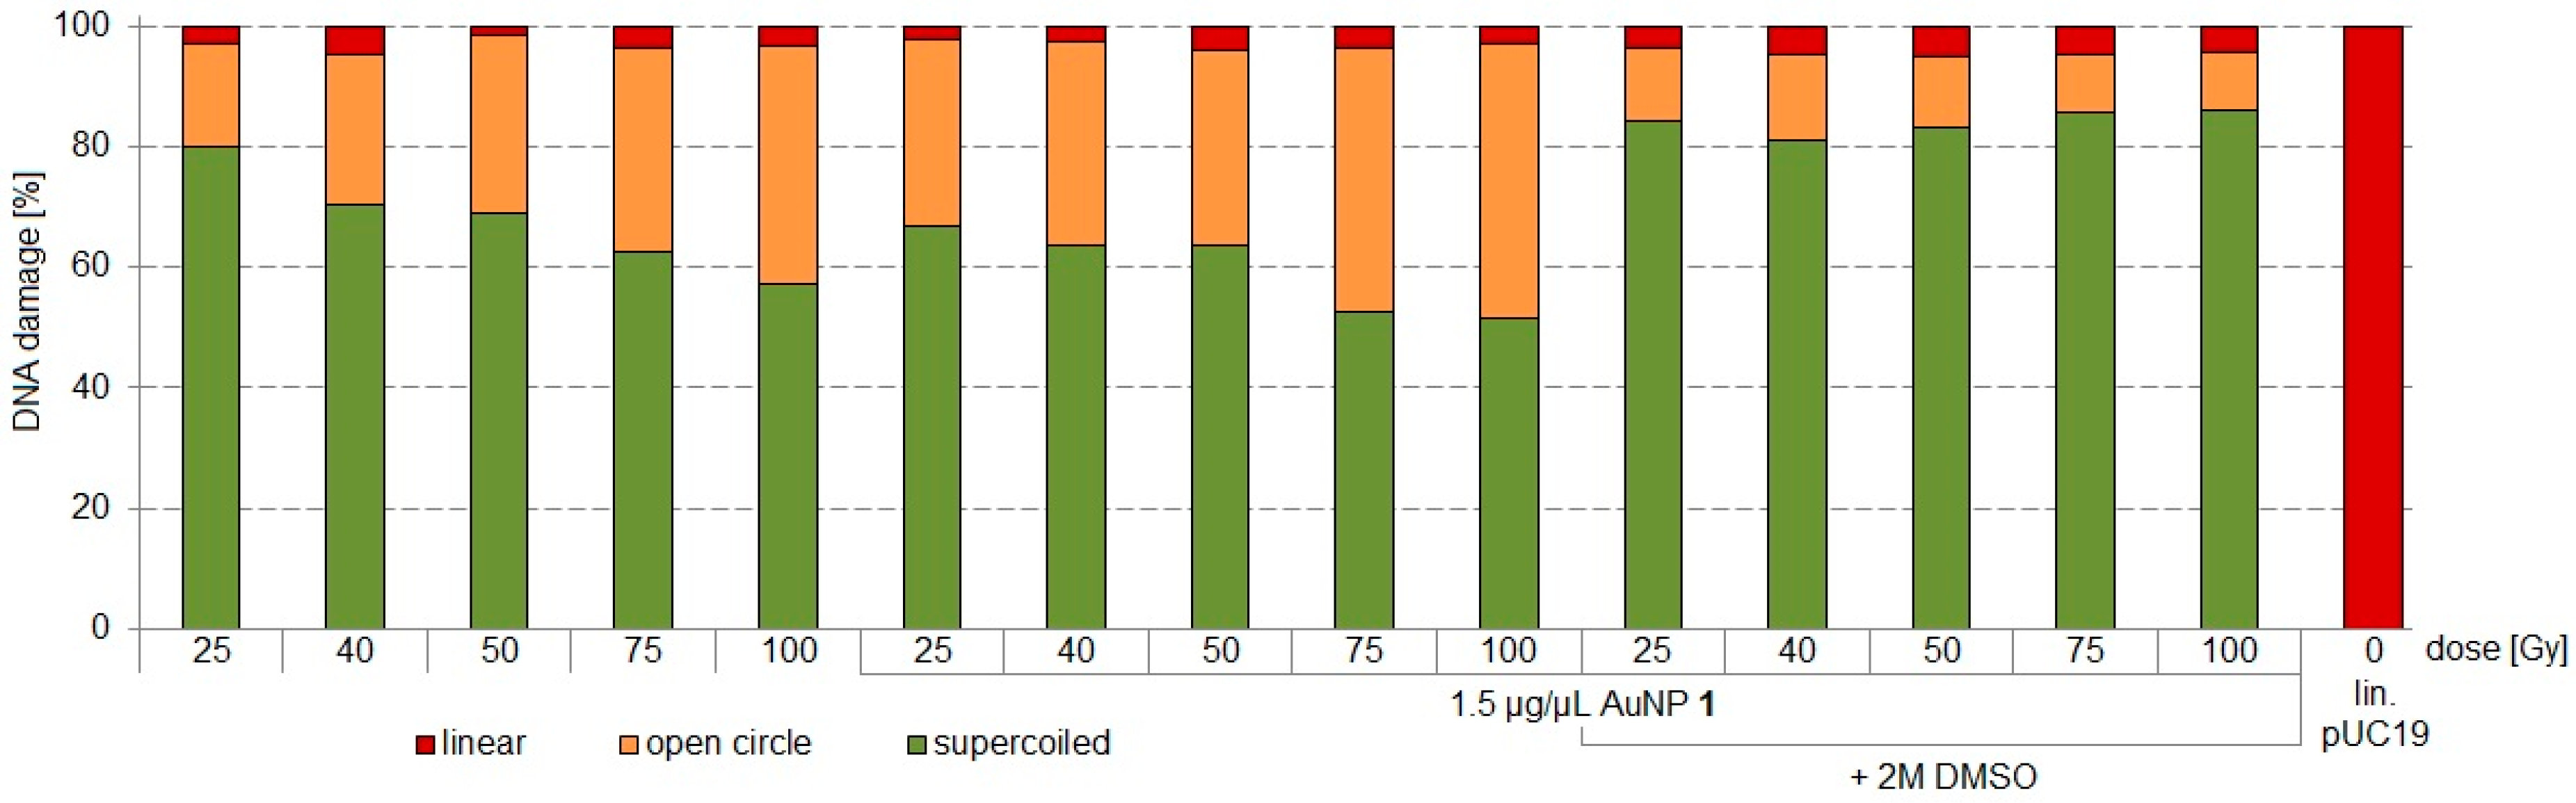
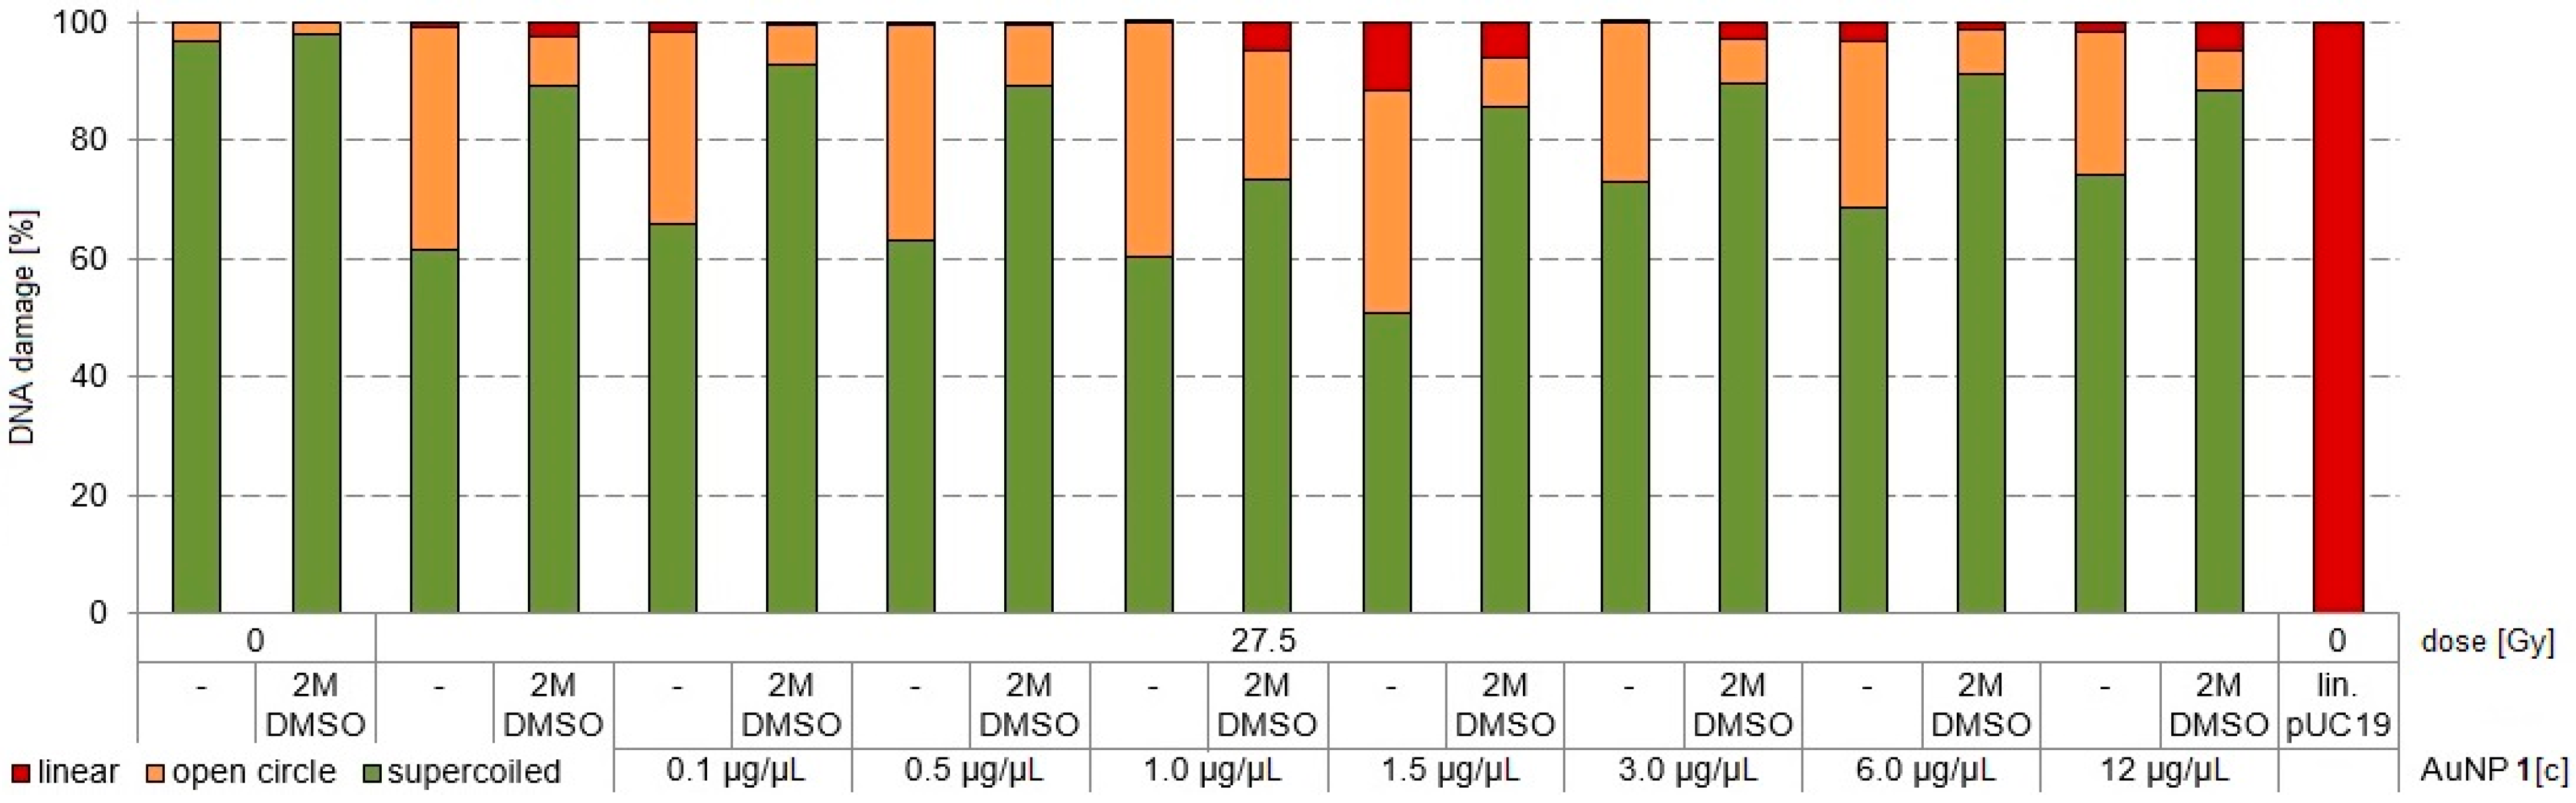
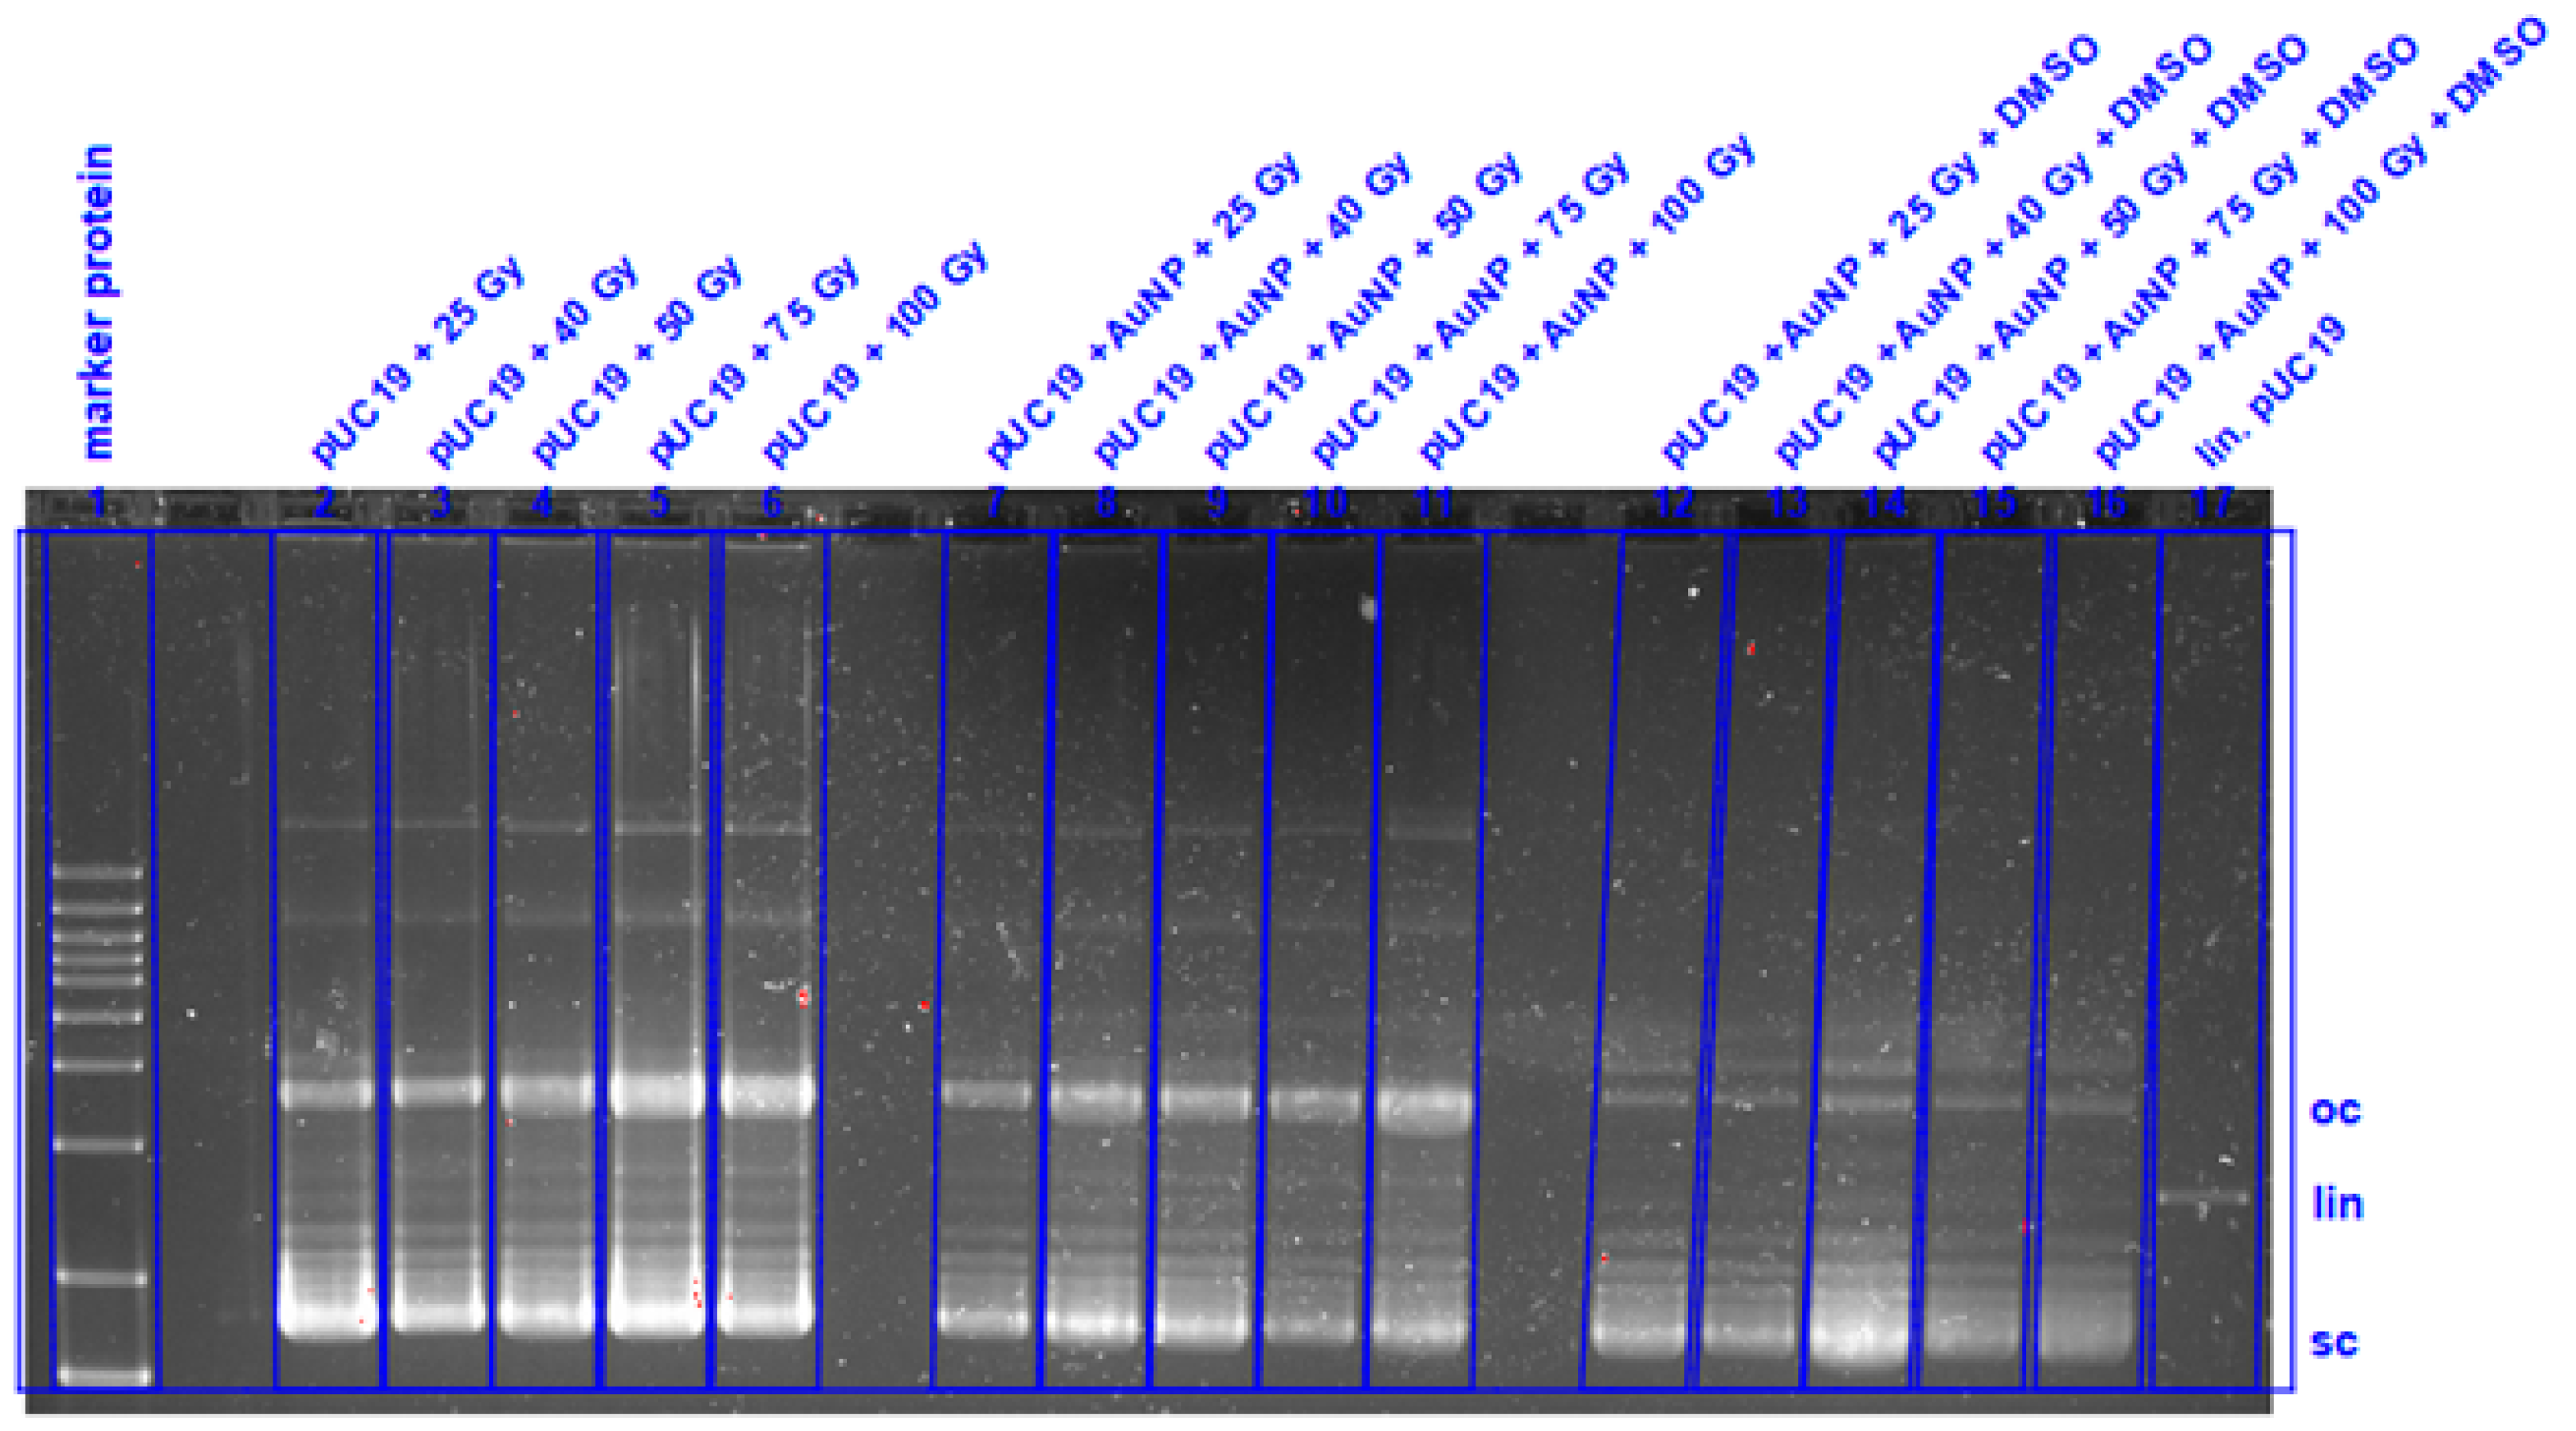
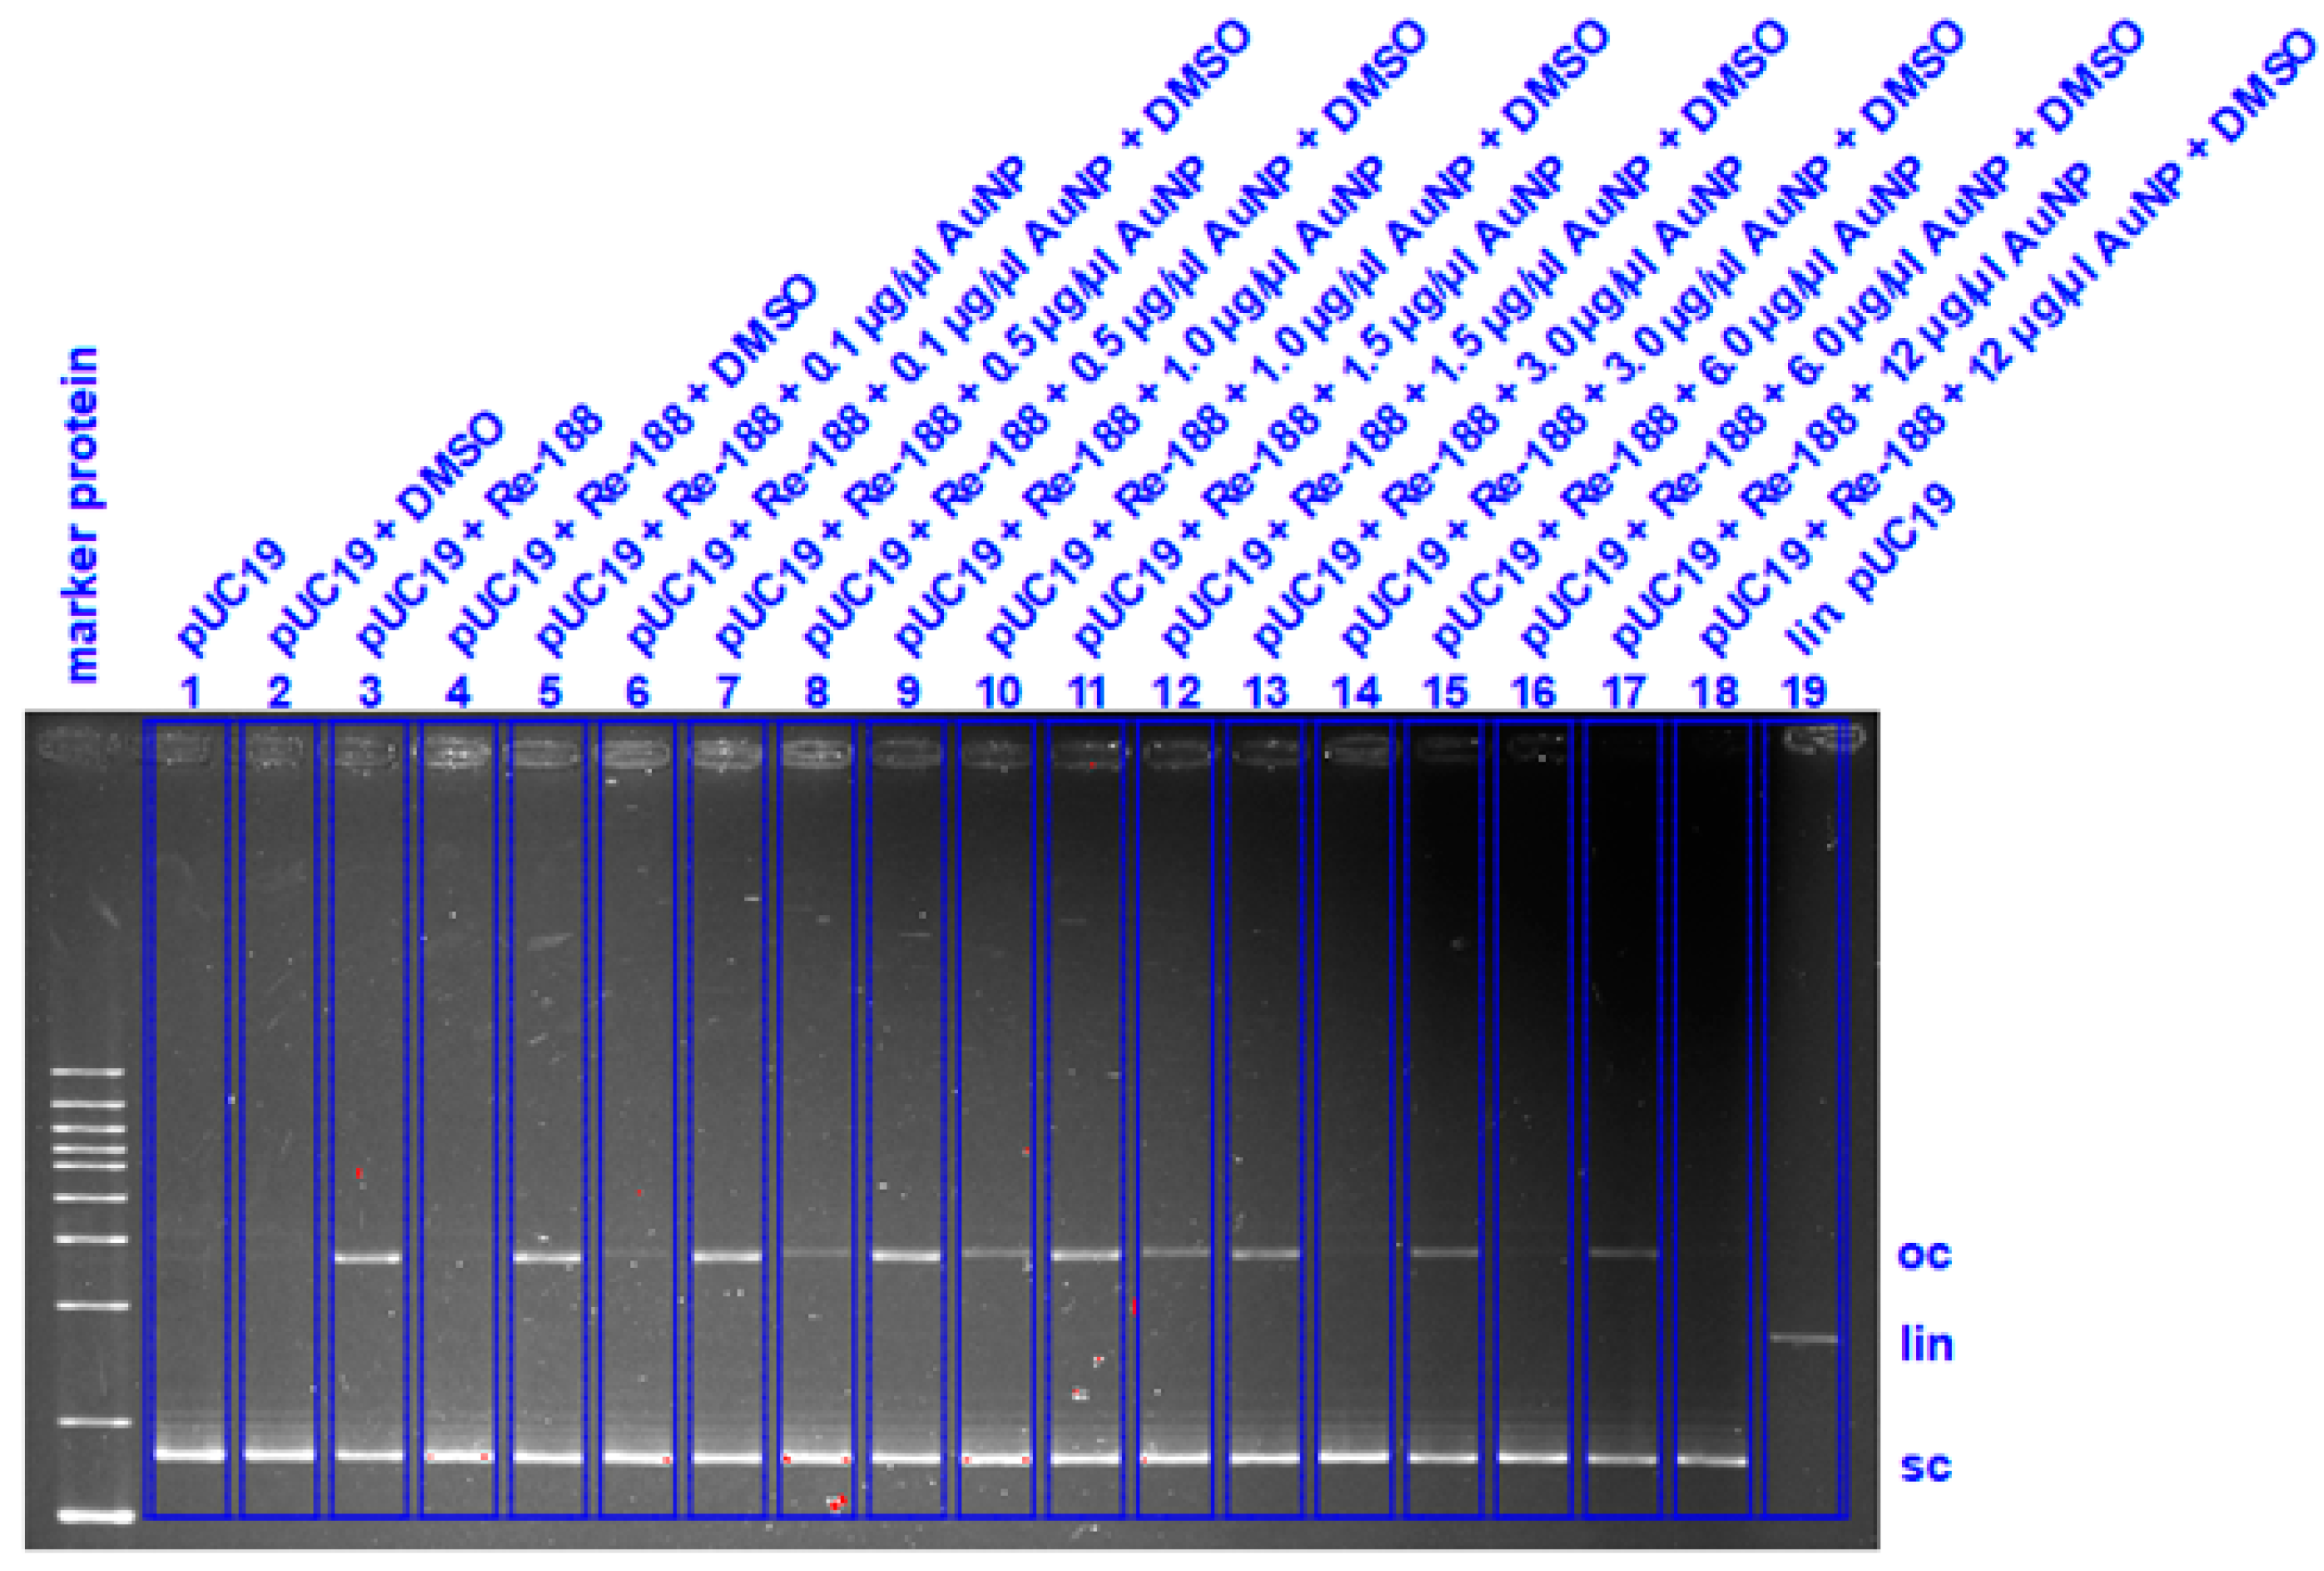
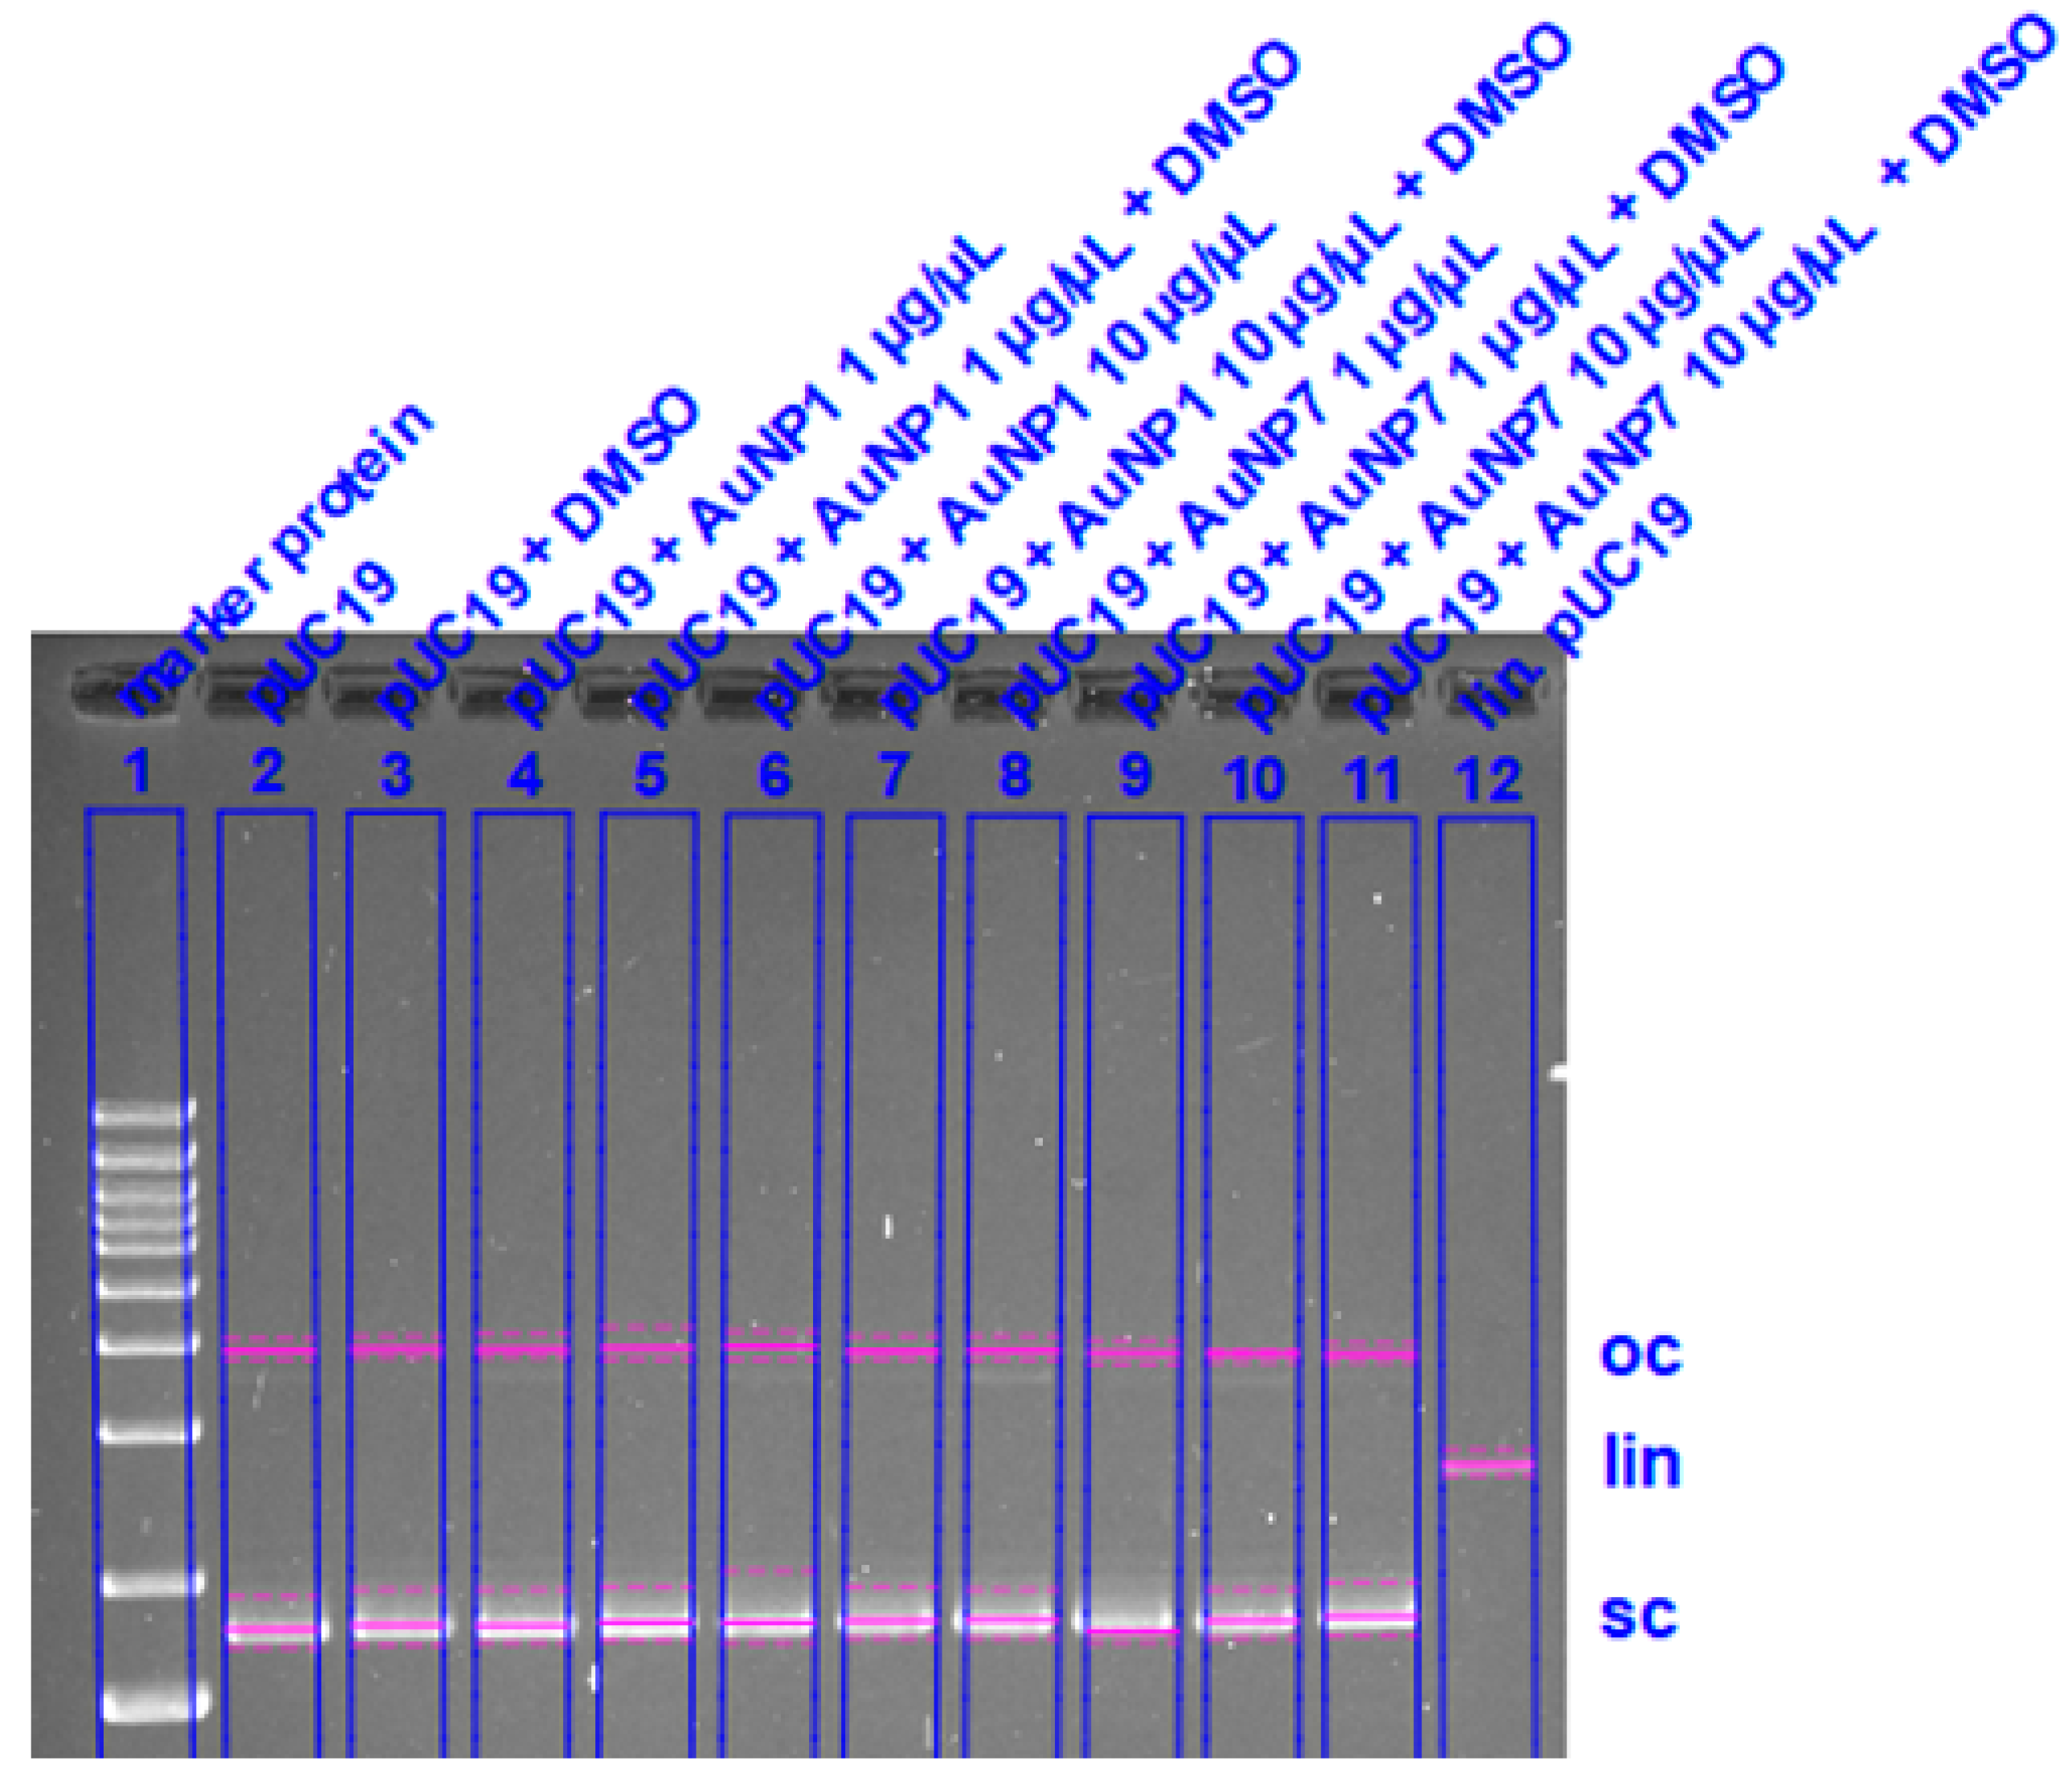
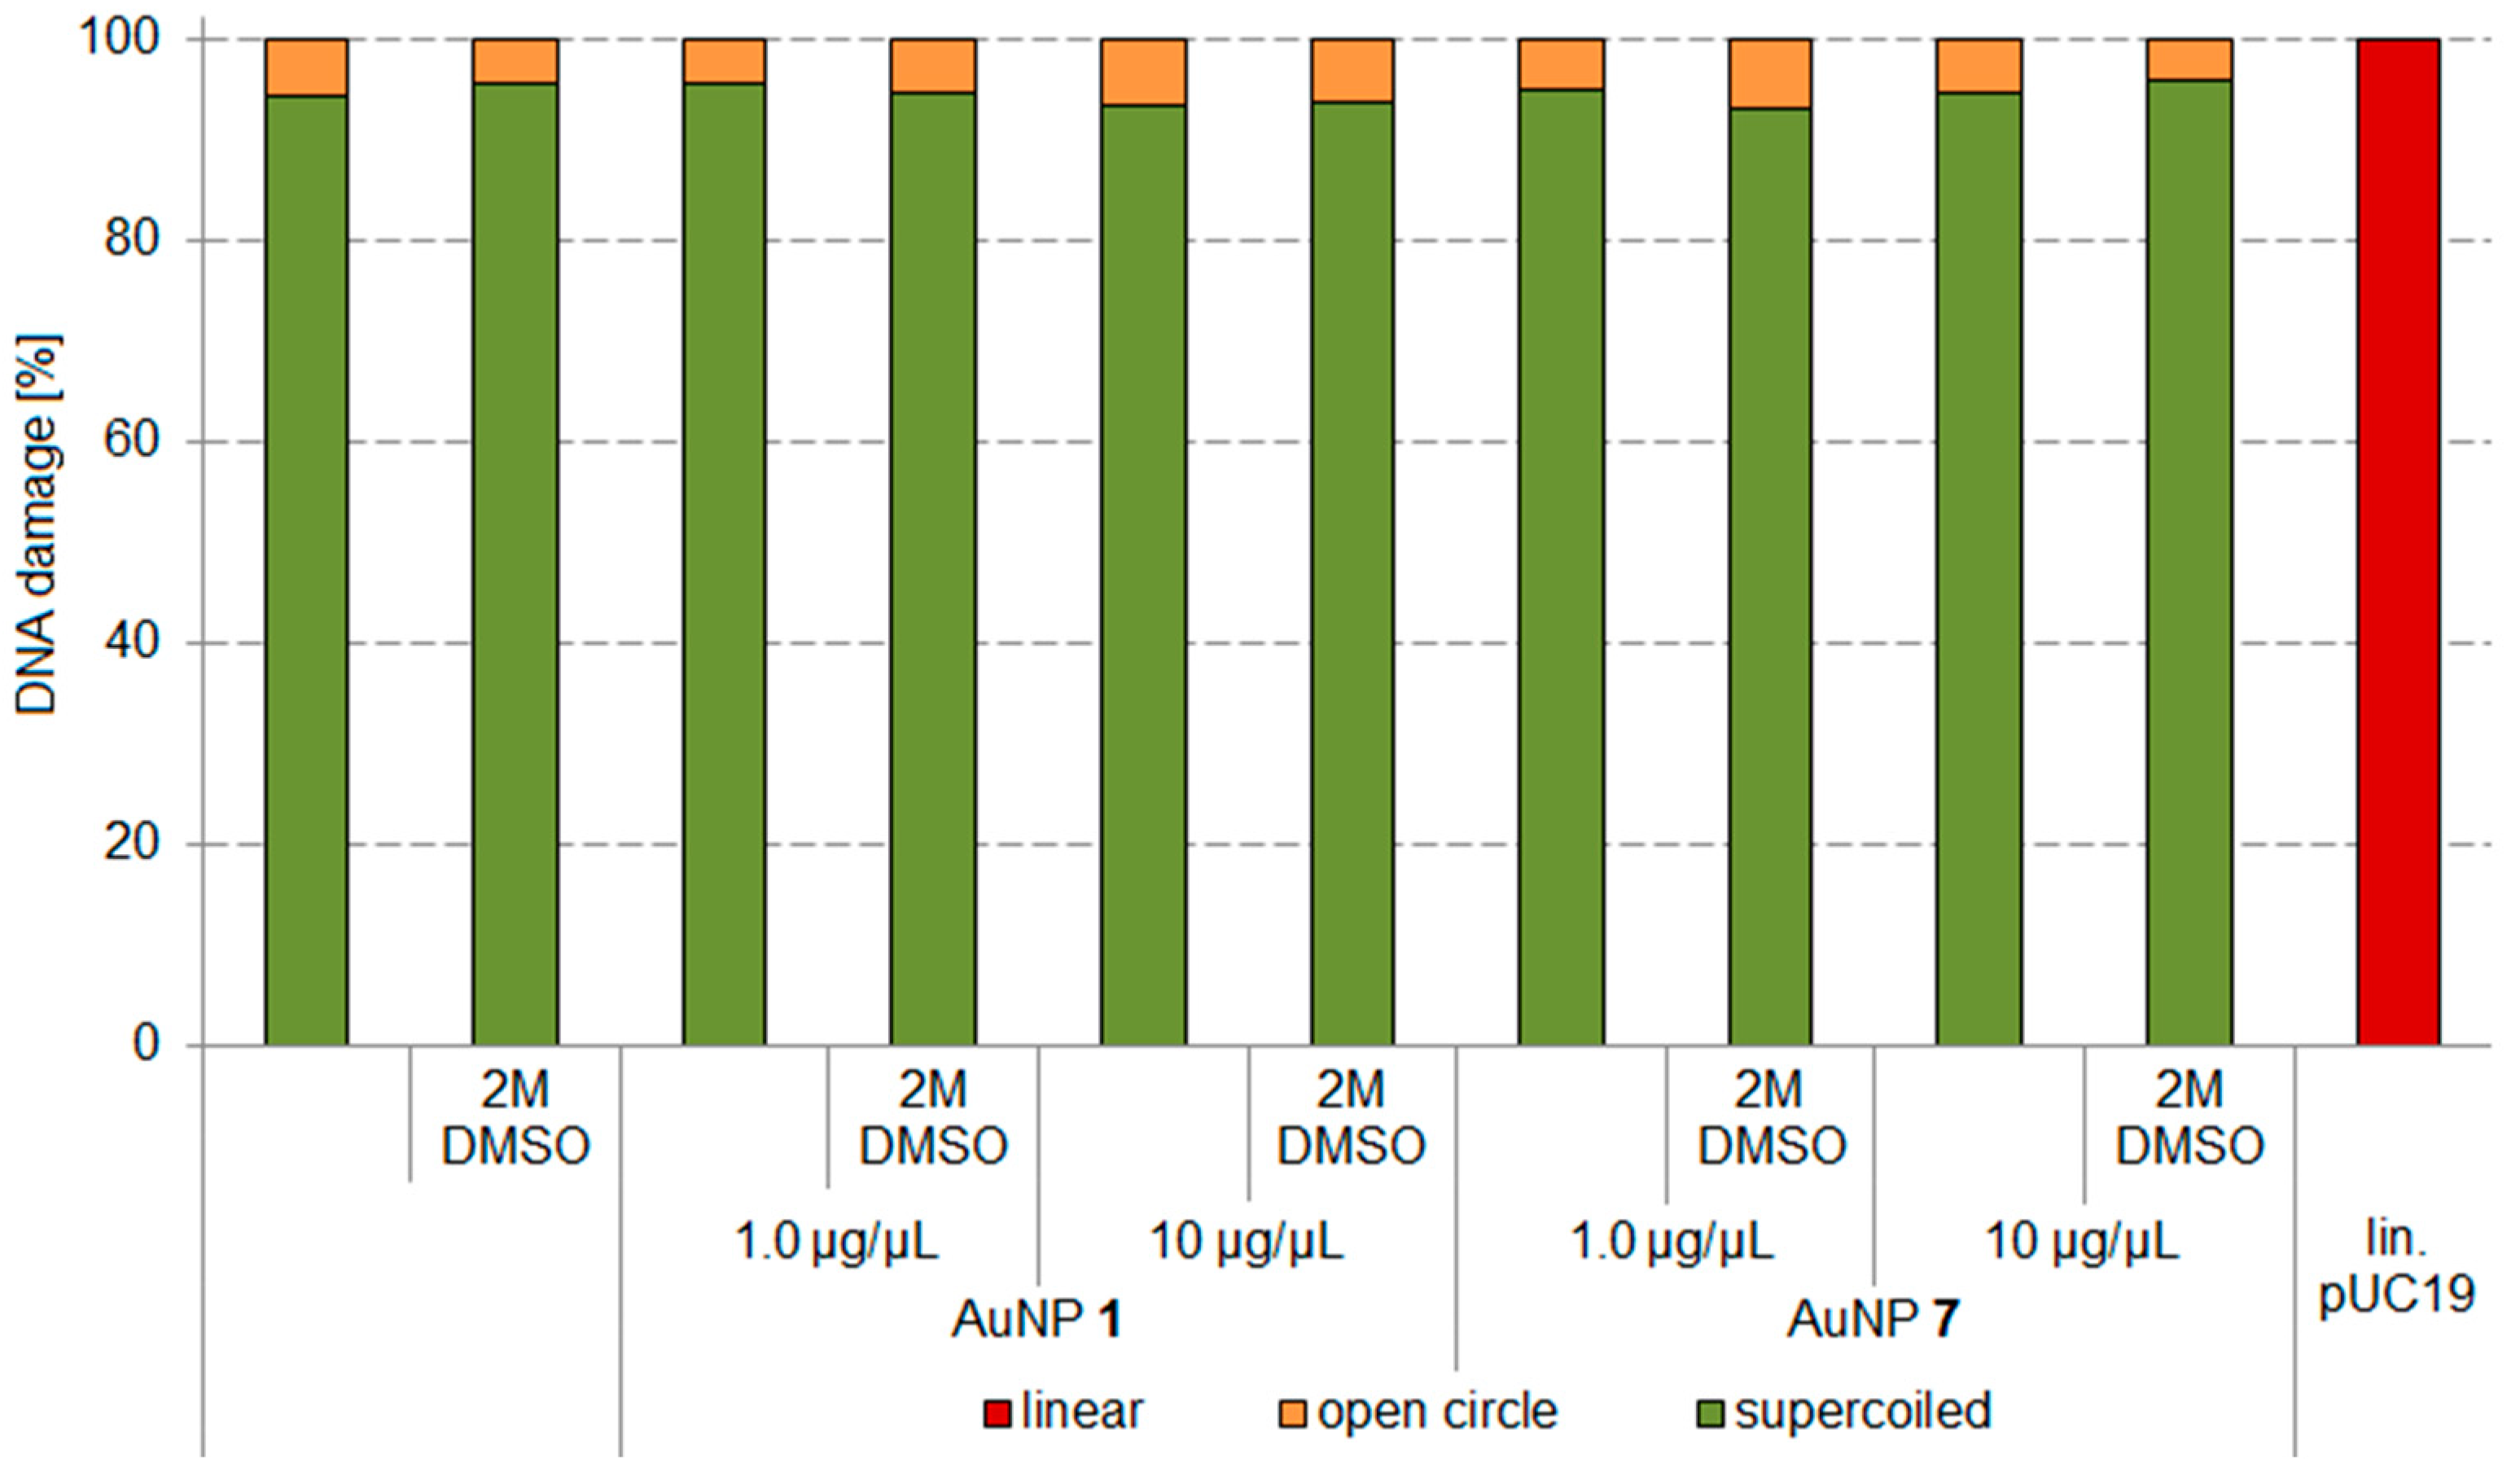
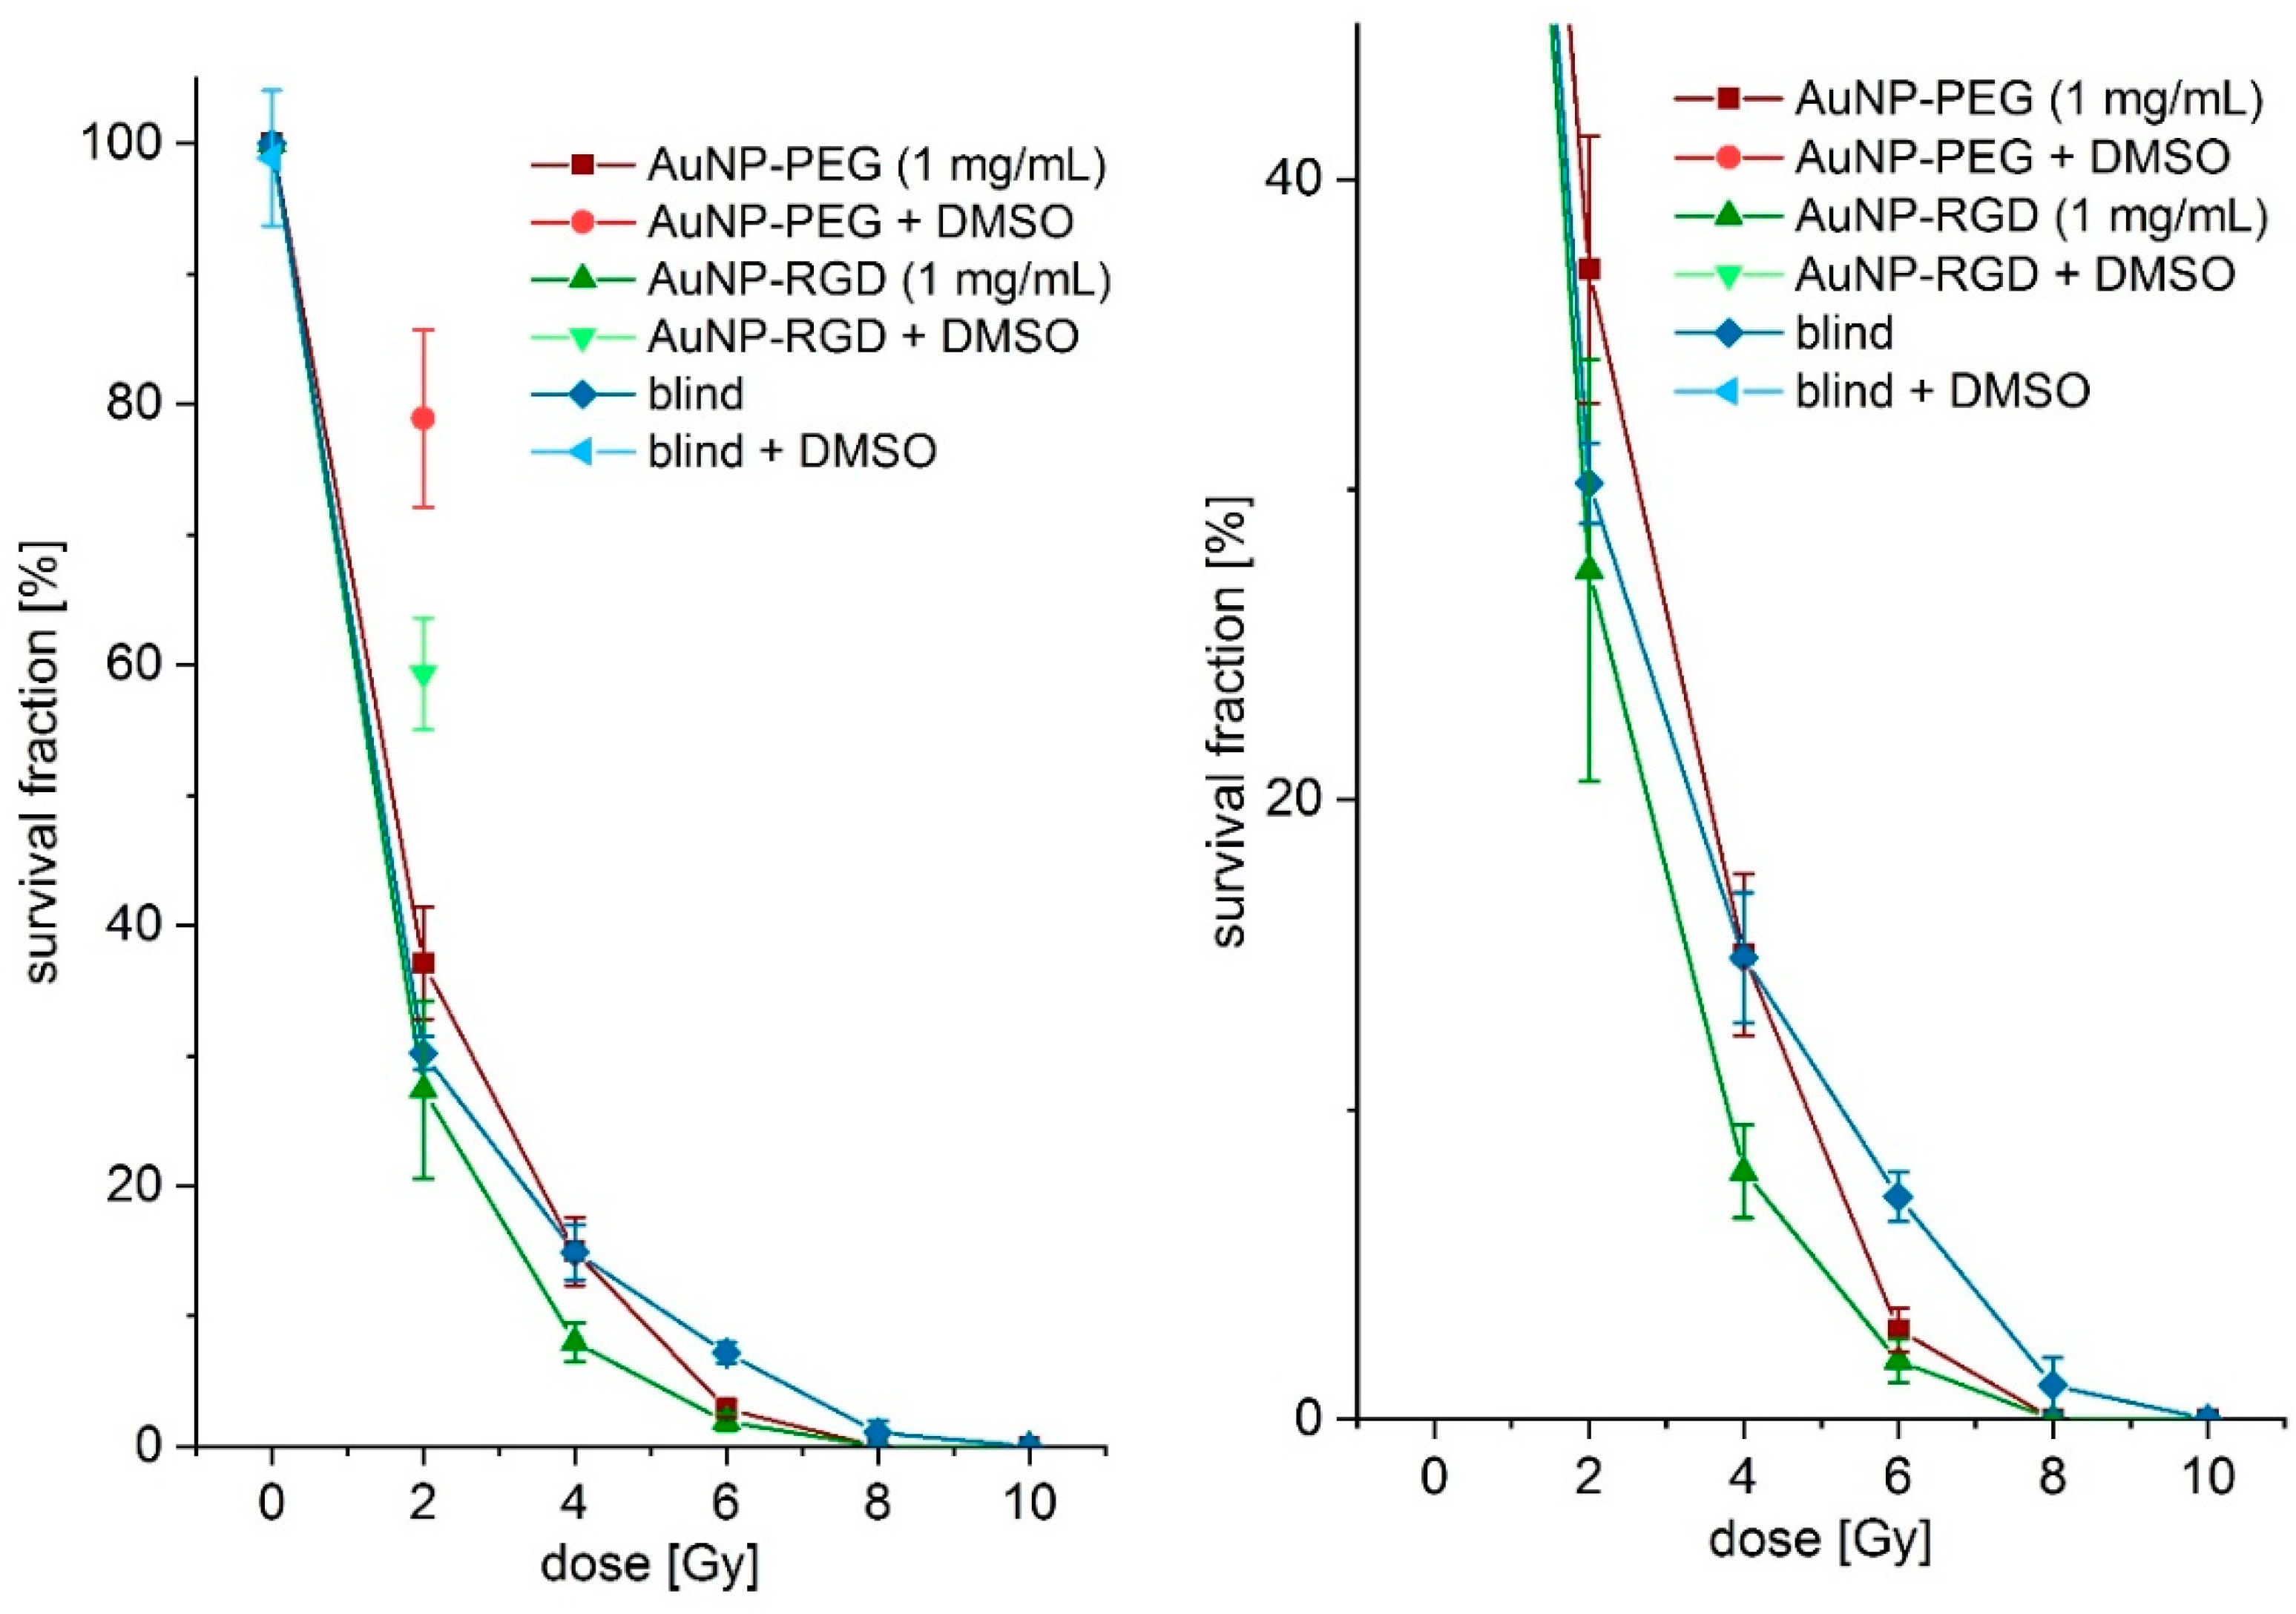
3.3. Radiosensitizing Experiments

The developed AuNPs are useful for diagnosis but could also serve as therapeutic agents in form of radioactive [198Au]AuNPs or as radiosensitizer for X-ray irradiation. In this work, their ability as radiosensitizer was evaluated by irradiation of AuNP-incubated DNA and subsequent gel electrophoresis. AuNPs are effective secondary electron emitters when irradiated with X-rays due to their high photoelectric absorption [36] and their application as radiosensitizers in nuclear medicine is lively discussed [37,52,53]. If they are exaggerated by an external radiation source, Auger-Meitner electrons (AMEs) are emitted. This property was tested at the most prominent cell damage: double strand breaks (DSBs) of DNA. The induced radiation damage to pUC19 plasmid DNA was investigated as a function of dose and concentration of AuNPs. Indirectly induced single strand breaks (SSBs) were confirmed by using DMSO. DMSO can capture OH-radicals to form methanesulfinic acid (MSA) and is therefore a very prominent radical scavenger [54]. The concentration of DMSO is high enough to reach a scavenging effect for several weeks.
Two different AuNP derivatives, non-targeted AuNP-PEG 1 and targeted AuNP-RGD 7, were tested for their radiosensitizing properties. The pUC19 plasmid DNA (280 kDa, 10 ng/µL per sample, BioLabs, New England) served as a biological model. A semi-quantitative analysis was performed to prove the therapeutic efficiency of the AuNPs. To distinguish between DNA damage caused directly (e.g., by AE) and indirectly (especially by OH-radicals), all experiments were repeated in the presence of DMSO (2 M, applied as radical scavenger). DNA damage was quantified by agarose gel electrophoresis and compared with 1 Kb Plus DNA ladder protein (Thermo Fisher) and linear plasmid derived from pUC19 by BamH1-kit. Three different conformation states were evaluated: Supercoiled (native form, sc), open circular (according to SSBs, oc), and linear (after DSBs, lin) (Figure 2). After irradiation, 10 µL samples were mixed with 1.25 µL 10 × BlueJuice gel loading buffer for tracking of DNA migration. After gel electrophoresis (2 h at 120 V, 400 mA, 120 W) the gels were stained with ethidium bromide and the relative fluorescence intensities of the fractions were calculated (BioRad Fluorescence Analyzer) (Figure A17 and Figure A18).
In Figure 3, SSBs without AuNPs are found in form of oc-DNA of 17–40% between 25–100 Gy X-ray irradiation (Maxishot Y.TU, Yxlon). DNA incubated with AuNP 1 (1.5 µg/µL) showed oc-DNA of 31–46% between 25–100 Gy X-ray irradiation, indicating a 14% higher SSB induction at a dose of 25 Gy and 6% more SSBs at a dose of 100 Gy. At lower doses, the higher radiosensitizing effect of AuNP 1 was partially quenchable with DMSO to <10% oc-DNA. The radiosensitizing effect was highest at 25 Gy. DSBs were induced in every experiment to the same extent (3 ± 2%) and were not quenchable by DMSO. Therefore, no direct DNA damage was observable, but a higher indirect DNA damage at AuNP-incubated DNA was found.
Next, the radiosensitizing effect at the same dose but different AuNP concentrations was evaluated (Figure 4). Further, we wanted to test whether it is possible to induce more DSBs by more production of AMEs, when the radiation source is in the direct vicinity of the AuNPs. For this experiment, Re-188-solution as inducer for radiosensitizing effects was chosen with its characteristic 2.12 MeV β- emission and 155 keV γ-coemission. The highest effect for radiosensitizing was determined for 27.5 Gy as incubation dose. To reach this dose, 0.5 MBq Re-188 within 18 h incubation time in a 50 µL volume in a 1.5 mL Eppendorf vial were calculated using Formula 1. AuNP concentrations from 0.1–12.0 µg/µL were tested. Interestingly, an optimal radiosensitizing effect for AuNP-concentrations between 1.0–1.5 µg/µL was found. At these AuNP-concentrations the direct DNA damage in form of DSBs was 4.8–11.7%. This effect was completely quenchable by 2 M DMSO for Re-188 alone, meaning that there are only nascenting OH-radicals responsible for the DNA damage. In contrast, by the combination of Re-188 with AuNPs 1, this effect was only partially quenchable by 2 M DMSO, meaning that additional AMEs from the AuNPs have a direct impact to the DNA damage (Figure A18). From these experiments it can be concluded that Re-188 in combination with AuNPs have a higher radiosensitizing effect than X-rays in combination with AuNPs. This effect has to be studied further.
D ( A , t ) = S A T 1 / 2 ln ( 2 ) ( 1 exp ( ln ( 2 ) t T 1 / 2 ) )
Formula (1) Calculation of ground dose in a 6-well-plate or Eppendorf vial for Re-188 by Geant4-simulation [55]. D: energy dose, S: S-value, A: activity, T1/2: half-live of radionuclide, T: irradiation time.

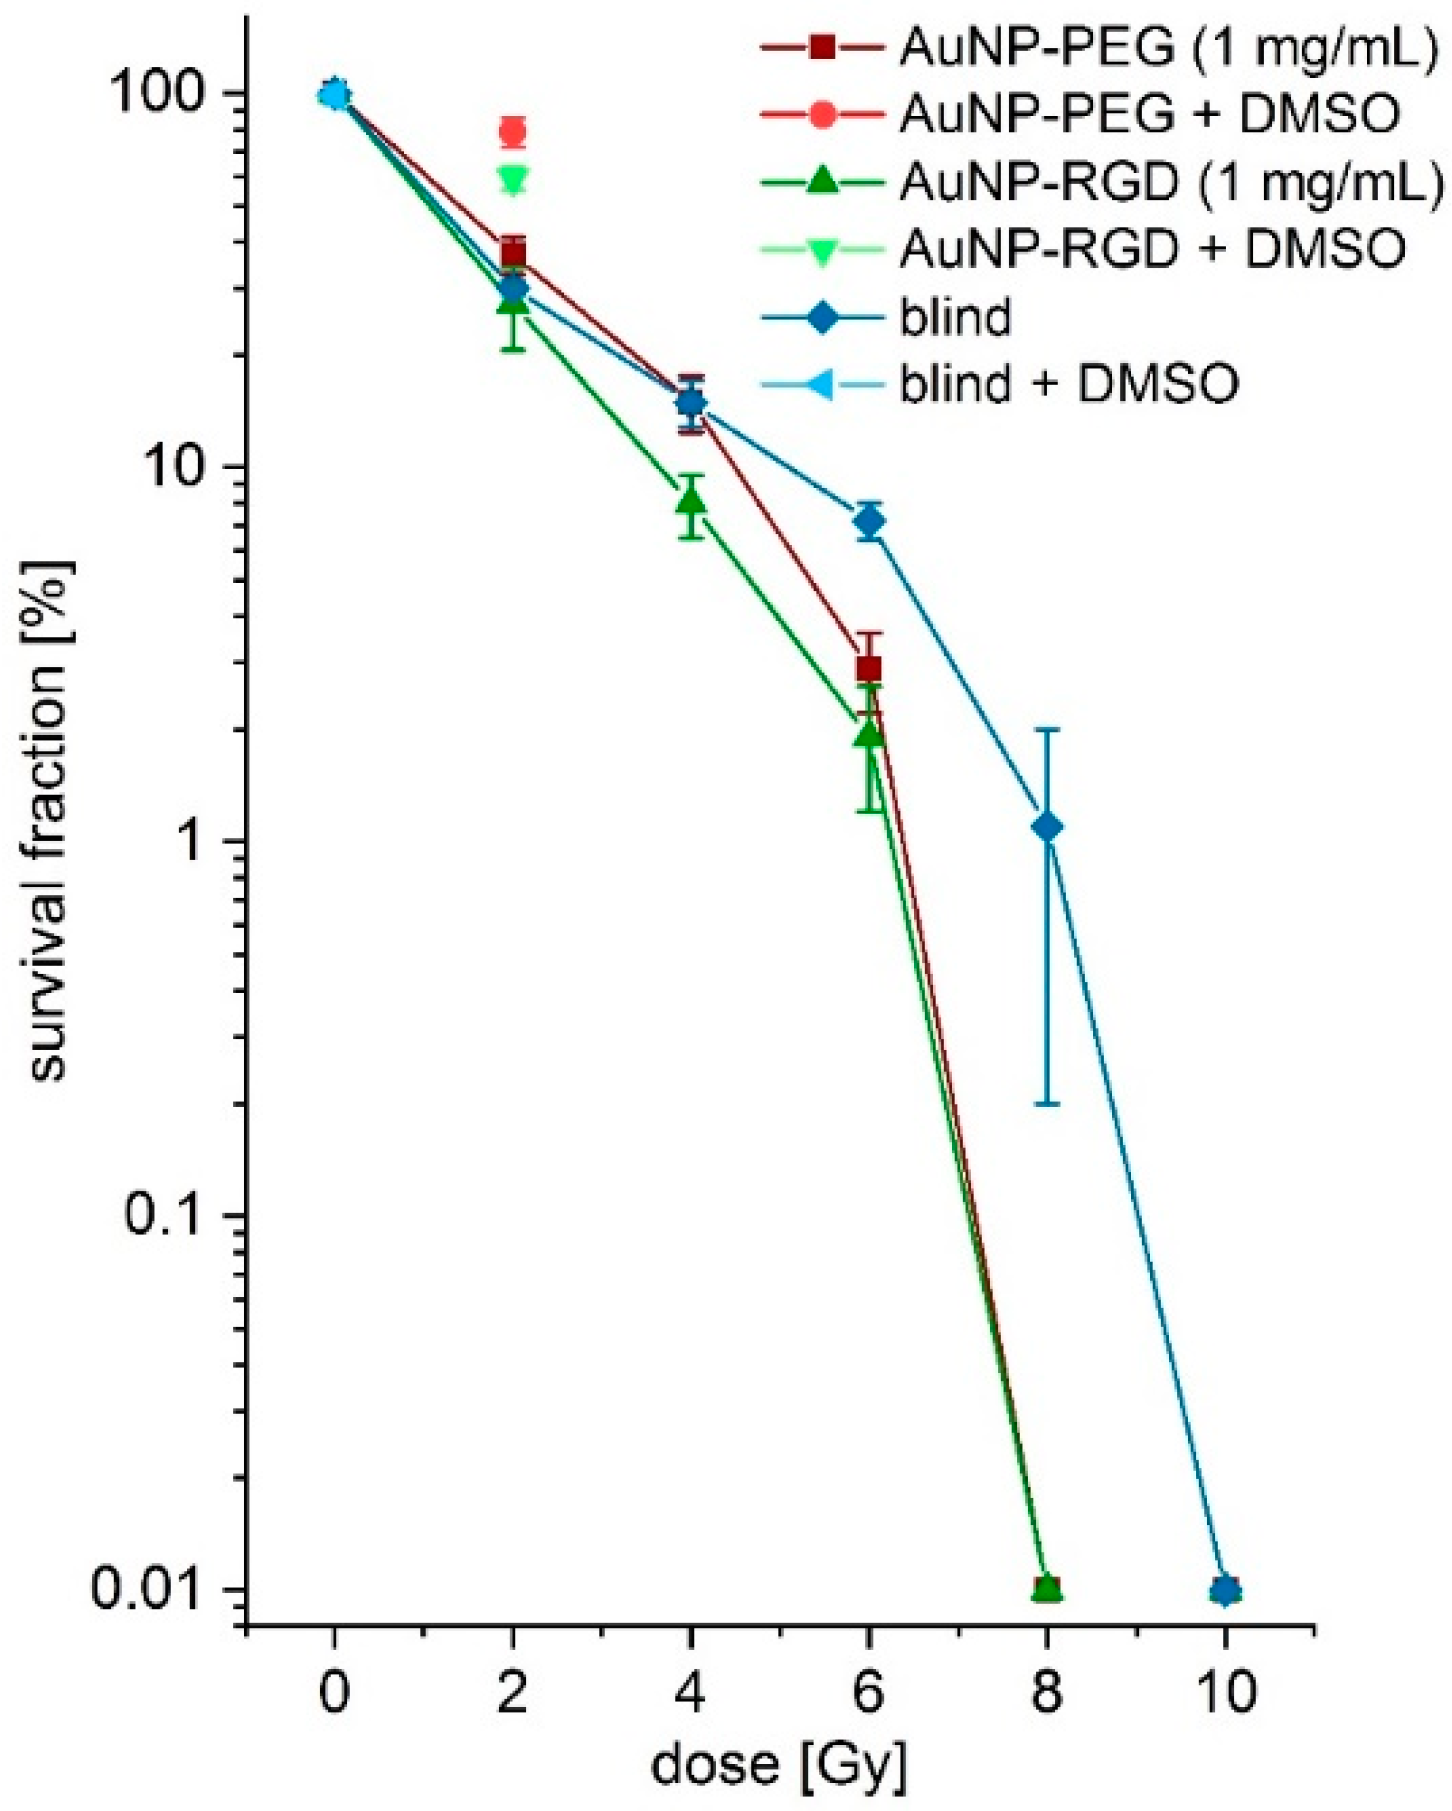
3.4. Colony Formation Assay (CFA)

The radiosensitizing effect found for the DNA experiments was repeated in vitro by irradiation of AuNP-incubated and non-incubated A431 cells and subsequent CFA [52,53]. AuNPs within cell plasma are discussed to damage certain plasma compartments by additionally produced Auger-Meitner-electrons during X-ray irradiation [56]. This hypothesis was proven in a pilot experiment. First, AuNPs 1 were tested for cell toxicity with different concentrations on A431 cells by CFA. No cell toxicity was found up to a concentration of 1 mg/mL (2.9 µM) (Figure A21) comparable with the literature data [57,58,59]. Therefore, A431 cells were incubated with and without AuNPs 1 and 7 24 h before irradiation. After incubation, the cells were washed and subsequently treated with doses of 0–10 Gy by X-ray irradiation. Afterwards, the cells were seeded for CFA. Indeed, a low difference in survival fractions for AuNP-incubated and non-incubated cells was found for a dose of 2 Gy (Figure 5). A slightly lower survival fraction for AuNP-incubated cells was found at 4 Gy for AuNP-RGD 7 (8.0 ± 1.5)% but not for AuNP-PEG 1 (15.0 ± 2.6)% compared to cells in absence of AuNPs (14.9 ± 2.1)%. A clearly much lower survival fraction at a dose of 6 Gy was found for AuNPs 7 (1.9 ± 0.7)% and AuNP 1 (2.9 ± 0.7)% compared to cells in absence of AuNPs (7.2 ± 0.8)% (Figure 5 and Figure A22), indicating a radiosensitizing effect. Further, at a dose of 8 Gy, no colony formation was found for AuNP-incubated cells. Furthermore, at a dose of 10 Gy, no colony formation was found for cells in absence of AuNPs. Interestingly, the specific AuNPs 7 showed a stronger effect at a dose of 4 and 6 Gy compared to non-specific AuNPs 1. At a dose of 2 Gy, the cells were also incubated with 0.2 M DMSO as radical scavenger during irradiation. The factor 10 less DMSO concentration is important for cell life. These fractions showed lower cell damage for AuNP 7 (59.3 ± 4.3)% and much lower cell damage for AuNP 1 (78.9 ± 6.8). Non-incubated cells showed cell survival of (98.9 ± 5.2)% with 0.2 M DMSO at a dose of 0 Gy, indicating no toxic effects at these conditions.

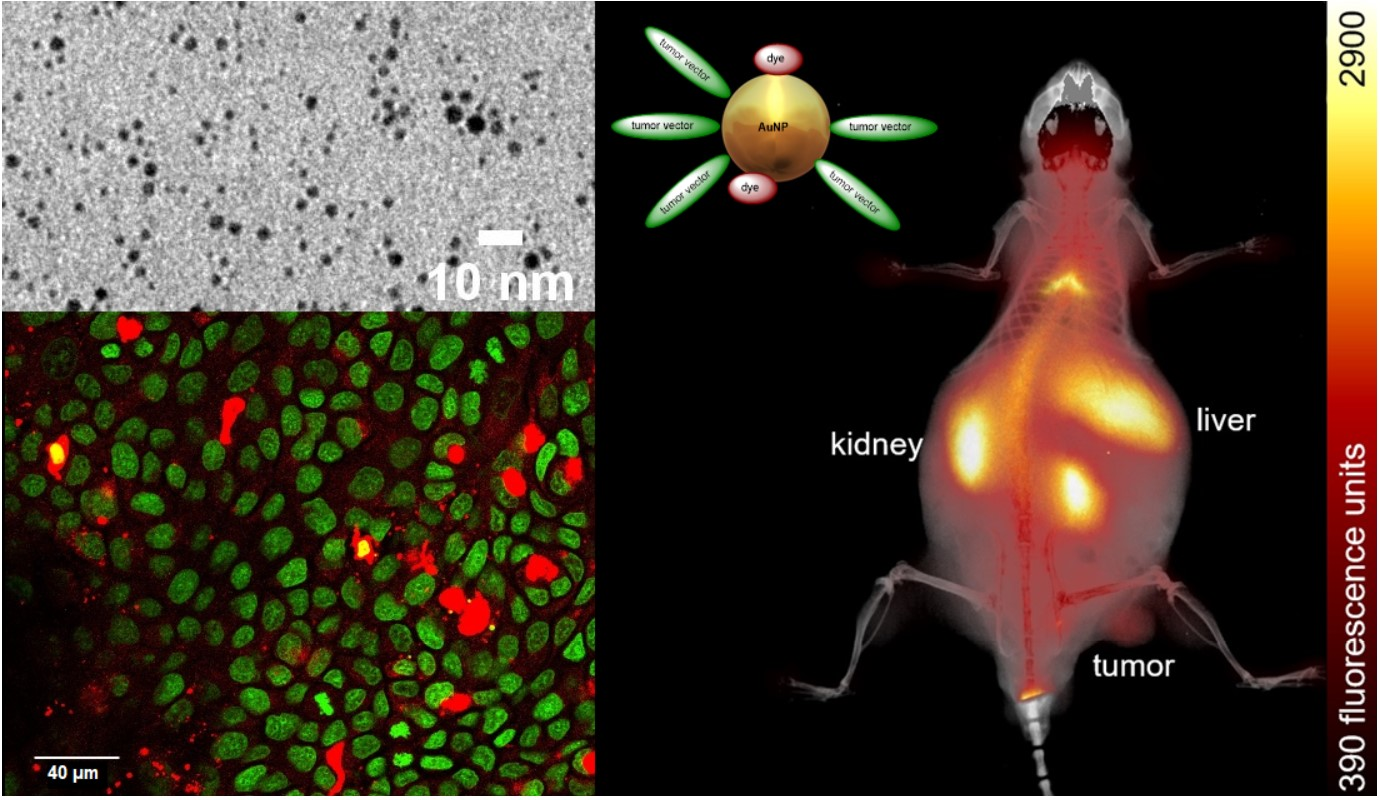
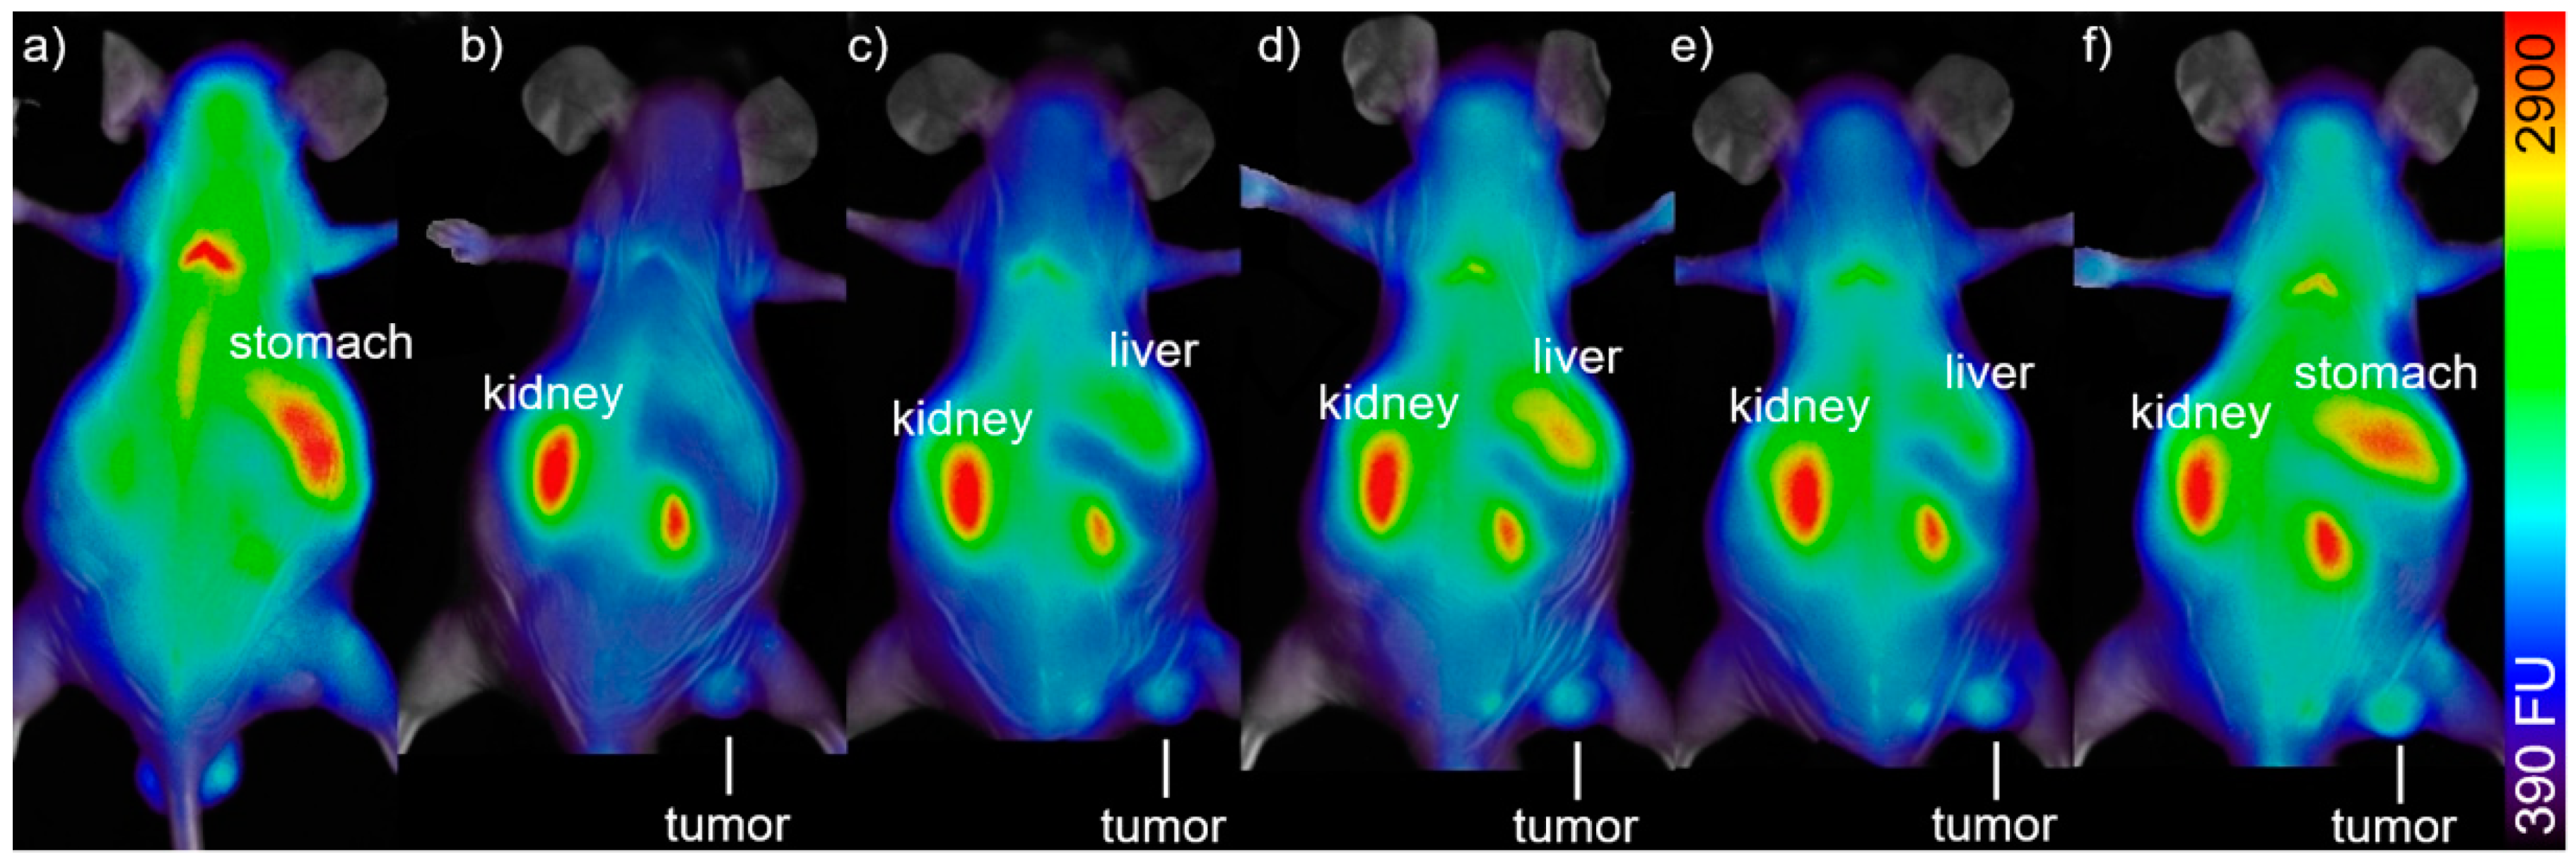
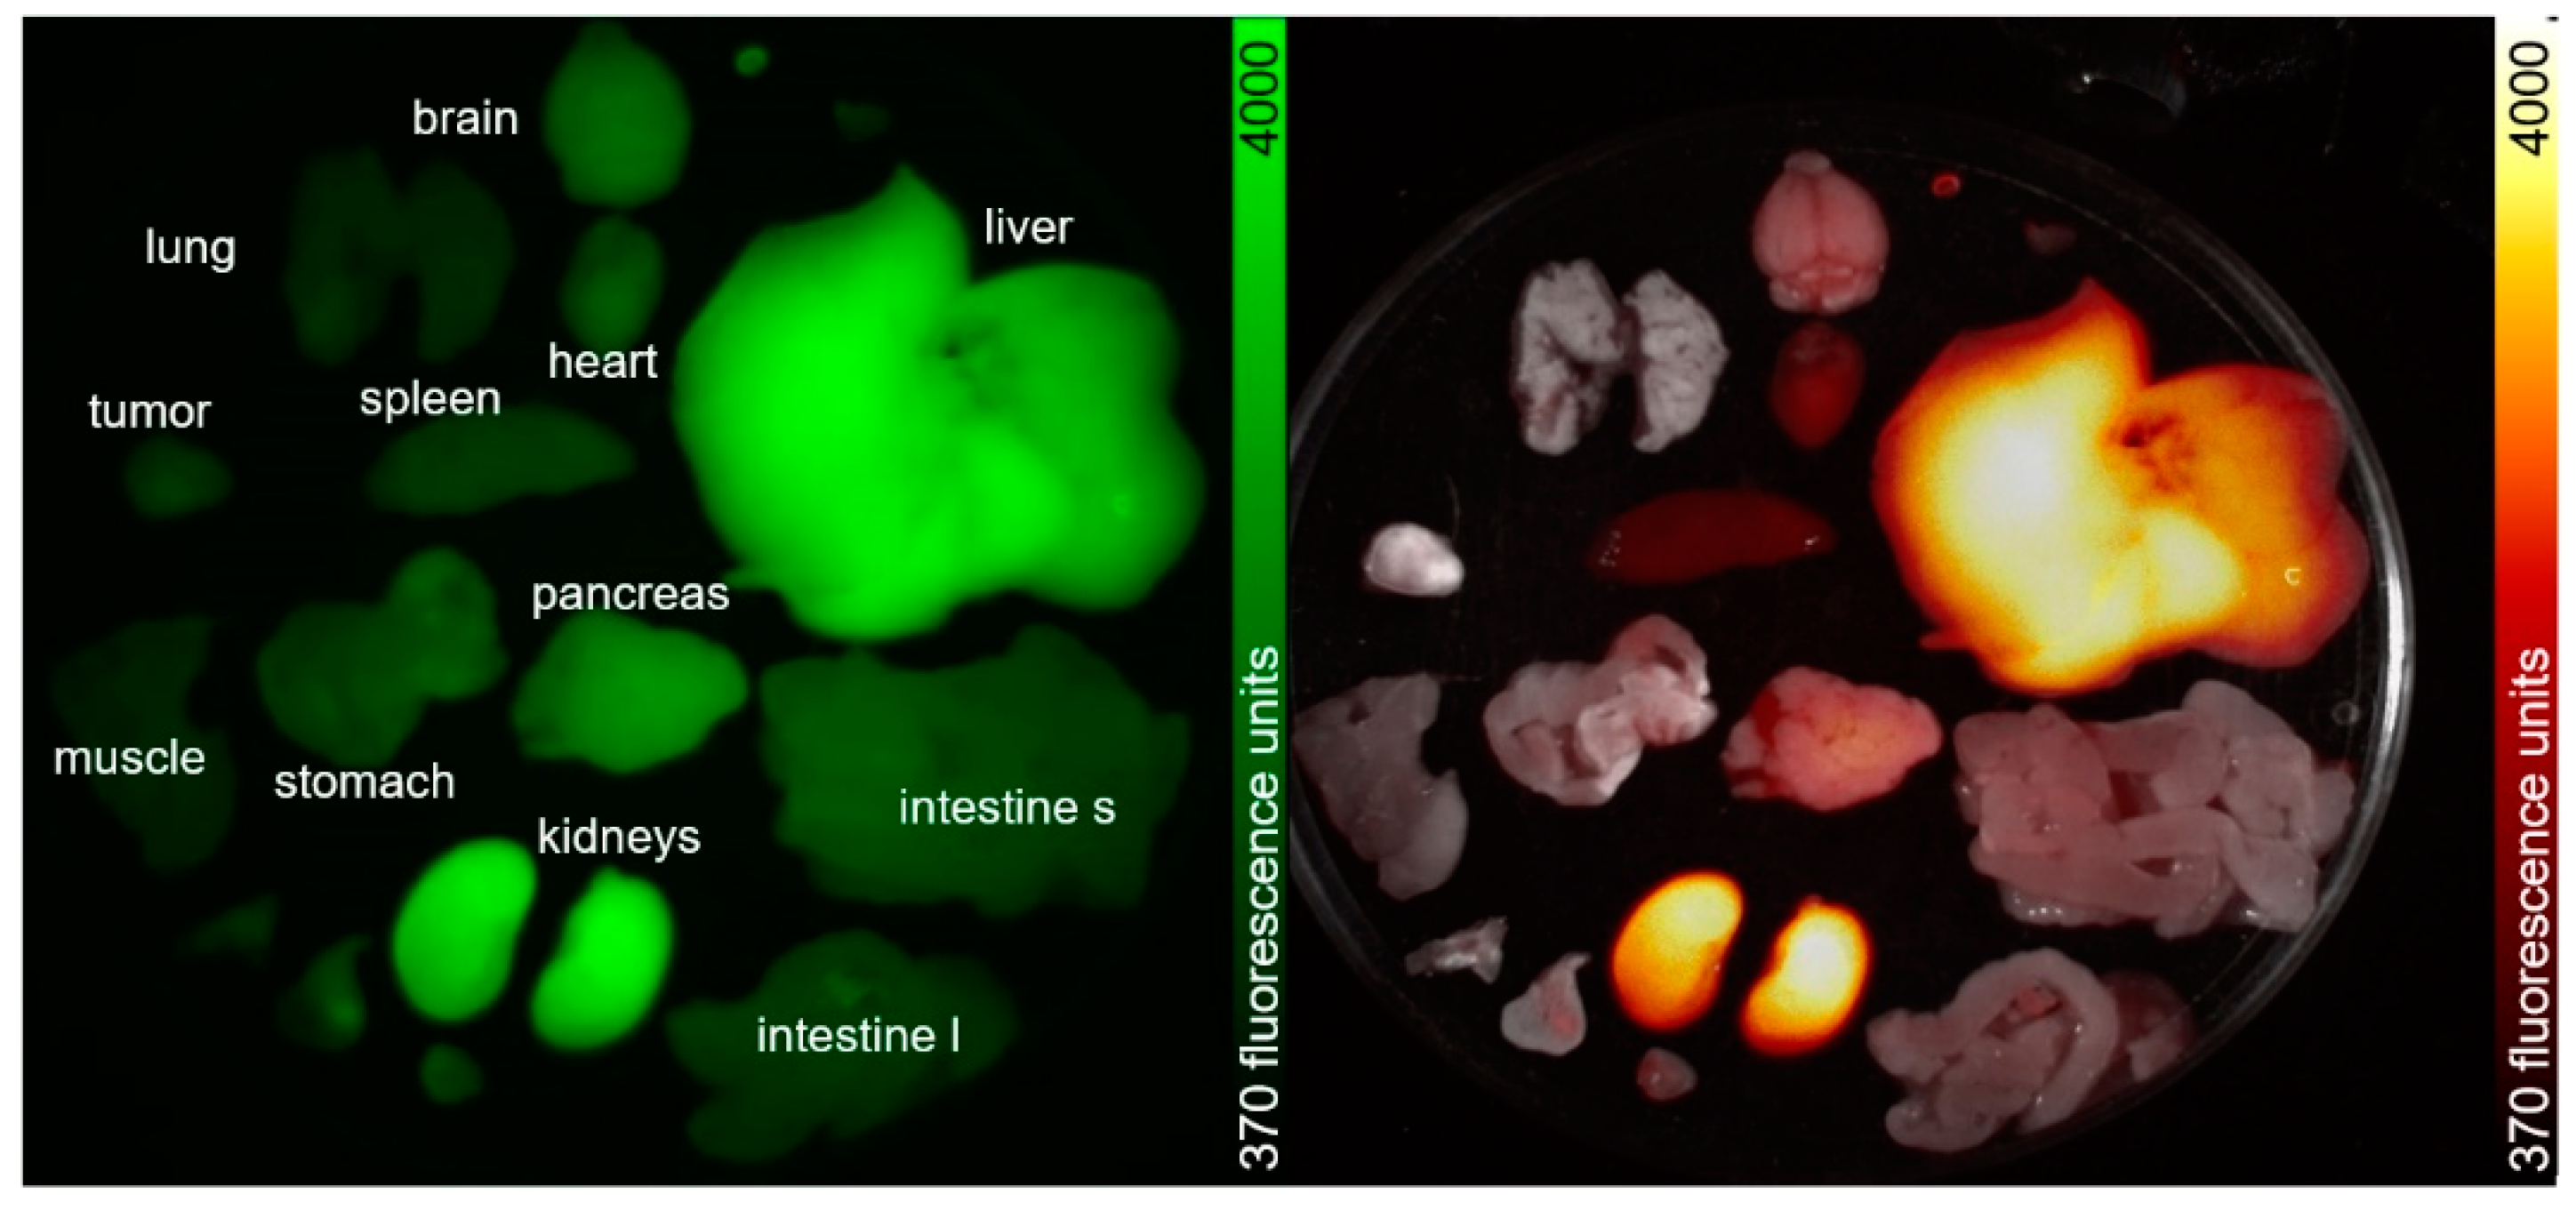
3.5. In Vivo Experiments

In order to prove the concept of receptor-specific tumor accumulation of the peptide-functionalized particles and their suitability for optical imaging in vivo, two A431-tumor bearing mice were injected with AuNPs 8 according to previously established protocols [43]. In brief, the mice were injected with 75 µg AuNPs 8 in 100 µL sterile PBS. The injected amount of AuNPs 8 corresponded to 1.5 µg (1.75 nmol) of NIR-dye per animal as AuNPs 8 contain 2% dye (see Table 1). This amount is comparable to literature values of 1–50 µg/g for cyanine-dye conjugates for in vivo fluorescence imaging of tumors [10,49,60,61,62]. The mice were measured repeatedly over a period of up to 72 h post injection (p.i.) with a fluorescence imager (In Vivo Xtreme, Bruker) (Figure 6) by using 730 nm as excitation wavelength and 790 nm as emission wavelength. A very low background signal was found, which is assumed to derive from the chlorophyll-containing diet of the mice. After injection of AuNPs 8, the background signal faded to the underground and a fast renal clearance of an excess of AuNPs 8 was observed in vivo. AuNPs 8 were found ex vivo in the collected urine and showed no degradation when analyzed by HPLC. The tumor-to-muscle ratio increased during the time of observation. The accumulation was measured by region-of-interest (ROI) interpretation (Figure A23), and after 72 h, an ex vivo biodistribution (Figure 7) was performed and compared with the obtained in vivo data. The accumulation values detected by in vivo measurements and biodistribution experiments were found to be comparable for tumor, muscle, and kidney but different for the liver, since in biodistribution experiments, the weight of the organs was also considered and the organs could be measured directly (Figure A24, Table A1), whereas in live imaging, the signal of the liver was found to be relatively lower, since the organ was measured from the back of the mice. However, the animal experiments revealed a higher accumulation of AuNPs 8 in the A431-tumor in comparison to muscle at 3–72 h post i.v. injection.

4. Discussion

Stable αvβ3-specific AuNPs 7 were successfully synthesized with a slightly better avidity compared to the monomeric peptide ligand c(RGDfK). AuNPs additionally decorated with an NIR-dye had a slightly lower avidity as compared with the monomeric RGD-ligand, since in this case, a lower number of RGD ligands is located on the surface of the AuNPs (Table A1).
Via confocal fluorescence microscopy, the fate of AuNPs 8 on A431 cells was observed within 1–24 h. The AuNPs started to concentrate within the cell plasma but not within the nuclei as confirmed by confocal microscopy. Additionally, the formation of vesicles after 24 h and their excretion could be verified. The fluorescence signal started to concentrate in small dots within the cell plasma and in the extracellular medium those small foci could be observed too, indicating the excretion of the AuNPs in form of vesicles. This vesicle formation and excretion from cells within 24 h after incubation is perhaps a certain property of the AuNPs, when healthy tissue should expel therapeutic AuNPs. Within tumor tissue, the vesicles may stick in the interstitial cell region because of the lower blood supply and lower nutrition exchange with the surrounding tissues, presupposed that the AuNP would penetrate the deep tumor tissue.
The activation of AuNPs by X-rays to emit AMEs was tested at pUC19 DNA incubated with AuNPs 1 [36,37,38]. No additional DSBs were found for all doses (25–100 Gy). Interestingly, additional SSBs (14%) in the presence of AuNP 1 were found at 25 Gy compared to non-AuNP-incubated DNA. Those SSBs were not inhibitable by DMSO, indicating the emission of AMEs from the AuNPs by external X-ray irradiation due to direct DNA damage without influence of OH-radicals. It is known that AuNPs can degrade DNA to little extend (1–2%) but does not increase significantly for longer time (weeks) and with organic solvents or no-neutral pH [63,64]. To further investigate this phenomenon, an experiment with AuNP 1 and 7 at concentrations of 1 and 10 µg/mL was performed to evaluate the impact of the AuNPs to the degradation of DNA (Figure A19 and Figure A20). The DNA degradation was not significantly different for all experimental conditions, and the formation of oc-DNA was at (5.48 ± 0.95)%. As for our experimental setting (2 h incubation, neutral pH), we can exclude that the >10% DNA damage is from the AuNP itself, but most prominent due to the induction of AMEs [65]. Further, an optimum for the AuNP concentration between 0.5–1.5 mg/mL was determined by incubation of DNA with Re-188 solution. The reason for this observation may be guessed by taking into account that at lower AuNP concentrations the number of additionally produced AMEs are too low for a visible DNA damage, whereas at higher concentrations, the AuNPs could shield the AMEs from a neighboring AuNP and Re-188. With DMSO as radical scavenger, the DNA damage was not completely quenchable.
The Auger–Meitner effect has a very short effective range of ~2 nm3 in vivo and is most effective when directly incorporated into the DNA [66]. Therefore, a nanoparticle not exceeding a diameter of 5 nm could in theory be an effective Auger-emitter in a volume of ~9 nm3 when activated with X-rays [36]. This is a very short range within a cell, which has a typical diameter of 120–200 µm. In vitro fluorescence microscopy confirmed (Figure A16) the accumulation of AuNPs in the cell plasma but not in the nuclei. For this reason, direct DNA damage can be excluded. Due to their behavior, the AuNPs could reach other cell compartments in the cell plasma that are also important for cell life [67]. Auger–Meitner electrons could then damage those compartments and the cell is about to die [56]. This hypothesis was evaluated in the following experiment: First, we carried out in vitro radiosensitizing experiments with AuNP-PEG 1 and AuNP-RGD 7 on A431 cells showing a similar effect as compared with literature data [37,38]. In the CFA experiments (Figure 5), AuNPs 1 and 7 did not have a much higher effect at a dose of 2 Gy compared to reference experiments in absence of AuNPs and had a slightly higher effect at 4 Gy compared to the untreated cells. AuNPs 7 had a higher effect at 6 Gy compared to AuNPs 1. These findings could be explained by a faster accumulation of the targeted AuNPs 7 from the medium into the cell plasma compared to unspecific AuNPs 1 and other AuNP-species [43]. Perhaps bigger AuNPs could produce more Auger electrons or remain within the cells for a longer period of time, thereby allowing a higher effect to be observed. In addition, bigger gold nanorods (AuNRs) functionalized with RGD peptides could be an interesting Auger–Meitner emitter [68].
Initial in vivo experiments with AuNP-RGD-NIR-dye 8 showed a similar tumor accumulation and biodistribution within 72 h as compared to other NIR-dye-functionalized AuNPs [43]. In fluorescence live-imaging the organ-to-muscle ratios were 2.40 ± 0.12 (kidneys), 1.47 ± 0.07 (tumor), and 2.20 ± 0.11 (liver) (Figure A7). In biodistribution experiments, a significantly higher uptake in the tumor was found compared to the muscles (Figure 7). There was a relatively large difference in tumor uptake due to the different growth rate of the tumors. It is known that growing tumors have a high angiogenesis level and therefore a higher αvβ3-integrine expression [47]. Hence, a higher uptake of RGD-functionalized AuNPs in a fast-growing tumor is explainable.

5. Conclusions

These initial results prove that the dually modified particles show potential as imaging tools for αvβ3-expressing tumors in vivo via optical imaging. Especially for long-term observations of in vivo processes, the AuNPs could be useful. Since their accumulation is from slower nature (>1 d), the AuNPs cannot be used for short-term investigations such as Ga-68-PET. Further, the AuNPs could also serve as a tool for characterization of cell cycles and behavior by confocal fluorescence microscopy or live-cell microscopy. Interestingly, different modifications lead to different cell answer such as vesiculation and excretion. In vitro experiments for the assessment of the radiosensitizing ability of the AuNPs showed limited effects for the ultra-small AuNPs. However, in vivo, a major amount of AuNPs is excreted very fast renally. The rest of AuNPs accumulate in target organs and have a high retention there. Therefore, these AuNPs could serve as tool for radiotherapy as radiosensitizer or as activated [198Au]AuNPs. Further in vivo experiments for the determination of radiosensitizing effects for bigger AuNPs and AuNRs and also for [198Au]AuNPs are underway.

Author Contributions

Conceptualization, M.P. and B.W.; methodology, M.P., V.v.K., and R.R.; software, R.F.; validation, M.P. and V.v.K.; formal analysis, R.R.; investigation, G.D. and R.H.; resources, B.W.; data curation, V.v.K.; writing—original draft preparation, M.P.; writing—review and editing, M.P., V.v.K., R.R., R.S., and C.W.; visualization, M.P.; supervision, B.W.; project administration, M.P. and B.W.; funding acquisition, M.P., C.W., and B.W. All authors have read and agreed to the published version of the manuscript.

Funding

This research was funded by Research Campus M2OLIE funded by the German Federal Ministry of Education and Research (BMBF) within the Framework “Forschungscampus: public-private partnership for Innovations”, Funding Codes 13GW0091B, 13GW0091E, 13GW0388A and 13GW0389B.

Institutional Review Board Statement

The study was conducted according to the guideline 2010/63/EU of European parliament, and approved by the regional board Karlsruhe - Referat 35 – Karlsruhe, Germany (approval number 35-9185.81/G-206/15, date 06.10.2015).

Informed Consent Statement

Not applicable.

Data Availability Statement

The data presented in this study are available on request from the corresponding author. The data are not publicly available due to institutional data protection.

Acknowledgments

The authors are grateful to Kerstin Wetzig and Katja Tietze for her excellent technical assistance during radiosensitizing experiments. We like to thank Karsten Richter from the German Cancer Research Center (DKFZ) for measuring the EM in the Central Unit Electron Microscopy. We also want to thank Ulrich Scherer for using the TGA and Thorsten Röder for using the DLS at Mannheim University of Applied Sciences. Moreover, the authors would like to thank Jörg Kotzerke for fruitful discussions throughout the radiosensitizing experiments. Moreover, the authors would like to thank Trina Irico for the extensive proofreading of the manuscript.

Conflicts of Interest

The authors declare no conflict of interest.

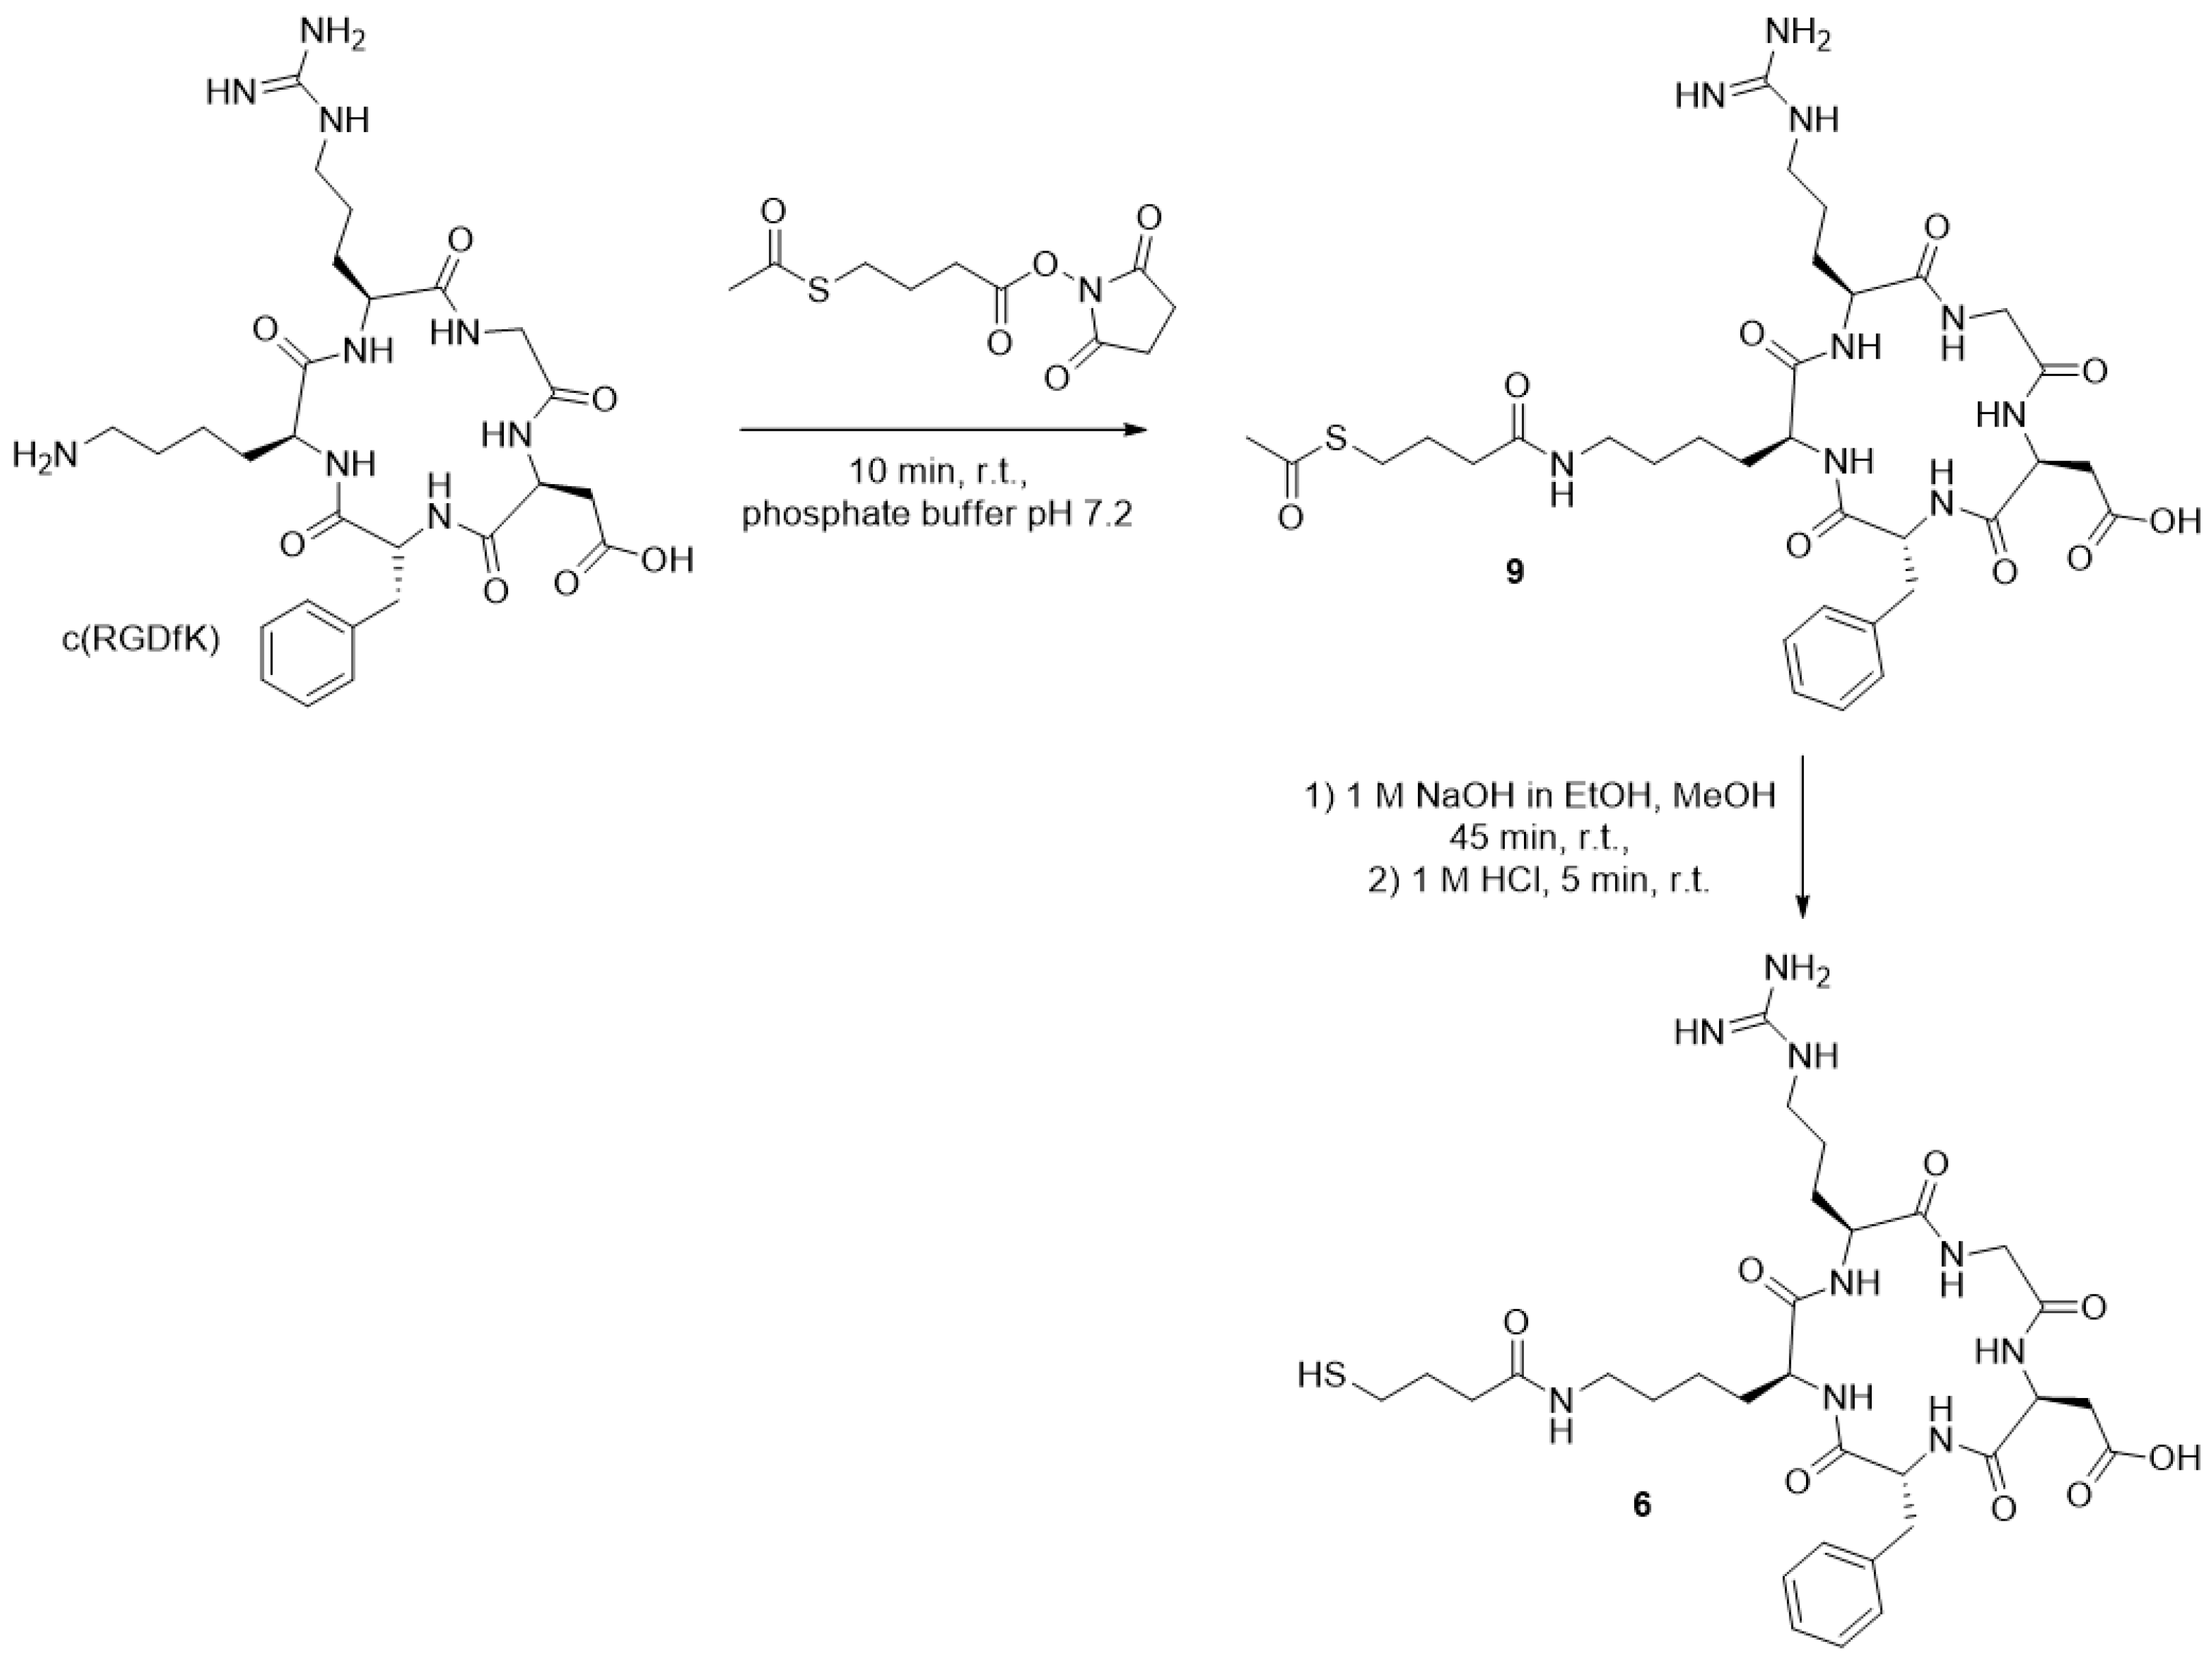
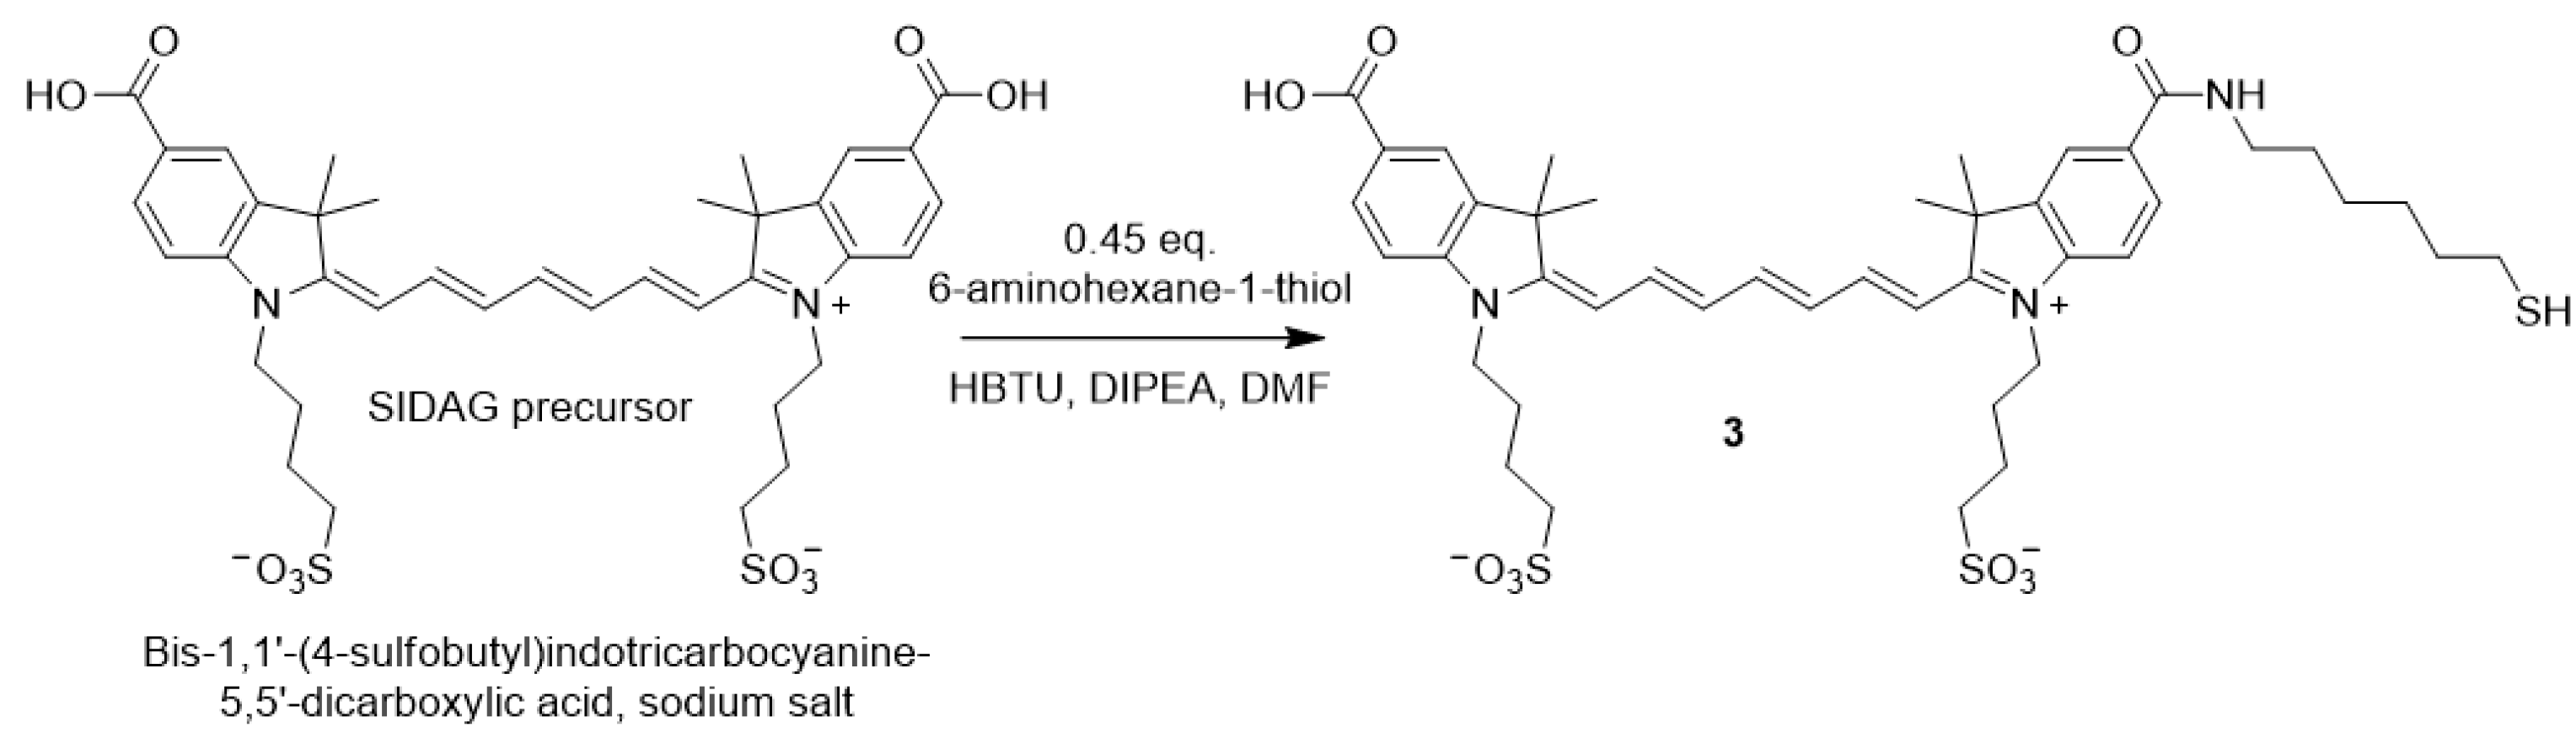
Appendix A. Organic Syntheses

c(RGDfK) peptide: The cyclic pentapeptide c(RGDfK) was synthesized in 0.2 mmol scale by solid-phase peptide synthesis on solid support using the standard Fmoc strategy on 250 mg H-Asp(tBu)-2-chlortrityl-resin (loading: 0.8 mmol/g). For amino acid conjugation, 3.9 eq. HBTU (N,N,N’,N’-tetramethyl-O-(1H-benzotriazol-1-yl)uronium hexafluorophosphate), 4.0 eq. of Fmoc-protected amino acids, and 4.0 eq. of DIPEA were used in DMF as solvent. Coupling times were 30 min for each amino acid. After coupling of the last amino acid and Fmoc removal, the linear, protected peptide was cleaved from the resin using 1% TFA in CH2Cl2. The crude intermediate was isolated by evaporation of the volatile components of the mixture and then dissolved in dry DMF (120 mL). To this solution, DIPEA (64 µL, 0.70 mmol, 3.5 eq.) was added and the solution was cooled to 0–4 °C before DPPA (44 µL, 0.25 mmol, 1.25 eq.) was added. The mixture was allowed to warm to ambient temperature and reacted for 96 h until the cyclization was complete. The volatile components of the mixture were removed in vacuo, relyophilized in acetonitrile:water 1:1, and the residue was treated for 3 h with a mixture of TFA/TIS (triisopropylsilane) 97.5:2.5 (5 mL) to completely deprotect the peptide. After concentration in vacuo and precipitation of the product in cooled diethyl ether (25 mL), the crude product was obtained by centrifugation, washing with Et2O (5 mL) twice, and drying of the obtained solid. Purification of the product was performed by semi-preparative HPLC (tR = 3.75 min; gradient: 0–10% MeCN in H2O with 0.1% formic acid in 6 min at 4 mL/min). The product was obtained after lyophilization as a colorless solid in 67% overall yield (81 mg, 134 mmol). MALDI-MS (calculated): m/z = 604.02 [M + H]+ (603.31), 626.32 [M + Na]+ (626.30), 642.45 [M + K]+ (642.28). Analytic HPLC: tR = 1.61 min.
Thio-acetate-modified c(RGDfK) derivative 9 (Figure A1): To a solution of c(RGDfK) (5.6 mg, 9.28 µmol) in 0.15 M Sørensen phosphate buffer (0.5 mL, pH 7.2), a solution of 2,5-dioxopyrrolidin-1-yl-4-(acetylthio)butanoate (2.53 mg, 9.74 µmol) in MeCN:buffer v:v = 1:1 (0.3 mL) was added. After stirring the reaction mixture for 10 min at ambient temperature, the reaction was completed. The product was purified by semipreparative HPLC and obtained after lyophilization as a colorless solid with 85% yield (5.9 mg, 7.89 µmol). MALDI-MS (calculated): m/z = 748.06 [M + H]+ (747.34), 778.06 [M + Na]+, 786.07 [M + K]+. Analytic HPLC: tR = 1.71 min.
Thiol-modified c(RGDfK) derivative 6 (Figure A1): To a solution of 9 (5.7 mg, 7.63 µmol) in dry MeOH (2.5 mL), a solution of 1 M NaOH in EtOH (7.63 µL) was added. After 45 min reaction at ambient temperature, 1 M HCl (19.83 µL) was added, and the reaction was completed after 5 min at ambient temperature. H2O (2.5 mL) was added for quenching and the product was lyophilized to generate the stable thiol 6 as a colorless solid with 84% yield (4.5 mg, 6.41 µmol). MALDI-MS (calculated): m/z = 706.18 [M + H]+ (705.33), 728.19 [M + Na]+, 748.26 [M + K]+. Analytic HPLC: tR = 1.63 min.
Figure A1. Synthesis of thiol-modified c(RGDfK) 6.
Nanomaterials 11 00138 g0a1
Thiol-hexyl-cyanine 3 (Figure A2): Bis-1,1′-(4-sulfobutyl)indotricarbocyanine-5,5′-dicarboxylic acid sodium salt (SIDAG precursor) (50 mg, 68 µmol, Chess, Mannheim) was dissolved in DMF (6 mL). Thiol-functionalization was performed according to Licha et al. [69]. In brief, HBTU (10.2 mg, 27 µmol) and 6-aminohexane-1-thiol 5.3 mg, 31 µmol) were added and the solution was cooled to 0 °C. Then, DIPEA (18 µL, 102 µmol) was added and the reaction was stirred for 3 h at ambient temperature in the dark. Et2O (50 mL) was added to the solution and centrifuged. The Et2O was decanted and the residue was washed 3 × with Et2O, dried, and stored at −20 °C. The resulting green powder (54 mg) was used without further purification. The successful conjugation of 6-aminohexane-1-thiol was verified by Ellmans reagent and comparison of UV/Vis spectra at 412 nm. The purity was verified by HPLC (>80%). MALDI-MS (calculated): m/z = 856.066 [M + H]+ (855.11).
Figure A2. Cyanine derivative (SIDAG precursor [49]) and thiol-functionalized derivative 3 for coupling reactions via Michael addition.
Nanomaterials 11 00138 g0a2
General procedure to prepare PEGylated AuNP 1: Briefly, hydrogen tetrachloroaurate(III) trihydrate (560 mg, 1.44 mmol, ≥99.9% trace metal basis) was dissolved in 30 mL of tracepure water resulting in a bright yellow solution and then extracted by mixing with 300 mL of a tetraoctylammonium bromide (TOABr, 1011 mg, 1.85 mmol) toluene solution. The contents were stirred vigorously for 20 min at room temperature to facilitate the phase transfer of the Au(III) into the toluene layer, which resulted in the organic layer turning to a dark orange color and the aqueous layer becoming clear colorless. If the aqueous layer was not colorless, further TOABr (50 mg, 0.09 mmol) and toluene (100 mL) were added. After complete phase transfer, the aqueous layer was removed. The organic layer was dried with MgSO4 and filtered to remove excess of water. The solution was cooled to 0 °C in an ice bath. Then, 2.7 eq. of freshly prepared HO-PEG3-thiol (640 mg, 3.85 mmol) in 20 mL of dichloromethane was added and allowed to stir until the orange solution faded to colorless (~1 h). A fresh solution of tetrabutylammonium borohydride (TBABH) (3659 mg, 14.22 mmol) in 20 mL dichloromethane was then added to the rapidly stirring toluene solution over 5 s. The solution turned dark black instantly. The PEG-AuNP 1 started to precipitate from toluene after 1 h. After stirring the mixture for 16 h from 0 °C to 20 °C, 50 mL of tracepure water were added under slow stirring to extract the PEGylated AuNPs for 120 min. The organic layer was decanted, and the aqueous layer was washed alternatingly with 3 × 50 mL toluene/5 mL MeCN and 3 × 50 mL toluene/5 mL isopropanol. The black aqueous layer was transferred into a visking cellulose dialysis tube (molecular cut-off 14000 Da) with 3 × 10 mL tracepure water, and dialysis was performed in 3 × 10 L of distilled water for 1 h, 2.5 h, and 16 h. Afterwards, the AuNP 1 was lyophilized to yield 407 mg (44%) of black powder. These PEGylated AuNPs are relatively small (3.0 ± 2.0 nm), exhibit excellent stability, and can be repeatedly dried and dissolved in water.
General procedure for the preparation of furan-protected maleimide AuNP 2a: The preparation of AuNP 2a was performed by a place-exchange reaction of a freshly prepared furan-masked maleimide-PEG-thiol ligand with the PEGylated AuNPs. Maleimide-PEG-thiol ligand (120 mg, 0.34 mmol) was dissolved in 6 mL 1:1 tracepure H2O:MeOH and was added to PEG-AuNP 1 (300 mg) in 30 mL tracepure H2O and stirred for 90 min. A 1:1 mole ratio of maleimide ligand to PEG ligand is crucial. The mixed ligand AuNP 2a sample was then purified by dialysis. Yield: 313 mg (99%).
General procedure of the Michael addition reaction: 20 mg of AuNP 2a were dissolved in dry DMSO (3 mL) under argon atmosphere and stirred for 2 h at 95 °C to remove the furan-protecting group. Afterwards, the resulting AuNP 2b solution was cooled to below 30 °C and 1 mg of thiol-functionalized c(RGDfK) peptide ligand 6 in dry DMSO (0.5 mL) was added under argon atmosphere. After 1 h at ambient temperature, 0.5 mg of dye-thiol 3 (0.58 µmol) in dry DMSO (0.5 mL) were added (Figure A2), and the mixture was stirred for 1 h. Then, tracepure water (26 mL) was added (>13% DMSO in water) and dialysis was performed against 10 L distilled water for 16 h. Afterwards, the resulting AuNPs were lyophilized.

Appendix B. Characterization of AuNPs

Following the protocol from Zhu et al. [42] we used their formula to calculate the amount of gold atoms per nanoparticle. Since our nanoparticles have a mean diameter of ~3.5 nm, the calculated amount of gold atoms is ~1325 Au atoms per nanoparticle. This accounts for a molecular weight of Au 260,980 g/mol. Using TGA we found a mass loss for AuNP 2a corresponding to a molecular weight of 360,611 g/mol with 370 PEG3-OH ligands and 130 PEG4-maleimide ligands.

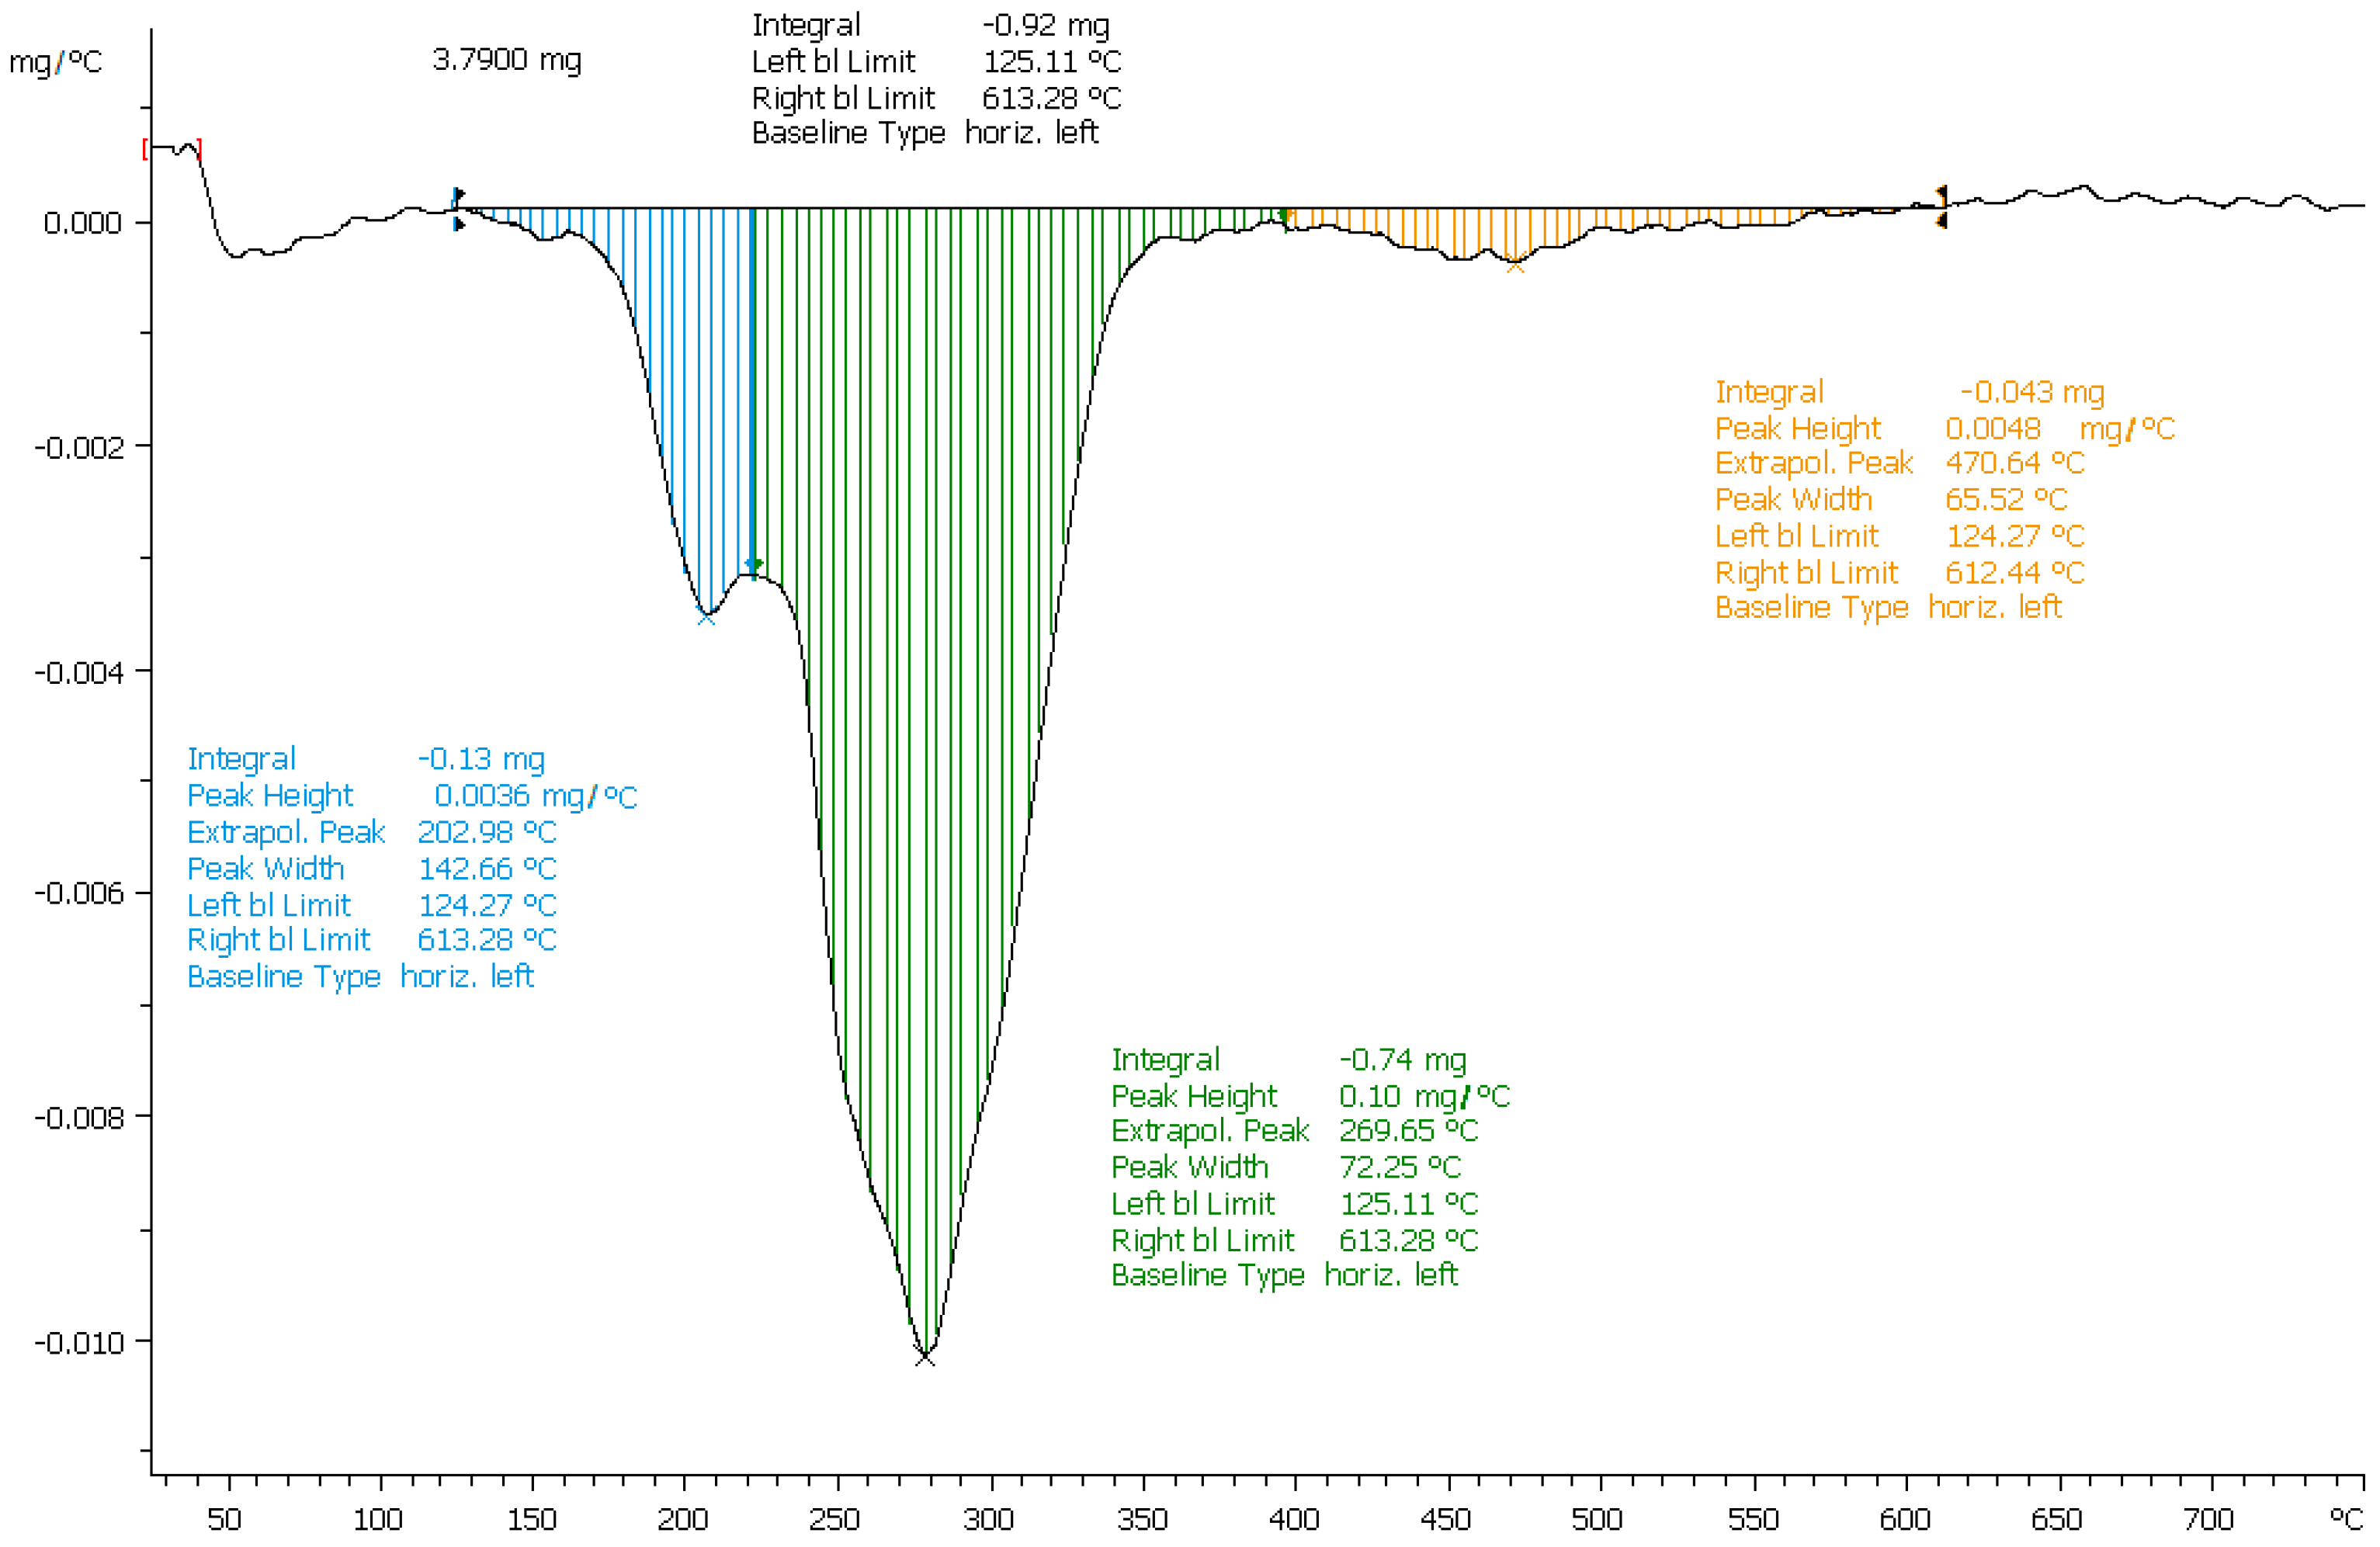
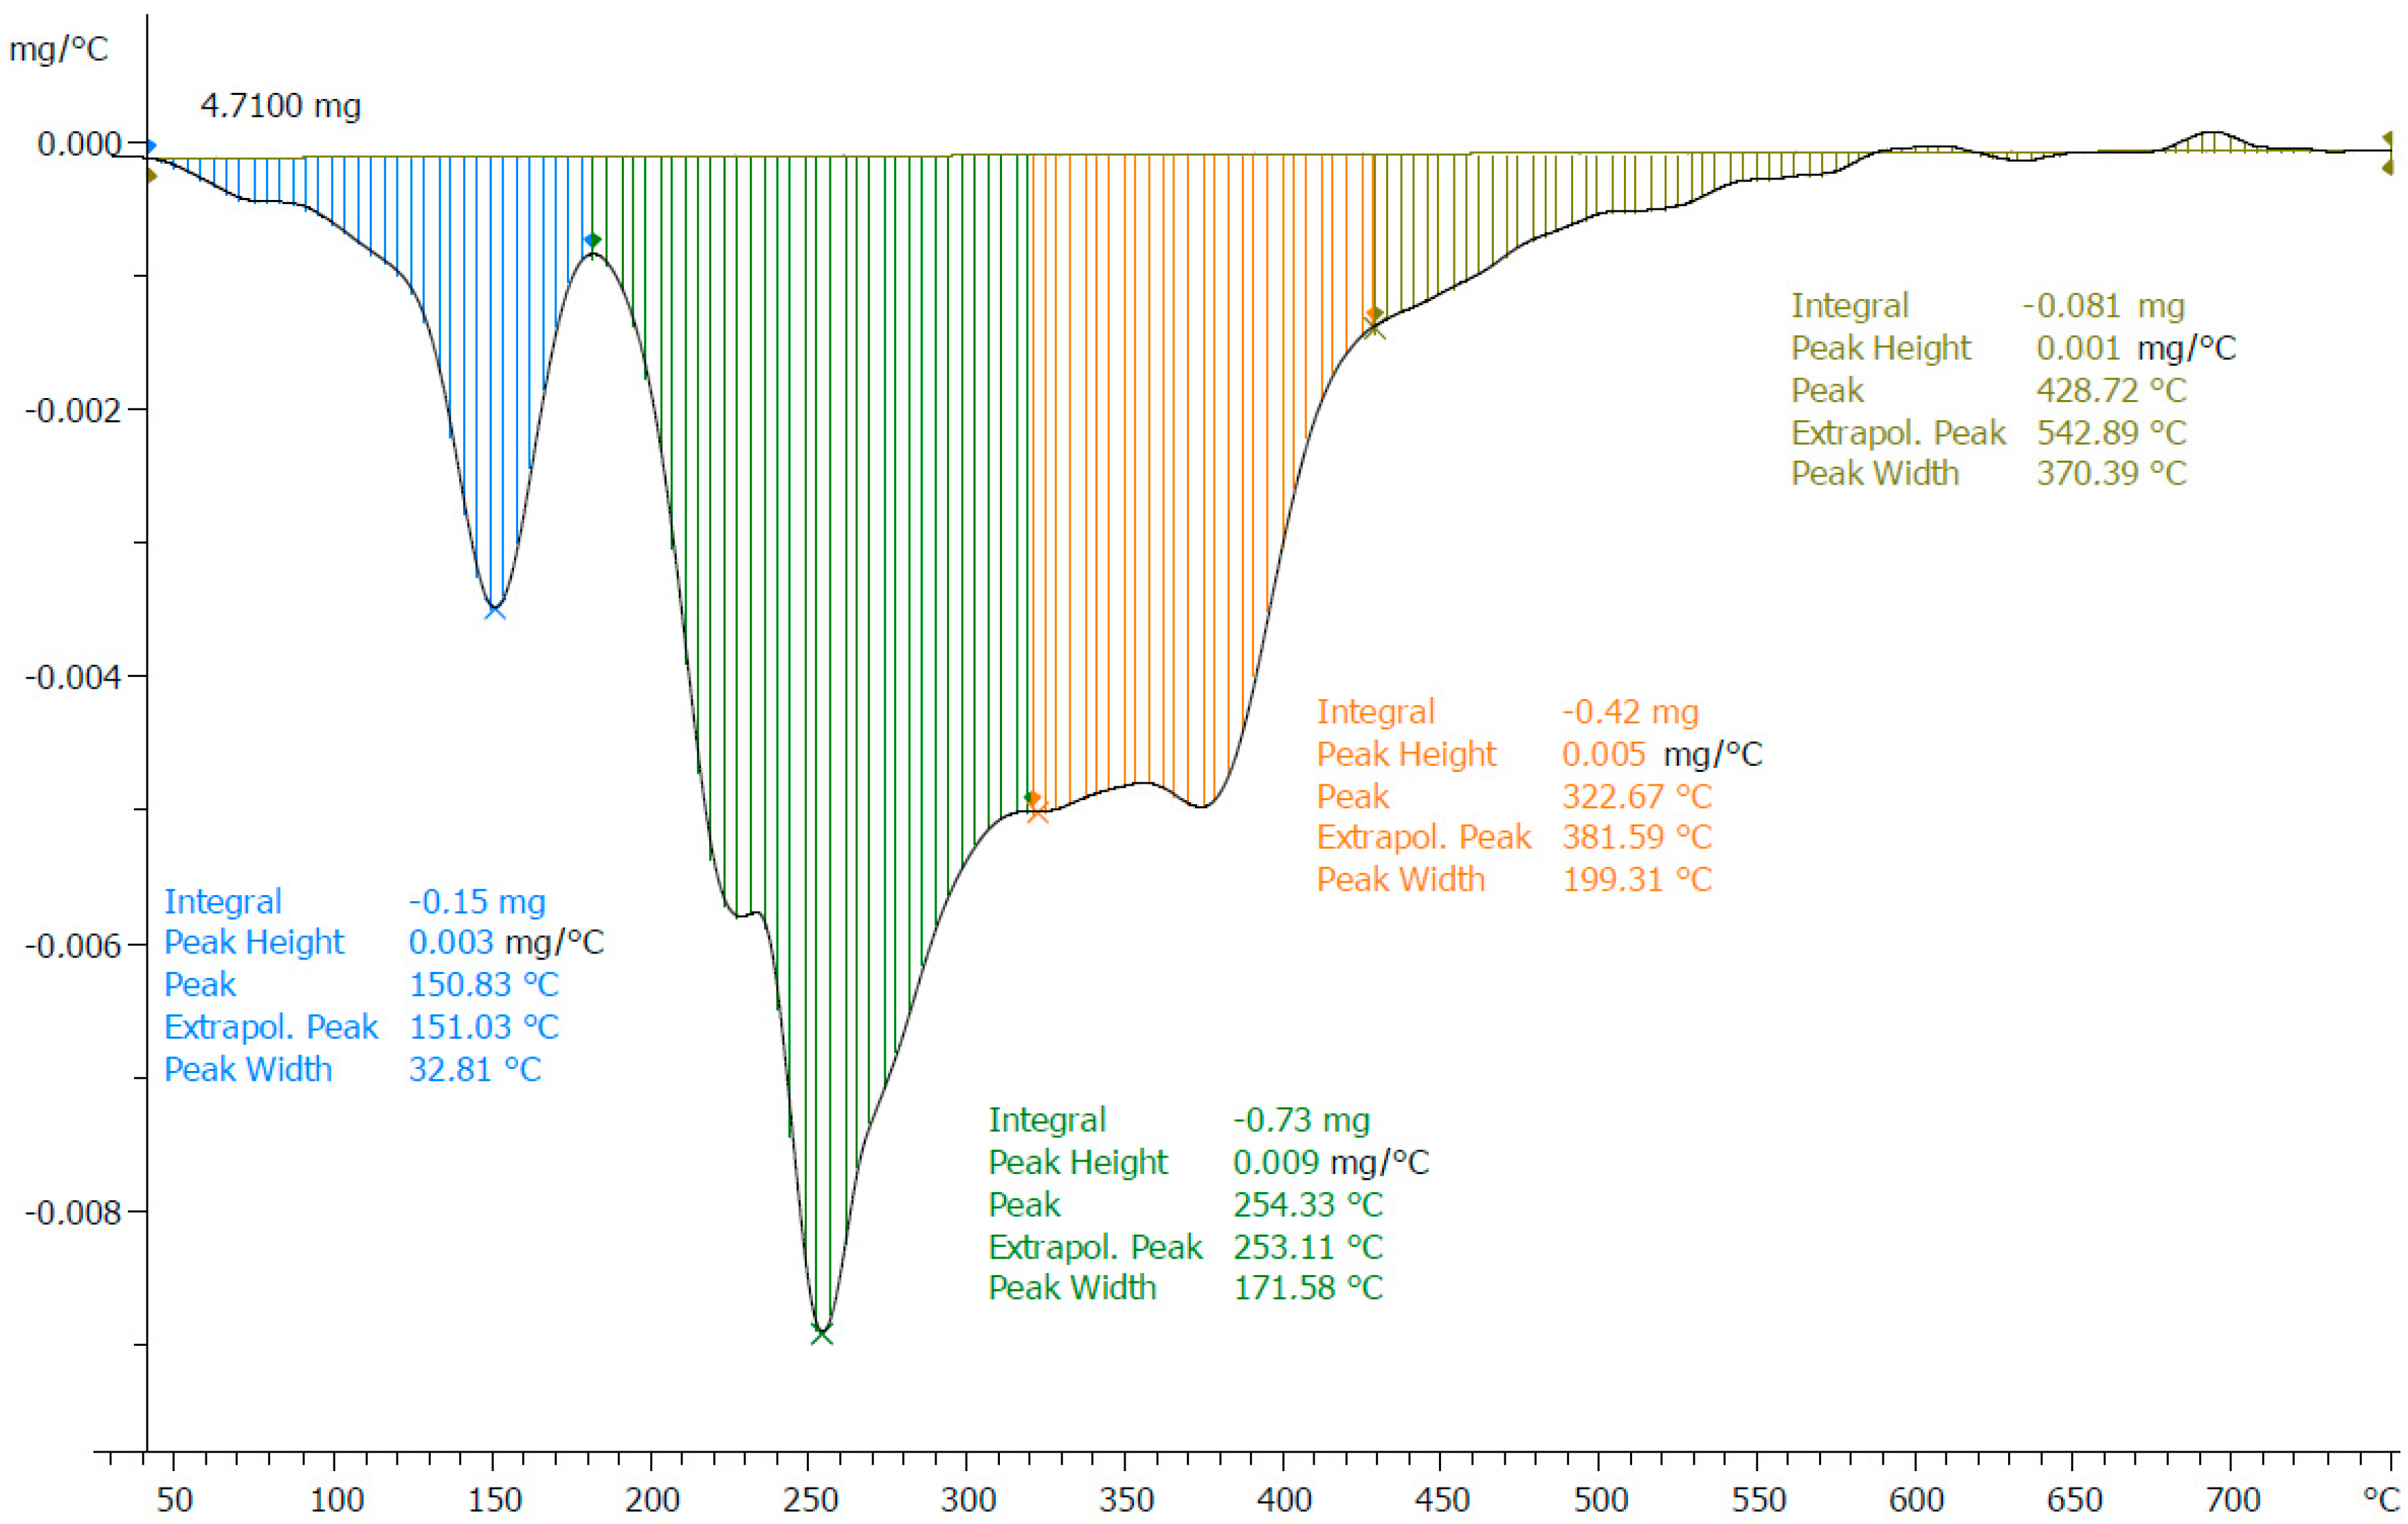
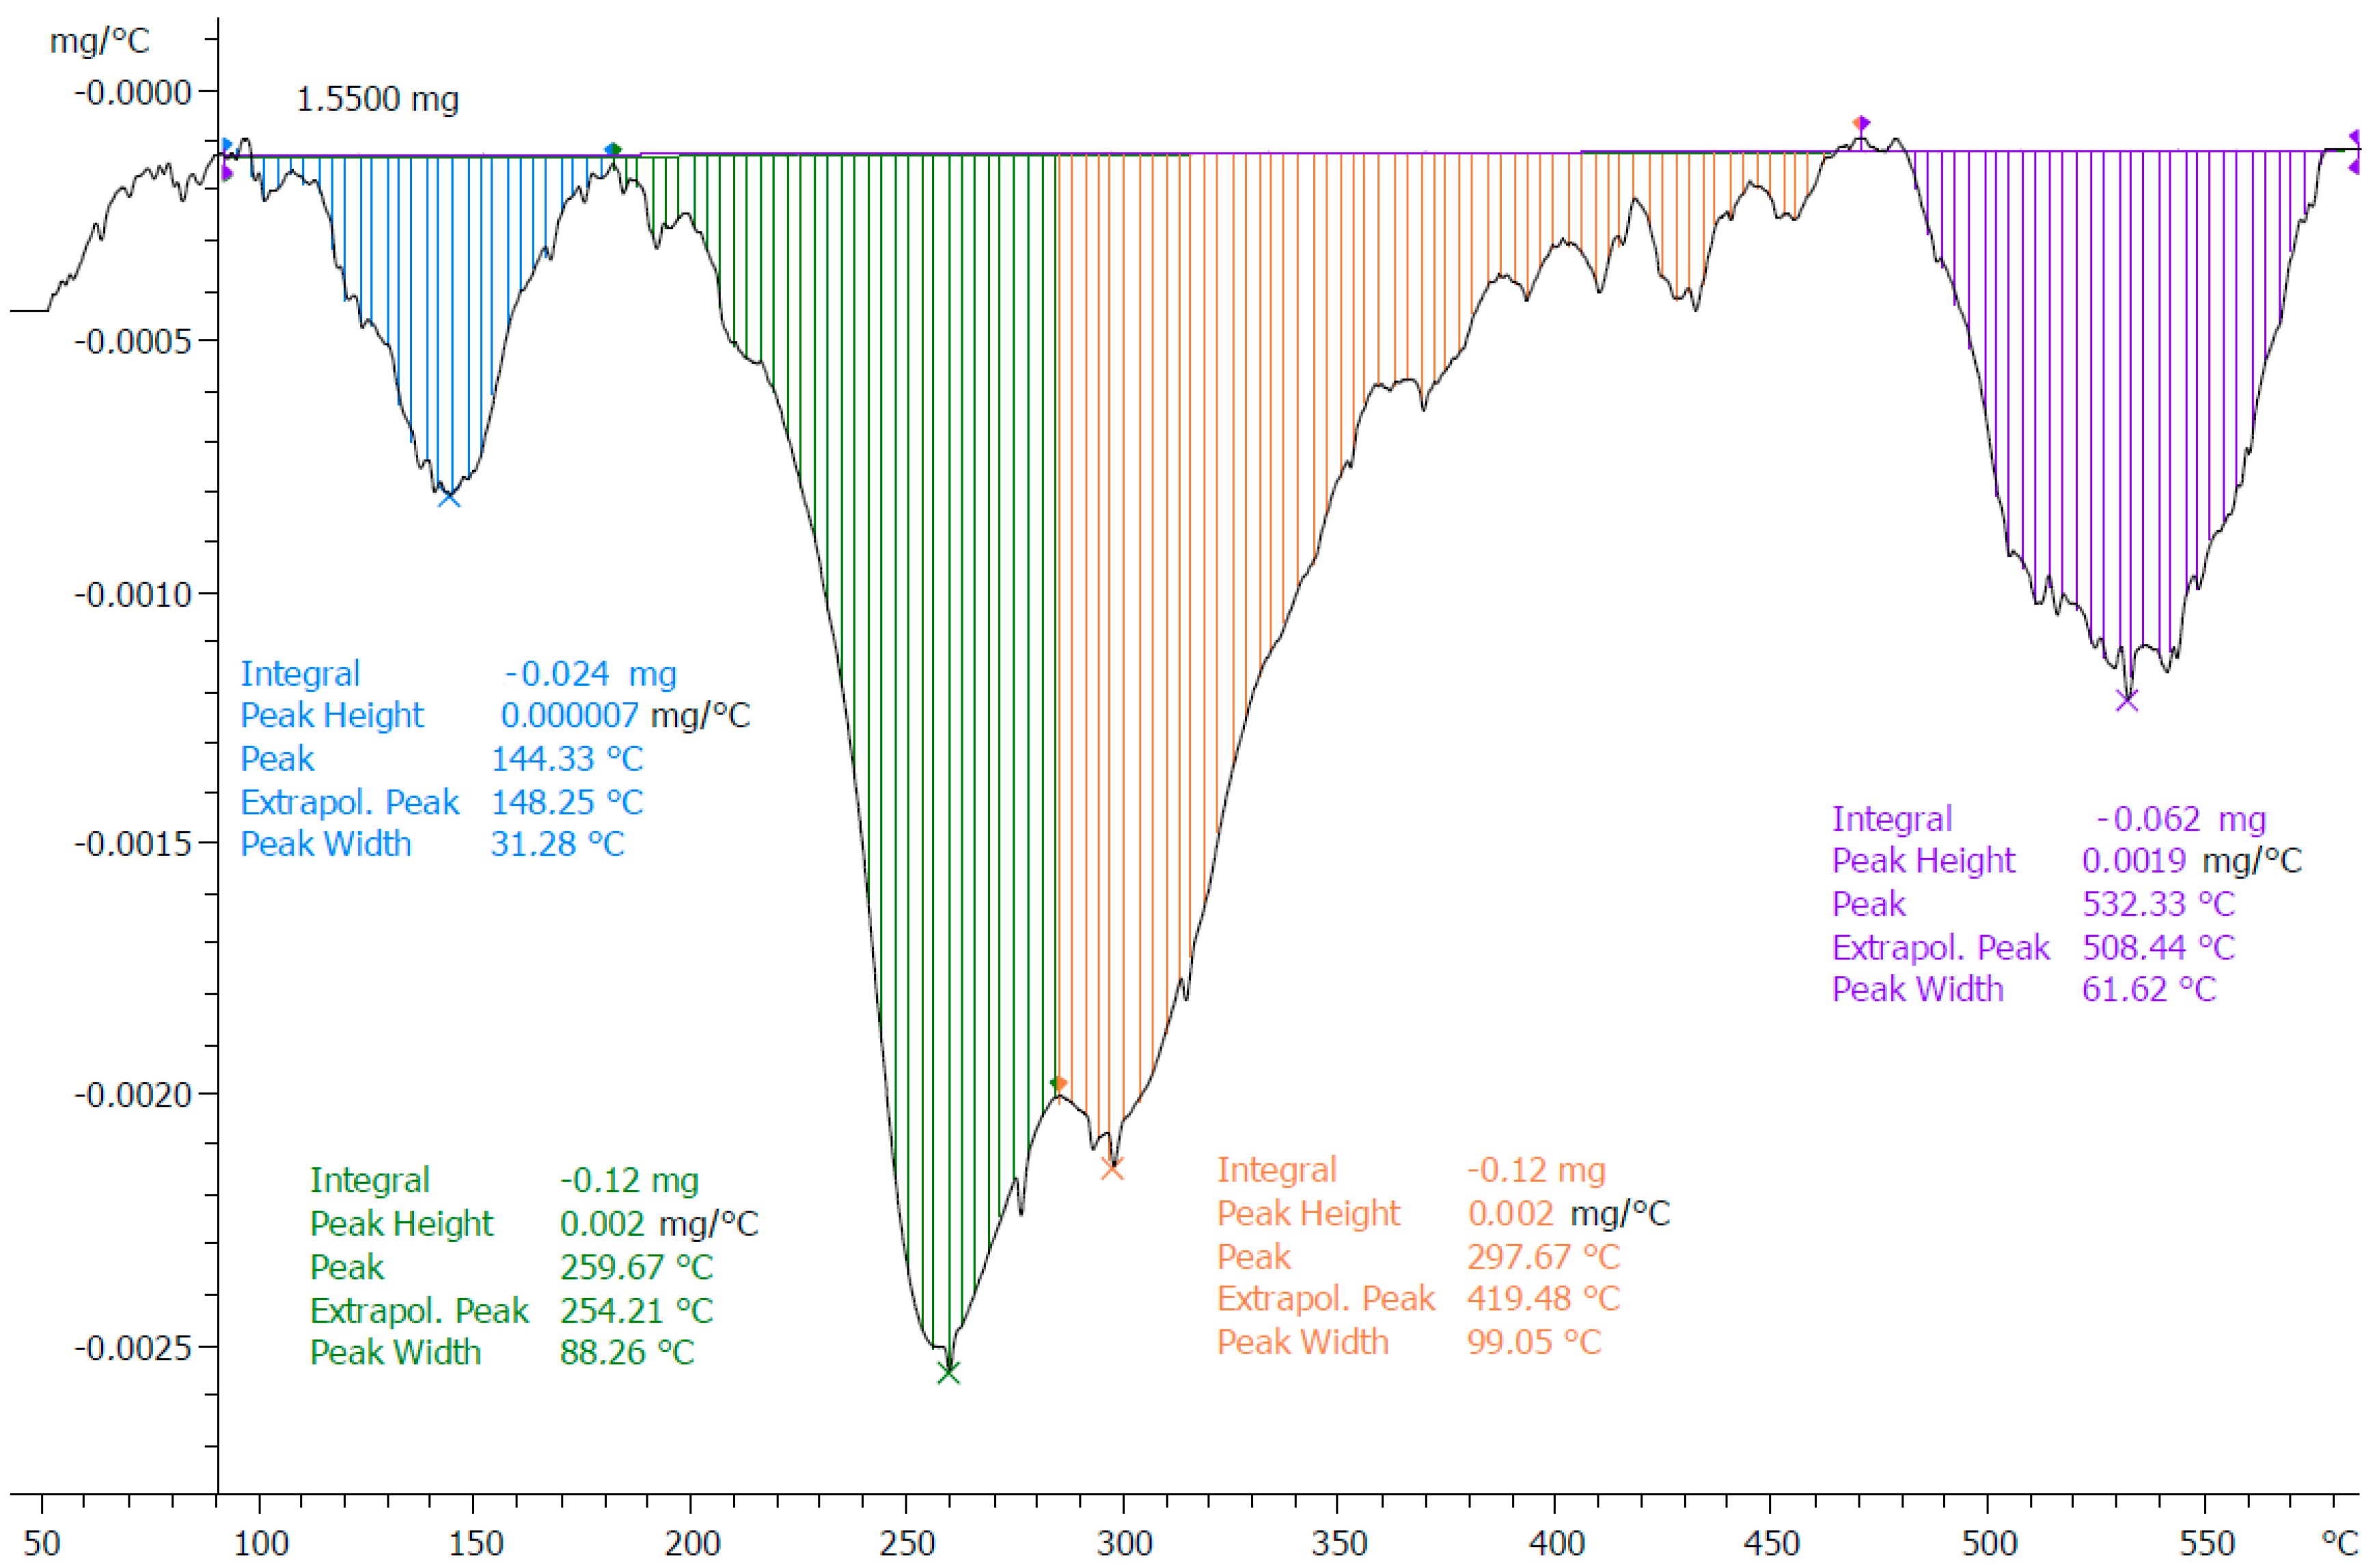
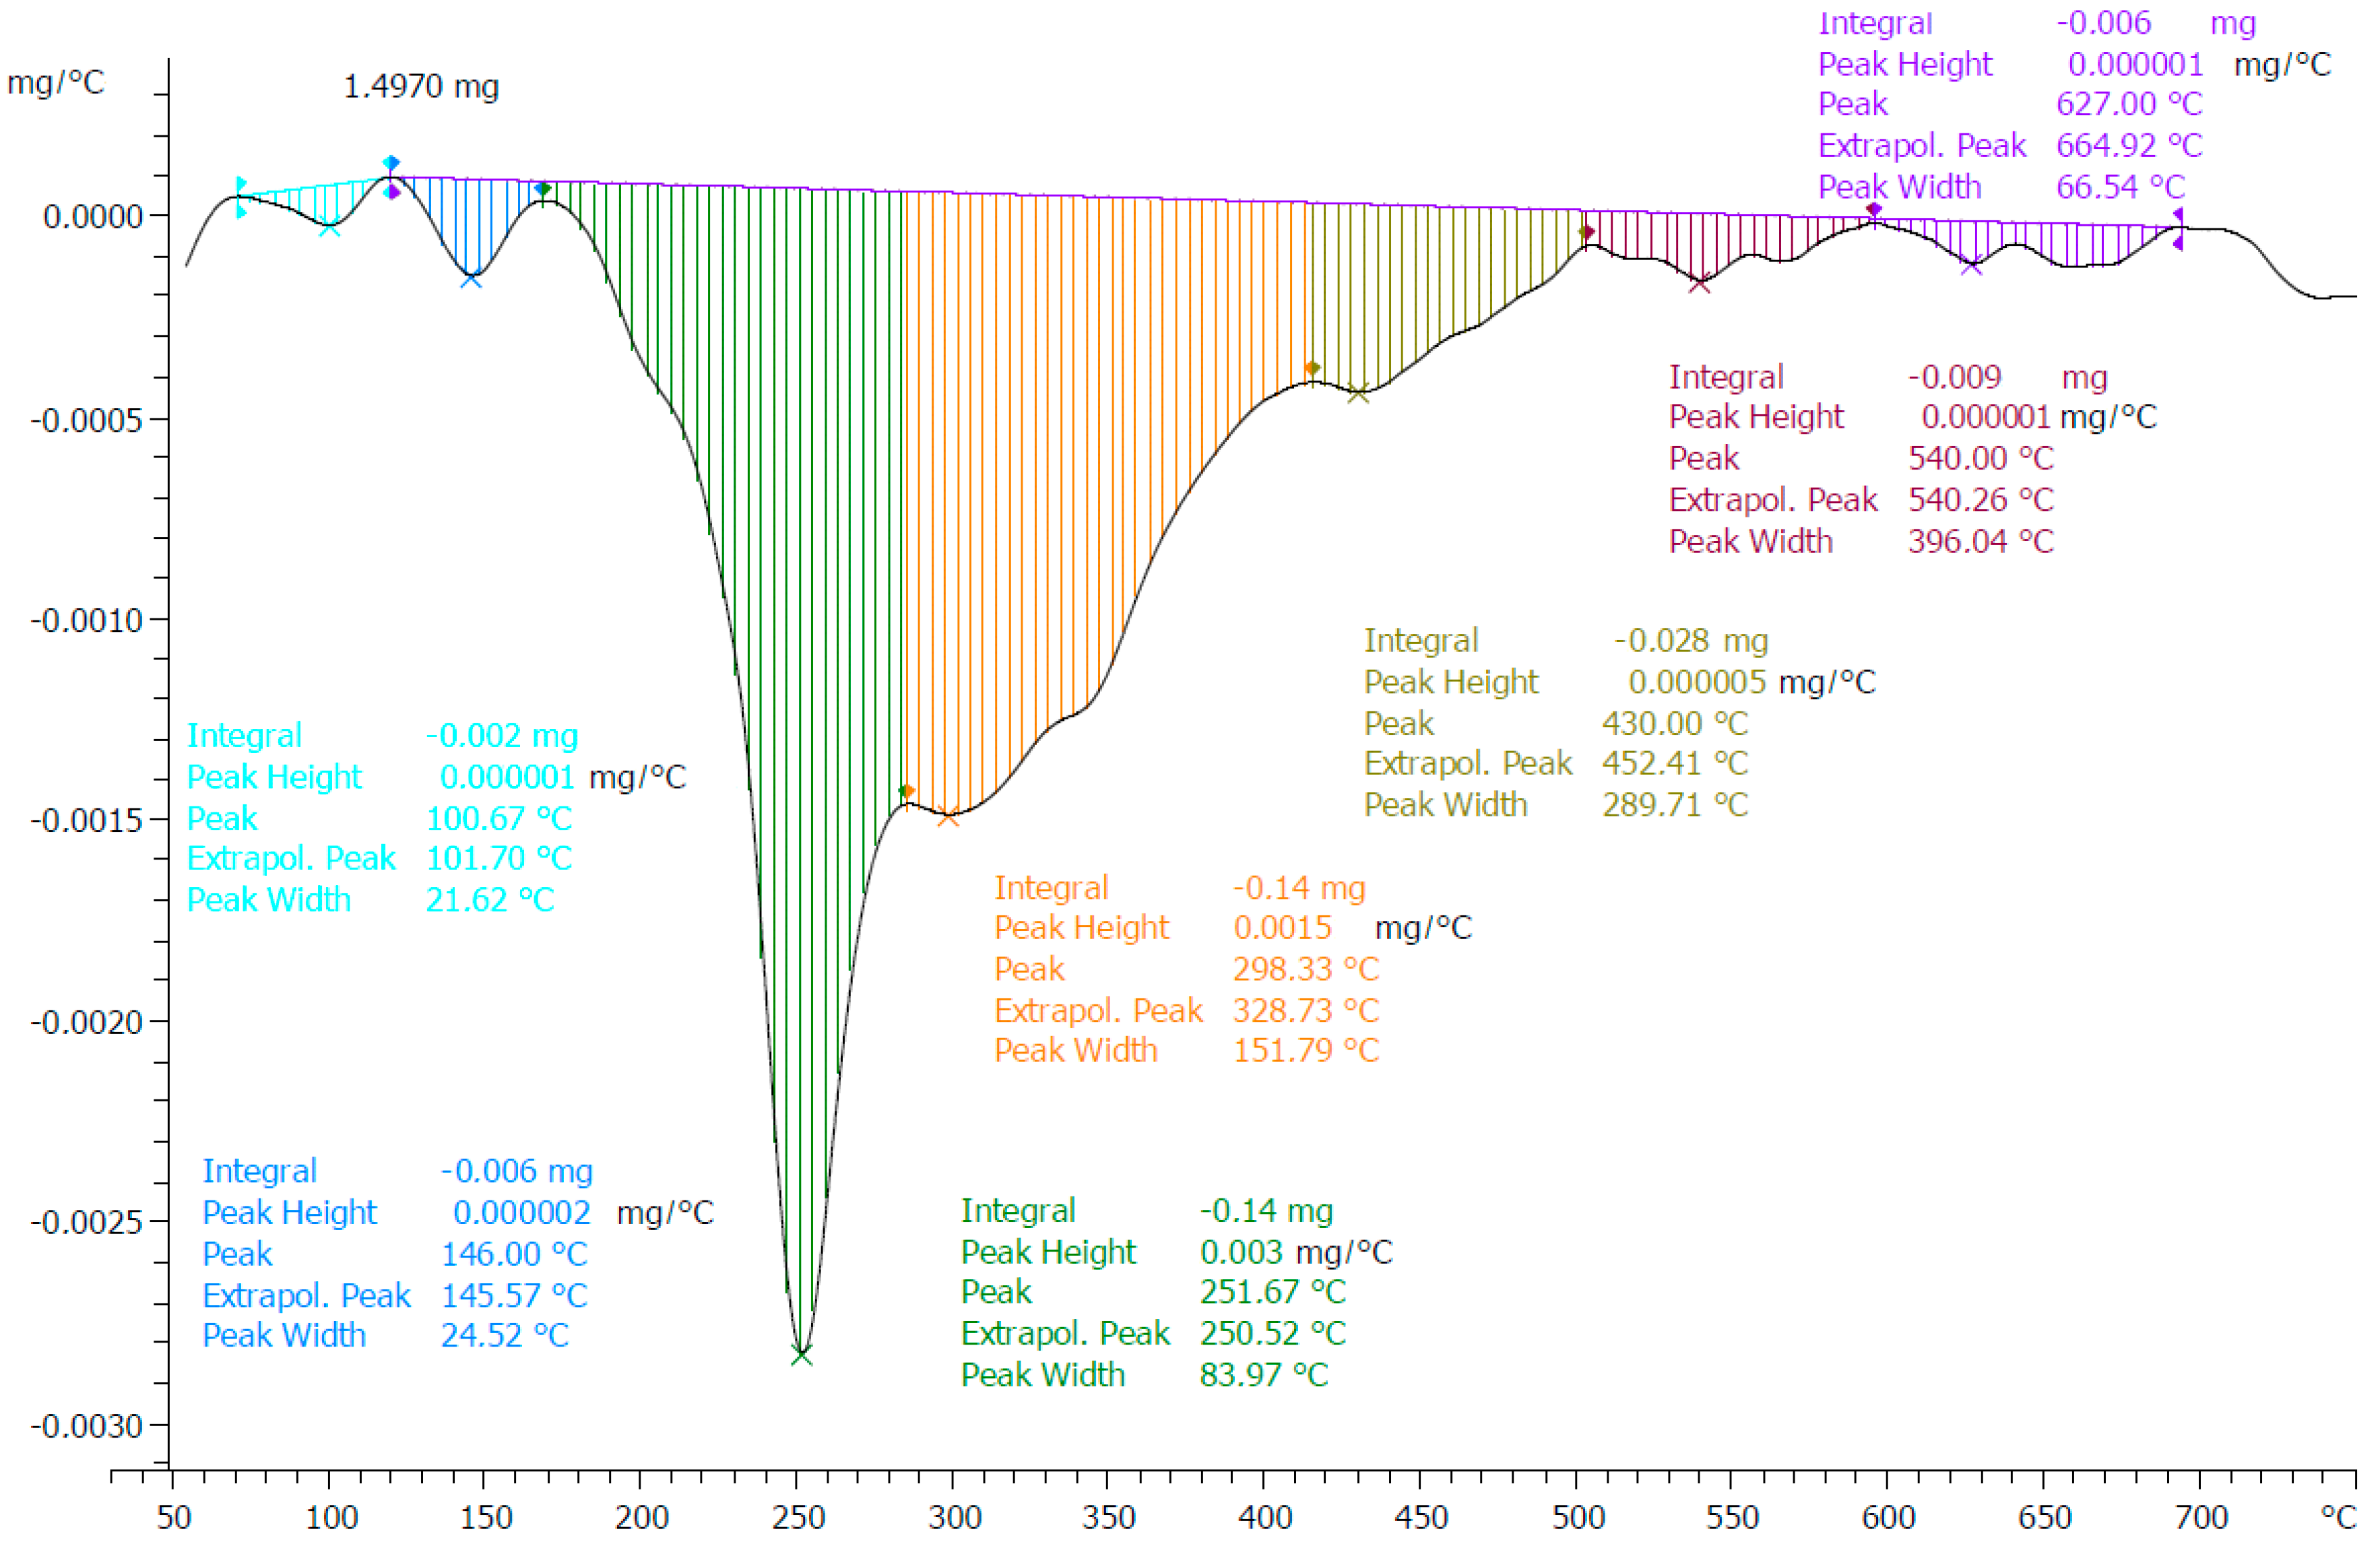
Appendix B.1. Determination of the Quantity of Ligands on the Surface of the AuNPs via Thermogravimetric Analysis

The thermogravimetric analyses were performed with a Mettler Toledo TGA/SDTA851e. AuNPs (2–5 mg) were weighed into 70-µL-aluminum oxide crucibles (Mettler Toledo, Gießen, Germany) and heated from 25–750 °C (10 K/min) in a N2 or CO2 stream (30 mL/min). The loading of the different AuNPs is shown in Table 1 and was calculated by the different mass losses, which increase the more the AuNPs are functionalized. Therefore, the quantity of the different ligands per particle can be calculated.
  • The mass loss of the AuNP-PEG 1 was 24.27%. This accounts for ~500 PEG ligands at the AuNP surface. M ~ 345 kDA.
  • The mass loss of AuNP-PEG-maleimide 2a was 29.32%. The difference of 5.02% accounts for ~130 PEG-maleimide ligands. M~361 kDa.
  • The mass loss of AuNP-RGD 7 was 27.89% and the RGD accounts for 5.91% mass loss (60 RGD ligands per AuNP). Hence, we can calculate the molar mass for example for AuNP-RGD 7 to be ~405 kDa.
  • Further, the AuNP-RGD-NIR-dye 8 contained around 10 NIR-dye ligands.
Figure A3. AuNP-PEG 1 with mass loss of ~24.27%.
Nanomaterials 11 00138 g0a3
Figure A4. AuNP-maleimide 2a with mass loss of 29.32%. Furan-PG (blue) is responsible for 3.18% mass loss. Maleimide-PEG4 accounts for a mass loss of 5% and 25% weight percent of all ligands.
Nanomaterials 11 00138 g0a4
Figure A5. AuNP-RGD 7 with mass loss of 27.89%. Furan-PG (blue) is left with 2.11% mass loss. Instead, the RGD-ligands (purple) are responsible for 5.91% mass loss.
Nanomaterials 11 00138 g0a5
Figure A6. AuNP-RGD-NIR-dye 8 with mass loss of ~22.17%. The NIR-dye-ligands accounts for 0.46% mass loss.
Nanomaterials 11 00138 g0a6

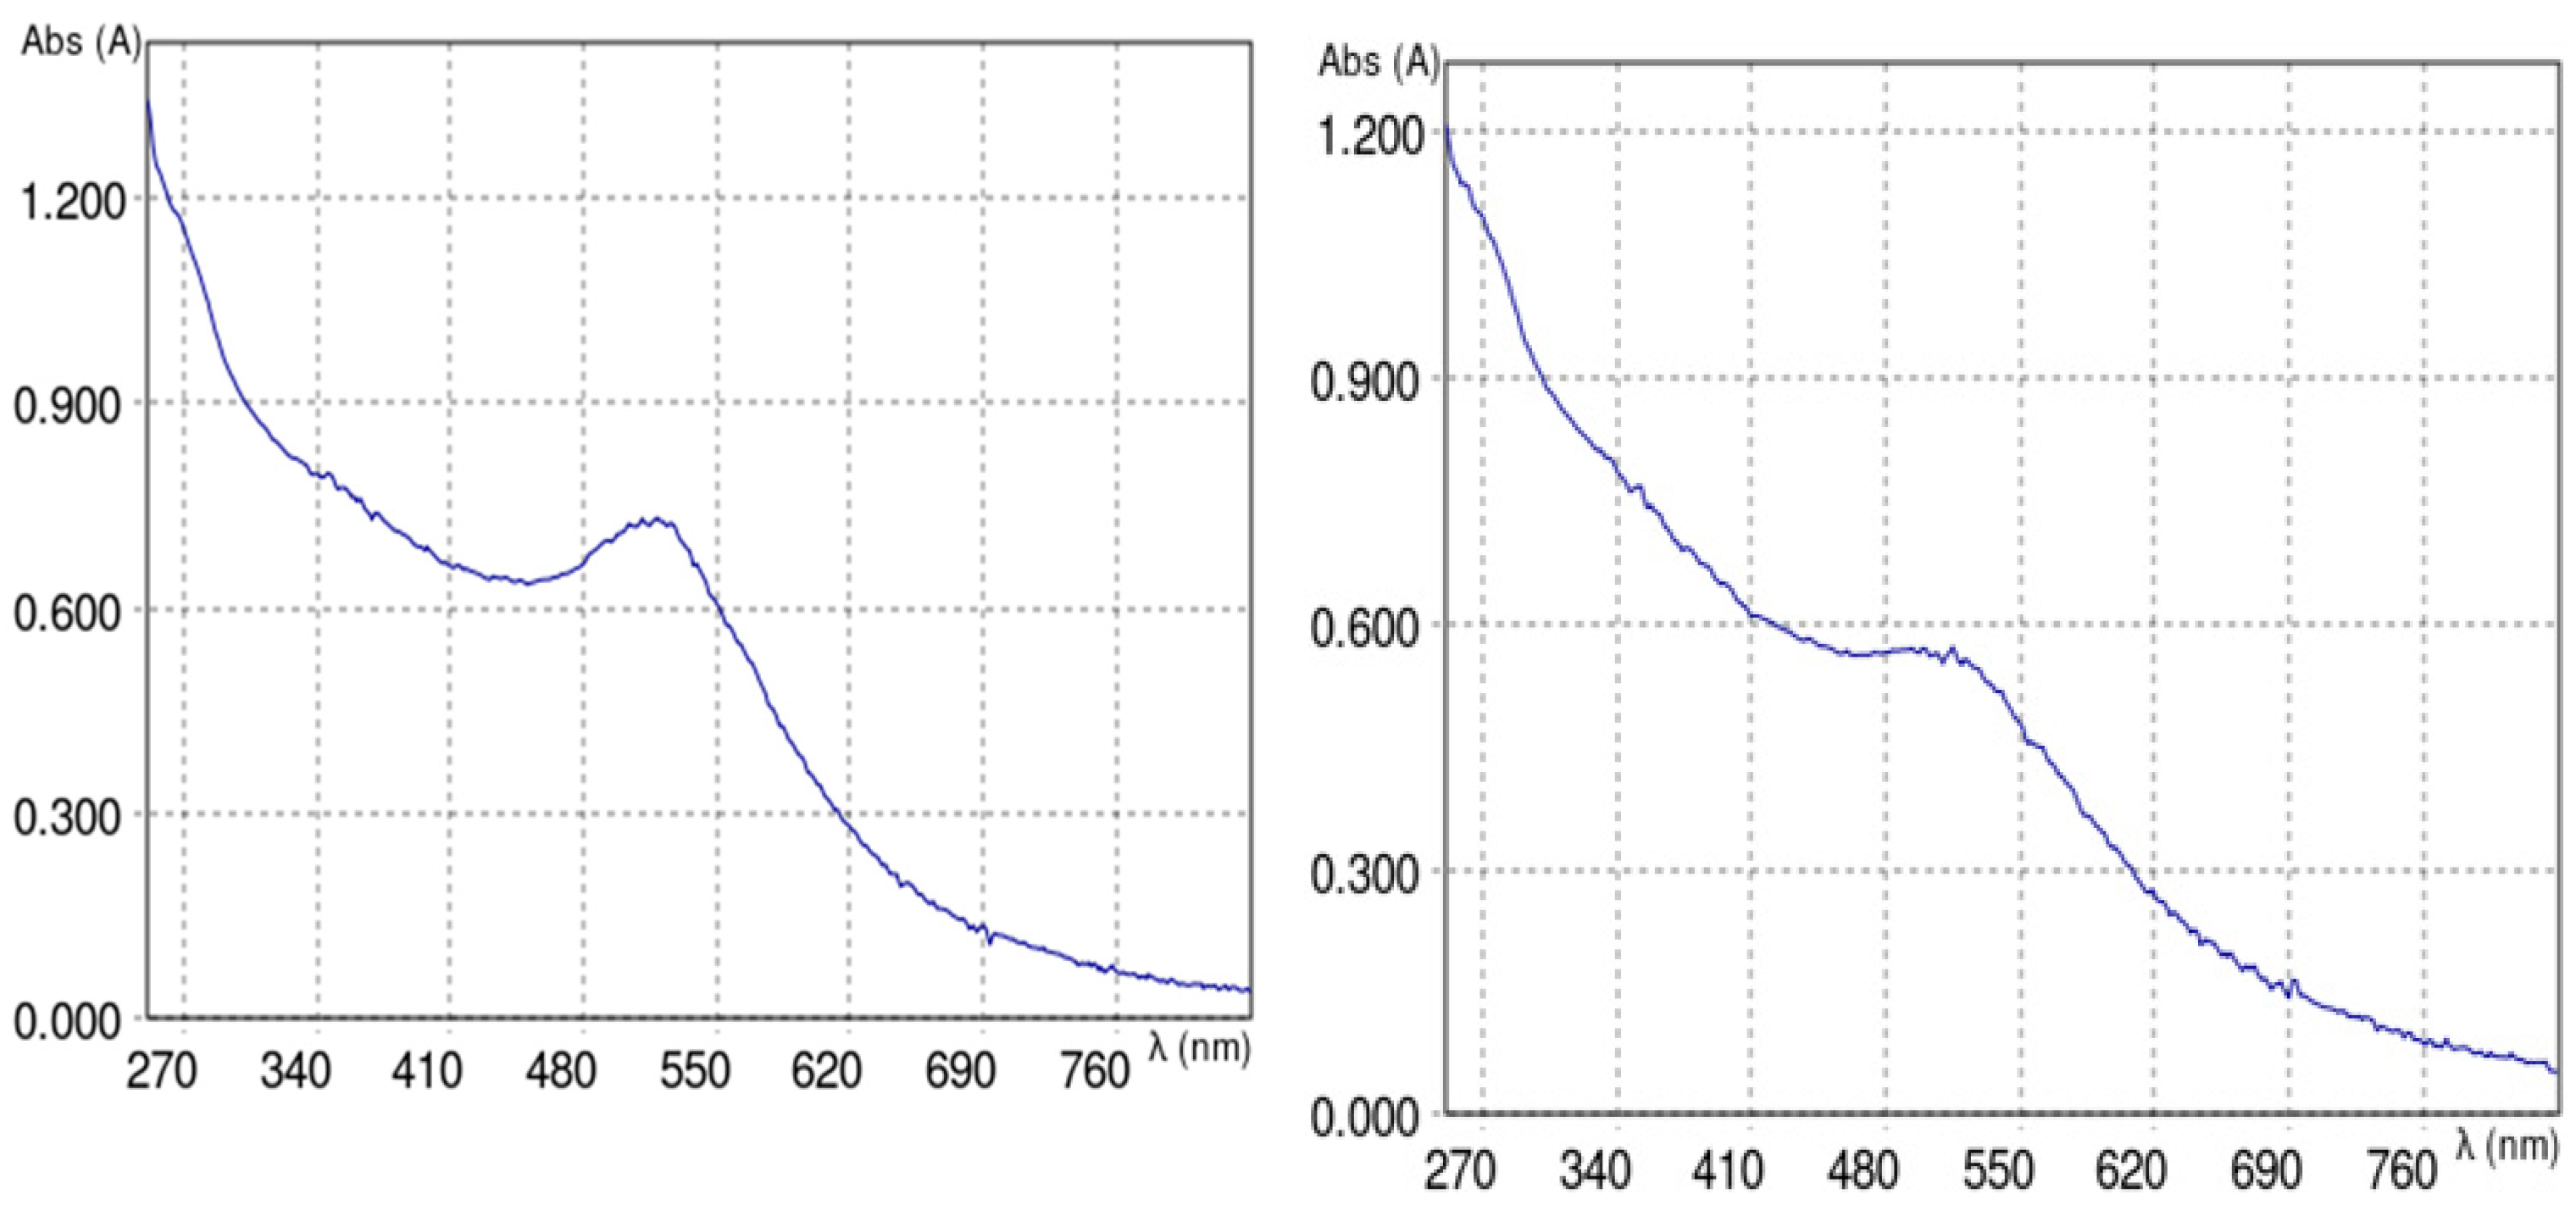
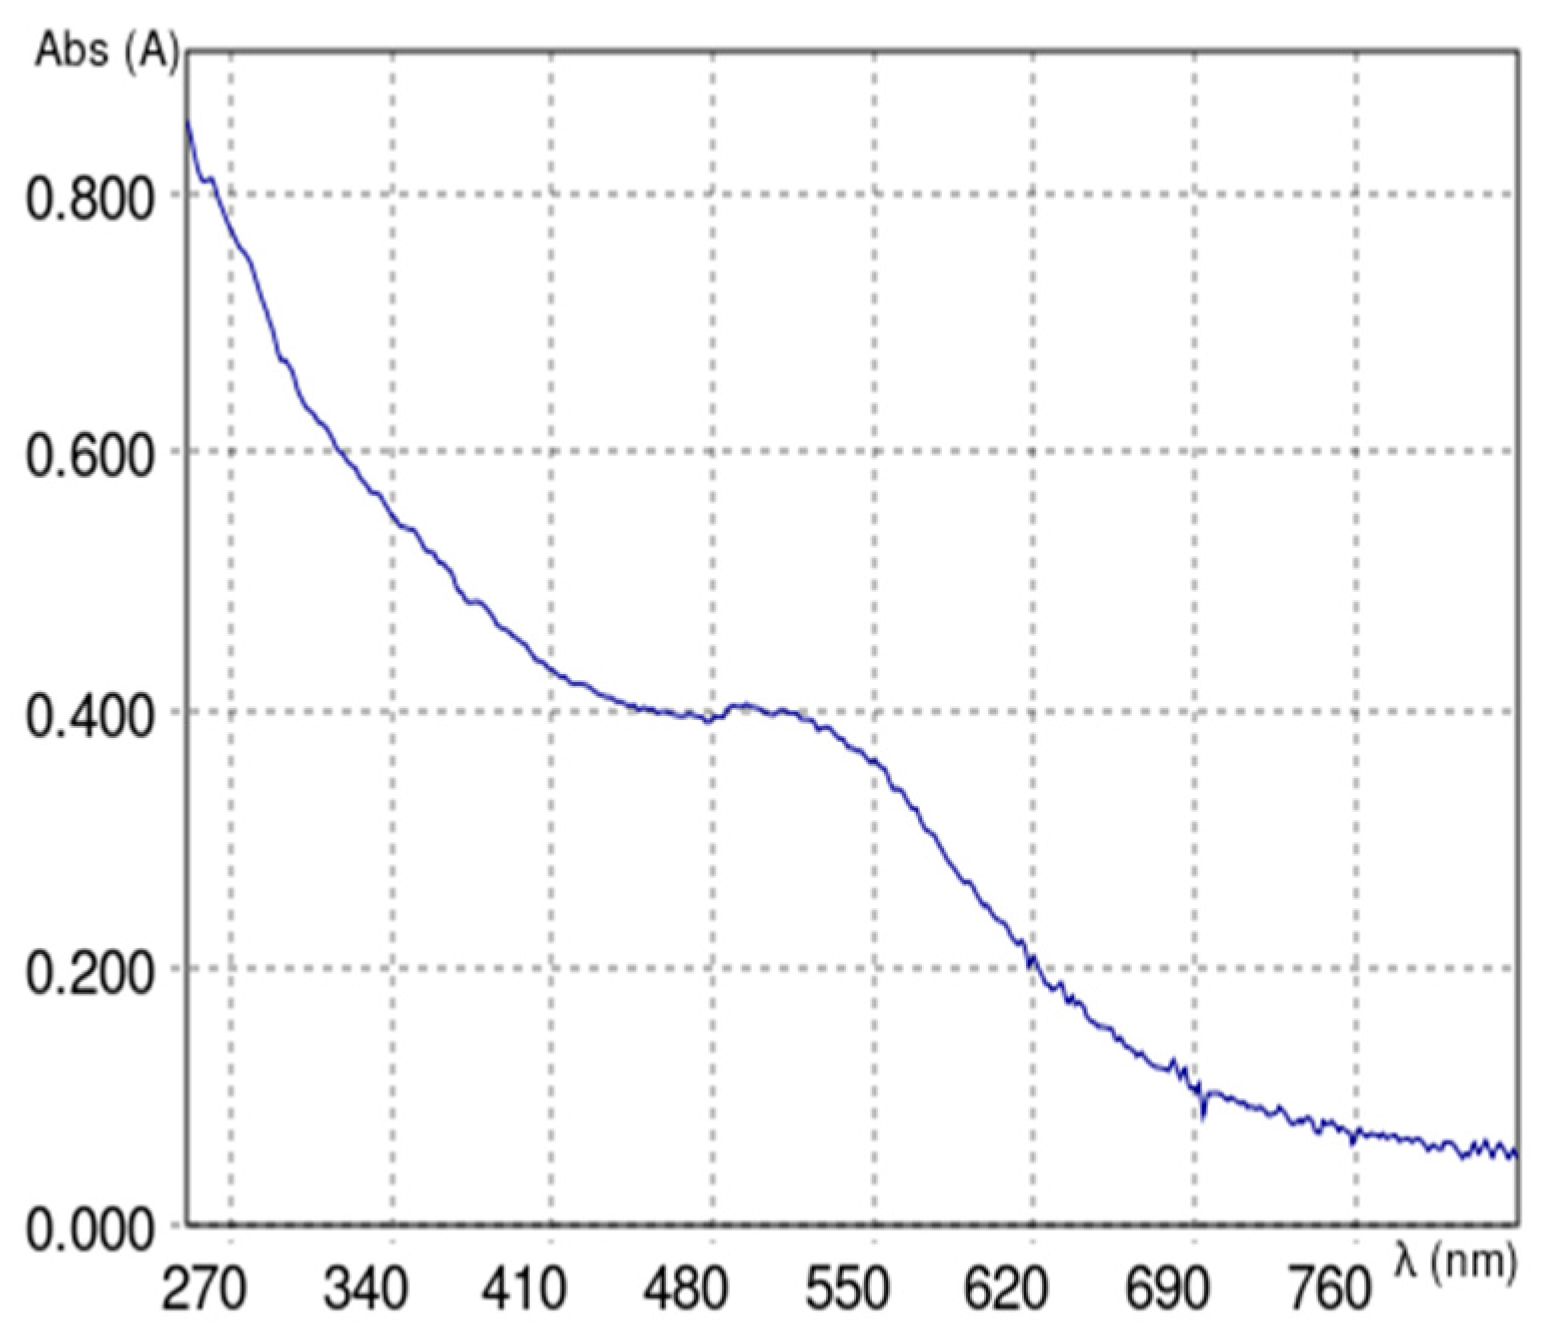
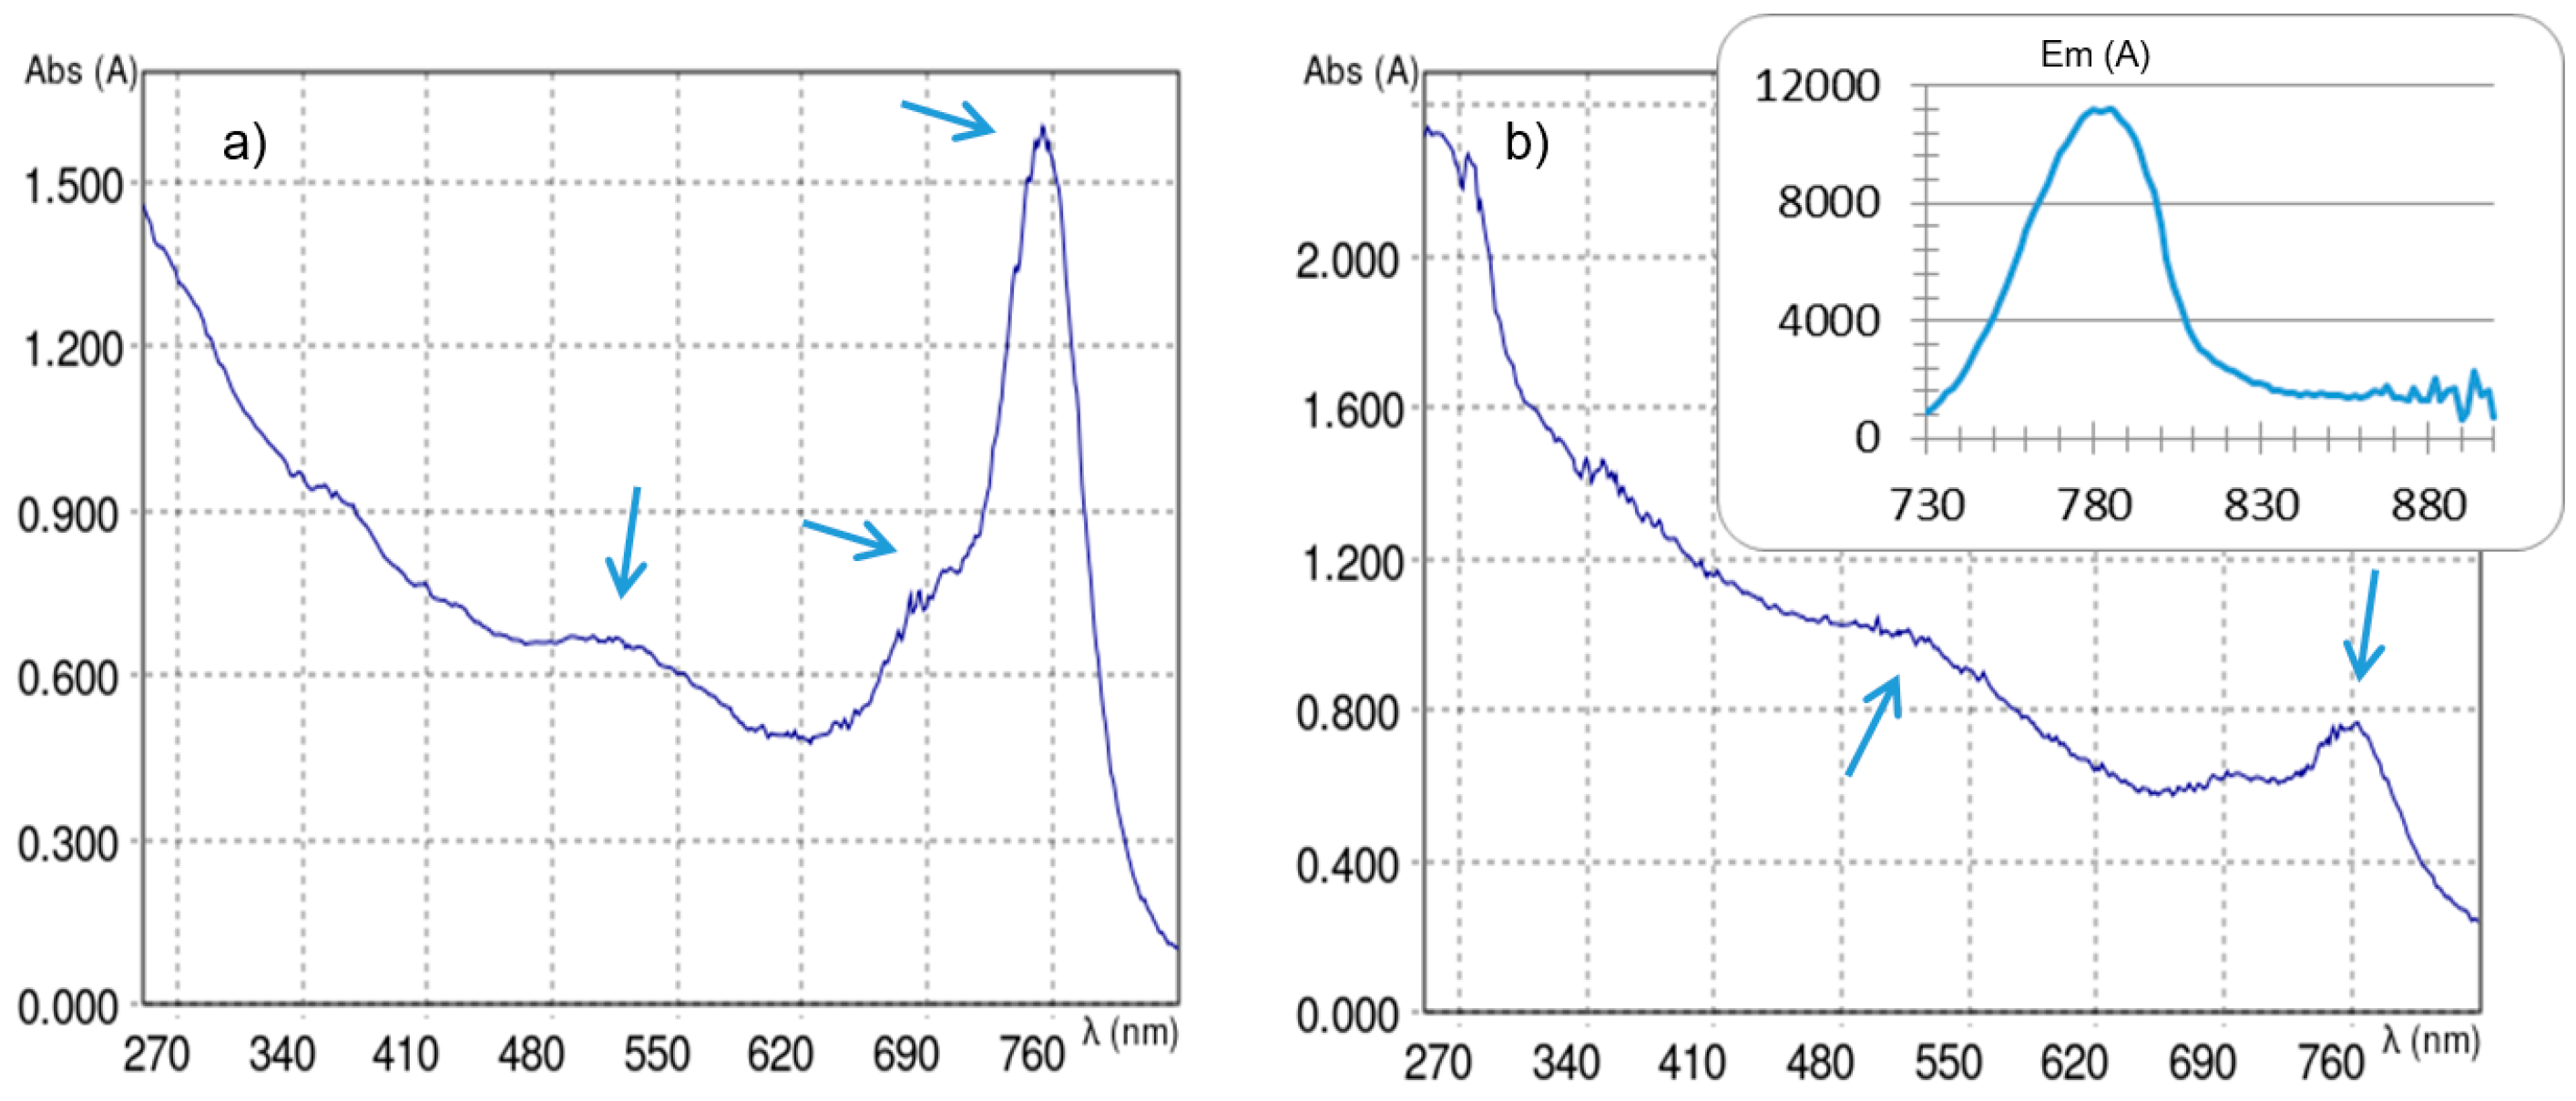
Appendix B.2. UV/Vis Spectra and Size Determination

UV/Vis measurements were performed with an Eppendorf BioSpektrometer Kinetic. We measured the absorption of the AuNPs at a concentration of 1 µg/mL to estimate the particle size before performing electron microscopy. The absorption at the surface-plasmon resonance (maximum) divided by the absorption at 450 nm (minimum) gives a factor that can be compared with tables from literature [70]. Emission scans were performed on a Tecan infinite M200 with excitation wavelength of 690 nm.
Figure A7. AuNP-PEG 1 (Aspr = 0.730/A450 = 0.633 give 1.15 → 3–4 nm) after dialysis with typical absorption maximum for ultrasmall AuNPs at 514 nm (left). AuNP-maleimide 2a (right).
Nanomaterials 11 00138 g0a7
Figure A8. Absorption spectrum of AuNP-RGD 7 after dialysis (Aspr = 0.399/A480 = 0.389 give 1.02 → 3 nm).
Nanomaterials 11 00138 g0a8
Figure A9. Absorption spectra of AuNP-RGD-NIR-dye 8 (a) after dialysis and (b) after additional Sephadex purification (Aspr = 0.668/A480 = 0.660 gives 1.01 → 3 nm) with three absorption maxima at 534, 690, and 750 nm. Insert in (b): Corresponding emission spectrum (excitation wavelength = 690 nm, emission = 740–840 nm, EmMax = 790 nm).
Nanomaterials 11 00138 g0a9

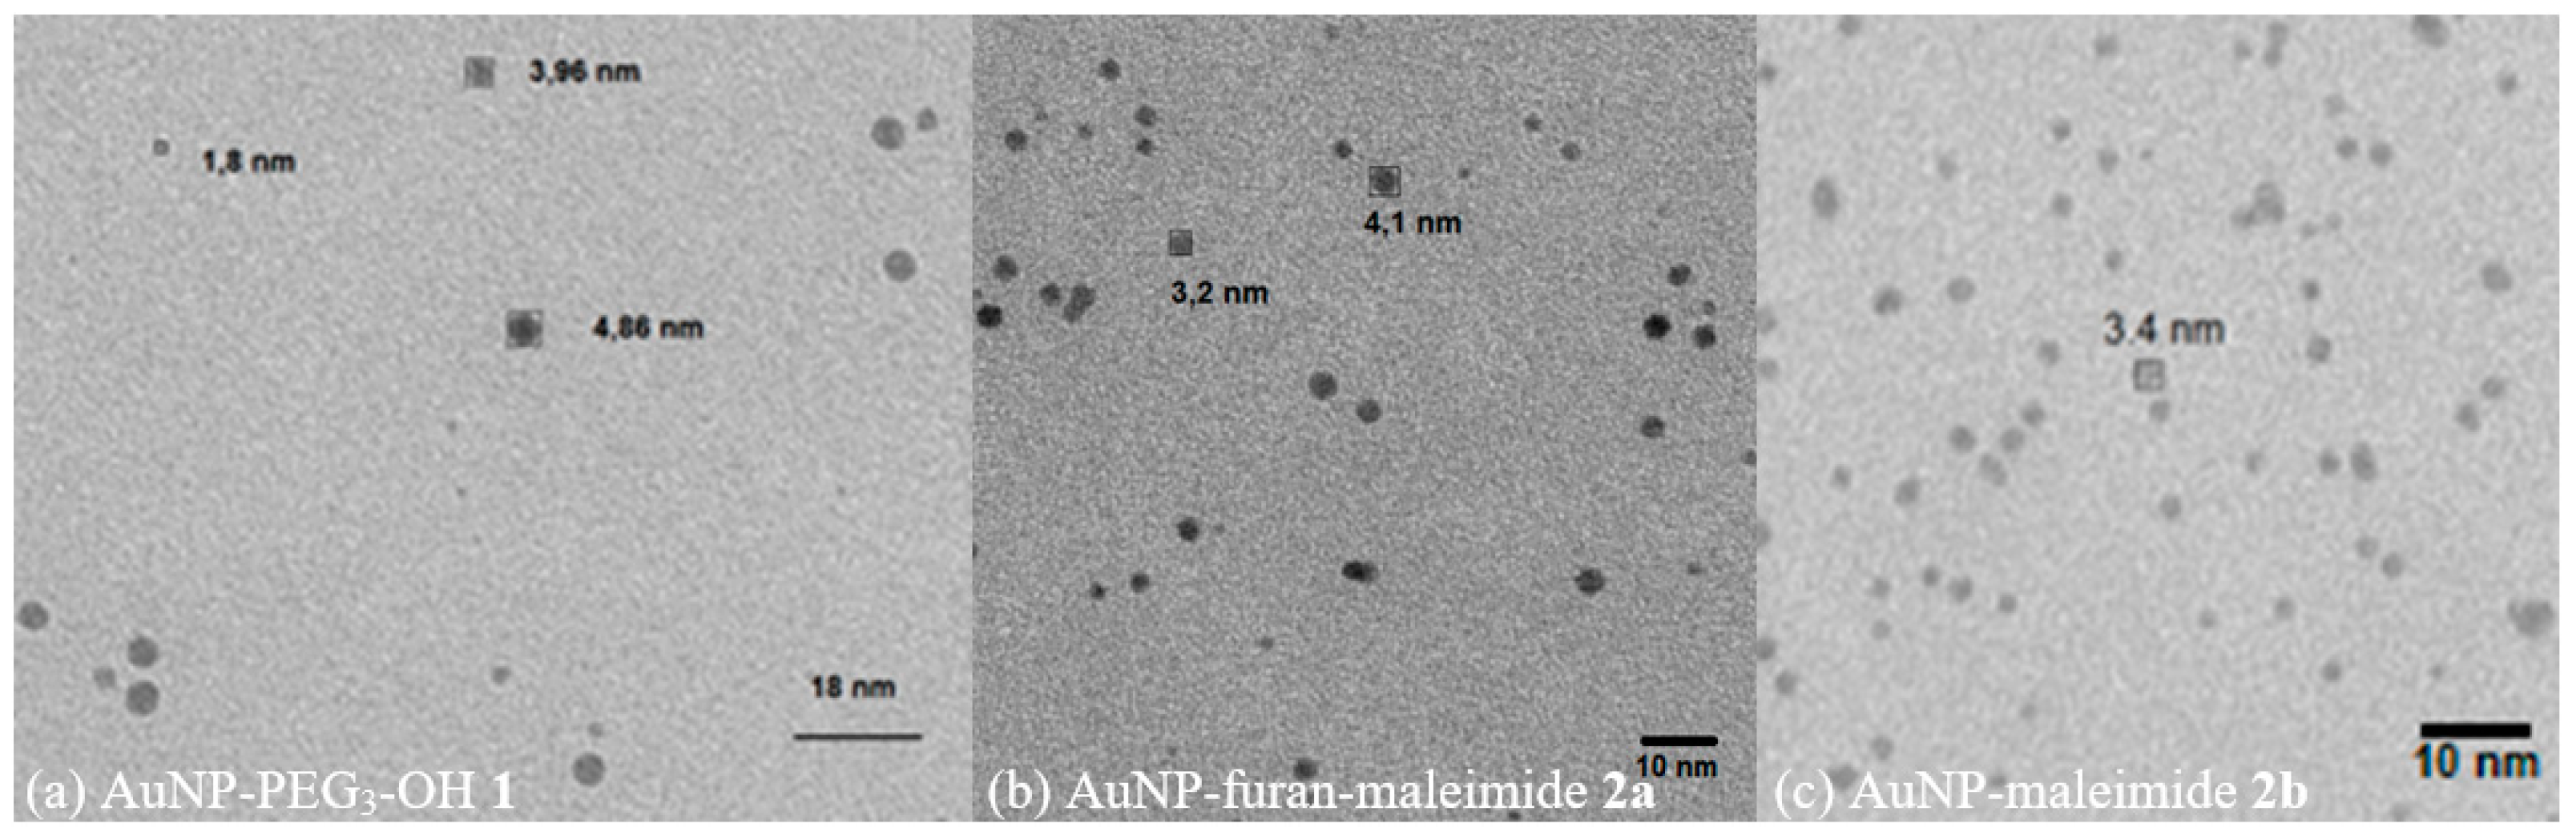
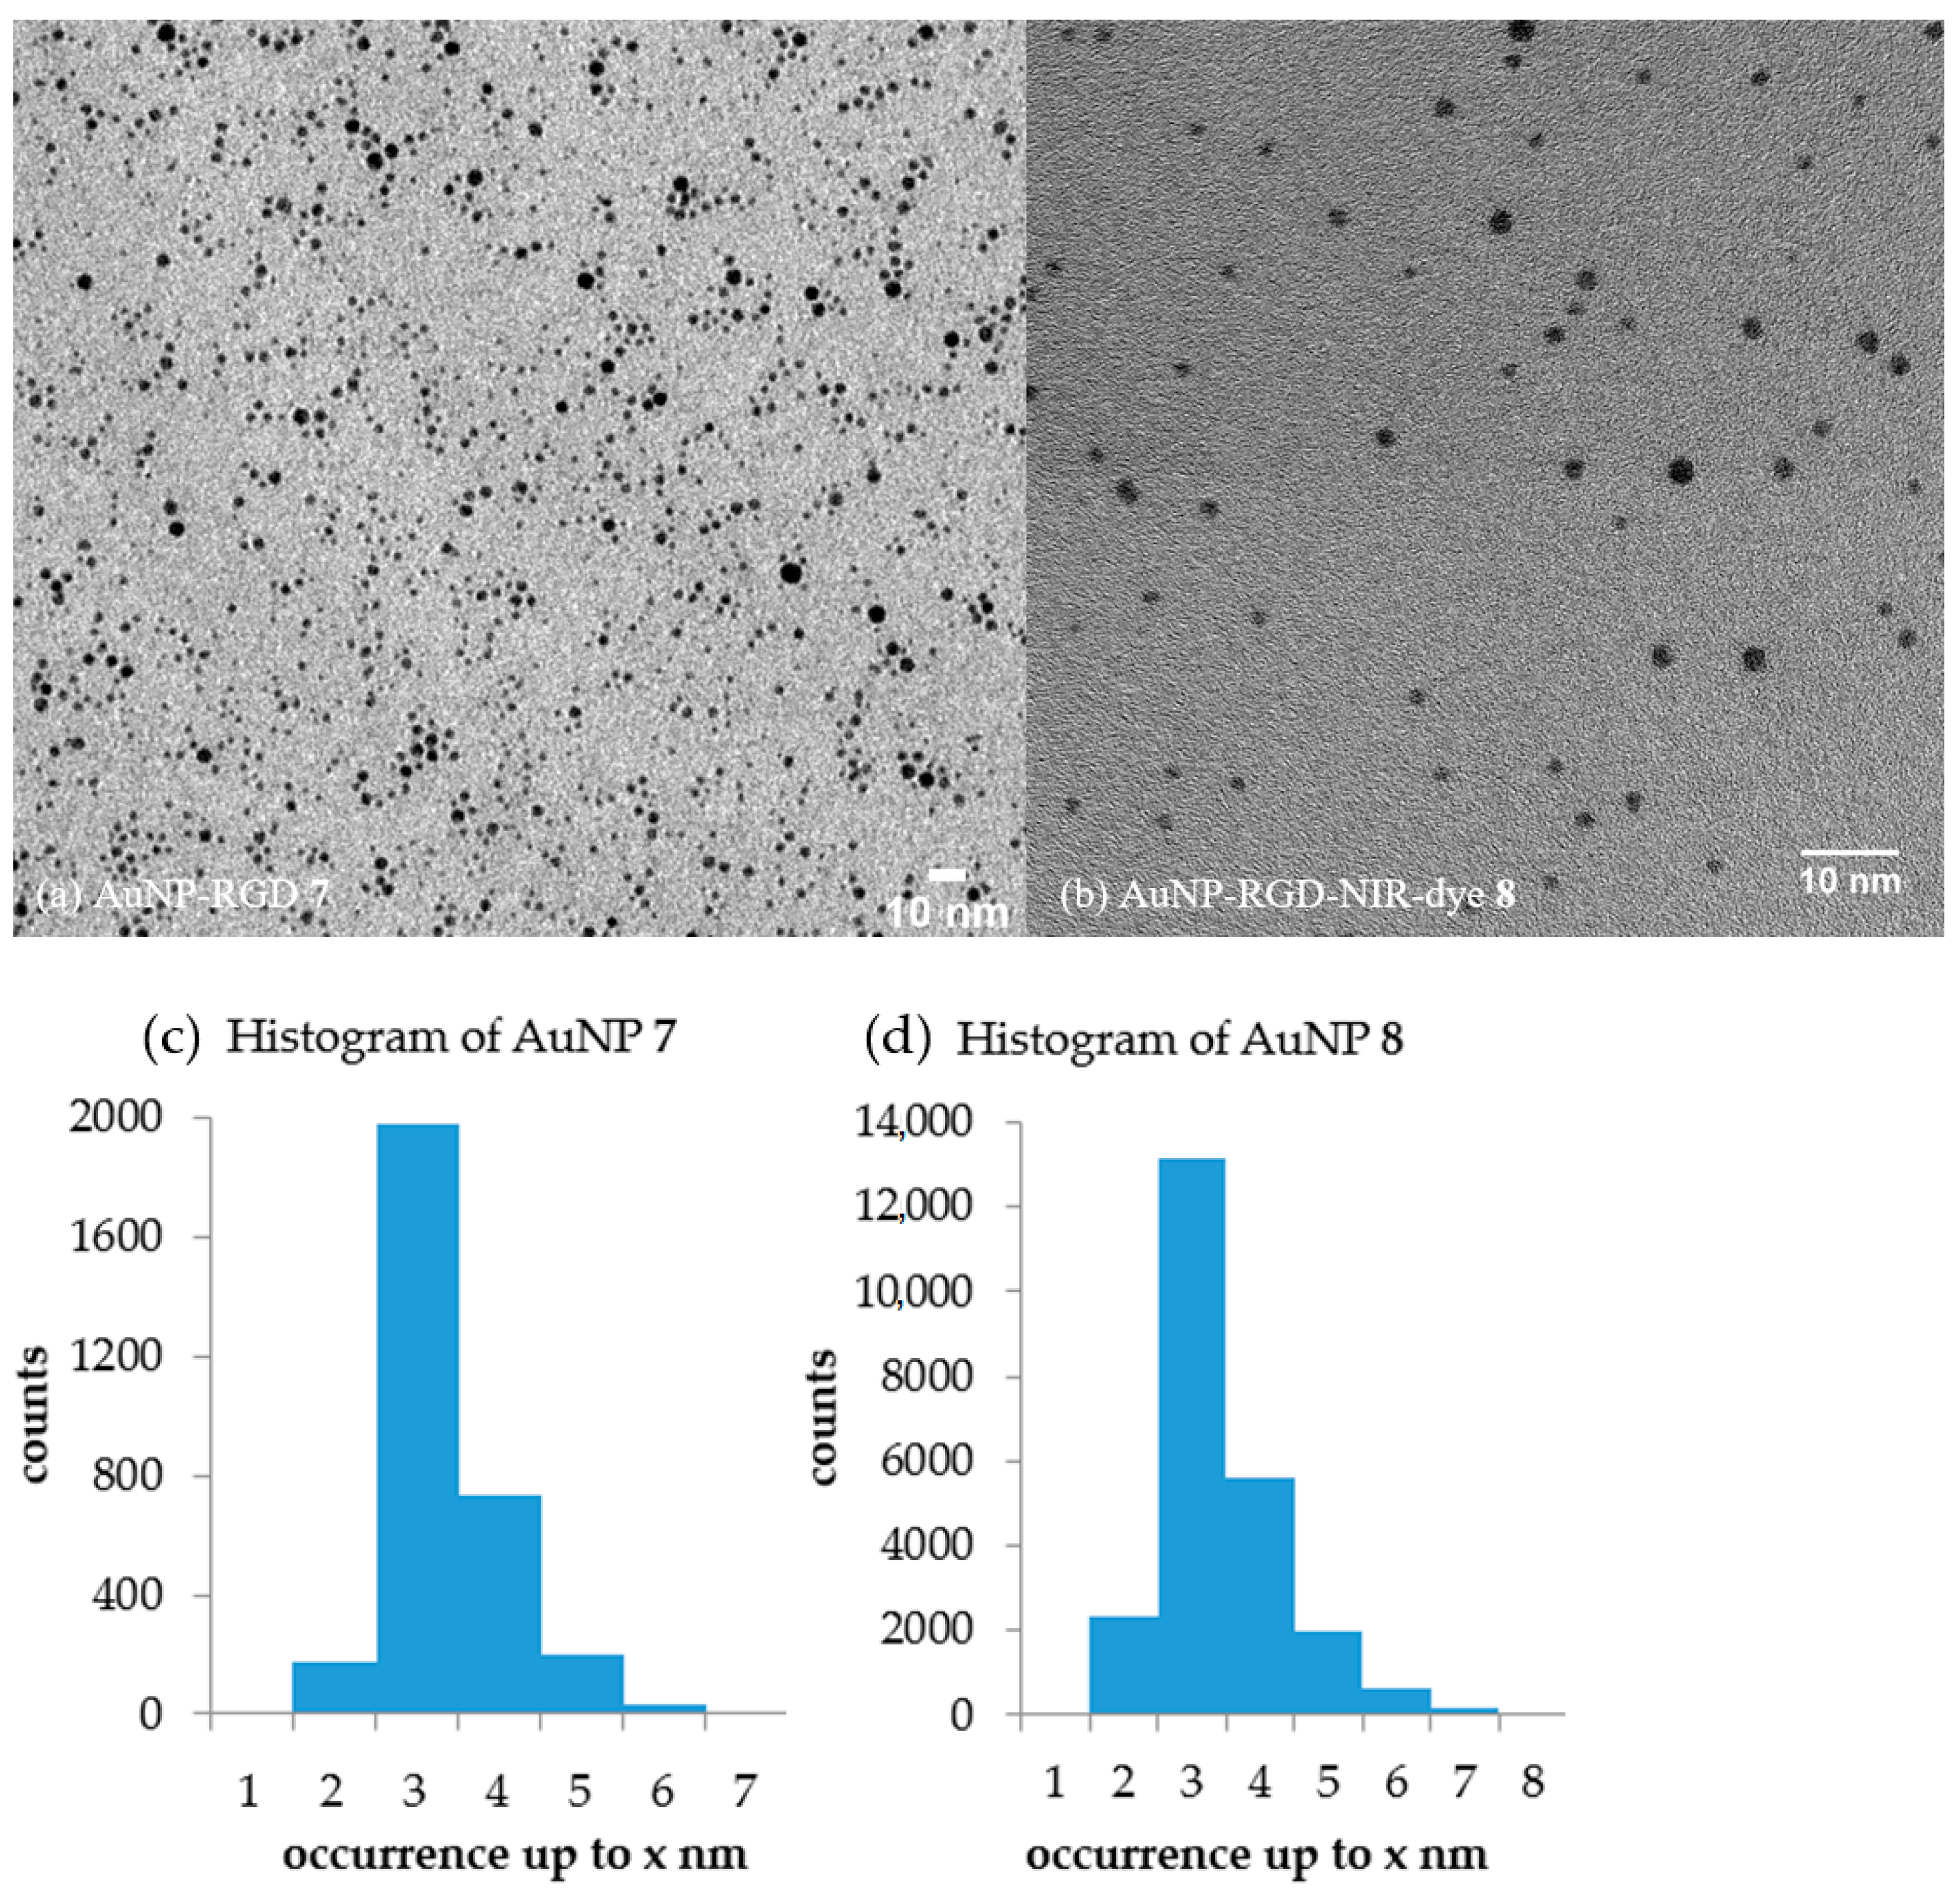
Appendix B.3. Electron Microscopy

AuNP samples were diluted in deionized water at convenience (fade red solution), particles adsorbed onto glow-discharged carbon-coated EM-grids and directly observed by TEM (Zeiss EM912, Carl Zeiss Oberkochen or Titan 80-300, FEI Company, HZDR). Images were digitally registered via a CCD camera (Sharp eye, TRS, Moorenweiss or US1000 der Firma Gatan). The number and size of particles was measured by FIJI software (v1.50e).
Figure A10. Transmission electron microscopy of (a) AuNP-PEG 1 (A = 10.53 nm2, Ø = 3.66 nm, n = 1000), (b) AuNPs 2a, and (c) AuNPs 2b (A = 9.21 nm2, Ø = 3.42 nm, n = 1860).
Nanomaterials 11 00138 g0a10
Figure A11. Transmission electron microscopy of (a) AuNP-RGD 7 (A = 6.64 nm2, Ø = (2.91 ± 2.27) nm, n = 3100) and (b) AuNP-RGD-NIR-dye 8 (A = 7.44 nm2, Ø = (3.08 ± 2.57) nm, n = 23,900) and the respective histograms (c) and (d) of the AuNP diameter distribution.
Nanomaterials 11 00138 g0a11

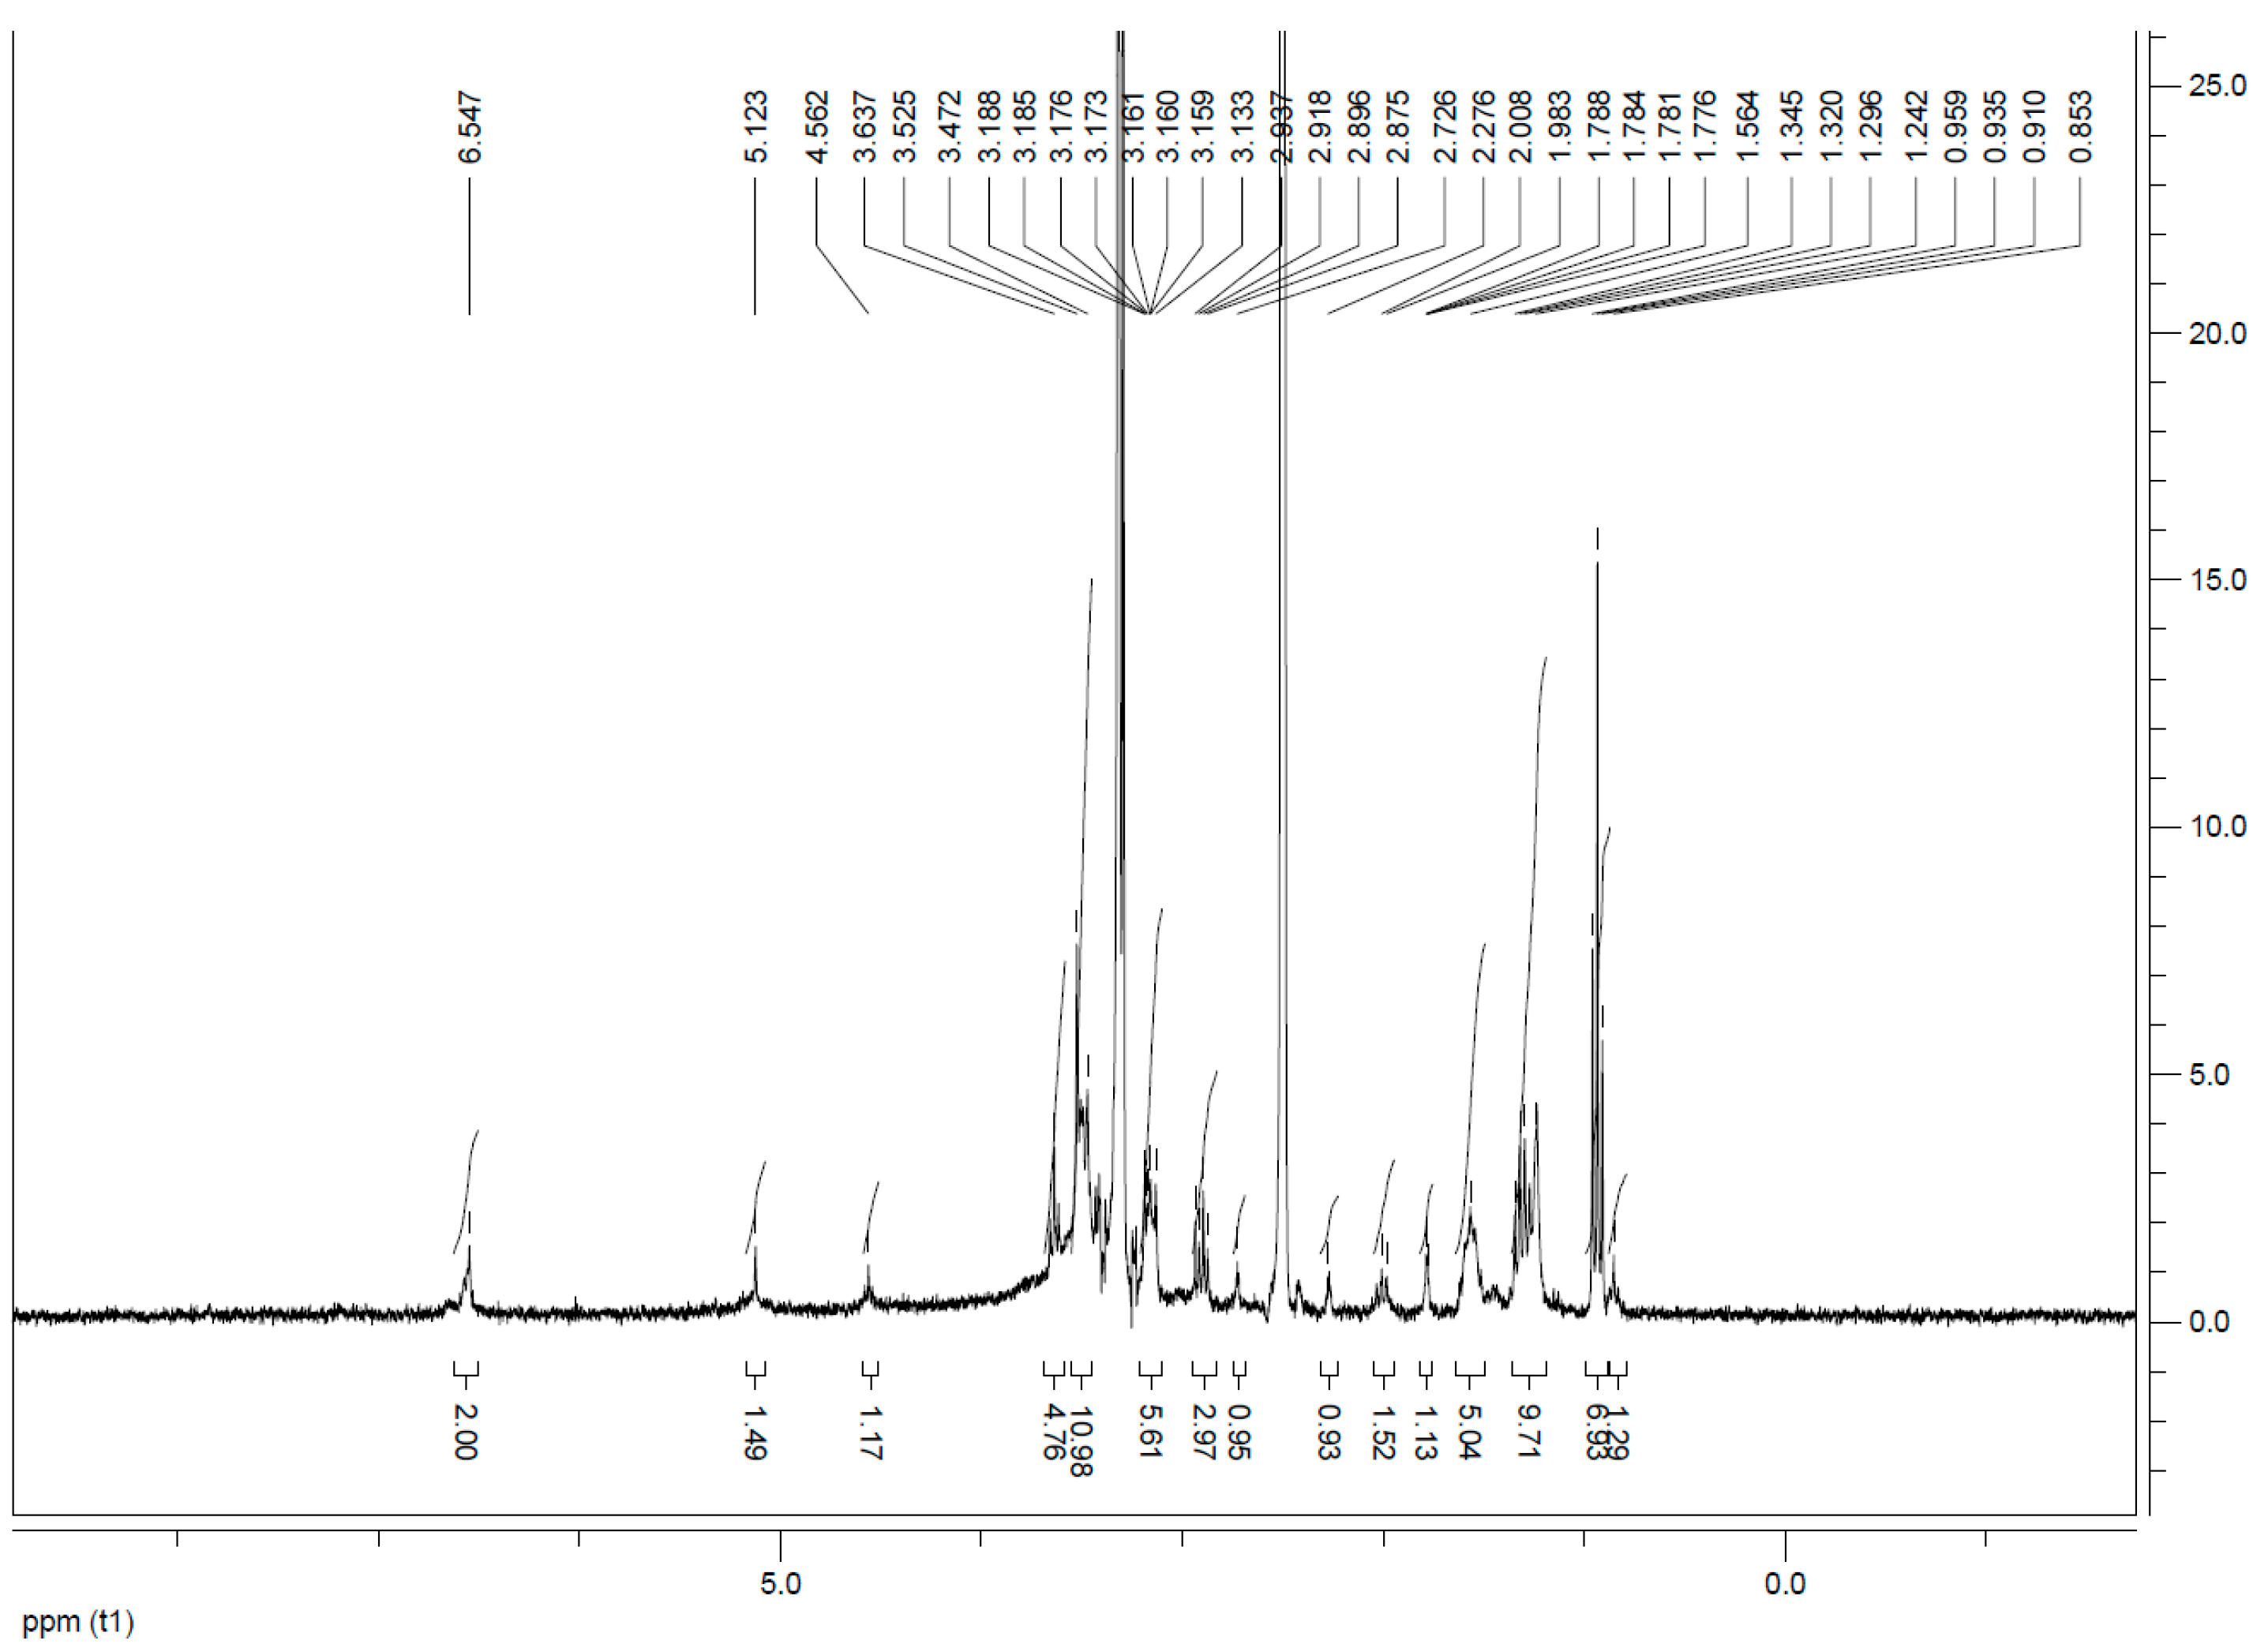
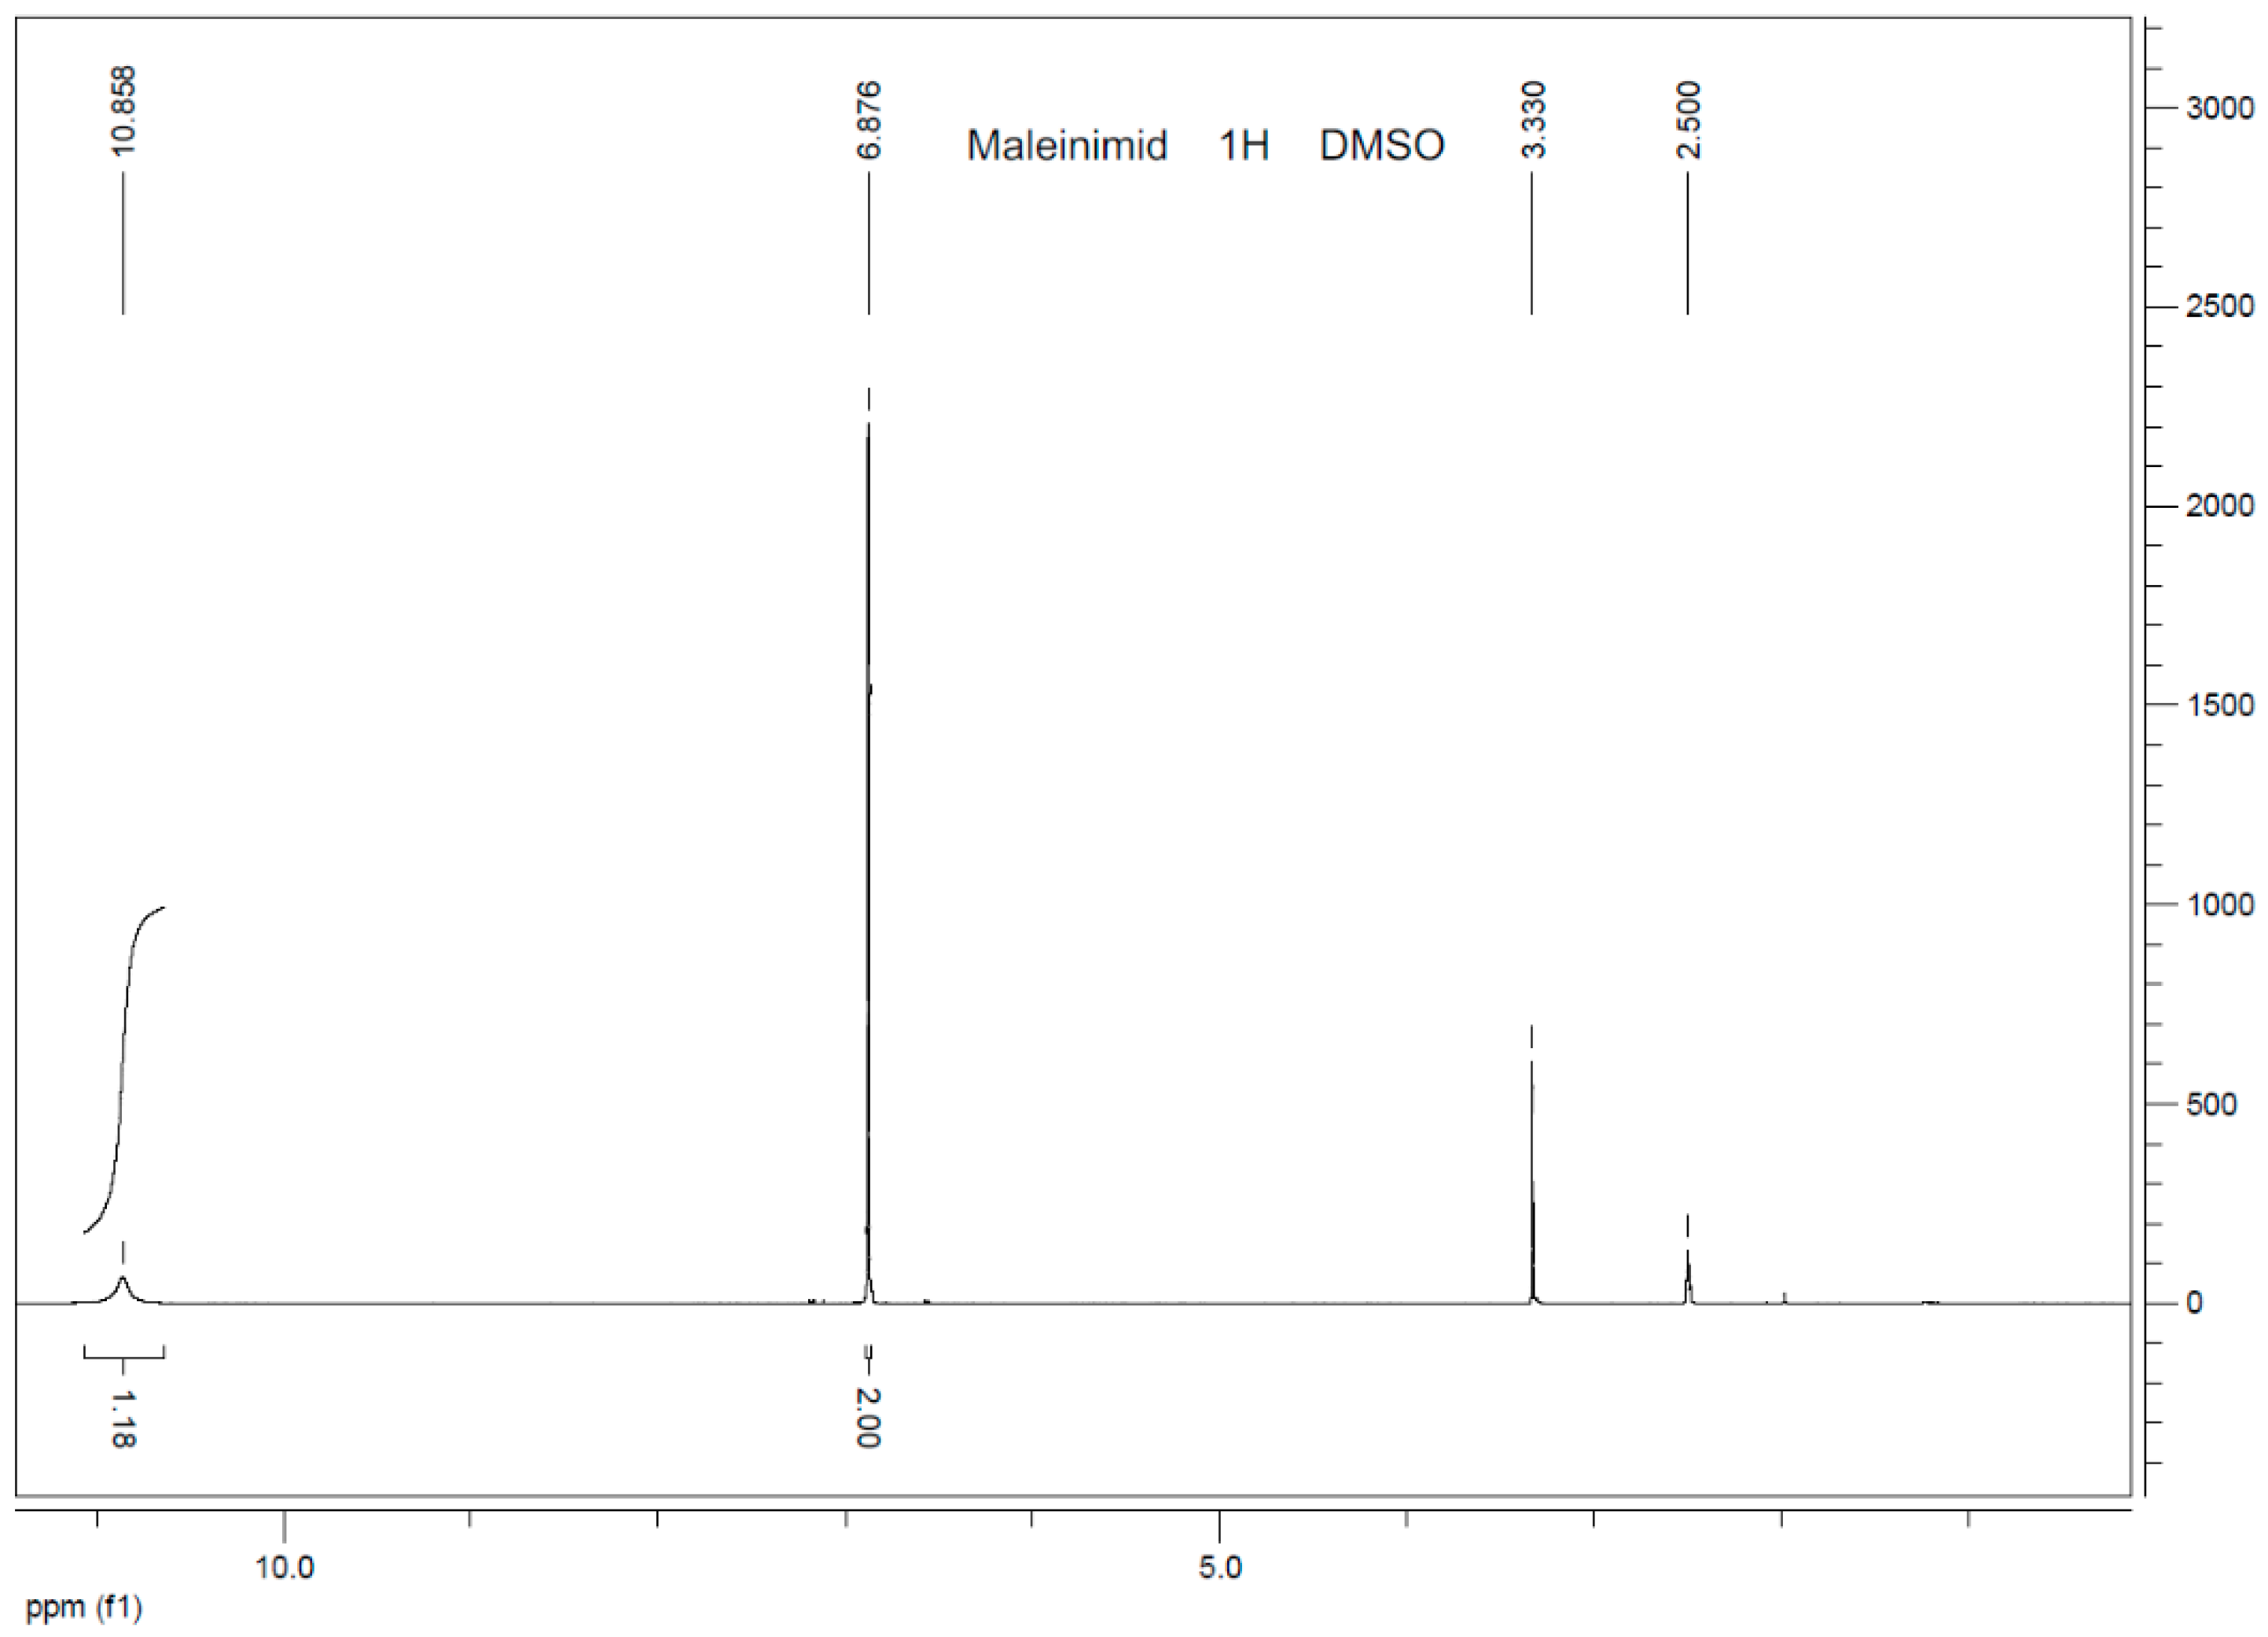
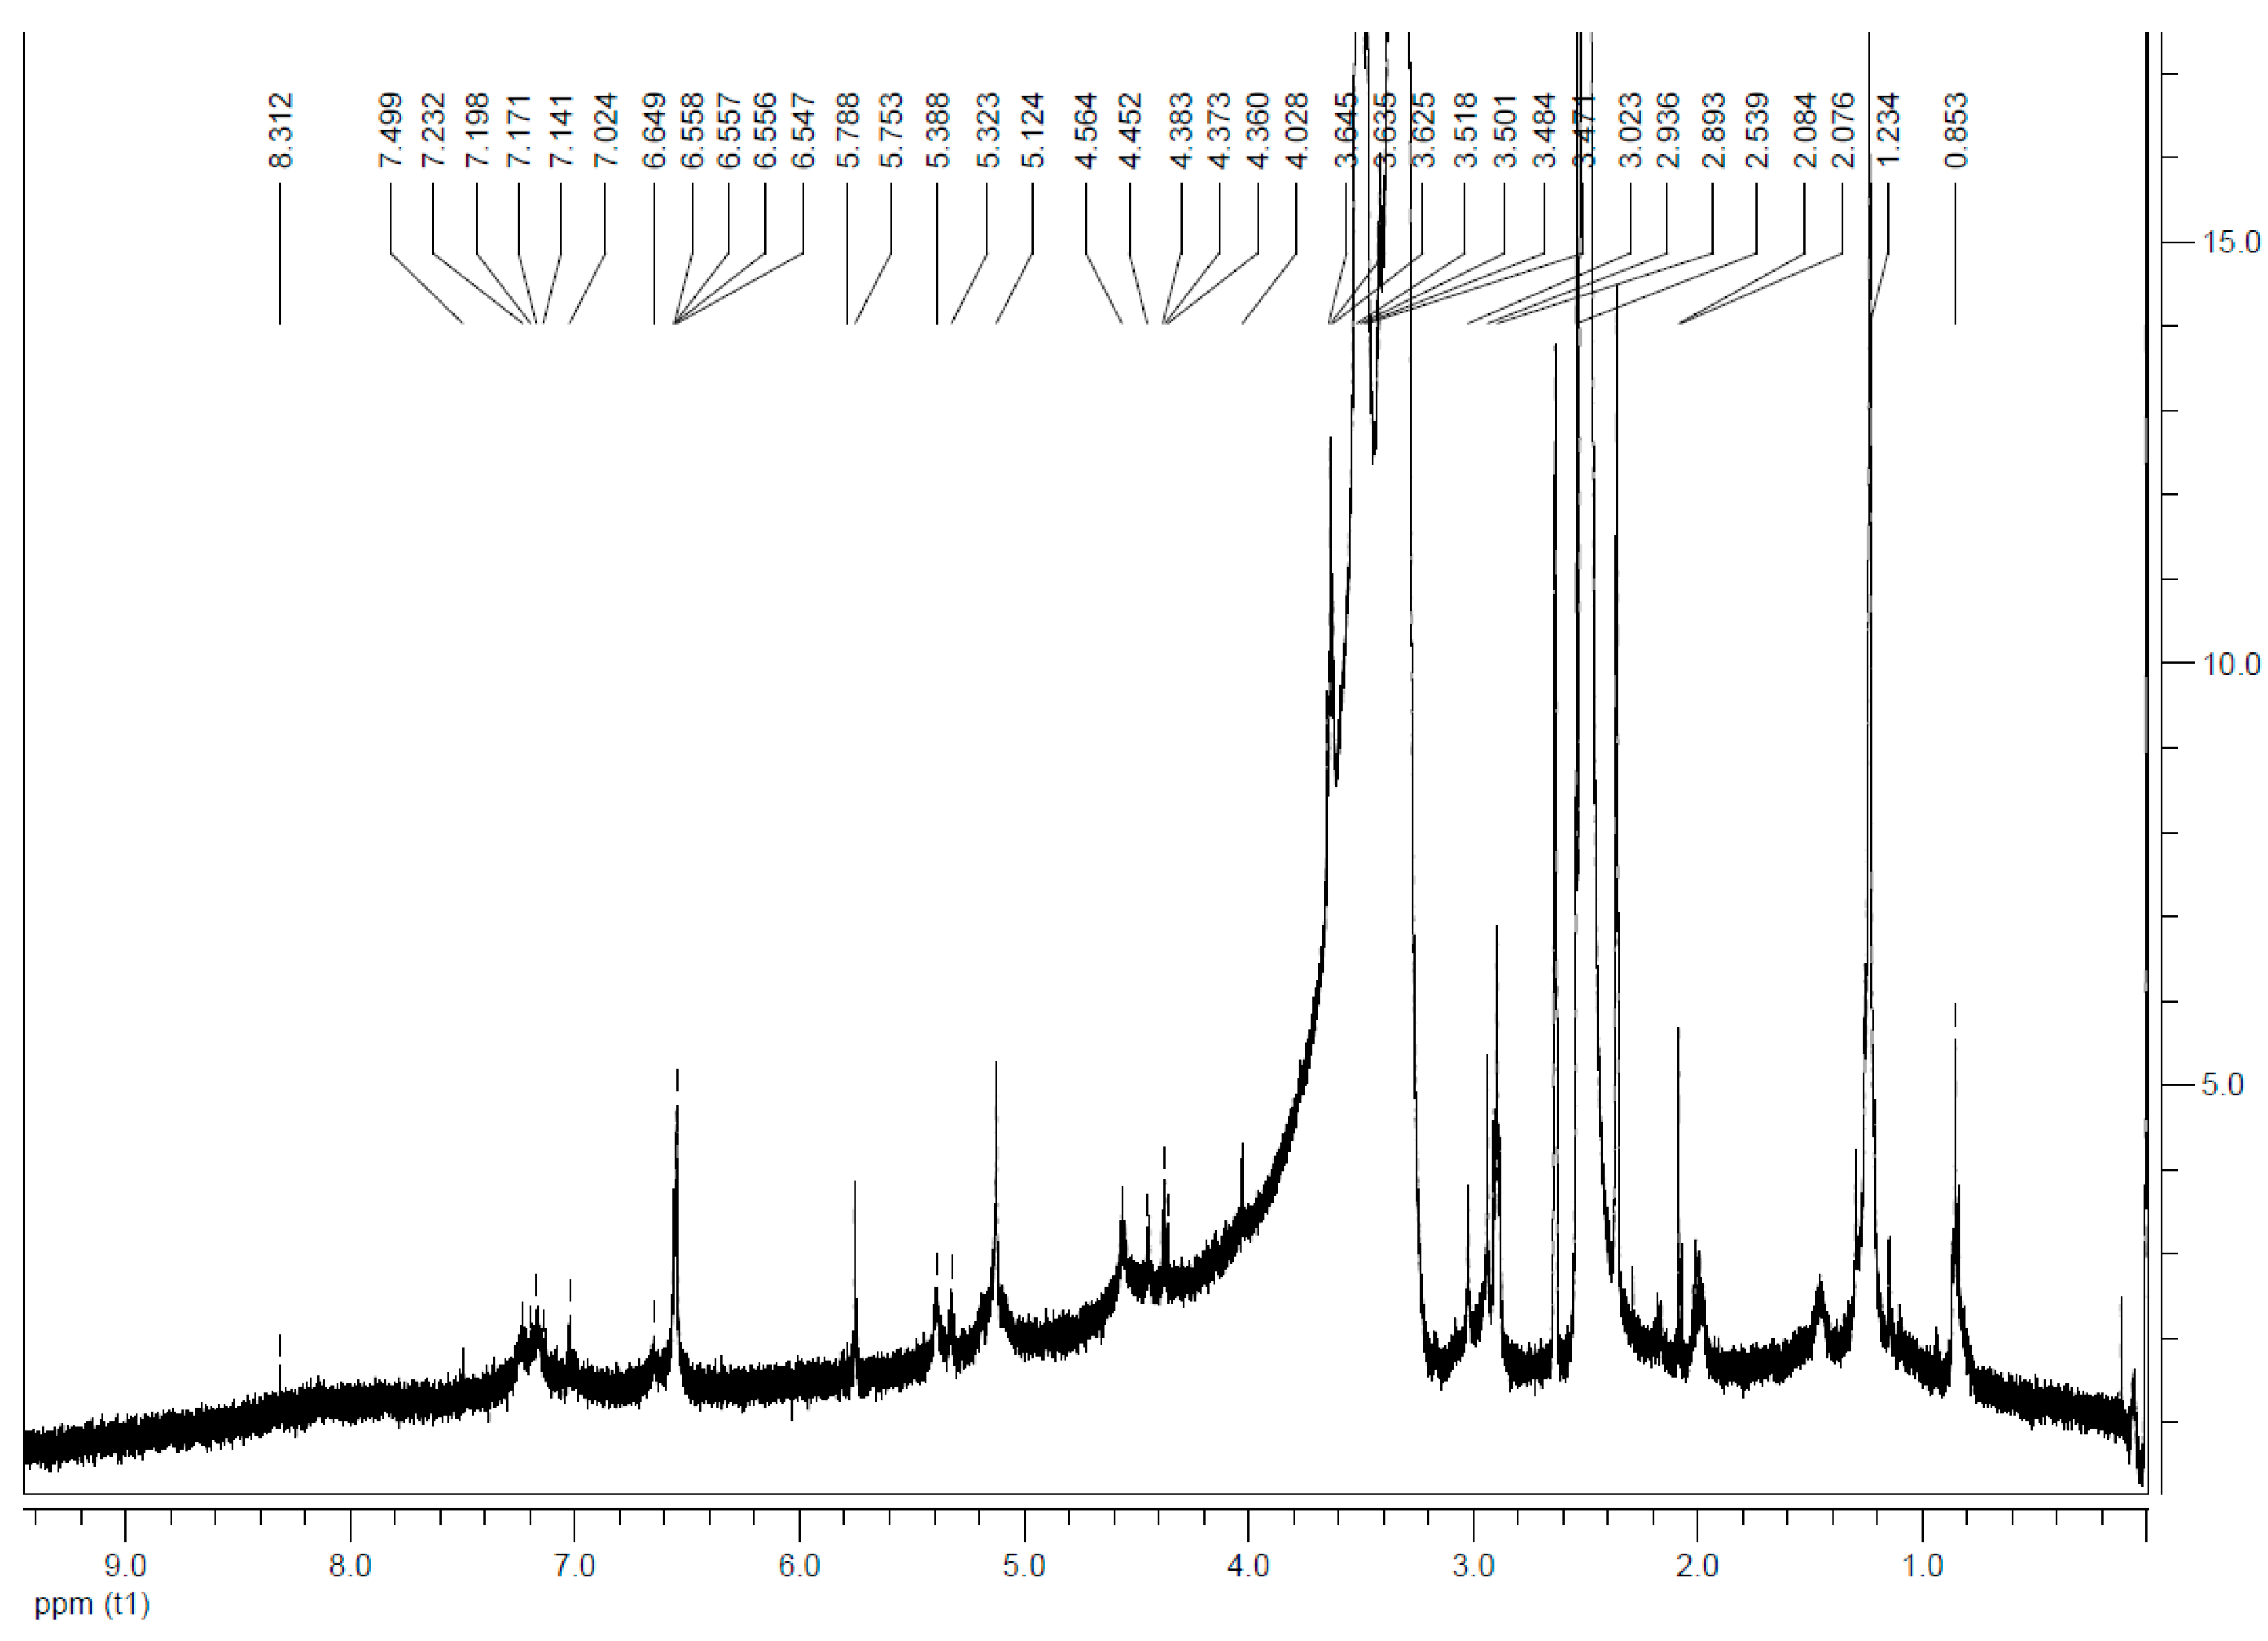
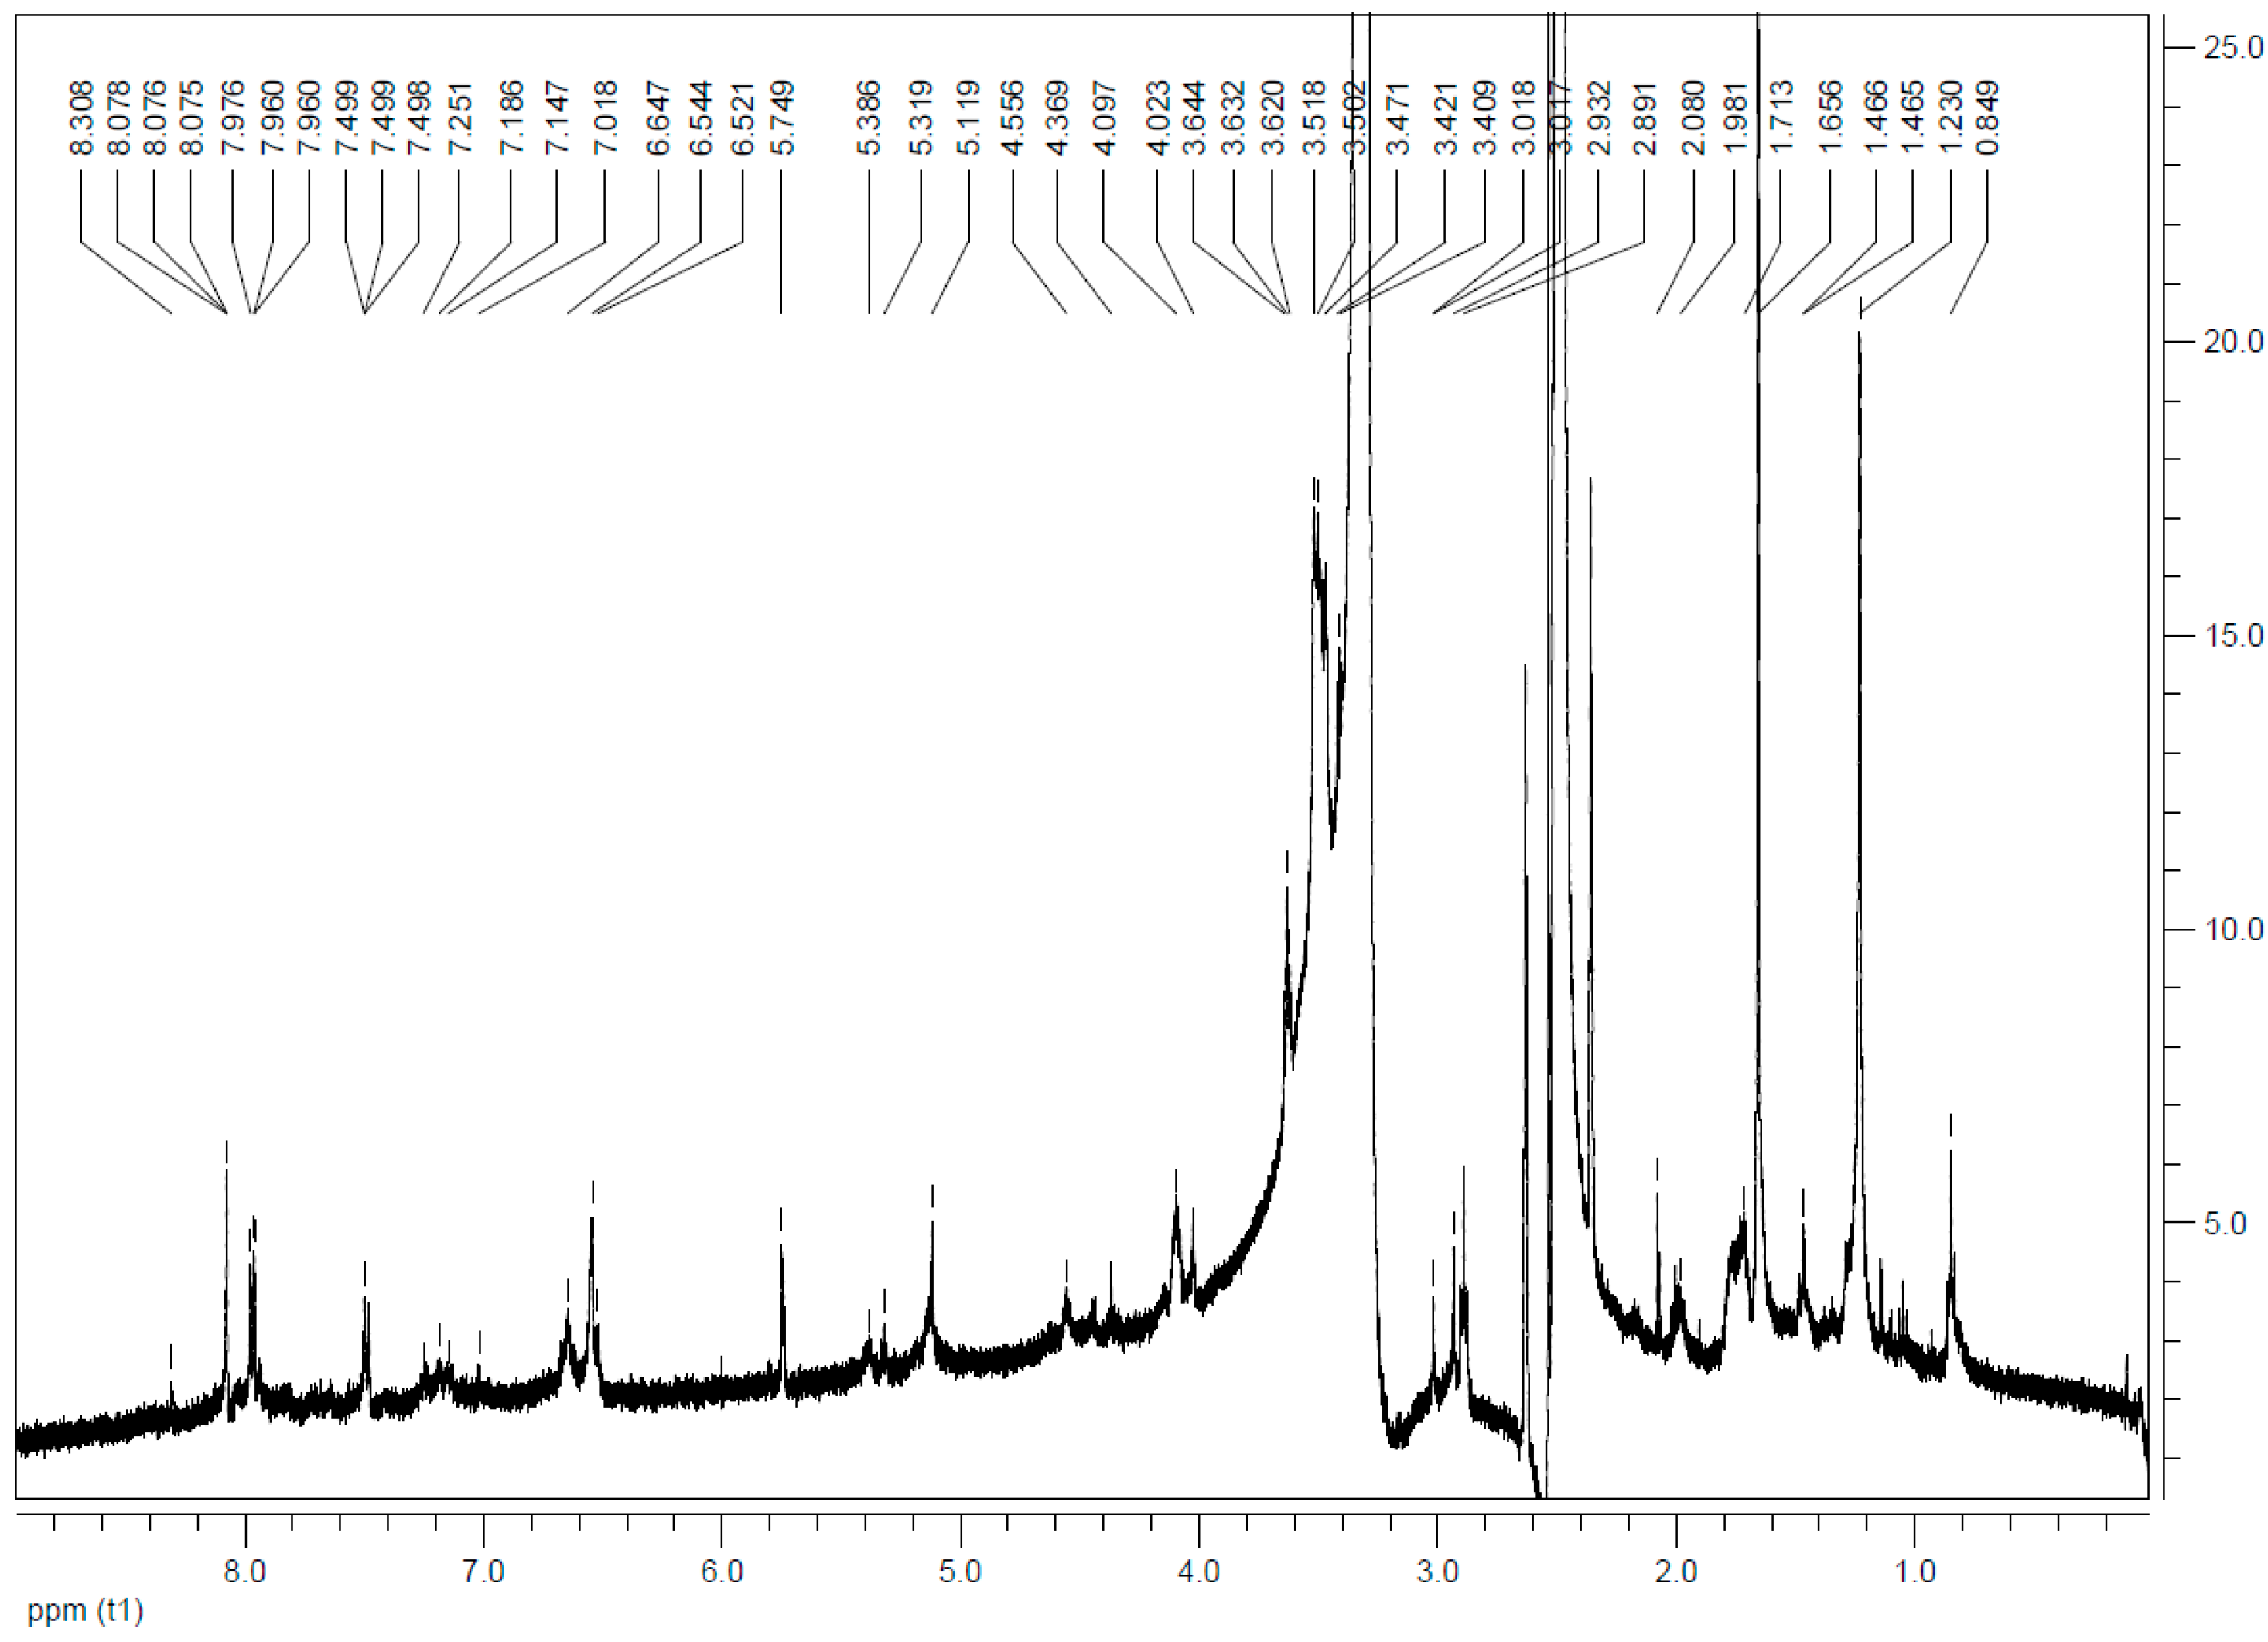
Appendix B.4. NMR Spectra

Figure A12. 1H NMR spectrum of AuNPs 2a in d6-DMSO with the characteristic signals of the furan-protected maleimide at 6.55, 5.12, and 4.56 ppm.
Nanomaterials 11 00138 g0a12
Figure A13. 1H NMR spectrum of maleimide in d6-DMSO with the characteristic signal of the double bond at 6.88 ppm.
Nanomaterials 11 00138 g0a13
Figure A14. 1H NMR spectrum of AuNP-RGD 7 in d6-DMSO: the characteristic signal of the double bond of the maleimide is faded; typical signals of peptide-bond-NH (7.50 ppm), Phe-CHarom (7.23–7.14 ppm), Arg-C=NH (6.65 ppm), Arg-NH2 (5.78 ppm), Phe-CH (5.39 ppm), Asp-CH (5.32 ppm), Arg-CH (4.45 ppm), Lys-CH (4.38 ppm), Gly-CH2 (4.03 ppm), and residual furan-protected maleimide (6.55, 5.12 and 4.56 ppm).
Nanomaterials 11 00138 g0a14
Figure A15. 1H NMR spectrum of AuNP-RGD-NIR-dye 8 in d6-DMSO: typical signals of peptide-bond-NH (7.50 ppm), Phe-CHarom (7.25–7.02 ppm), Arg-C=NH (6.65 ppm), Arg-NH2 (5.75 ppm), Phe-CH (5.39 ppm), Asp-CH (5.32 ppm), Arg-CH (4.56 ppm), Lys-CH (4.37 ppm), Gly-CH2 (4.02 ppm) and NIR-dye 8.08 (d, 2H, 6,6′-H), 8.05 (s, 2H, 4,4′-H), 7.96 (t, 2H, β,β’-H), 7.50 (m, 1H, δ-H), 7.3 (d, 2H, 7,7′-H), 6.65 (t, 2H, γ,γ’-H), 6.54 (d, 2H, α,α’-H), 4.09 (t, 4H, 2 × >NCH2) (compound 4a in [51]) can be found.
Nanomaterials 11 00138 g0a15

Appendix C. Cell Experiments

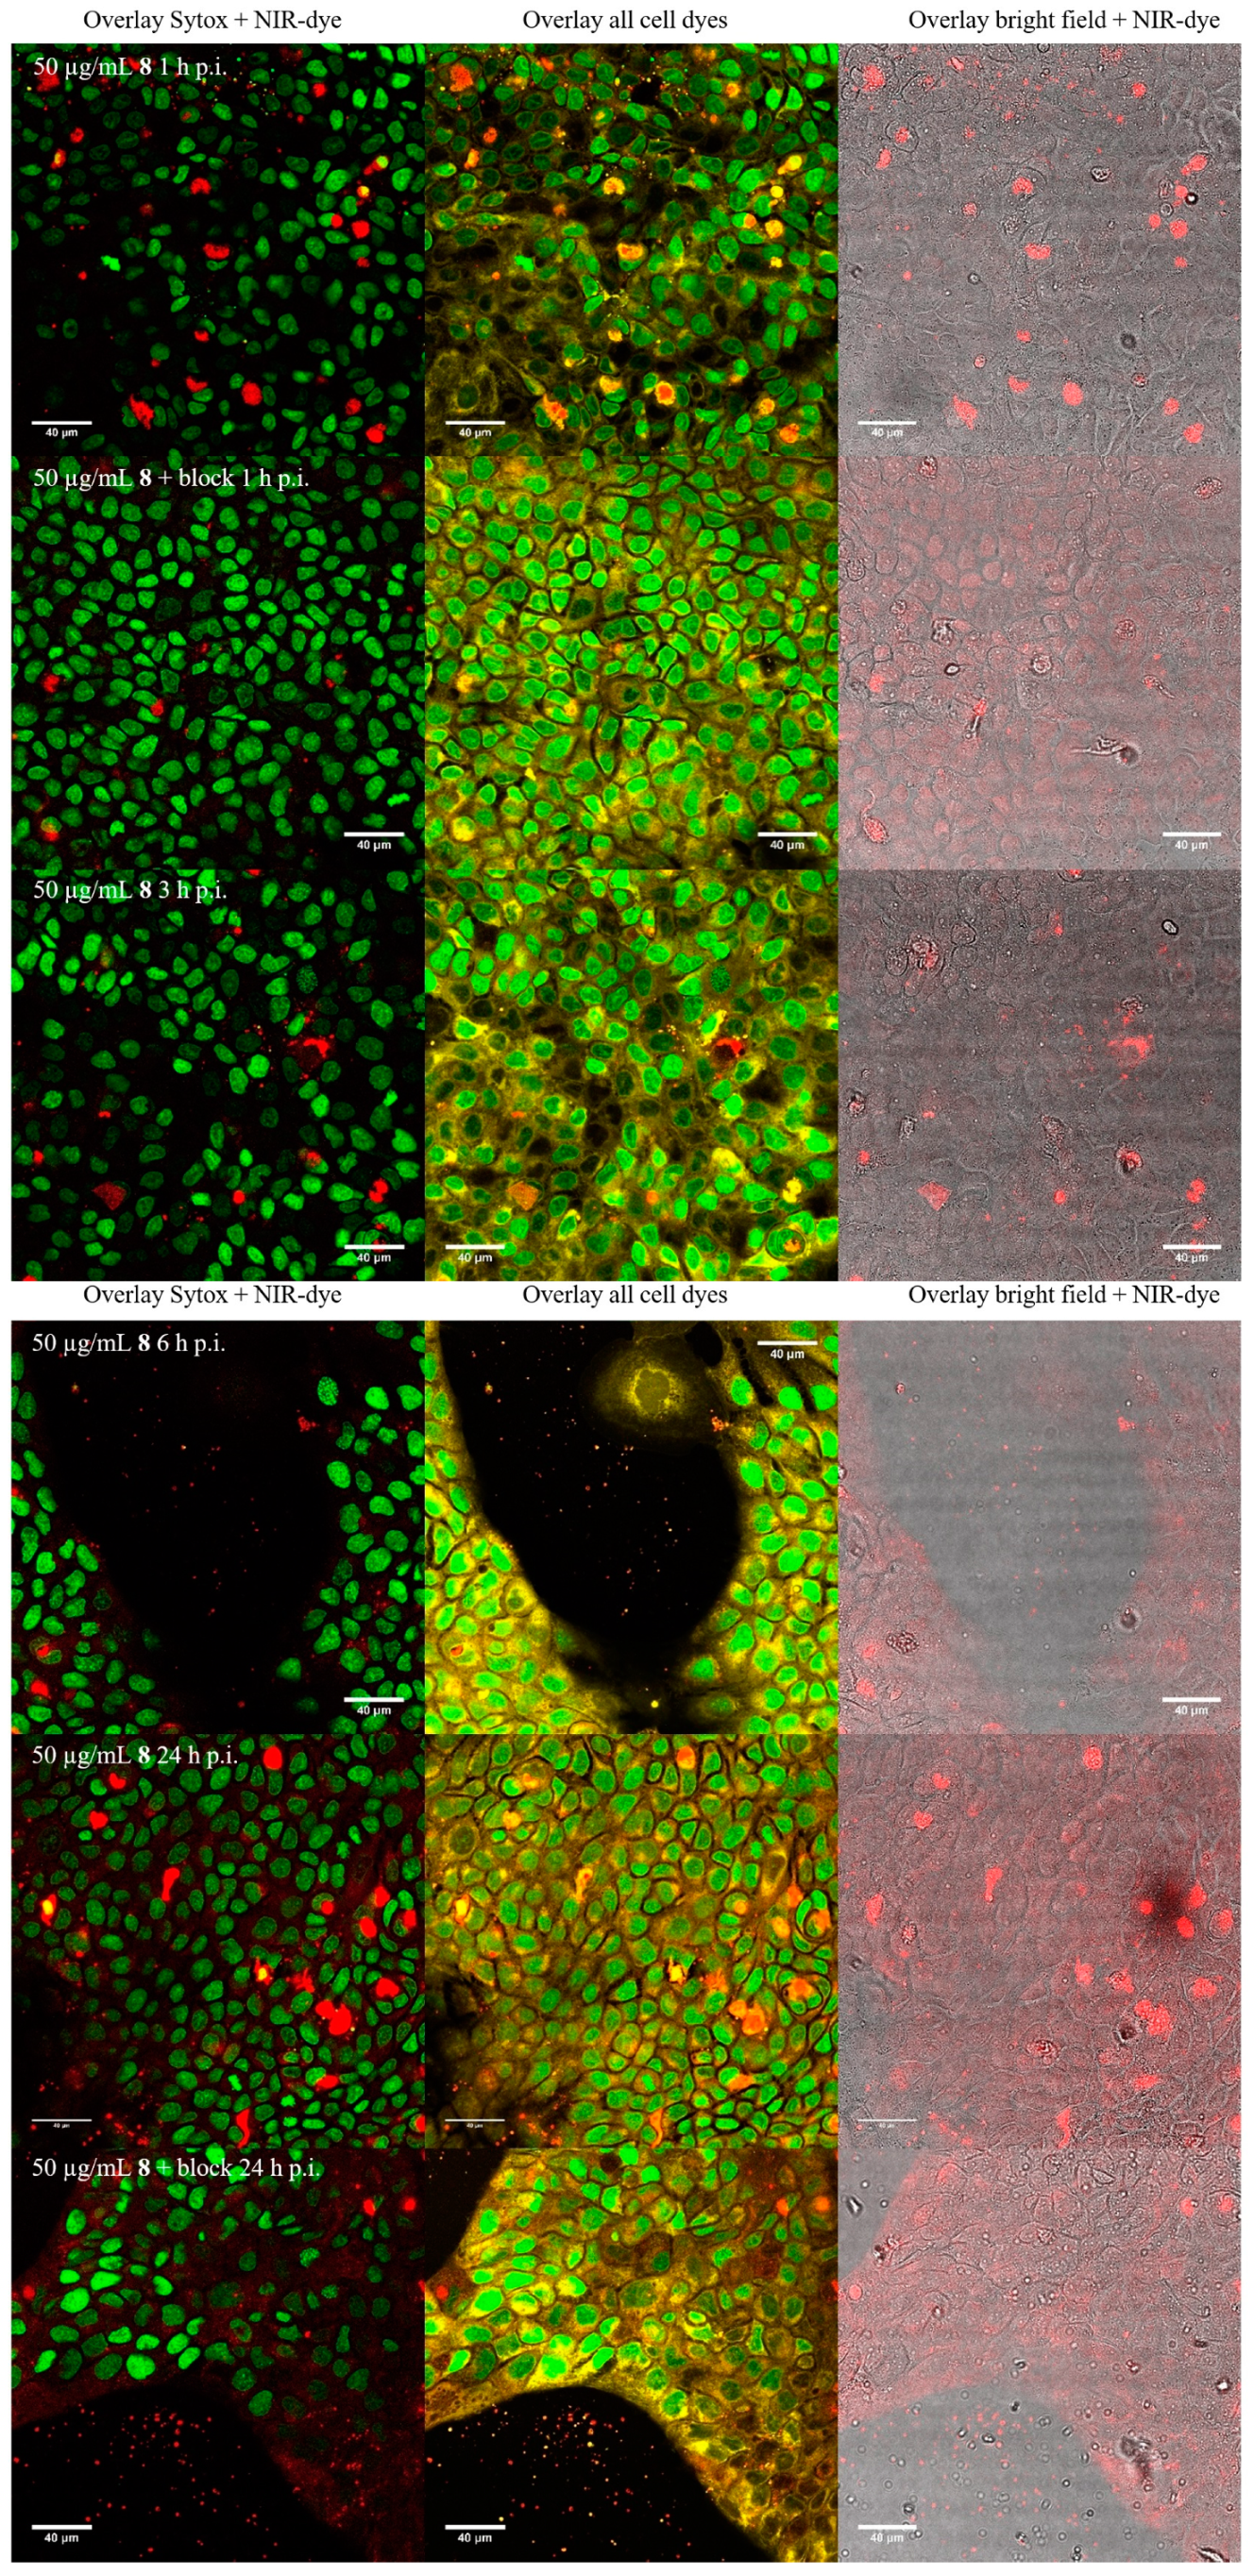
Fluorescence Microscopy In Vitro

Initial cell studies revealed an optimized concentration of 50 µg/mL of AuNP-RGD-NIR-dye 8 for cell imaging. Via confocal fluorescence microscopy, the cell internalization of the particles, vesicle formation, and excretion were verified after 1, 3, 6, and 24 h (Figure A16). The cells start to excrete AuNPs after 3 h. The particles are located in the cytoplasm and not inside the nuclei. Fluorescence microscopy was performed on a Leica TCS SP8 confocal microscope with lasers at λ = 488 nm (Sytox), 552 nm (memOrange), and 638 nm (NIR-dye).
Figure A16. Fluorescence microscopy of A431-cells incubated with AuNP-RGD-NIR-dye 8 at same concentrations (50 µg/mL) at 1, 3, 6, and 24 h (from top to bottom). Left row overlays of Sytox Green and 8 are shown. Middle row overlays of Sytox, membrane orange and 8 are shown. Right row overlays of bright field and 8 are shown. The cell nuclei were stained with Sytox Green and the cytoplasma with membrane Orange.
Nanomaterials 11 00138 g0a16
Figure A17. Evaluation of the irradiation experiments using X-ray in combination with AuNP 1 via gel electrophoresis. Left line is the marker protein. The lowest bands show intact sc-DNA, middle bands show lin-DNA with DSBs, and the highest band show oc-DNA with SSBs. The direction of elution is from top to bottom.
Nanomaterials 11 00138 g0a17
Figure A18. Evaluation of the irradiation experiments using Re-188 in combination with AuNPs 1 via gel electrophoresis. Left line is the marker protein. The lowest bands show intact sc-DNA, middle bands show lin-DNA with DSBs, and the highest band show oc-DNA with SSBs. The direction of elution is from top to bottom.
Nanomaterials 11 00138 g0a18
Figure A19. Evaluation of influence to DNA degradation of AuNP 1 and 7 at a concentration of 1 and 10 µg/mL with and without 2 M DMSO via gel electrophoresis. Left line is the marker protein. The lowest bands show intact sc-DNA, middle bands show lin-DNA with DSBs, and the highest band show oc-DNA with SSBs. The direction of elution is from top to bottom.
Nanomaterials 11 00138 g0a19
Figure A20. Influence of AuNPs 1 and 7 to the degradation of pUC19 DNA applying different concentrations of 0, 1, and 10 µg/µL with and without 2 M DMSO. sc pUC19 is expressed as green bar, the extent of oc is expressed in orange, and the extent of lin plasmid in red.
Nanomaterials 11 00138 g0a20
Figure A21. Toxicology assay for AuNP-PEG 1 with survival fraction 10–100% logarithmic scale (left) and 80–110% linear scale (right).
Nanomaterials 11 00138 g0a21
Figure A22. Colony formation assay with survival fraction 0–105% linear (left) and zoom 0–45% linear (right).
Nanomaterials 11 00138 g0a22

Appendix D. Animal Experiments

Figure A23. Regions of interest (ROIs) of organs during live imaging in vivo 48 h p.i. as example for AuNP-RGD-NIR-dye 8: ratio-to-muscle of kidneys 2.40 ± 0.12, tumor 1.47 ± 0.07, and liver 2.20 ± 0.11.
Nanomaterials 11 00138 g0a23
Figure A24. Ex vivo biodistribution of AuNP-RGD-NIR-dye 8 at A431-tumor-bearing mouse.
Nanomaterials 11 00138 g0a24
Table A1. Biodistribution of AuNP-RGD-NIR-dye 8 in A431 tumor-bearing mice. MFU = Mean fluorescence units.
OrganWeight [g]MFU/gRatio-to-Muscle/g
pancreas0.38750893.53
kidney left0.38376515.31
kidney right0.38479755.54
heart0.22657303.98
lung0.23637092.58
muscle0.55814401.00
brain0.41736902.56
intestine large1.0969830.68
spleen0.22848573.37
stomach0.25249233.42
intestine small2.5374990.35
liver3.2159270.64
gall
bladder0.0343032921.06
tumor0.14863464.41

References

  1. Sheppard, C.W.; Goodell, J.P.B.; Hahn, P.F. Colloidal gold containing the radioactive isotope Au198 in the selective internal radiation therapy of diseases of the lymphoid system. J. Lab. Clin. Med. 1947, 12, 1437–1441. [Google Scholar]
  2. Flocks, R.H.; Kerr, H.D.; Elkins, H.B.; Culp, D. Treatment of carcinoma of the prostate by interstitial radiation with radio-active gold (Au 198): A preliminary report. J. Urol. 1952, 68, 510–522. [Google Scholar] [CrossRef]
  3. Penninckx, S.; Heuskin, A.C.; Michiels, C.; Lucas, S. Gold nanoparticles as a potent radiosensitizer: A transdisciplinary approach from physics to patient. Cancers 2020, 12, 2021. [Google Scholar] [CrossRef]
  4. Hainfeld, J.F.; Slatkin, D.N.; Focella, T.M.; Smilowitz, H.M. Gold nanoparticles: A new X-ray contrast agent. Br. J. Radiol. 2006, 79, 248–253. [Google Scholar] [CrossRef] [PubMed]
  5. Qian, X.; Peng, X.H.; Ansari, D.O.; Yin-Goen, Q.; Chen, G.Z.; Shin, D.M.; Yang, L.; Young, A.N.; Wang, M.D.; Nie, S. In vivo tumor targeting and spectroscopic detection with surface-enhanced Raman nanoparticle tags. Nat. Biotechnol. 2008, 26, 83–90. [Google Scholar] [CrossRef] [PubMed]
  6. Huang, X.; Neretina, S.; El-Sayed, M.A. Gold nanorods: From synthesis and properties to biological and biomedical applications. Adv. Mater. 2009, 21, 4880–4910. [Google Scholar] [CrossRef]
  7. Li, W.; Chen, X. Gold nanoparticles for photoacoustic imaging. Nanomed. Nanotechnol. Biol. Med. 2015, 10, 299–320. [Google Scholar] [CrossRef] [Green Version]
  8. Kim, M.S.; Lee, E.J.; Kim, J.W.; Chung, U.S.; Koh, W.G.; Keum, K.C.; Koom, W.S. Gold nanoparticles enhance anti-tumor effect of radiotherapy to hypoxic tumor. Radiat. Oncol. J. 2016, 34, 230–238. [Google Scholar] [CrossRef]
  9. Black, K.C.L.; Wang, Y.; Luehmann, H.P.; Cai, X.; Xing, W.; Pang, B.; Zhao, Y.; Cutler, C.S.; Wang, L.V.; Liu, Y.; et al. Radioactive 198Au-Doped Nanostructures with Different Shapes for In Vivo Analyses of Their Biodistribution, Tumor Uptake, and Intratumoral Distribution. ACS Nano 2014, 8, 4385–4394. [Google Scholar] [CrossRef]
  10. Cui, S.; Yin, D.; Chen, Y.; Di, Y.; Chen, H.; Ma, Y.; Achilefu, S.; Gu, Y. In vivo targeted deep-tissue photodynamic therapy based on near-infrared light triggered upconversion nanoconstruct. ACS Nano 2013, 7, 676–688. [Google Scholar] [CrossRef]
  11. Shukla, R.; Chanda, N.; Zambre, A.; Upendran, A.; Katti, K.; Kulkarni, R.R.; Nune, S.K.; Casteel, S.W.; Smith, C.J.; Vimal, J.; et al. Laminin receptor specific therapeutic gold nanoparticles (198AuNP-EGCg) show efficacy in treating prostate cancer. Proc. Natl. Acad. Sci. USA 2012, 109, 12426–12431. [Google Scholar] [CrossRef] [PubMed] [Green Version]
  12. Maeda, H.; Fang, J.; Inutsuka, T.; Kitamoto, Y. Vascular permeability enhancement in solid tumor: Various factors, mechanisms involved and its implications. Int. Immunopharmacol. 2003, 3, 319–328. [Google Scholar] [CrossRef]
  13. Zarschler, K.; Rocks, L.; Licciardello, N.; Boselli, L.; Polo, E.; Garcia, K.P.; De Cola, L.; Stephan, H.; Dawson, K.A. Ultrasmall inorganic nanoparticles: State-of-the-art and perspectives for biomedical applications. Nanomed. Nanotechnol. Biol. Med. 2016, 12, 1663–1701. [Google Scholar] [CrossRef] [PubMed]
  14. Frens, G. Controlled Nucleation for the Regulation of the Particle Size in Monodisperse Gold Suspensions. Nat. Phys. Sci. 1973, 241, 20–22. [Google Scholar] [CrossRef]
  15. Brust, M.; Walker, M.; Bethell, D.; Schiffrin, D.J.; Whyman, R. Synthesis of Thiol-derivatised Gold Nanoparticles in a Two-phase Liquid-Liquid System. J. Chem. Soc. Chem. Commun. 1994, 801–802. [Google Scholar] [CrossRef]
  16. Turkevich, J. Colloidal Gold. Part I—Historical and preparative aspects, morphology and structure. Gold Bull. 1985, 18, 86–91. [Google Scholar] [CrossRef] [Green Version]
  17. Waters, C.A.; Mills, A.J.; Johnson, K.A.; Schiffrin, D.J. Purification of dodecanethiol derivatised gold nanoparticles. Chem. Commun. 2003, 540–541. [Google Scholar] [CrossRef]
  18. Bielinska, A.; Eichman, J.D.; Lee, I.; Baker, J.R., Jr.; Balogh, L. Imaging {Au0-PAMAM} gold-dendrimer nanocomposites in cells. J. Nanopart. Res. 2002, 4, 395–403. [Google Scholar] [CrossRef]
  19. Häkkinen, H. The gold-sulfur interface at the nanoscale. Nat. Chem. 2012, 4, 443–455. [Google Scholar] [CrossRef]
  20. Cui, M.; Liu, R.; Deng, Z.; Ge, G.; Liu, Y.; Xie, L. Quantitative study of protein coronas on gold nanoparticles with different surface modifications. Nano Res. 2014, 7, 345–352. [Google Scholar] [CrossRef]
  21. Dai, Q.; Walkey, C.; Chan, W.C. Polyethylene glycol backfilling mitigates the negative impact of the protein corona on nanoparticle cell targeting. Angew. Chem. Int. Ed. 2014, 53, 5093–5096. [Google Scholar] [CrossRef]
  22. Kao, H.W.; Lin, Y.Y.; Chen, C.C.; Chi, K.H.; Tien, D.C.; Hsia, C.C.; Lin, W.J.; Chen, F.D.; Lin, M.H.; Wang, H.E. Biological characterization of cetuximab-conjugated gold nanoparticles in a tumor animal model. Nanotechnology 2014, 25, 295102. [Google Scholar] [CrossRef] [PubMed]
  23. Chanda, N.; Kattumuri, V.; Shukla, R.; Zambre, A.; Katti, K.; Upendran, A.; Kulkarni, R.R.; Kan, P.; Fent, G.M.; Casteel, S.W.; et al. Bombesin functionalized gold nanoparticles show in vitro and in vivo cancer receptor specificity. Proc. Natl. Acad. Sci. USA 2010, 107, 8760–8765. [Google Scholar] [CrossRef] [PubMed] [Green Version]
  24. Kattumuri, V.; Katti, K.; Bhaskaran, S.; Boote, E.J.; Casteel, S.W.; Fent, G.M.; Robertson, D.J.; Chandrasekhar, M.; Kannan, R.; Katti, K.V. Gum arabic as a phytochemical construct for the stabilization of gold nanoparticles: In vivo pharmacokinetics and X-ray-contrast-imaging studies. Small 2007, 3, 333–341. [Google Scholar] [CrossRef] [PubMed]
  25. Chanda, N.; Kan, P.; Watkinson, L.D.; Shukla, R.; Zambre, A.; Carmack, T.L.; Engelbrecht, H.; Lever, J.R.; Katti, K.; Fent, G.M.; et al. Radioactive gold nanoparticles in cancer therapy: Therapeutic efficacy studies of GA-198AuNP nanoconstruct in prostate tumor-bearing mice. Nanomed. Nanotechnol. Biol. Med. 2010, 6, 201–209. [Google Scholar] [CrossRef]
  26. Pretze, M.; Hien, A.; Roscher, M.; Richter, K.; Rädle, M.; Wängler, C.; Wängler, B. Efficient modification of GRPR-specific gold nanoparticles for fluorescence imaging of prostate carcinoma. J. Labelled Compd. Radiopharm. 2017, 60, S601. [Google Scholar] [CrossRef] [Green Version]
  27. Hien, A.; Pretze, M.; Braun, F.; Schäfer, E.; Kümmel, T.; Roscher, M.; Schock-Kusch, D.; Waldeck, J.; Müller, B.; Wängler, C.; et al. Non-contact recognition of fluorescently labeled objects in deep tissue via optimized optical arrangement. PLoS ONE 2018, 13, e0208236. [Google Scholar] [CrossRef]
  28. Zhu, J.; Chin, J.; Wängler, C.; Wängler, B.; Lennox, R.B.; Schirrmacher, R. Rapid 18F-labeling and loading of PEGylated gold nanoparticles for in vivo applications. Bioconjug. Chem. 2014, 25, 1143–1150. [Google Scholar] [CrossRef]
  29. Zhao, Y.; Sultan, D.; Detering, L.; Cho, S.; Sun, G.; Pierce, R.; Wooley, K.L.; Liu, Y. Copper-64-alloyed gold nanoparticles for cancer imaging: Improved radiolabel stability and diagnostic accuracy. Angew. Chem. Int. Ed. 2014, 53, 156–159. [Google Scholar] [CrossRef]
  30. Pretze, M.; van der Meulen, N.P.; Wängler, C.; Schibli, R.; Wängler, B. Targeted 64Cu-labeled gold nanoparticles for dual imaging with positron emission tomography and optical imaging. J. Labelled Comp. Radiopharm. 2019, 62, 471–482. [Google Scholar] [CrossRef]
  31. Jiménez-Mancilla, N.; Ferro-Flores, G.; Santos-Cuevas, C.; Ocampo-García, B.; Luna-Gutiérrez, M.; Azorín-Vega, E.; Isaac-Olivé, K.; Camacho-López, M.; Torres-García, E. Multifunctional targeted therapy system based on 99mTc/177Lu-labeled gold nanoparticles-Tat(49-57)-Lys3-bombesin internalized in nuclei of prostate cancer cells. J. Labelled Compd. Radiopharm. 2013, 56, 663–671. [Google Scholar] [CrossRef] [PubMed]
  32. Eskandari, N.; Yavari, K.; Outokesh, M.; Sadjadi, S.; Ahmadi, S.J. Iodine-131 radiolabeling of poly ethylene glycol-coated gold nanorods for in vivo imaging. J. Labelled Compd. Radiopharm. 2013, 56, 12–16. [Google Scholar] [CrossRef] [PubMed]
  33. Milne, M.; Gobbo, P.; McVicar, N.; Bartha, R.; Workentin, M.S.; Hudson, R.H.E. Water-soluble gold nanoparticles (AuNP) functionalized with a gadolinium(III) chelate via Michael addition for use as a MRI contrast agent. J. Mater. Chem. B 2013, 1, 5628–5635. [Google Scholar] [CrossRef] [PubMed]
  34. Chen, Q.; Wang, H.; Liu, H.; Wen, S.; Peng, C.; Shen, M.; Zhang, G.; Shi, X. Multifunctional Dendrimer-Entrapped Gold Nanoparticles Modified with RGD Peptide for Targeted Computed Tomography/Magnetic Resonance Dual-Modal Imaging of Tumors. Anal. Chem. 2015, 87, 3949–3956. [Google Scholar] [CrossRef]
  35. Maccora, D.; Dini, V.; Battocchio, C.; Fratoddi, I.; Cartoni, A.; Rotili, D.; Castagnola, M.; Faccini, R.; Bruno, I.; Scotognella, T.; et al. Gold nanoparticles and nanorods in nuclear medicine: A mini review. Appl. Sci. 2019, 9, 3232. [Google Scholar] [CrossRef] [Green Version]
  36. Mayo, R.L.; Robinson, F.R.S. Auger and secondary X-ray electrons from gold. Royal Soc. Pub. 1939, 173, 192–200. [Google Scholar]
  37. Zhang, X.D.; Wu, D.; Shen, X.; Chen, J.; Sun, Y.M.; Liu, P.X.; Liang, X.J. Size-dependent radiosensitization of PEG-coated gold nanoparticles for cancer radiation therapy. Biomaterials 2012, 33, 6408–6419. [Google Scholar] [CrossRef] [Green Version]
  38. Hainfeld, J.F.; Slatkin, D.N.; Smilowitz, H.M. The use of gold nanoparticles to enhance radiotherapy in mice. Phys. Med. Biol. 2004, 49, N309–N315. [Google Scholar] [CrossRef]
  39. Säterborg, N.E. The distribution of 198Au injected intravenously as a colloid and in solution. Acta Radiol. Ther. Phys. Biol. 1973, 12, 509–528. [Google Scholar] [CrossRef]
  40. Khan, M.K.; Minc, L.D.; Nigavekar, S.S.; Kariapper, M.S.T.; Nair, B.M.; Schipper, M.; Cook, A.C.; Lesniak, W.G.; Balogh, L.P. Fabrication of {198Au0} radioactive composite nanodevices and their use for nano-brachytherapy. Nanomed. Nanotechnol. Biol. Med. 2008, 4, 57–69. [Google Scholar] [CrossRef] [Green Version]
  41. Chakravarty, R.; Chakraborty, S.; Guleria, A.; Kumar, C.; Kunwar, A.; Nair, K.V.V.; Sarma, H.D.; Dash, A. Clinical scale synthesis of intrinsically radiolabeled and cyclic RGD peptide functionalized 198Au nanoparticles for targeted cancer therapy. Nucl. Med. Biol. 2019, 72–73, 1–10. [Google Scholar] [CrossRef] [PubMed]
  42. Zhu, J.; Waengler, C.; Lennox, R.B.; Schirrmacher, R. Preparation of water-soluble maleimide-functionalized 3 nm gold nanoparticles: A new bioconjugation template. Langmuir ACS J. Surf. Colloids 2012, 28, 5508–5512. [Google Scholar] [CrossRef] [PubMed]
  43. Pretze, M.; Hien, A.; Rädle, M.; Schirrmacher, R.; Wängler, C.; Wängler, B. Gastrin-releasing peptide receptor- and prostate-specific membrane antigen-specific ultrasmall gold nanoparticles for characterization and diagnosis of prostate carcinoma via fluorescence imaging. Bioconjug. Chem. 2018, 29, 1525–1533. [Google Scholar] [CrossRef] [PubMed]
  44. Dijkgraaf, I.; Yim, C.B.; Franssen, G.M.; Schuit, R.C.; Luurtsema, G.; Liu, S.; Oyen, W.J.; Boerman, O.C. PET imaging of αvβ3 integrin expression in tumours with 68Ga-labelled mono-, di- and tetrameric RGD peptides. Eur. J. Nucl. Med. Mol. Imaging 2011, 38, 128–137. [Google Scholar] [CrossRef] [Green Version]
  45. Janssen, M.; Oyen, W.J.G.; Massuger, L.F.A.G.; Frielink, C.; Dijkgraaf, I.; Edwards, D.S.; Radjopadhye, M.; Corstens, F.H.M.; Boerman, O.C. Comparison of a monomeric and dimeric radiolabeled RGD-peptide for tumor targeting. Canc. Biother. Radiopharm. 2002, 17, 641–646. [Google Scholar] [CrossRef]
  46. Zhai, C.; Franssen, G.M.; Petrik, M.; Laverman, P.; Summer, D.; Rangger, C.; Haubner, R.; Haas, H.; Decristoforo, C. Comparison of Ga-68-Labeled Fusarinine C-Based Multivalent RGD Conjugates and [68Ga]NODAGA-RGD–In Vivo Imaging Studies in Human Xenograft Tumors. Mol. Imaging Biol. 2016. [Google Scholar] [CrossRef] [Green Version]
  47. Liu, Z.; Wang, F.; Chen, X. Integrin αvβ3-targeted cancer therapy. Drug. Dev. Res. 2008, 69, 329–339. [Google Scholar] [CrossRef] [Green Version]
  48. Lindner, S.; Michler, C.; Leidner, S.; Rensch, C.; Wangler, C.; Schirrmacher, R.; Bartenstein, P.; Wangler, B. Synthesis and in vitro and in vivo evaluation of SiFA-tagged bombesin and RGD peptides as tumor imaging probes for positron emission tomography. Bioconjug. Chem. 2014, 25, 738–749. [Google Scholar] [CrossRef]
  49. Ebert, B.; Riefke, B.; Sukowski, U.; Licha, K. Cyanine dyes as contrast agents for near-infrared imaging in vivo: Acute tolerance, pharmacokinetics, and fluorescence imaging. J. Biomed. Opt. 2011, 16, 066003. [Google Scholar] [CrossRef]
  50. Bailey, G.C.; Swager, T.M. Masked Michael acceptors in poly(phenyleneethynylene)s for facile conjugation. Macromolecules 2006, 39, 2815–2818. [Google Scholar] [CrossRef]
  51. Licha, K.; Riefke, B.; Ntziachristos, V.; Becker, A.; Chance, B.; Semmler, W. Hydrophilic cyanine dyes as contrast agents for near-infrared tumor imaging: Synthesis, photophysical properties and spectroscopic characterization. Photochem. Photobiol. 2000, 72, 392–398. [Google Scholar] [CrossRef]
  52. Apelgot, S.; Coppey, J.; Gaudemer, A.; Grisvard, J.; Guille, E.; Sasaki, I.; Sissoeff, I. Similar lethal effect in mammalian cells for two radioisotopes of copper with different decay schemes, 64Cu and 67Cu. Int. J. Radiat. Biol. 1989, 55, 365–384. [Google Scholar] [CrossRef] [PubMed]
  53. Freudenberg, R.; Runge, R.; Maucksch, U.; Berger, V.; Kotzerke, J. On the dose calculation at the cellular level and its implications for the RBE of 99mTc and 123I. Med. Phys. 2014, 41, 062503. [Google Scholar] [CrossRef] [PubMed]
  54. Yu, Z.-W.; Quinn, P.J. Dimethyl sulphoxide: A review of its applications in cell biology. Biosci. Rep. 1994, 14, 259–281. [Google Scholar] [CrossRef]
  55. Freudenberg, R. Monte-Carlo-Simulationen zur Dosimetrie bei der Zellexposition mit Offenen Radionukliden in Typischen In-vitro Bestrahlungsgeometrien. Dissertation, Technical University Dresden, Dresden, Germany. 2012. Available online: https://eltab.ub.uni-kl.de/media/103162/ (accessed on 5 October 2020).
  56. Makrigiorgos, G.; Adelstein, S.J.; Kassis, A.I. Auger electron emitters: Insights gained from in vitro experiments. Radiat. Environ. Biophys. 1990, 29, 75–91. [Google Scholar] [CrossRef]
  57. Hauck, T.S.; Ghazani, A.A.; Chan, W.C. Assessing the effect of surface chemistry on gold nanorod uptake, toxicity, and gene expression in mammalian cells. Small 2008, 4, 153–159. [Google Scholar] [CrossRef]
  58. Pan, Y.; Neuss, S.; Leifert, A.; Fischler, M.; Wen, F.; Simon, U.; Schmid, G.; Brandau, W.; Jahnen-Dechent, W. Size-dependent cytotoxicity of gold nanoparticles. Small 2007, 3, 1941–1949. [Google Scholar] [CrossRef]
  59. Mironava, T.; Hadjiargyrou, M.; Simon, M.; Jurukovski, V.; Rafailovich, M.H. Gold nanoparticles cellular toxicity and recovery: Effect of size, concentration and exposure time. Nanotoxicology 2010, 4, 120–137. [Google Scholar] [CrossRef]
  60. Cai, Q.Y.; Yu, P.; Besch-Williford, C.; Smith, C.J.; Sieckman, G.L.; Hoffman, T.J.; Ma, L. Near-infrared fluorescence imaging of gastrin releasing peptide receptor targeting in prostate cancer lymph node metastases. Prostate 2013, 73, 842–854. [Google Scholar] [CrossRef]
  61. Chen, H.; Wan, S.; Zhu, F.; Wang, C.; Cui, S.; Du, C.; Ma, Y.; Gu, Y. A fast tumor-targeting near-infrared fluorescent probe based on bombesin analog for in vivo tumor imaging. Contrast Media Mol. Imaging 2014, 9, 122–134. [Google Scholar] [CrossRef]
  62. Ma, L.; Yu, P.; Veerendra, B.; Rold, T.L.; Retzloff, L.; Prasanphanich, A.; Sieckman, G.; Hoffman, T.J.; Volkert, W.A.; Smith, C.J. In vitro and in vivo evaluation of alexa fluor 680-bombesin[7–14]NH2 peptide conjugate, a high-affinity fluorescent probe with high selectivity for the gastrinreleasing peptide receptor. Mol. Imaging 2005, 16, 171–180. [Google Scholar]
  63. Herdt, A.R.; Drawz, S.M.; Kang, Y.; Taton, T.A. DNA dissociation and degradation at gold nanoparticle surfaces. Colloids Surf. B 2006, 51, 130–139. [Google Scholar] [CrossRef] [PubMed]
  64. Bhatt, N.; Huang, P.J.; Dave, N.; Liu, J. Dissociation and degradation of thiol-modified DNA on gold nanoparticles in aqueous and organic solvents. Langmuir ACS J. Surf. Colloids 2011, 27, 6132–6137. [Google Scholar] [CrossRef] [PubMed] [Green Version]
  65. Igaz, N.; Szoke, K.; Kovacs, D.; Buhala, A.; Varga, Z.; Belteky, P.; Razga, Z.; Tiszlavicz, L.; Vizler, C.; Hideghety, K.; et al. Synergistic radiosensitization by gold nanoparticles and the histone deacetylase inhibitor SAHA in 2D and 3D cancer cell cultures. Nanomaterials 2020, 10, 158. [Google Scholar] [CrossRef] [Green Version]
  66. Kassis, A.I. Molecular and cellular radiobiological effects of Auger emitting radionuclides. Radiat. Prot. Dosim. 2011, 143, 241–247. [Google Scholar] [CrossRef] [Green Version]
  67. McQuaid, H.N.; Muir, M.F.; Taggart, L.E.; McMahon, S.J.; Coulter, J.A.; Hyland, W.B.; Jain, S.; Butterworth, K.T.; Schettino, G.; Prise, K.M.; et al. Imaging and radiation effects of gold nanoparticles in tumour cells. Sci. Rep. 2016, 6, 19442. [Google Scholar] [CrossRef]
  68. Sun, X.; Huang, X.; Yan, X.; Wang, Y.; Guo, J.; Jacobson, O.; Liu, D.; Szajek, L.P.; Zhu, W.; Niu, G.; et al. Chelator-free 64Cu-integrated gold nanomaterials for positron emission tomography imaging guided photothermal cancer therapy. ACS Nano 2014, 8, 8438–8446. [Google Scholar] [CrossRef] [Green Version]
  69. Licha, K.; Hessenius, C.; Becker, A.; Henklein, P.; Bauer, M.; Wisniewski, S.; Wiedenmann, B.; Semmler, W. Synthesis, characterization, and biological properties of cyanine-labeled somatostatin analogues as receptor-targeted fluorescent probes. Bioconjug. Chem. 2001, 12, 44–50. [Google Scholar] [CrossRef]
  70. Haiss, W.; Nguyen, T.K.T.; Aveyard, J.; Fernig, D.G. Determination of Size and Concentration of Gold Nanoparticles from UV-Vis Spectra. Anal. Chem. 2007, 79, 4215–4221. [Google Scholar] [CrossRef]
Figure 1. Synthesis of the different RGD-functionalized AuNPs 7 and 8.
Nanomaterials 11 00138 g001
Figure 2. (a) Three representative IC50-curves from single competitive binding experiments. Shown is one curve with single IC50 value out of three values from three different experiments. (b) Cell uptake studies of AuNPs 8 in A431 cells at different time points obtained without blocking (red) and with a 10-fold excess of c(RGDfK) (green).
Nanomaterials 11 00138 g002
Figure 3. Irradiation experiments applying different doses of 25, 40, 50, 75, and 100 Gy for pUC19 only, pUC19 with AuNPs 1, and pUC19 with AuNPs 1 in presence of 2 M DMSO. sc pUC19 is expressed as green bar, the extent of oc is expressed in orange, and the extent of lin plasmid in red.
Nanomaterials 11 00138 g003
Figure 4. Irradiation experiments with 27.5 Gy Re-188 at different concentrations of AuNP-PEG 1 for pUC19 only, pUC19 with AuNPs and pUC19 with AuNPs in combination with DMSO. sc pUC19 is expressed as green bar, the extend of oc is expressed in orange and the extend of lin plasmid in red.
Nanomaterials 11 00138 g004
Figure 5. Survival fractions in logarithmic scale of the colony formation assays at different X-ray doses (0–10 Gy) with AuNPs 1 (red), AuNPs 7 (green), and without AuNPs (blue) incubation. Single colony formation assays (CFAs) with DMSO are shown at 2 Gy for AuNPs 1 (light red) and AuNPs 7 (light green) and at 0 Gy in absence of AuNP (light blue).
Nanomaterials 11 00138 g005
Figure 6. In vivo biodistribution of 50 µg/100 µL AuNPs 8 in a A431-tumorbearing mouse: (a) fluorescence before injection, (b) 4 h p.i., (c) 21 h p.i., (d) 28 h p.i., (e) 48 h p.i., and (f) 72 h p.i. Ratio tumor:muscle:liver:kidney/g = 4.4:1.0:0.6:5.4 (e).
Nanomaterials 11 00138 g006
Figure 7. Biodistribution of AuNPs 8 at 72 h p.i. Values are given in measured fluorescence units per organ weight (n = 2).
Nanomaterials 11 00138 g007
Table 1. Calculated number of ligands and resulting molecular mass of the AuNPs and retention in HPLC.
ProbeDescriptionNumber of LigandsMolecular Mass [kDa]Retention Time HPLC [min]
1AuNP-PEG500 PEG3-OH3456.48
2aAuNP-PEG-maleimide130 PEG4-maleimide3616.10
7AuNP-RGD60 RGD4055.98
8AuNP-RGD-NIR-dye~50 RGD, 10 NIR-dye4136.20
Table 2. Different expressions of the hydrodynamic radius of the AuNPs measured by DLS.
ProbeSize by Number [nm]Size by Volume [nm]Z-Averge [nm]PDI
17.28.73110.555
2a14.113.62090.456
733.832.67130.883
853.859.81740.403
Publisher’s Note: MDPI stays neutral with regard to jurisdictional claims in published maps and institutional affiliations.

