Article

Magnetocrystalline and Surface Anisotropy in CoFe2O4 Nanoparticles

1
Institute of Structure of Matter–CNR, Monterotondo Stazione, 00016 Rome, Italy
2
Institute of Physics, Mathematics and Information Technology, Immanuel Kant Baltic Federal University, 236041 Kaliningrad, Russia
3
Department of Physics, University of Oviedo, 33204 Gijón, Spain
4
The Department of Physical and Chemical Science, University of L’Aquila, Via Vetoio, Coppito, 67100 L’Aquila, Italy
5
Department of Geological and Chemical Sciences, University of Cagliari, Cittadella Universitaria, 09042 Monserrato, Italy
6
National Interuniversity Consortium of Materials Science and Technology (INSTM), Via Giuseppe Giusti 9, 50121 Firenze, Italy
7
Department of Chemistry and Industrial Chemistry (DCIC), University of Genova, 16146 Genova, Italy
*
Author to whom correspondence should be addressed.
Nanomaterials 2020, 10(7), 1288; https://doi.org/10.3390/nano10071288
Submission received: 19 May 2020 / Revised: 13 June 2020 / Accepted: 26 June 2020 / Published: 30 June 2020
(This article belongs to the Special Issue Applications and Properties of Magnetic Nanoparticles)

Abstract

:
The effect of the annealing temperature Tann on the magnetic properties of cobalt ferrite nanoparticles embedded in an amorphous silica matrix (CoFe2O4/SiO2), synthesized by a sol-gel auto-combustion method, was investigated by magnetization and AC susceptibility measurements. For samples with 15% w/w nanoparticle concentration, the particle size increases from ~2.5 to ~7 nm, increasing Tann from 700 to 900 °C. The effective magnetic anisotropy constant (Keff) increases with decreasing Tann, due to the increase in the surface contribution. For a 5% w/w sample annealed at 900 °C, Keff is much larger (1.7 × 10⁶ J/m3) than that of the 15% w/w sample (7.5 × 10⁵ J/m3) annealed at 700 °C and showing comparable particle size. This indicates that the effect of the annealing temperature on the anisotropy is not only the control of the particle size but also on the core structure (i.e., cation distribution between the two spinel sublattices and degree of spin canting), strongly affecting the magnetocrystalline anisotropy. The results provide evidence that the magnetic anisotropy comes from a complex balance between core and surface contributions that can be controlled by thermal treatments.

Graphical Abstract

1. Introduction

Within the last few years, magnetic nanoparticles have contributed to the development of a variety of cutting edge technologies in fields such as ferrofluids [1], microwave devices [2], biomedicine [3,4], or catalysis [5,6]. The growing interest that magnetic nanoparticles attract demands a fundamental understanding of their properties, which are very different from their bulk counterparts. In this context, spinel ferrites are excellent candidates thanks to their tunable physico-chemical properties [7]. Their general chemical formula is MFe2O4, where M2+ can be any divalent metal (e.g., M2+ = Fe2+, Co2+, Zn2+, Ni2+, Mn2+, etc.). The atomic arrangement corresponds to a face-centered cubic structure of the oxygen atoms, with Fe3+ and M2+ occupying the tetrahedral (Td) and octahedral (Oh) sites [7]. Such a structure makes magnetic spinel nanoparticles particularly attractive. It provides a tool to tailor their magnetic properties (e.g., magnetic crystalline anisotropy and saturation magnetization) by the variation of the cation distribution between the two sublattices. This can be done by changing the chemical composition, the preparation method, and thermal treatments [8,9,10].
Magnetic properties of spinel ferrite nanoparticles are also strongly affected by the presence of a non-collinear spin structure (i.e., spin canting). The spin-canting is due to competing interactions between sublattices [11,12], as confirmed by polarized neutron scattering [13] and 57Fe Mössbauer experiments [14,15]. This symmetry breaking induces changes in the topology of the surface magnetic moments and, consequently, in the exchange integrals (through super-exchange angles and/or distances between moments), thus leading to a change in the surface anisotropy [15]. Therefore, the magnetic properties of ferrite nanoparticles with a spinel structure are due to a complex interplay of several effects, among which surface disorder, cationic distribution, and spin canting are dominant [14,16].
The present work is aimed at investigating the effect of the annealing temperature on the magnetic properties of nanocomposites consisting of CoFe2O4 nanoparticles dispersed in a silica matrix (CoFe2O4/SiO2). The results show that the thermal treatment plays an important role, along with the particle size, in controlling the surface and core contributions to the magnetic anisotropy and saturation magnetization.

2. Materials and Methods

A set of CoFe2O4 nanoparticles uniformly embedded in a silica matrix with 15% (w/w) concentration of the magnetic phase were synthesized by a sol-gel auto-combustion method and treated afterward at three different annealing temperatures (Tann = 700, 800 and 900 °C). Synthesis and morpho-structural characterization of all the samples was already described in detail elsewhere [8,14,17,18]
The Fe(NO3)3∙9H2O (Sigma Aldrich 98%, Darmstadt, Germany), Co(NO3)2∙6H2O (Sigma Aldrich 98%, Darmstadt, Germany), citric acid (Sigma Aldrich 99.5%, Darmstadt, Germany) and of 25% ammonia solution (Carlo Erba Reagenti SpA, Cornaredo, Italy) were used without further purification. In this process, 1-molar iron and cobalt nitrate aqueous solutions in a 2:1 ratio, respectively, and citric acid (CA) with 1:1 molar ratio of metals to CA were prepared, and pH-adjusted to ~2 by aqueous ammonia addition. Tetraethoxysilane (TEOS, Sigma Aldrich 98%, Darmstadt, Germany) in ethanol was used as a silica precursor and, after its addition and vigorous stirring for 30 min, the sols were placed in an oven to gel in static air at 40 °C for 24 h. The gels underwent successively a thermal treatment at 300 °C for 15 min, where the auto-combustion reaction took place.
The temperature was then raised to 900 °C in steps of 100 °C and kept for 1 h at the treatment temperature. The X-ray diffraction (XRD) patterns [18] (Figure S1, reported in supporting materials) show a big halo due to the amorphous silica; the main reflections due to the cubic cobalt ferrite phase start to appear at 700 °C, and they become more and more evident at 800 and 900 °C [18]. For this reason, investigation of the magnetic properties was focused on samples treated at 700, 800 and 900 °C, hereafter named N15T700, N15T800, and N15T900. Transmission electron microscopy (TEM) (Figure S2, reported in supporting materials) shows the presence of crystalline particles for all the samples. The heating process led to the progressive growth of the particles and their structural ordering. The high resolution TEM images performed on N15T900 (Figure S2, Supplementary Materials) confirm the particles’ spherical morphology. The observed set of fringes corresponds to the (311) lattice planes of the cobalt ferrite phase with a distance of 2.4 Å.
The particle size distribution obtained by TEM image analysis can be fitted by a log-normal function [19]:
P = A D σ 2 π e x p [ l n 2 ( D D TEM ) 2 σ 2 ]
where <DTEM> is the median of the variable “diameter” (Table 1) and σ is the standard deviation. An increase in particle size with the increase in annealing temperature is observed.
DC-magnetization measurements were performed using a SQUID magnetometer (Quantum Design Inc., San Diego, CA, USA) equipped with a superconducting magnet producing fields up to 5 T. AC-susceptibility measurements were performed at different frequencies (20–800 Hz) as a function of the temperature using a susceptometer (Model ACS 7000, Lake Shore Cryotronics Inc., Weterville, OH, USA).

3. Results and Discussions

The temperature dependence of the zero-field-cooled/field-cooled (ZFC/FC) magnetizations is shown in Figure 1a. The sample was cooled down to 4.2 K from room temperature in the absence of an applied field. Then, the ZFC curve was recorded in a field of 5 mT while warming up to 325 K. In contrast, the FC curve was recorded after having cooled the sample down (from 325 to 4.2 K) with the same field applied. The shape of the FC-curves suggests that interparticle interactions are negligible [19,20,21]. The temperature corresponding to the maximum in the ZFC curve, Tmax, (Table 1) increases with the annealing temperature. According to Gittleman et al. [22], Tmax is related to the average blocking temperature <TB> through the equation:
T max   β < T B >
where β is a constant that, for a log-normal distribution of particle sizes, is in the range of 1.5–2.5. The temperature at which the ZFC and FC curves merge is the irreversibility temperature (Tirr), and it corresponds to the blocking temperature of the particles with the maximum anisotropy. As expected, both Tirr and Tmax grow with increasing size (i.e., increasing temperature). The difference between Tirr and Tmax reflects the width of the blocking temperature distribution in the absence of magnetic interparticle interactions and it is correlated to the volume distribution. In our samples, such difference is weakly dependent on the annealing temperature, indicating that the thermal treatment does not significantly affect the distribution of the blocking temperatures. This is confirmed by the thermoremanent magnetization (TRM) curves [21] (Figure 2b, see supplementary information for details). Indeed, the shape of the energy barrier distribution is similar for the three samples, confirming that the sources of anisotropy are basically the same and that the interparticle interactions are weak. Two different models have been proposed to determine the blocking temperature distribution, yielding to its mean value and standard deviation. Starting from the model proposed by Chantrell and co-workers [23], the distribution of the anisotropy energy barriers was fitted by a log-normal function to determine the mean value of the blocking temperature (<TB>CH), reported in Table 1 [24,25,26]. We give details of the fit and values of the standard deviation (σTRM) in the supporting information (Figures S3 and S4).
Hansen and Mørup proposed a phenomenological approach to calculate the mean blocking temperature (<TB>H.M.) and its standard deviation (σH.M.) [27] for a log-normal distribution of the particles volume, and negligible interparticle interactions. They found that <TB>H.M. and σH.M can be expressed with known values of Tirr and Tmax from <TB>H.M. = Tmax [1.792 + 0.186·ln(Tirr/Tmax − 0.918)]−1 + 0.0039·Tirr and σH.M. = 0.624 + 0.397 ln(Tirr/Tmax − 0.665). <TB>H.M. values are given in 16(1), 25(2) and 31(2) K for samples (Table 1), their standard deviation values being 0.73, 0.61, and 0.57 for N15T700, N15T800 and N15T900, respectively.
The values of the mean blocking temperatures extracted by the two models are equal within the experimental errors (Table 1). The percentual polydispersity of the blocking temperatures is defined as:
P D % = 100 × σ T B
The PD% value obtained for Chantrell and Hansen–Mørup models (PDCH. and PDH.M.) decreases with increasing particle size, although this trend is more evident for the Chantrell model.
The inset in Figure 1a shows the product of the susceptibility times the irreversibility temperature (χTirr) as a function of the annealing temperature (Tann). These results indicate a strong increase in the ferrimagnetic phase between 700 and 900 °C, which can be ascribed to the rise in the particle volume [28].
The dynamic magnetic properties were investigated by AC-susceptibility measurements in a field of 2.5 mT at frequencies υ from 5 Hz to 10 kHz, in the temperature interval 18–310 K. According to the Néel–Arrhenius model, the relaxation process of the particle moments is driven by thermal activation and described, in the absence of interparticle interactions, by the Arrhenius law τN = τ0 exp(KeffV/kBT). Since T = TB when τm = 1/υm, a linear relation between ln(τm) and 1/TB can be derived:
l n ( τ m ) = l n ( τ 0 ) + K eff V k B T B .
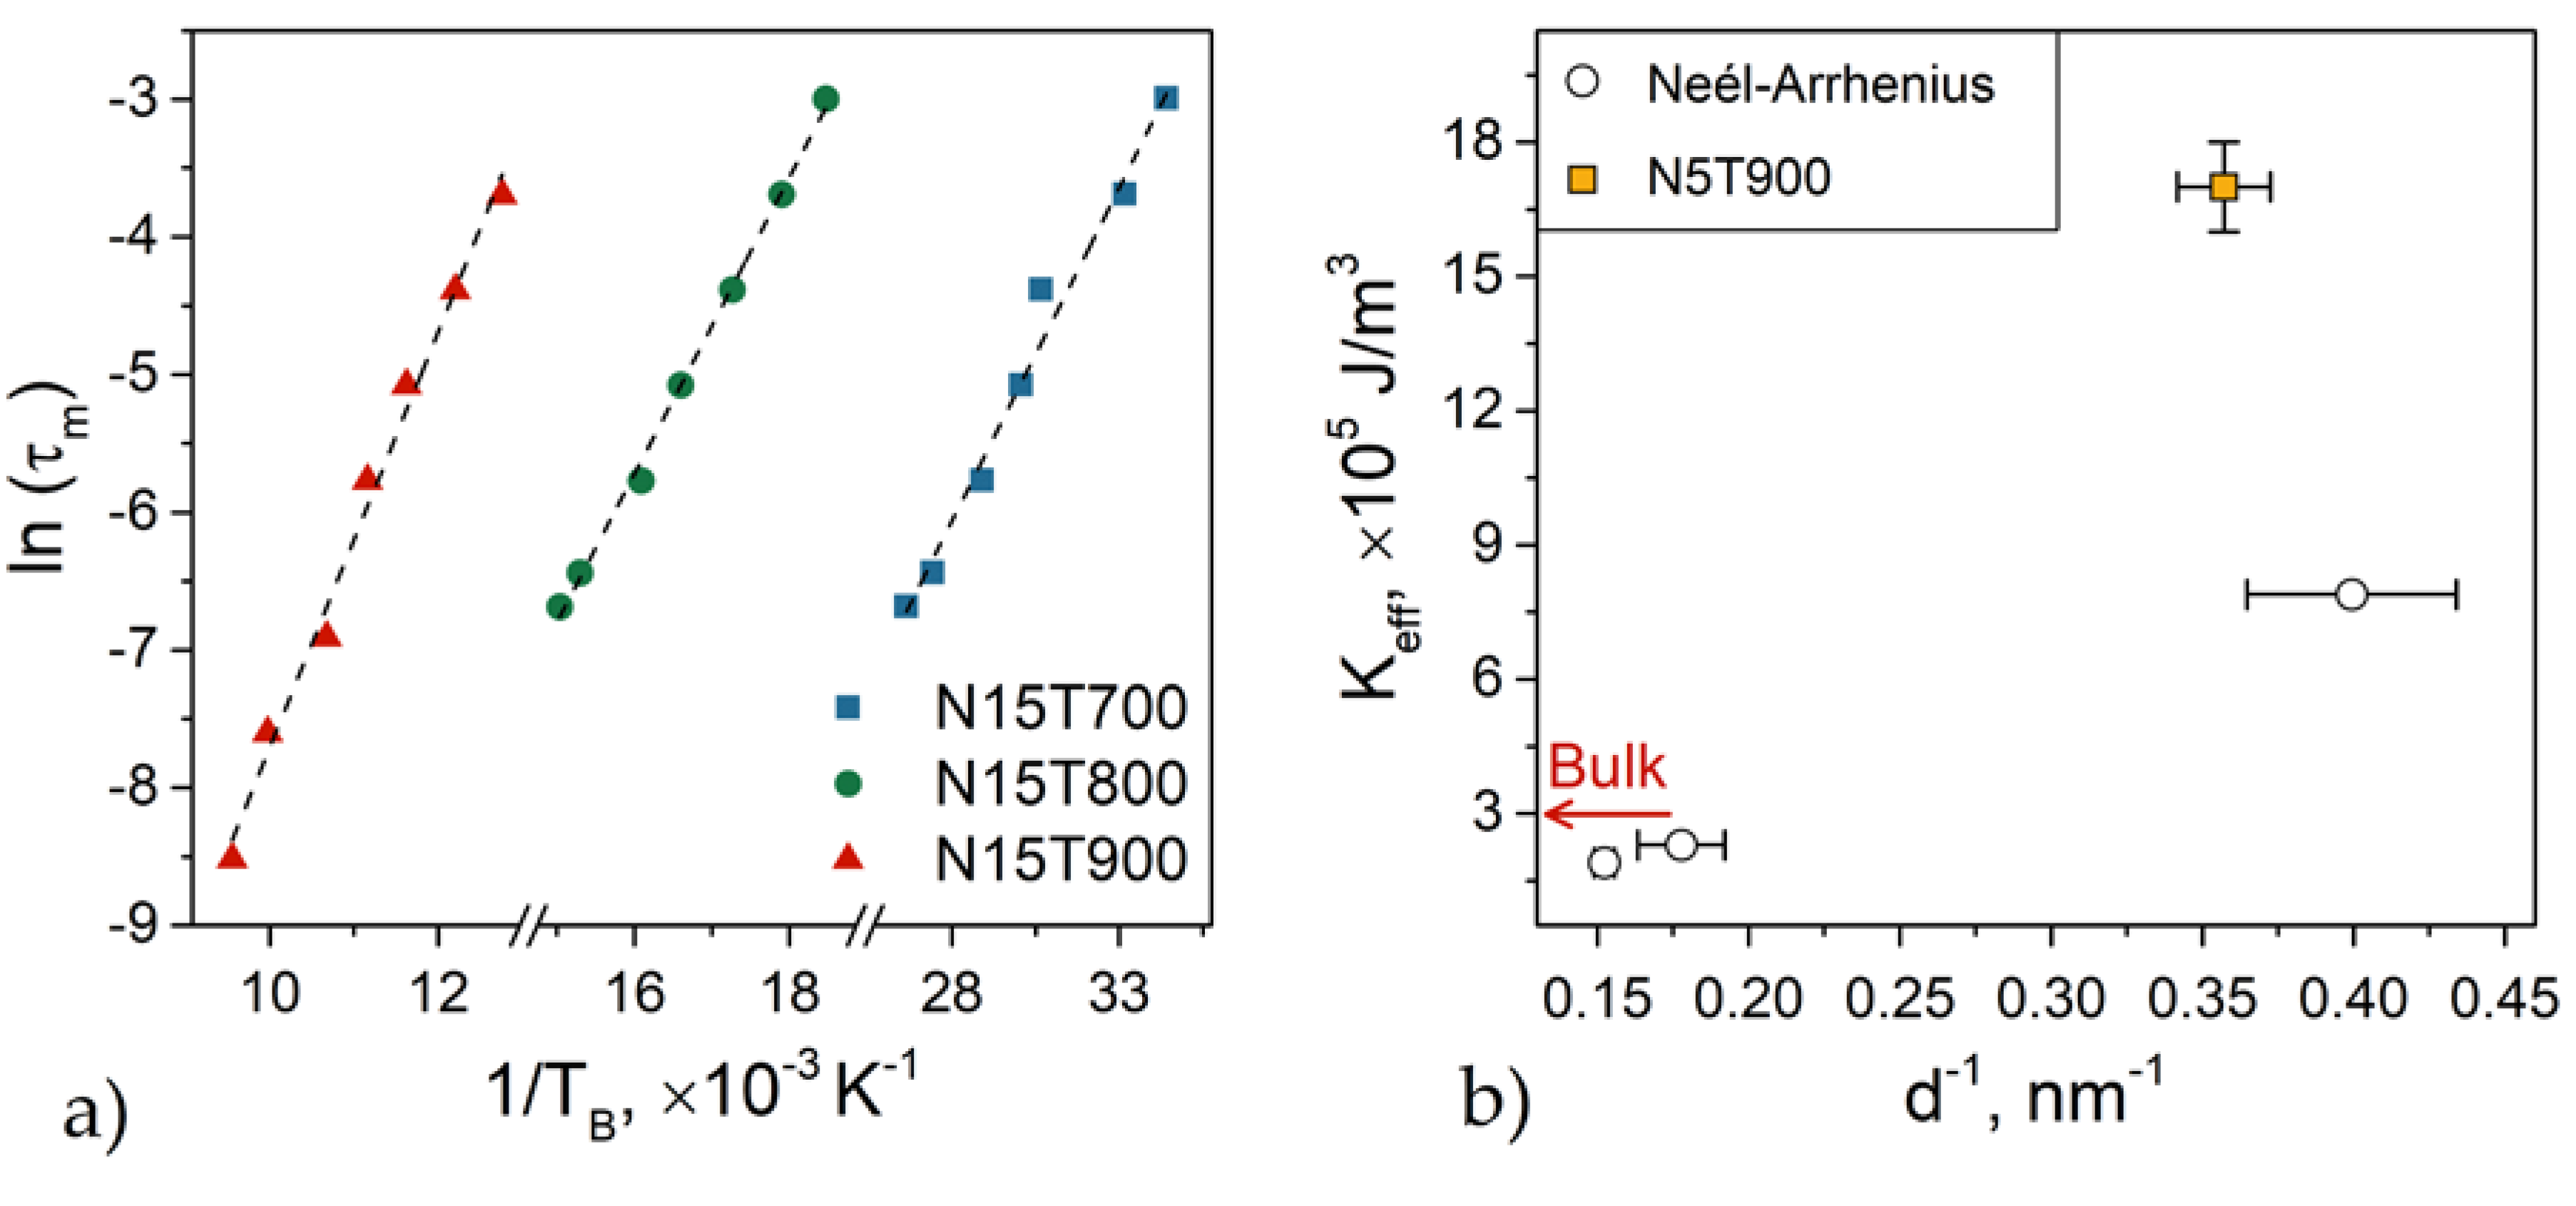
In Figure 2a, the linear relationship between ln(τm) versus 1/TB is reported for the three samples. The values of the effective magnetic anisotropy constant, Keff, and the characteristic relaxation times, τ0, obtained from the linear fitting of Equation (4), are given in Table 2.
For the sample annealed at the lowest temperature (N15T700), the τ0 value has a coherent physical meaning (1.9 × 10⁻⁹ s), confirming the absence of interparticle interactions. On the other hand, for samples N15T800 and N15T900, the τ0 value is much smaller. This fact indicates that the Néel–Arrhenius model is not appropriate to describe the dynamical behavior of these samples, suggesting that weak interparticle interactions are present.
According to the Vogel–Fulcher law, weak interparticle interactions are accounted for by a temperature term T0 [29,30,31]:
l n ( τ m ) = l n ( τ 0 ) + K e f f V k B ( T B + T 0 ) .
The values of T0 and Keff (Table 2) have been obtained from the fitting of Equation (5) by fixing the specific relaxation time τ0 equal to 10−10 s for all the samples [14,26]. In sample N15T700, T0 is almost zero, consistent with the absence of interparticle interactions. Then, T0 rises with the annealing temperature, indicating an increase in the dipolar interactions due to the enhancement of the particle magnetic moment. It is worth underlining that the value of Keff obtained by Néel–Arrhenius and Vogel–Fulcher models are similar for sample N15T700 where the interactions can be considered negligible. A difference in the Keff values deduced from the two models is observed for N15T800 and N15T900 due to magnetic interactions.
On the other hand, in both models, Keff increases with a decreasing particle size (i.e., decreasing annealing temperature). We measured a rise of ~30% when the diameter goes from 6.6 (N15T900) to 5.6 nm (N15T800), while a much higher growth of ~70% is observed when it goes from 6.6 (N15T800) to 2.5 nm (N15T700). This result indicates that the surface anisotropy increases with a decrease in the particle size, but its role becomes dominant in tiny particles (e.g., N15T700). This idea is also confirmed by the fact that the Keff values of N15T800 and N15T900, which are lower than the value of the bulk material (3 × 10⁵ J/m3 [14,32]), indicating that the magnetic structure also plays a crucial role. The smaller anisotropy in CoFe2O4 nanoparticles compared to the bulk value can be related to a change in the cation distribution with the size, induced by the annealing treatment. This phenomenon was already observed in CoFe2O4 particles [14,33] and explained by a modification of the cation distribution leading to a change in the magneto-crystalline anisotropy mainly determined by the distribution of the Co2+ ions between Oh and Td sites. Indeed, here the cause can be a lower fraction of Co2+ ions in the octahedral sites, having larger anisotropy (+850 × 10−24 J/ion) (due to the orbital contribution in the crystal field 4T1 ground energy term) than Co2+ ions in a tetrahedral site (−79 × 10−24 J/ion; 4A2 term) [8].
To highlight these results, Figure 2b reports the Keff value of an additional sample consisting of CoFe2O4 nanoparticles embedded in a silica matrix with a 5% (w/w) concentration of magnetic phase annealed at 900 °C (hereafter named N5T900). For this sample, the average particle size (2.8 ± 0.3 nm [14]) is very close to that of the N15T700 (2.5 ± 0.5 nm), with the same percentual polydispersity (see Figure S5 and Table S1 in the supporting information). It is important to underline that the interparticle interactions in both N5T900 and N15T700 samples are negligible, as indicated by their corresponding ZFC-FC and δM-plots [34] (Figures S6 and S7, respectively, in the supporting information).
Despite the two samples having the same morphological features, Keff is much larger for N5T900, which could be related to the cation distribution change caused by the annealing. The highest temperature produces a larger occupancy of Oh sites by the Co2+ ions in sample N5T900 [14].
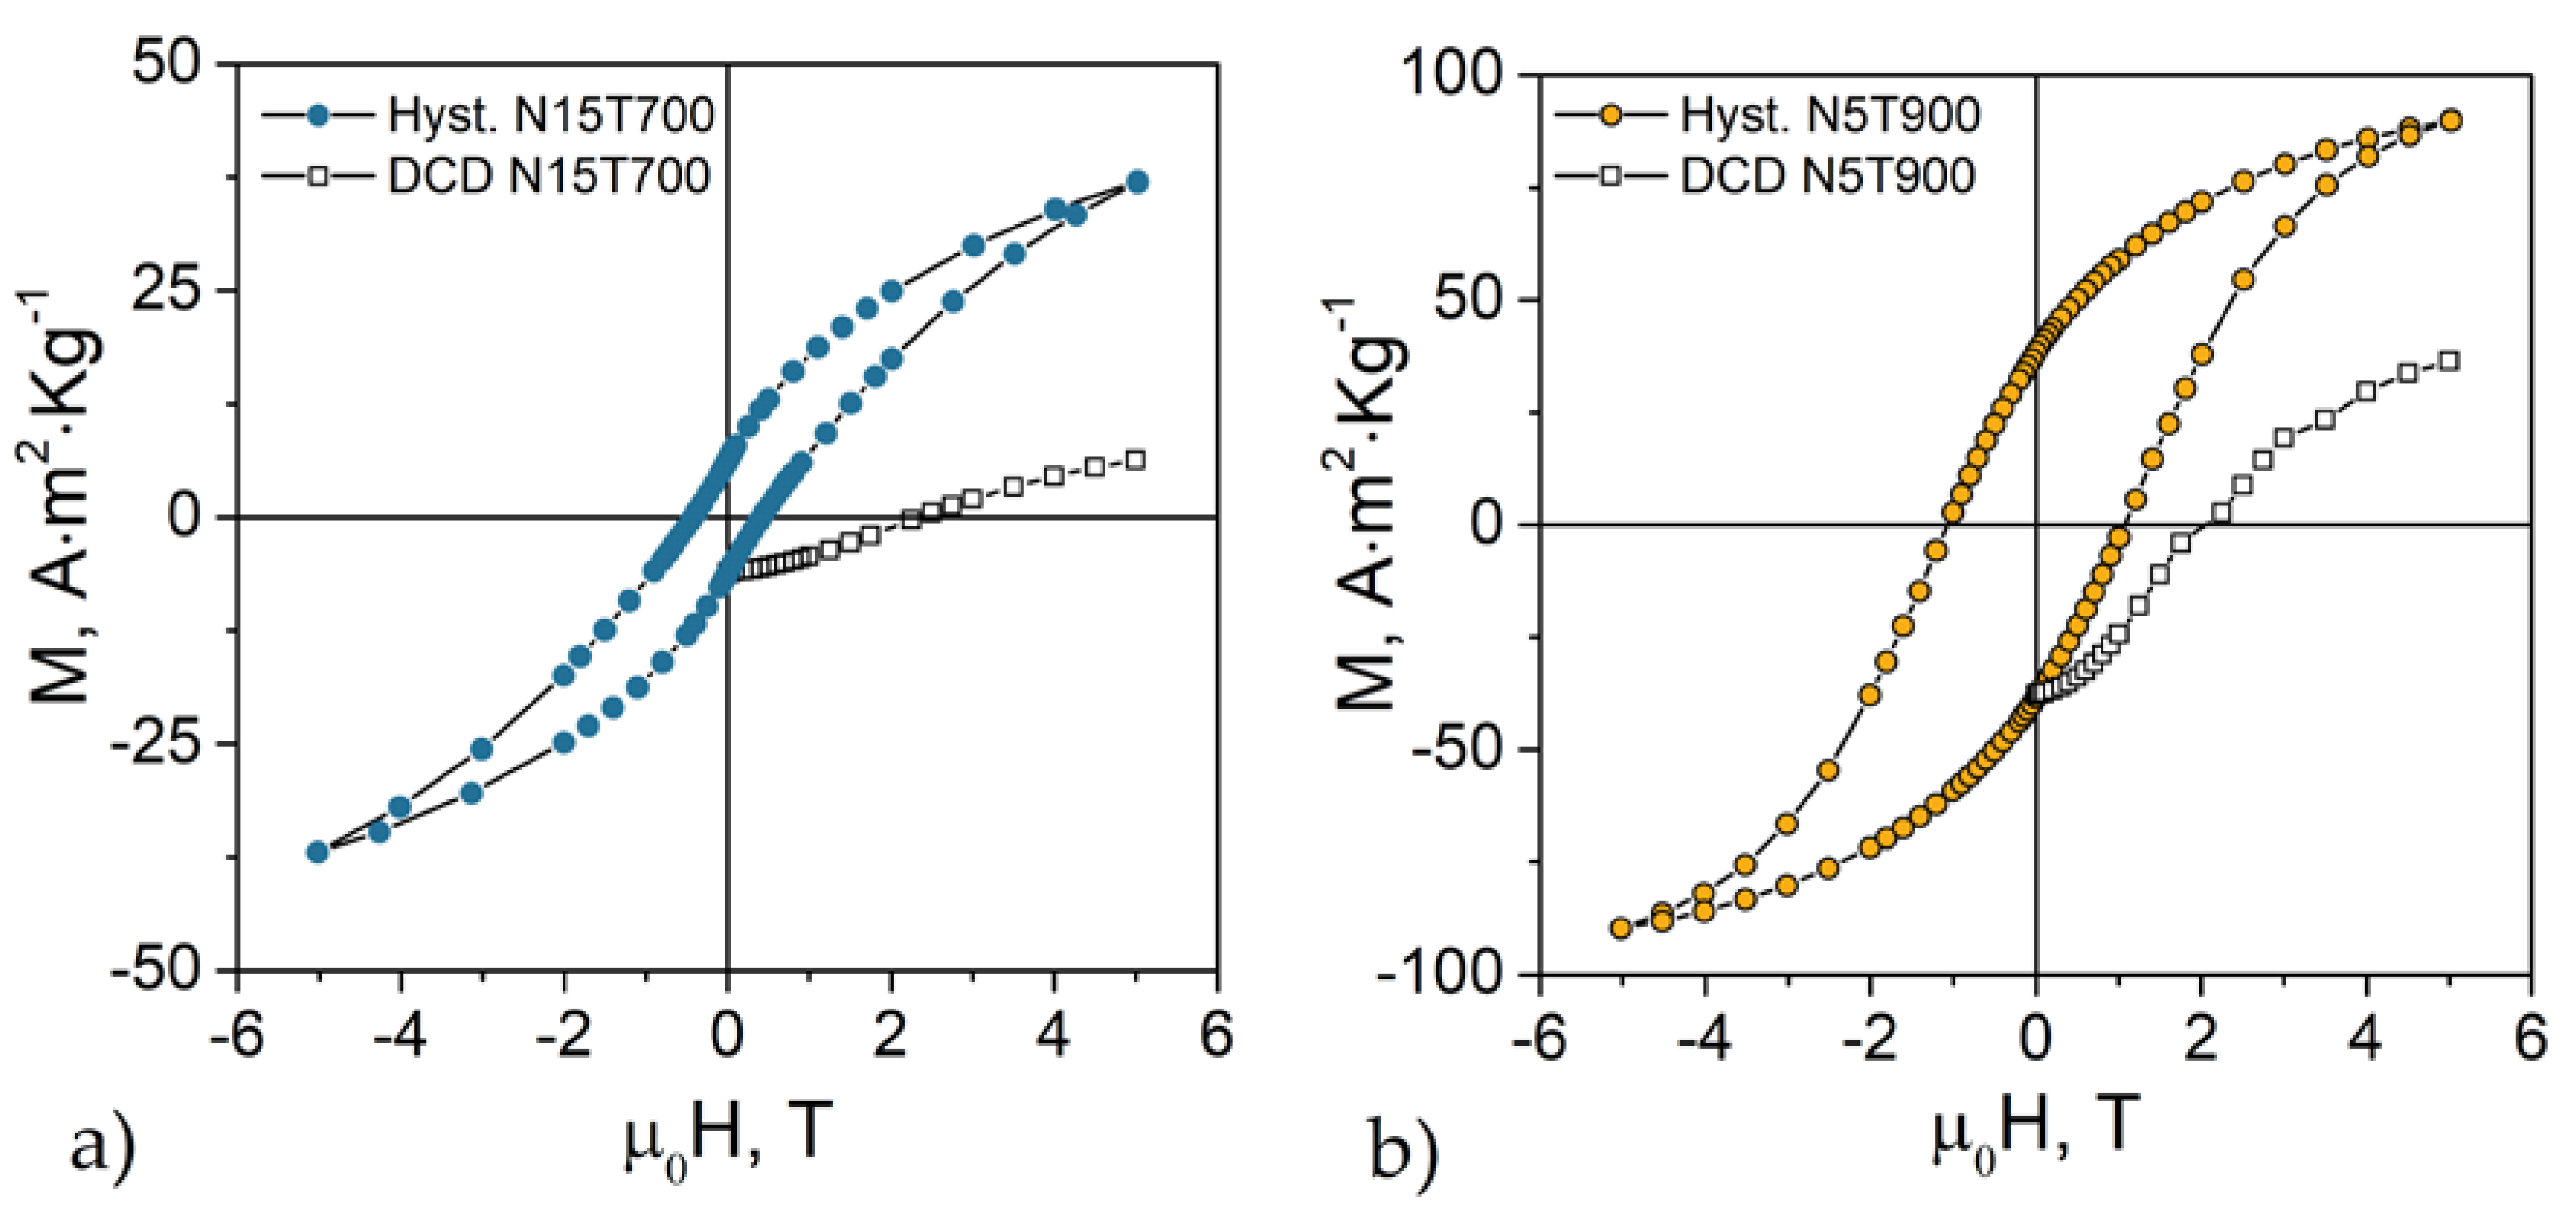
Low-temperature (5 K) magnetization loops of the samples N15T700 and N5T900 are reported in Figure 3. They are not saturated due to their high anisotropy (the same as samples N15T800 and N15T900, reported in Figure S8 of the supporting information). The saturation magnetization (MS) has been estimated by fitting the high field range of the curves to the equation [35]:
M ( H ) = M S · ( 1 a H b H 2 ) + H · χ SAT
where a and b are the fitting parameters, and χSAT is the “non-saturated” magnetic susceptibility (for high applied fields). The latter is strongly related to the non-collinear spin structure due to competing interactions between sublattices, and to the symmetry breaking at the particle surface [36,37].
Figure 4a shows that MS increases with particle size (i.e., annealing temperature), as expected. In the same figure, we plot MS for sample N5T900 (2.8 ± 0.3 nm particle size). Despite N5T900 and N15T700 having the same particle size, MS for N5T900 is almost twice than for N15T700. Considering that the magnetic interparticle interactions are negligible in both samples, this difference can be ascribed to the combined effect of cation distribution, spin-canting, and surface anisotropy [14,16]. The non-saturated susceptibility (Figure 4b) increases with decreasing particle size (i.e., decreasing annealing temperature) [31]. The trend of χSAT indicates, as expected, the more substantial contribution of the surface magnetic anisotropy for smaller particles. It is worth emphasizing that N15T700 has a higher value of χSAT, indicating that the surface contribution to the effective magnetic anisotropy is higher in N15T700 than in N15T900. The energy barrier distribution can confirm this. In fact, despite N5T900 and N15T700 having the same PD% of the TEM diameter, the PD% for TB calculated by H.M. model is much higher for N15T700 (PD% TB 4.56) than for N5T900 (PD% TB 2.45).
Given that the particle volume is comparable in the two samples, this fact can be explained by the mentioned surface anisotropy contribution. Labarta and co-workers have shown that, for spinel ferrite nanoparticles, even when the size distribution is narrow, surface anisotropy can produce a substantial broadening of the anisotropy energy distribution. This effect is an obvious consequence of the different size dependence of the energy contributions from the core and the surface [38]. Because the volume content of the surface spin layer increases with a decrease in size, and it becomes more significant for ultra-small particles (<10 nm).
Then, although χSAT and the anisotropy energy barrier distribution indicate a more significant contribution of the surface component to the anisotropy in N15T700, the value Keff obtained by AC measurements is higher in N5T900. This could be associated with an increase in the magneto-crystalline component of the anisotropy.
The squares in Figure 3 represent the low temperature (5 K) direct current demagnetization (DCD) remanent curves measured following the protocol in ref. [39]: (1) application of a quasi-saturating field of 5 T; (2) application of a gradually increasing magnetic field in the reversal direction; (3) switching off the magnetic field and collection of the remanent magnetization value after each iteration. Since each measurement is performed at zero field, MDCD is only sensitive to the irreversible component of the magnetization and only the blocked particles contribute to the remanent magnetization. The curve shape is linked to the switching field distribution, which, in turn, is related to the energy barrier distribution; the value of the field at which the remanent magnetization is equal to zero (called remanent coercivity, HCr) corresponds to the mean switching field. Although the two samples have different coercivity, the remanent coercivities are close (N15T700: ~2.4 T, N5T900: ~2.1 T). This result is in line with the similar anisotropy fields (N15T700: 5.8(5) T, N5T900: 5.9(6) T) estimated by the Stoner–Wohlfarth model (HK = 2Keff/MS).
Even though HCr and HK are equal within the experimental error, the coercivities of the two samples are different. Since both systems are non-interacting, such differences can be associated with a larger fraction of very small particles that probably are not well crystallized due to the low treatment temperature. We have confirmed this by the trend of χTirr (inset of Figure 1a) and the lower value of the remanent and saturation magnetizations [40].

4. Conclusions

The results provide evidence that the relative surface and core contributions to the effective magnetic anisotropy and saturation magnetization of CoFe2O4 nanoparticles embedded in a silica matrix can be controlled by the annealing temperature Tann. For samples with 15% w/w of nanoparticles, the value of the effective magnetic anisotropy constant Keff increases and the saturation magnetization decreases by decreasing Tann from 900 to 700 °C, with a decrease in particle size, showing a dominant role of the disordered surface. On the other hand, the comparison between the 15% w/w sample annealed at 700 °C and a 5% w/w sample annealed at 900 °C, with comparable particle size, (2.5 and 2.8 nm with the same size distribution) shows a much larger saturation magnetization and Keff values for the latter one, for which the χSAT value, related to non-collinear core spin structure and surface disorder, is much lower. The comparison indicates that for the 5% w/w with Tann = 900 °C sample the major contribution to the anisotropy comes from the core, despite its very small particle size. This should be due to a better crystallinity and change in a core structure (e.g., different cation distribution and degree of spin canting) with larger magnetocrystalline anisotropy induced by the higher Tann. In conclusion, the results indicate that the effect of the annealing temperature on the anisotropy and saturation magnetization is not limited to the change in the particle size, increasing with Tann. Besides the decrease in surface disorder, the core structure is also affected by the thermal treatment, which can significantly modify the magnetocrystalline anisotropy and the saturation magnetization.

Supplementary Materials

The following are available online at https://www.mdpi.com/2079-4991/10/7/1288/s1, Figure S1: XRD patterns of CoFe2O4 nanoparticles embedded (15% w/w) in an amorphous silica matrix and annealed at different temperatures (from ref. [18]); Figure S2: TEM image of as-prepared sample (a); dark field images of N15T700 (b) and N15T800 (c); bright field (d) and high resolution image of N15T900 (from ref. [18]); Figure S3: TRM measurements (full symbols) and corresponding distribution of magnetic anisotropy (empty symbols) energies with cooling field of 2.5 mT for the samples N15T700 (a), N15T800 (b), N15T900 (c); Figure S4: distribution of magnetic anisotropy energies (empty symbols) fitted by a log normal function (lines) for the samples N15T700 (squares), N15T800 (triangles), N15T900 (circles). Values of mean Blocking temperature (<TB>) and standard deviation (σ) are reported in the graph; Figure S5: Particle size distribution extracted by TEM images of the sample N15T700 (left side) and N5T900 (right side); Figure S6: ZFC-FC curves for the N15T700 (a) and N5T900 (b); Figure S7: δM-plot at 5 K for N15T700 sample and reference sample N5T900 [14]; Figure S8: Hysteresis loop recorded at 5 K for N15T900 (a), N15T800 (b) and N15T700 (c); Table S1: Mean particle size (DTEM) σ the standard deviation of the natural logarithm of the variable D and percentual polydispersity determined by Equation (7).

Author Contributions

Conceptualization, D.P.; methodology, D.P. and D.F.; validation, D.P., M.R. and V.R.; investigation, D.P., F.D., C.C., G.V., V.M. and A.M.; data curation, A.O. and M.S.; writing—Original draft preparation, A.O. and M.S.; writing—Review and editing, D.P. and D.F.; visualization, A.O.; supervision, D.P., D.F., V.R. and M.R.; project administration, D.P.; funding acquisition, D.P. and V.R. All authors have read and agreed to the published version of the manuscript.

Funding

The reported study was funded by RFBR according to the research project No. 18-32-01016. This work was supported in part by the 5 top 100 Russian Academic Excellence Project at the Immanuel Kant Baltic Federal University.. MS thanks the University of Oviedo, the Spanish Ministry of Education, Culture and Sport and Banco Santander for a grant (CEI15-24), and Spanish Ministry of Economy and Competitiveness for grant MAT2017-84959-C2-1-R. RAS-Piano Sulcis (CESA Project) and PON AIM (PON Ricerca e Innovazione 2014–2020-Azione I.2-D.D. n.407 del 27 febbraio 2018 “Attraction and International Mobility”, Cult-GeoChim project AIM1890410-3) are gratefully acknowledged for financing the past and actual fellowships of V. Mameli.

Conflicts of Interest

The authors declare no conflict of interest.

References

  1. Gomes, J.D.A.; Sousa, M.H.; Tourinho, F.A.; Aquino, R.; Da Silva, G.J.; Depeyrot, J.; Dubois, E.; Perzynski, R. Synthesis of core-shell ferrite nanoparticles for ferrofluids: Chemical and magnetic analysis. J. Phys. Chem. C 2008, 112, 6220–6227. [Google Scholar] [CrossRef]
  2. Pardavi-Horvath, M. Microwave applications of soft ferrites. J. Magn. Magn. Mater. 2000, 216, 171–183. [Google Scholar] [CrossRef]
  3. Song, G.; Kenney, M.; Chen, Y.S.; Zheng, X.; Deng, Y.; Chen, Z.; Wang, S.X.; Gambhir, S.S.; Dai, H.; Rao, J. Carbon-coated FeCo nanoparticles as sensitive magnetic-particle-imaging tracers with photothermal and magnetothermal properties. Nat. Biomed. Eng. 2020, 4, 325–334. [Google Scholar] [CrossRef]
  4. Cardoso, V.F.; Francesko, A.; Ribeiro, C.; Bañobre-López, M.; Martins, P.; Lanceros-Mendez, S. Advances in Magnetic Nanoparticles for Biomedical Applications. Adv. Healthc. Mater. 2018, 7, 1700845. [Google Scholar] [CrossRef] [PubMed]
  5. Waag, F.; Gökce, B.; Kalapu, C.; Bendt, G.; Salamon, S.; Landers, J.; Hagemann, U.; Heidelmann, M.; Schulz, S.; Wende, H.; et al. Adjusting the catalytic properties of cobalt ferrite nanoparticles by pulsed laser fragmentation in water with defined energy dose. Sci. Rep. 2017, 7, 1–13. [Google Scholar] [CrossRef] [PubMed] [Green Version]
  6. Rizzuti, A.; Dassisti, M.; Mastrorilli, P.; Sportelli, M.C.; Cioffi, N.; Picca, R.A.; Agostinelli, E.; Varvaro, G.; Caliandro, R. Shape-control by microwave-assisted hydrothermal method for the synthesis of magnetite nanoparticles using organic additives. J. Nanoparticle Res. 2015, 17, 1–16. [Google Scholar] [CrossRef]
  7. da Silva, F.G.; Depeyrot, J.; Campos, A.F.C.; Aquino, R.; Fiorani, D.; Peddis, D. Structural and Magnetic Properties of Spinel Ferrite Nanoparticles. J. Nanosci. Nanotechnol. 2019, 19, 4888–4902. [Google Scholar] [CrossRef]
  8. Cannas, C.; Musinu, A.; Piccaluga, G.; Fiorani, D.; Peddis, D.; Rasmussen, H.K.; Mørup, S. Magnetic properties of cobalt ferrite-silica nanocomposites prepared by a sol-gel autocombustion technique. J. Chem. Phys. 2006, 125, 1–11. [Google Scholar] [CrossRef] [PubMed]
  9. Jovanović, S.; Spreitzer, M.; Otoničar, M.; Jeon, J.-H.; Suvorov, D. pH control of magnetic properties in precipitation-hydrothermal-derived CoFe2O4. J. Alloys Compd. 2014, 589, 271–277. [Google Scholar] [CrossRef]
  10. Albino, M.; Fantechi, E.; Innocenti, C.; López-Ortega, A.; Bonanni, V.; Campo, G.; Pineider, F.; Gurioli, M.; Arosio, P.; Orlando, T.; et al. Role of Zn2+ Substitution on the Magnetic, Hyperthermic, and Relaxometric Properties of Cobalt Ferrite Nanoparticles. J. Phys. Chem. C 2019, 123, 6148–6157. [Google Scholar] [CrossRef] [Green Version]
  11. Martínez, B.; Obradors, X.; Balcells, L.; Rouanet, A.; Monty, C. Low Temperature Surface Spin-Glass Transition in -gFe2O3 Nanoparticles. Phys. Rev. Lett. 1998, 80, 181–184. [Google Scholar] [CrossRef]
  12. Coey, J.M.D. Non-collinear Spin Arrangement in Ultrafine Ferrimagnetic Crystallites. Phys. Rev. Lett. 1971, 27, 1140. [Google Scholar] [CrossRef] [Green Version]
  13. Lin, D.; Nunes, A.C.; Majkrzak, C.F.; Berkowitz, A.E. Polarized neutron study of the magnetization density distribution within a CoFe2O4 colloidal particle II. J. Magn. Magn. Mater. 1995, 145, 343–348. [Google Scholar] [CrossRef]
  14. Peddis, D.; Mansilla, M.V.; Mørup, S.; Cannas, C.; Musinu, A.; Piccaluga, G.; D’Orazio, F.; Lucari, F.; Fiorani, D. Spin-canting and magnetic anisotropy in ultrasmall CoFe2O4 nanoparticles. J. Phys. Chem. B 2008, 112, 8507–8513. [Google Scholar] [CrossRef]
  15. Peddis, D.; Yaacoub, N.; Ferretti, M.; Martinelli, A.; Piccaluga, G.; Musinu, A.; Cannas, C.; Navarra, G.; Greneche, J.M.; Fiorani, D. Cationic distribution and spin canting in CoFe2O4 nanoparticles. J. Phys. Condens. Matter 2011, 23, 426004. [Google Scholar] [CrossRef]
  16. Peddis, D. Magnetic Properties of Spinel Ferrite Nanoparticles: Influence of the Magnetic Structure. In Magnetic Nanoparticle Assemblies; Trohidou, K.N., Ed.; Pan Stanford Publishing: Singapore, 2014; Volume 7, pp. 978–981. ISBN 9789814411967. [Google Scholar]
  17. Cannas, C.; Musinu, A.; Peddis, D.; Piccaluga, G. Synthesis and Characterization of CoFe2O4 Nanoparticles Dispersed in a Silica Matrix by a Sol−Gel Autocombustion Method. Chem. Mater. 2006, 18, 3835–3842. [Google Scholar] [CrossRef]
  18. Muscas, G.; Singh, G.; Glomm, W.R.; Mathieu, R.; Kumar, P.A.; Concas, G.; Agostinelli, E.; Peddis, D. Tuning the size and shape of oxide nanoparticles by controlling oxygen content in the reaction environment: Morphological analysis by aspect maps. Chem. Mater. 2015, 27, 1982–1990. [Google Scholar] [CrossRef]
  19. Peddis, D.; Jönsson, P.E.; Laureti, S.; Varvaro, G. Magnetic Interactions: A Tool to Modify the Magnetic Properties of Materials Based on Nanoparticles; Elsevier: Amsterdam, The Netherlands, 2014; Volume 6. [Google Scholar]
  20. Knobel, M.; Nunes, W.C.; Socolovsky, L.M.; De Biasi, E.; Vargas, J.M.; Denardin, J.C. Superparamagnetism and other magnetic features in granular materials: A review on ideal and real systems. J. Nanosci. Nanotechnol. 2008, 8, 2836–2857. [Google Scholar] [CrossRef]
  21. Dormann, J.L.; Fiorani, D.; Tronc, E. Magnetic Relaxation in Fine-Particle Systems. Adv. Chem. Phys. 1997, 98, 283–494. [Google Scholar]
  22. Gittleman, J.I.; Abeles, B.; Bozowski, S. Superparamagnetism and relaxation effects in granular Ni-SiO2 and Ni-Al2O3 films. Phys. Rev. B 1974, 9, 3891–3897. [Google Scholar] [CrossRef]
  23. Chantrell, R.W.; El-Hilo, M.; O’Grady, K. Spin-Glass behaviour in fine particle system. IEEE Trans. Magn. 1991, 27, 3570–3578. [Google Scholar] [CrossRef]
  24. Lavorato, G.C.; Peddis, D.; Lima, E.; Troiani, H.E.; Agostinelli, E.; Fiorani, D.; Zysler, R.D.; Winkler, E.L. Magnetic Interactions and Energy Barrier Enhancement in Core/Shell Bimagnetic Nanoparticles. J. Phys. Chem. C 2015, 119, 15755–15762. [Google Scholar] [CrossRef] [Green Version]
  25. Liu, C.; Zou, B.; Rondinone, A.J.; Zhang, Z.J. Chemical Control of Superparamagnetic Properties of Magnesium and Cobalt Spinel Ferrite Nanoparticles through Atomic Level Magnetic Couplings. J. Am. Chem. Soc. 2000, 122, 6263–6267. [Google Scholar] [CrossRef]
  26. Rondinone, A.J.; Liu, C.; Zhang, Z.J. Determination of Magnetic Anisotropy Distribution and Anisotropy Constant of Manganese Spinel Ferrite Nanoparticles. J. Phys. Chem. B 2001, 105, 7967–7971. [Google Scholar] [CrossRef]
  27. Hansen, M.F.; Mørup, S. Estimation of blocking temperatures from ZFC/FC curves. J. Magn. Magn. Mater. 1999, 203, 214–216. [Google Scholar] [CrossRef]
  28. Cannas, C.; Gatteschi, D.; Musinu, A.; Piccaluga, G.; Sangregorio, C. Structural and Magnetic Properties of Fe2O3 Nanoparticles Dispersed over a Silica Matrix. J. Phys. Chem. B 1998, 102, 7721–7726. [Google Scholar] [CrossRef]
  29. Pacakova, B.; Kubickova, S.; Reznickova, A.; Niznansky, D.; Vejpravova, J. Spinel Ferrite Nanoparticles: Correlation of Structure and Magnetism. In Magnetic Spinels—Synthesis, Properties and Applications; InTech: London, UK, 2017; ISBN 9789537619824. [Google Scholar]
  30. Dormann, J.L.; Bessais, L.; Fiorani, D. A dynamic study of small interacting particles: Superparamagnetic model and spin-glass laws. J. Phys. C Solid State Phys. 1988, 21, 2015. [Google Scholar] [CrossRef]
  31. del Castillo, V.L.C.D.; Rinaldi, C. Effect of sample concentration on the determination of the anisotropy constant of magnetic nanoparticles. IEEE Trans. Magn. 2010, 46, 852–859. [Google Scholar] [CrossRef] [Green Version]
  32. Sharifi, I.; Shokrollahi, H.; Amiri, S. Ferrite-based magnetic nanofluids used in hyperthermia applications. J. Magn. Magn. Mater. 2012, 324, 903–915. [Google Scholar] [CrossRef]
  33. Sharifi, I. Magnetic and structural studies on CoFe2O4 nanoparticles synthesized by co-precipitation, normal micelles and reverse micelles methods. J. Magn. Magn. Mater. 2012, 324, 1854–1861. [Google Scholar] [CrossRef]
  34. Omelyanchik, A.; Knezevic, N.; Rodionova, V.; Salvador, M.; Peddis, D.; Varvaro, G.; Laureti, S.; Mrakovic, A.; Kusigerski, V.; Illes, E. Experimental Protocols for Measuring Properties of Nanoparticles Dispersed in Fluids. In Proceedings of the 2018 IEEE 8th International Conference Nanomaterials: Application & Properties (NAP), Zatoka, Ukraine, 9–14 September 2018; pp. 1–5. [Google Scholar]
  35. Morrish, A.H. The Physical Principles of Magnetism; Wiley: Hoboken, NJ, USA, 1965; Volume 1, ISBN 0-7803-6029-X. [Google Scholar]
  36. Muscas, G.; Concas, G.; Cannas, C.; Musinu, A.; Ardu, A.; Orru, F.; Fiorani, D.; Laureti, S.; Rinaldi, D.; Piccaluga, G.; et al. Magnetic Properties of Small Magnetite Nanocrystals. J. Phisical Chem. C 2013, 114, 23378–23384. [Google Scholar] [CrossRef]
  37. Peddis, D.; Cannas, C.; Piccaluga, G.; Agostinelli, E.; Fiorani, D. Spin-glass-like freezing and enhanced magnetization in ultra-small CoFe2O4 nanoparticles. Nanotechnology 2010, 21, 125705. [Google Scholar] [CrossRef] [PubMed]
  38. Pérez, N.; Guardia, P.; Roca, A.G.; Morales, M.P.; Serna, C.J.; Iglesias, O.; Bartolomé, F.; García, L.M.; Batlle, X.; Labarta, A. Surface anisotropy broadening of the energy barrier distribution in magnetic nanoparticles. Nanotechnology 2008, 19, 475704. [Google Scholar] [CrossRef] [PubMed] [Green Version]
  39. Chantrell, R.W.; O’Grady, K. The Magnetic Properties of Fine Particles. In Applied Magnetism; Springer: Dordrecht, The Netherlands, 1994; pp. 113–164. [Google Scholar]
  40. El-Hilo, M.; Bsoul, I. Interaction effects on the coercivity and fluctuation field in granular powder magnetic systems. Phys. B Condens. Matter 2007, 389, 311–316. [Google Scholar] [CrossRef]
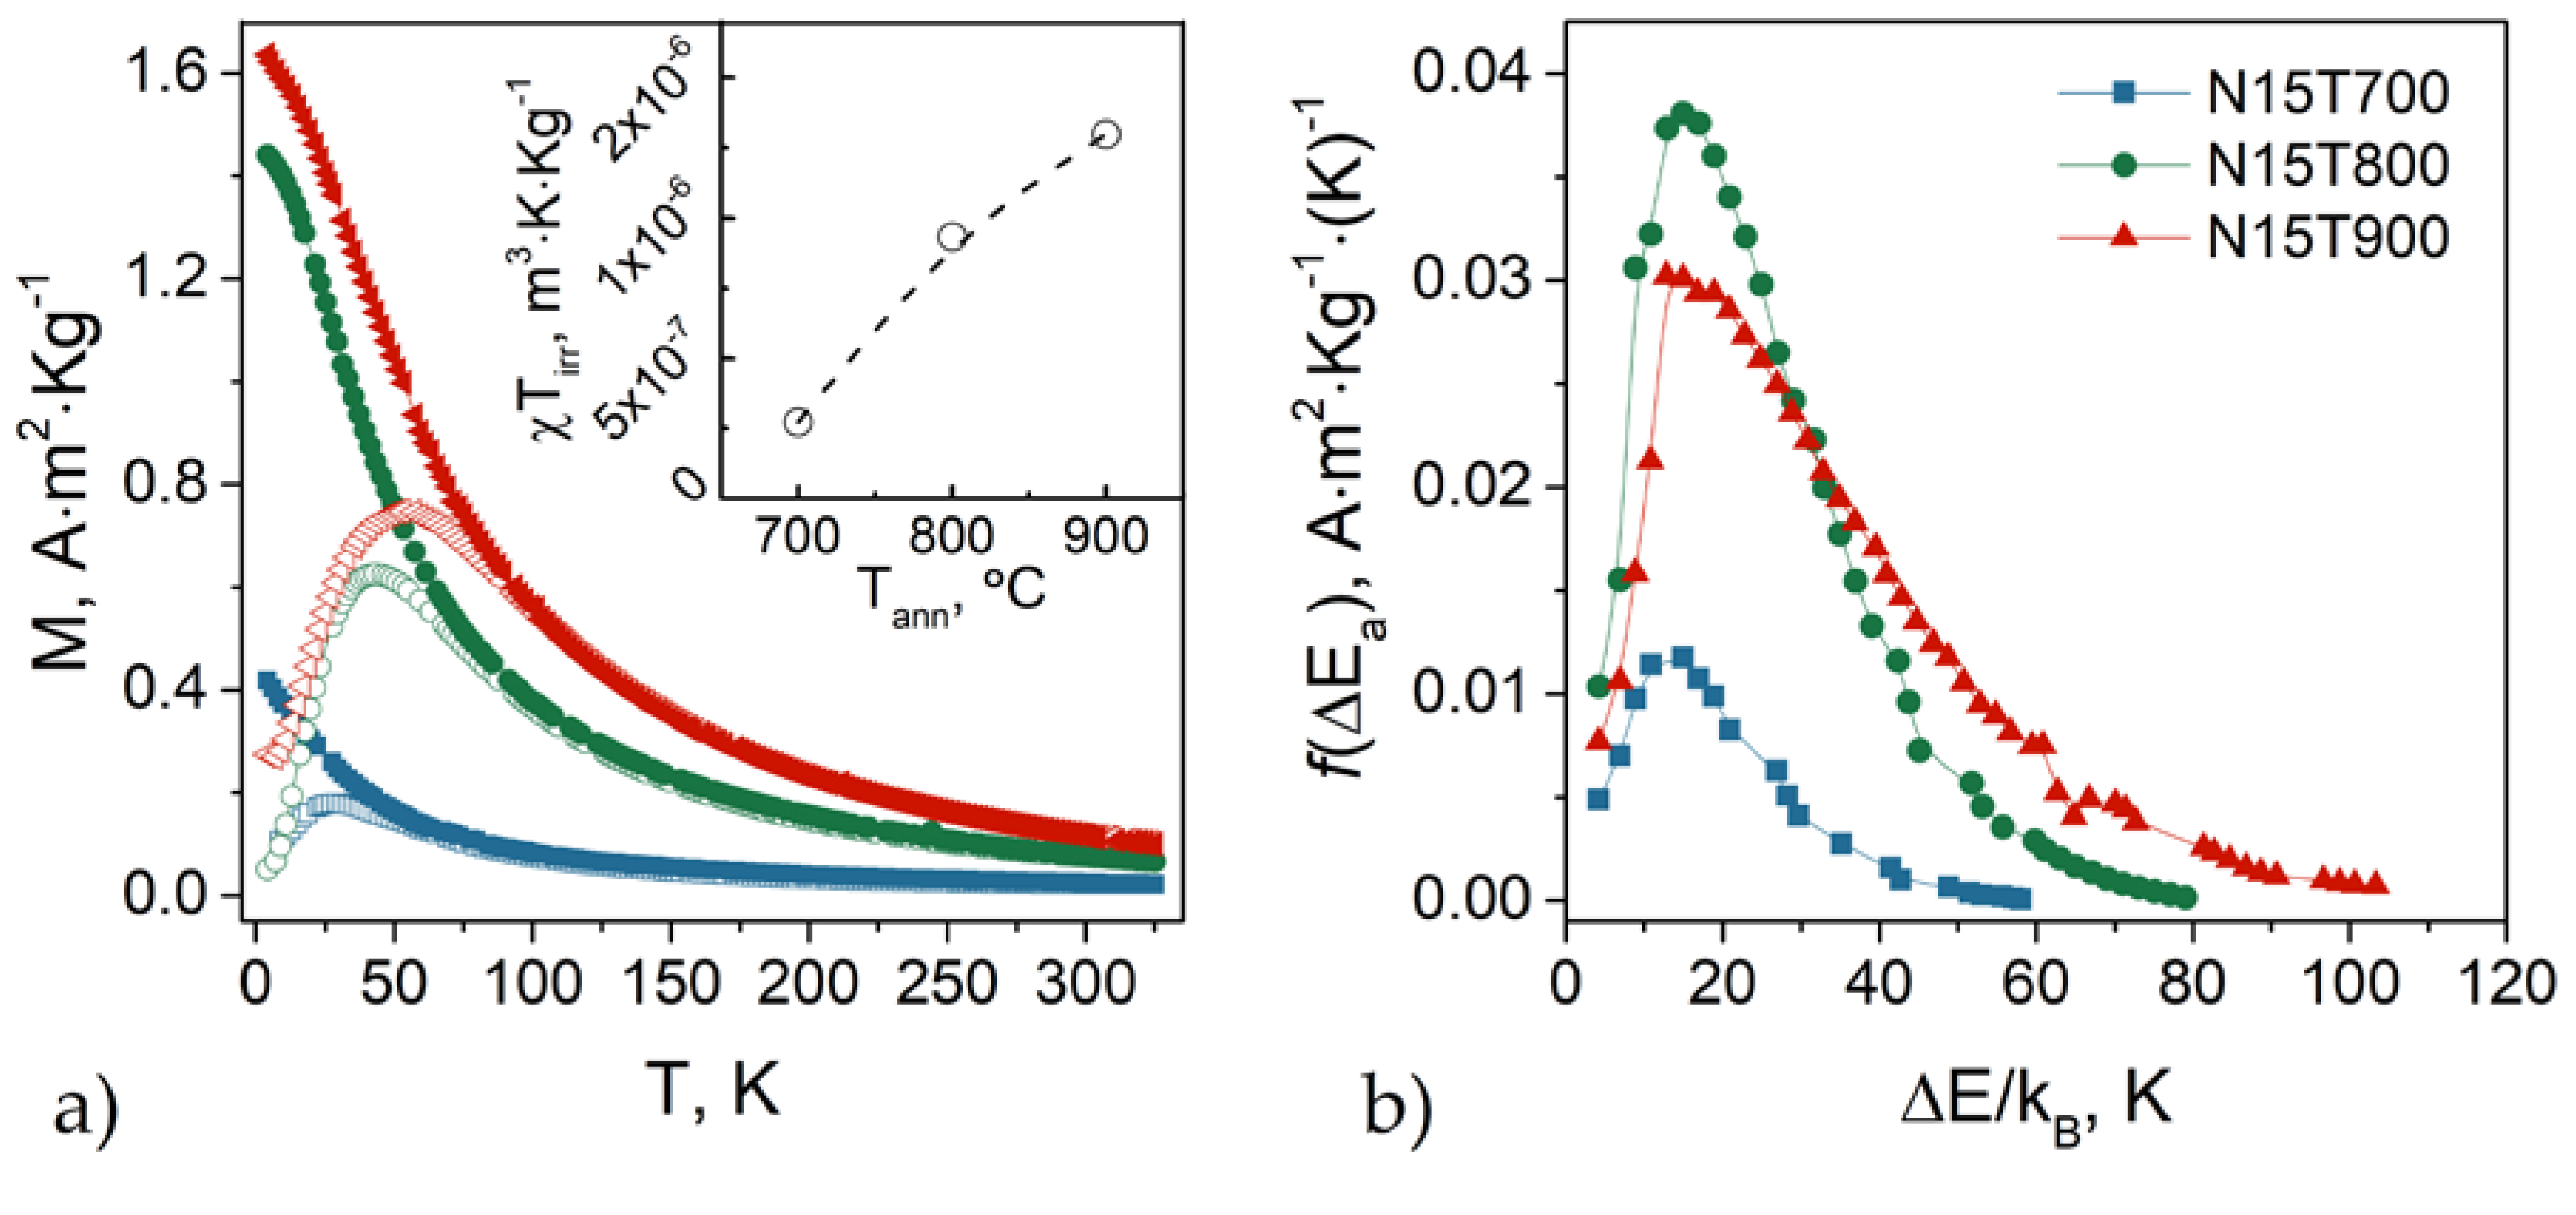
Figure 1. (a) Zero-field-cooled (ZFC) (empty symbols) and field-cooled (FC) (solid symbols) magnetization curves. Inset: product of the magnetic susceptibility times the irreversibility temperature as a function of the annealing temperature. (b) Energy barrier distribution obtained from the first derivative of the thermoremanent magnetization MTRM(T) versus temperature.
Nanomaterials 10 01288 g001
Figure 2. (a) Logarithm of the measurement time τ m versus 1 / T B and its linear fit (dashed line); (b) effective anisotropy constant Keff of N15T700, N15T800 and N15T900 obtained from fitting l n ( τ m ) versus 1 / T B by Neél–Arrhenius model (empty circles). The value from N5T900 was taken from reference [14] and that of bulk cobalt ferrite from reference [7].
Nanomaterials 10 01288 g002
Figure 3. Field-dependence of magnetization and direct current demagnetization (DCD) curves measured at 5 K for (a) sample N15T700 and (b) reference sample N5T900 with the same particle size [14].
Nanomaterials 10 01288 g003
Figure 4. (a) Saturation magnetization, M S , and (b) non-saturated susceptibility, χ SAT , obtained by fitting Equation (6). The dashed line represents a guide for the eye. The square in both graphs corresponds to the reference sample N5T900.
Nanomaterials 10 01288 g004
Table 1. Structural and magnetic properties.
SampledTEMTmaxTirr<TB>CH.2PDCH.<TB>H.M. 2PDH.M.
(nm)(K)(K)(K)(%)(K)(%)
N15T7002.5(2) 129(1)57(5)18(1)3.2616(1)4.56
N15T8005.3(5)43(1)70(5)22(2)2.8625(2)2.44
N15T9006.6(5)53(1)82(3)29(1)2.4131(2)2.45
1 Uncertainties in the last digits are given in parenthesis; 2 Average blocking temperature extracted from thermoremanent magnetization (TRM) (<TB>CH.) and (<TB>H.M.) from Hansen and Mørup method are reported with their corresponding percentual polydispersity index.
Table 2. Magnetic parameters obtained from AC magnetic susceptibility measurements.
SampleNéel−Arrhenius 1Vogel−Fulcher 2
K e f f   τ 0   K e f f   T 0
(J m−3)(s)(J m−3)(K)
N15T7007.9(4) × 1051.9 × 10−911(1) × 105−1(3)
N15T8002.3(2) × 1058.2 × 10−141.3(1) × 10514(2)
N15T9001.9(2) × 1051.5 × 10−140.92(1) × 10532(3)
1 Effective magnetic anisotropy constant (Keff) and characteristic relaxation time (τ0) obtained from the fitting to Néel−Arrhenius law (Equation (4)); 2 Keff and the interaction temperature term, T0, assuming τ0 = 10−10 s, from Vogel−Fulcher law (Equation (5)).