Fitting Biochars and Activated Carbons from Residues of the Olive Oil Industry as Supports of Fe- Catalysts for the Heterogeneous Fenton-Like Treatment of Simulated Olive Mill Wastewater

 ,
,  ,
,  and
and 
Abstract
1. Introduction
2. Materials and Methods
2.1. Catalysts Synthesis
2.2. Catalysts Characterization
2.3. Synthetic Wastewater and Experimental Procedure
2.4. Analytical Methods
3. Results and Discussion
3.1. Textural and Chemical Characterization
3.2. Treatment of Simulated OMW
3.3. Further Considerations
4. Conclusions
Supplementary Materials
Author Contributions
Funding
Acknowledgments
Conflicts of Interest
References
- Casani, S.; Rouhany, M.; Knøchel, S. A discussion paper on challenges and limitations to water reuse and hygiene in the food industry. Water Res. 2005, 39, 1134–1146. [Google Scholar] [CrossRef] [PubMed]
- FAOSTAT—Food and Agriculture Organization Corporate Statistical Database. Available online: http://www.fao.org/statistics/en/ (accessed on 4 October 2019).
- IOOC—International Olive Oil Council. Available online: http://www.internationaloliveoil.org (accessed on 8 May 2019).
- Gebreyohannes, A.Y.; Mazzei, R.; Giorno, L. Trends and current practices of olive mill wastewater treatment: Application of integrated membrane process and its future perspective. Sep. Purif. Technol. 2016, 162, 45–60. [Google Scholar] [CrossRef]
- McNamara, C.J.; Anastasiou, C.C.; O’Flaherty, V.; Mitchell, R. Biorremediation of Olive Mill Wastewater. Int. Biodeterior. Biodegrad. 2008, 61, 127–134. [Google Scholar]
- Khoufi, S.; Hamza, M.; Sayadi, S. Enzymatic hydrolysis of olive wastewater for hydroxytyrosol enrichment. Bioresour. Technol. 2011, 102, 9050–9058. [Google Scholar] [CrossRef]
- Tsagaraki, E.; Lazarides, H.N.; Petrotos, K.B. Olive mill wastewater treatment. In Utilization of By-Products and Treatment of Waste in the Food Industry; Oreopoulou, V., Russ, W., Eds.; Springer: Boston, MA, USA, 2007; pp. 133–157. ISBN 0387335110. [Google Scholar]
- Koutsos, T.M.; Chatzistathis, T.; Balampekou, E.I. A new framework proposal, towards a common EU agricultural policy, with the best sustainable practices for the re-use of olive mill wastewater. Sci. Total Environ. 2018, 622–623, 942–953. [Google Scholar] [CrossRef]
- Karaouzas, I.; Skoulikidis, N.T.; Giannakou, U.; Albanis, T.A. Spatial and temporal effects of olive mill wastewaters to stream macroinvertebrates and aquatic ecosystems status. Water Res. 2011, 45, 6334–6346. [Google Scholar] [CrossRef]
- Danellakis, D.; Ntaikou, I.; Kornaros, M.; Dailianis, S. Olive oil mill wastewater toxicity in the marine environment: Alterations of stress indices in tissues of mussel Mytilus galloprovincialis. Aquat. Toxicol. 2011, 101, 358–366. [Google Scholar] [CrossRef]
- Pelendridou, K.; Michailides, M.K.; Zagklis, D.P.; Tekerlekopoulou, A.G.; Paraskeva, C.A.; Vayenas, D.V. Treatment of olive mill wastewater using a coagulation-flocculation process either as a single step or as post-treatment after aerobic biological treatment. J. Chem. Technol. Biotechnol. 2014, 89, 1866–1874. [Google Scholar] [CrossRef]
- Nassar, N.N.; Arar, L.A.; Marei, N.N.; Abu Ghanim, M.M.; Dwekat, M.S.; Sawalha, S.H. Treatment of olive mill based wastewater by means of magnetic nanoparticles: Decolourization, dephenolization and COD removal. Environ. Nanotechnol. Monit. Manag. 2014, 1–2, 14–23. [Google Scholar] [CrossRef]
- Flores, N.; Brillas, E.; Centellas, F.; Rodríguez, R.M.; Cabot, P.L.; Garrido, J.A.; Sirés, I. Treatment of olive oil mill wastewater by single electrocoagulation with different electrodes and sequential electrocoagulation/electrochemical Fenton-based processes. J. Hazard. Mater. 2018, 347, 58–66. [Google Scholar] [CrossRef]
- Amaral, C.; Lucas, M.S.; Sampaio, A.; Peres, J.A.; Dias, A.A.; Peixoto, F.; do R. Anjos, M.; Pais, C. Biodegradation of olive mill wastewaters by a wild isolate of Candida oleophila. Int. Biodeterior. Biodegrad. 2012, 68, 45–50. [Google Scholar] [CrossRef]
- Stoyanova, E.; Lundaa, T.; Bochmann, G.; Fuchs, W. Overcoming the bottlenecks of anaerobic digestion of olive mill solid waste by two-stage fermentation. Environ. Technol. 2017, 38, 394–405. [Google Scholar] [CrossRef] [PubMed]
- Sampaio, M.A.; Gonçalves, M.R.; Marques, I.P. Anaerobic digestion challenge of raw olive mill wastewater. Bioresour. Technol. 2011, 102, 10810–10818. [Google Scholar] [CrossRef] [PubMed]
- Chedeville, O.; Debacq, M.; Porte, C. Removal of phenolic compounds present in olive mill wastewaters by ozonation. Desalination 2009, 249, 865–869. [Google Scholar] [CrossRef]
- Domingues, E.; Gomes, J.; Quina, M.; Quinta-Ferreira, R.; Martins, R.; Domingues, E.; Gomes, J.; Quina, M.J.; Quinta-Ferreira, R.M.; Martins, R.C. Detoxification of olive mill wastewaters by Fenton’s process. Catalysts 2018, 8, 662. [Google Scholar] [CrossRef]
- Agabo García, C.; Hodaifa, G. Real olive oil mill wastewater treatment by photo-Fenton system using artificial ultraviolet light lamps. J. Clean. Prod. 2017, 162, 743–753. [Google Scholar] [CrossRef]
- Un, U.T.; Altay, U.; Koparal, A.S.; Ogutveren, U.B. Complete treatment of olive mill wastewaters by electrooxidation. Chem. Eng. J. 2008, 139, 445–452. [Google Scholar] [CrossRef]
- Ochando-Pulido, J.M.; Pimentel-Moral, S.; Verardo, V.; Martinez-Ferez, A. A focus on advanced physico-chemical processes for olive mill wastewater treatment. Sep. Purif. Technol. 2017, 179, 161–174. [Google Scholar] [CrossRef]
- Yalili Kiliç, M.; Yonar, T.; Kestioǧlu, K. Pilot-scale treatment of olive oil mill wastewater by physicochemical and advanced oxidation processes. Environ. Technol. 2013, 34, 1521–1531. [Google Scholar] [CrossRef]
- Amaral-Silva, N.; Martins, R.C.; Castro-Silva, S.; Quinta-Ferreira, R.M. Integration of traditional systems and advanced oxidation process technologies for the industrial treatment of olive mill wastewaters. Environ. Technol. 2016, 37, 2524–2535. [Google Scholar] [CrossRef]
- Papaphilippou, P.C.; Yiannapas, C.; Politi, M.; Daskalaki, V.M.; Michael, C.; Kalogerakis, N.; Mantzavinos, D.; Fatta-Kassinos, D. Sequential coagulation-flocculation, solvent extraction and photo-Fenton oxidation for the valorization and treatment of olive mill effluent. Chem. Eng. J. 2013, 224, 82–88. [Google Scholar] [CrossRef]
- El-Gohary, F.A.; Badawy, M.I.; El-Khateeb, M.A.; El-Kalliny, A.S. Integrated treatment of olive mill wastewater (OMW) by the combination of Fenton’s reaction and anaerobic treatment. J. Hazard. Mater. 2009, 162, 1536–1541. [Google Scholar] [CrossRef] [PubMed]
- Amor, C.; Lucas, M.S.; García, J.; Dominguez, J.R.; De Heredia, J.B.; Peres, J.A. Combined treatment of olive mill wastewater by Fenton’s reagent and anaerobic biological process. J. Environ. Sci. Health Part A 2015, 50, 161–168. [Google Scholar] [CrossRef] [PubMed]
- Vlyssides, A.G.; Lamprou, G.K.; Vlysidis, A. Industrial case studies on the detoxificaton of OMWW using Fenton oxidation process followed by biological processes for energy and compost production. Olive Mill Waste Recent Adv. Sustain. Manag. 2017, 119–138. [Google Scholar]
- Neyens, E.; Baeyens, J. A review of classic Fenton’s peroxidation as an advanced oxidation technique. J. Hazard. Mater. 2003, 98, 33–50. [Google Scholar] [CrossRef]
- Zhu, Y.; Zhu, R.; Xi, Y.; Zhu, J.; Zhu, G.; He, H. Strategies for enhancing the heterogeneous Fenton catalytic reactivity: A review. Appl. Catal. B Environ. 2019, 255, 117739. [Google Scholar] [CrossRef]
- Xu, X.; Chen, W.; Zong, S.; Ren, X.; Liu, D. Magnetic clay as catalyst applied to organics degradation in a combined adsorption and Fenton-like process. Chem. Eng. J. 2019, 373, 140–149. [Google Scholar] [CrossRef]
- Guélou, E.; Barrault, J.; Fournier, J.; Tatibouët, J.M. Active iron species in the catalytic wet peroxide oxidation of phenol over pillared clays containing iron. Appl. Catal. B Environ. 2003, 44, 1–8. [Google Scholar] [CrossRef]
- Martínez, F.; Melero, J.A.; Botas, J.Á.; Isabel Pariente, M.; Molina, R. Treatment of phenolic effluents by catalytic wet hydrogen peroxide oxidation over Fe2O3/SBA-15 extruded catalyst in a fixed-bed reactor. Ind. Eng. Chem. Res. 2007, 46, 4396–4405. [Google Scholar] [CrossRef]
- Xiang, L.; Royer, S.; Zhang, H.; Tatibouët, J.M.; Barrault, J.; Valange, S. Properties of iron-based mesoporous silica for the CWPO of phenol: A comparison between impregnation and co-condensation routes. J. Hazard. Mater. 2009, 172, 1175–1184. [Google Scholar] [CrossRef]
- Shukla, P.; Wang, S.; Sun, H.; Ang, H.M.; Tadé, M. Adsorption and heterogeneous advanced oxidation of phenolic contaminants using Fe loaded mesoporous SBA-15 and H2O2. Chem. Eng. J. 2010, 164, 255–260. [Google Scholar] [CrossRef]
- Duarte, F.; Madeira, L.M. Fenton- and photo-Fenton-like degradation of a textile dye by heterogeneous processes with Fe/ZSM-5 zeolite. Sep. Sci. Technol. 2010, 45, 1512–1520. [Google Scholar] [CrossRef]
- Zazo, J.A.; Casas, J.A.; Mohedano, A.F.; Rodríguez, J.J. Catalytic wet peroxide oxidation of phenol with a Fe/active carbon catalyst. Appl. Catal. B Environ. 2006, 65, 261–268. [Google Scholar] [CrossRef]
- Duarte, F.; Morais, V.; Maldonado-Hódar, F.J.; Madeira, L.M. Treatment of textile effluents by the heterogeneous Fenton process in a continuous packed-bed reactor using Fe/activated carbon as catalyst. Chem. Eng. J. 2013, 232, 34–41. [Google Scholar] [CrossRef]
- Esteves, B.M.; Rodrigues, C.S.D.; Boaventura, R.A.R.; Maldonado-Hódar, F.J.; Madeira, L.M. Coupling of acrylic dyeing wastewater treatment by heterogeneous Fenton oxidation in a continuous stirred tank reactor with biological degradation in a sequential batch reactor. J. Environ. Manag. 2016, 166, 193–203. [Google Scholar] [CrossRef] [PubMed]
- Galiatsatou, P.; Metaxas, M.; Arapoglou, D.; Kasselouri-Rigopoulou, V. Treatment of olive mill waste water with activated carbons from agricultural by-products. Waste Manag. 2002, 22, 803–812. [Google Scholar] [CrossRef]
- Spahis, N.; Addoun, A.; Mahmoudi, H.; Ghaffour, N. Purification of water by activated carbon prepared from olive stones. Desalination 2008, 222, 519–527. [Google Scholar] [CrossRef]
- Figueiredo, J.L.; Pereira, M.F.R. The role of surface chemistry in catalysis with carbons. Catal. Today 2010, 150, 2–7. [Google Scholar] [CrossRef]
- Rodriguez-Reinoso, F. The role of carbon materials in heterogeneous catalysis. Carbon N. Y. 1998, 36, 159–175. [Google Scholar] [CrossRef]
- Rey, A.; Faraldos, M.; Bahamonde, A.; Casas, J.A.; Zazo, J.A.; Rodríguez, J.J. Role of the activated carbon surface on catalytic wet peroxide oxidation. Ind. Eng. Chem. Res. 2008, 47, 8166–8174. [Google Scholar] [CrossRef]
- Moreno-Castilla, C.; Ferro-García, M.A.; Joly, J.P.; Bautista-Toledo, I.; Carrasco-Marín, F.; Rivera-Utrilla, J. Activated carbon surface modifications by nitric acid, hydrogen peroxide, and ammonium peroxydisulfate treatments. Langmuir 1995, 11, 4386–4392. [Google Scholar] [CrossRef]
- Martins, R.C.; Amaral-Silva, N.; Quinta-Ferreira, R.M. Ceria based solid catalysts for Fenton’s depuration of phenolic wastewaters, biodegradability enhancement and toxicity removal. Appl. Catal. B Environ. 2010, 99, 135–144. [Google Scholar] [CrossRef]
- Martins, R.C.; Gomes, T.; Quinta-ferreira, R.M. Fenton’s depuration of weathered olive mill wastewaters over a Fe-Ce-O solid catalyst. Ind. Eng. Chem. Res. 2010, 49, 9043–9051. [Google Scholar] [CrossRef]
- Najjar, W.; Azabou, S.; Sayadi, S.; Ghorbel, A. Screening of Fe-BEA catalysts for wet hydrogen peroxide oxidation of crude olive mill wastewater under mild conditions. Appl. Catal. B Environ. 2009, 88, 299–304. [Google Scholar] [CrossRef]
- Maduna, K.; Kumar, N.; Aho, A.; Wärnå, J.; Zrnčević, S.; Murzin, D.Y. Kinetics of catalytic wet peroxide oxidation of phenolics in olive oil mill wastewaters over copper catalysts. ACS Omega 2018, 3, 7247–7260. [Google Scholar] [CrossRef]
- Stasinakis, A.S.; Elia, I.; Petalas, A.V.; Halvadakis, C.P. Removal of total phenols from olive-mill wastewater using an agricultural by-product, olive pomace. J. Hazard. Mater. 2008, 160, 408–413. [Google Scholar] [CrossRef]
- Alslaibi, T.M.; Abustan, I.; Ahmad, M.A.; Foul, A.A. Kinetics and equilibrium adsorption of iron (II), lead (II), and copper (II) onto activated carbon prepared from olive stone waste. Desalin. Water Treat. 2014, 52, 7887–7897. [Google Scholar] [CrossRef]
- Petrella, A.; Spasiano, D.; Acquafredda, P.; De Vietro, N.; Ranieri, E.; Cosma, P.; Rizzi, V.; Petruzzelli, V.; Petruzzelli, D. Heavy metals retention (Pb(II), Cd(II), Ni(II)) from single and multimetal solutions by natural biosorbents from the olive oil milling operations. Process Saf. Environ. Prot. 2018, 114, 79–90. [Google Scholar] [CrossRef]
- Brunauer, S.; Emmett, P.H.; Teller, E. Adsorption of gases in multimolecular layers. J. Am. Chem. Soc. 1938, 60, 309–319. [Google Scholar] [CrossRef]
- Bansal, R.C.; Donnet, J.B.; Stoeckli, F. Active Carbon; Dekker: New York, NY, USA, 1998. [Google Scholar]
- Duarte, F.; Maldonado-Hódar, F.J.; Madeira, L.M. Influence of the characteristics of carbon materials on their behaviour as heterogeneous Fenton catalysts for the elimination of the azo dye Orange II from aqueous solutions. Appl. Catal. B Environ. 2011, 103, 109–115. [Google Scholar] [CrossRef]
- Neimark, A.V.; Lin, Y.; Ravikovitch, P.I.; Thommes, M. Quenched solid density functional theory and pore size analysis of micro-mesoporous carbons. Carbon N. Y. 2009, 47, 1617–1628. [Google Scholar] [CrossRef]
- Pastrana-Martínez, L.M.; Morales-Torres, S.; Papageorgiou, S.K.; Katsaros, F.K.; Romanos, G.E.; Figueiredo, J.L.; Faria, J.L.; Falaras, P.; Silva, A.M.T. Photocatalytic behaviour of nanocarbon–TiO2 composites and immobilization into hollow fibres. Appl. Catal. B Environ. 2013, 142–143, 101–111. [Google Scholar] [CrossRef]
- Nieto, L.M.; Hodaifa, G.; Rodríguez, S.; Giménez, J.A.; Ochando, J. Degradation of organic matter in olive-oil mill wastewater through homogeneous Fenton-like reaction. Chem. Eng. J. 2011, 173, 503–510. [Google Scholar] [CrossRef]
- Esteves, B.M.; Rodrigues, C.S.D.; Maldonado-Hódar, F.J.; Madeira, L.M. Treatment of high-strength olive mill wastewater by combined Fenton-like oxidation and coagulation/flocculation. J. Environ. Chem. Eng. 2019, 7, 103252. [Google Scholar] [CrossRef]
- Alver, A.; Baştürk, E.; Kiliç, A.; Karataş, M. Use of advanced oxidation process to improve the biodegradability of olive oil mill effluents. Process Saf. Environ. Prot. 2015, 98, 319–324. [Google Scholar] [CrossRef]
- Sellers, R.M. Spectrophotometric determination of hydrogen peroxide using potassium titanium(IV) oxalate. Analyst 1980, 105, 950–954. [Google Scholar] [CrossRef]
- Cagnon, B.; Py, X.; Guillot, A.; Stoeckli, F.; Chambat, G. Contributions of hemicellulose, cellulose and lignin to the mass and the porous properties of chars and steam activated carbons from various lignocellulosic precursors. Bioresour. Technol. 2009, 100, 292–298. [Google Scholar] [CrossRef]
- Miranda, M.; Bica, C.; Nachtigallm, S.; Rehman, N.; Rosa, S. Kinetical thermal degradation study of maize straw and soybean hull celluloses by simultaneous DSC-TGA and MDSC techniques. Thermochim. Acta 2013, 565, 65–71. [Google Scholar] [CrossRef]
- Alejandro, A.-C.; Lobato-Peralta, D.R.; Arreola-Ramos, C.E.; Martínez-Casillas, D.C.; Pacheco-Catalán, D.E.; Cuentas-Gallegos, A.K.; Arancibia-Bulnes, C.A.; Villafán-Vidales, H.I. Exploring the influence of solar pyrolysis operation parameters on characteristics of carbon materials. J. Anal. Appl. Pyrolysis 2019, 140, 290–298. [Google Scholar]
- Morales-Torres, S.; Silva, A.M.T.; Maldonado-Hódar, F.J.; Machado, B.F.; Pérez-Cadenas, A.F.; Faria, J.L.; Figueiredo, J.L.; Carrasco-Marín, F. Pt-catalysts supported on activated carbons for catalytic wet air oxidation of aniline: Activity and stability. Appl. Catal. B Environ. 2011, 105, 86–94. [Google Scholar] [CrossRef]
- Pérez-Cadenas, A.F.; Maldonado-Hódar, F.J.; Moreno-Castilla, C. On the nature of surface acid sites of chlorinated activated carbons. Carbon N. Y. 2003, 41, 473–478. [Google Scholar] [CrossRef]
- Vivo-Vilches, J.F.; Bailón-García, E.; Pérez-Cadenas, A.F.; Carrasco-Marín, F.; Maldonado-Hódar, F.J. Tailoring the surface chemistry and porosity of activated carbons: Evidence of reorganization and mobility of oxygenated surface groups. Carbon N. Y. 2014, 68, 520–530. [Google Scholar] [CrossRef]
- Zhang, S.; Li, X.Y.; Chen, J.P. An XPS study for mechanisms of arsenate adsorption onto a magnetite-doped activated carbon fiber. J. Colloid Interface Sci. 2010, 343, 232–238. [Google Scholar] [CrossRef] [PubMed]
- Saiphaneendra, B.; Saxena, T.; Singh, S.A.; Madras, G.; Srivastava, C. Synergistic effect of co-existence of hematite (α-Fe2O3) and magnetite (Fe3O4) nanoparticles on graphene sheet for dye adsorption. J. Environ. Chem. Eng. 2017, 5, 26–37. [Google Scholar] [CrossRef]
- Zubir, N.A.; Yacou, C.; Motuzas, J.; Zhang, X.; Diniz da Costa, J.C. Structural and functional investigation of graphene oxide–Fe3O4 nanocomposites for the heterogeneous Fenton-like reaction. Sci. Rep. 2014, 4, 4594. [Google Scholar] [CrossRef] [PubMed]
- McIntyre, N.S.; Zetaruk, D.G. X-ray photoelectron spectroscopic studies of iron oxides. Anal. Chem. 1977, 49, 1521–1529. [Google Scholar] [CrossRef]
- Li, X.; Wang, H.; Shao, G.; Wang, G.; Lu, L. Low temperature reduction of NO by activated carbons impregnated with Fe based catalysts. Int. J. Hydrogen Energy 2019, 44, 25265–25275. [Google Scholar] [CrossRef]
- EEC List of Council Directives 76/4647; European Economic Community: Brussels, Belgium, 1982.
- Liu, J.C.; Huang, C.P. Adsorption of some substituted phenols onto hydrous ZnS(s). J. Colloid Interface Sci. 1992, 153, 167–176. [Google Scholar] [CrossRef]
- Moreno-Castilla, C.; Rivera-Utrilla, J.; López-Ramón, M.V.; Carrasco-Marín, F. Adsorption of some substituted phenols on activated carbons from a bituminous coal. Carbon N. Y. 1995, 33, 845–851. [Google Scholar] [CrossRef]
- Moreno-Castilla, C.; López-Ramón, M.V.; Fontecha-Cámara, M.Á.; Álvarez, M.A.; Mateus, L. Removal of phenolic compounds from water using copper ferrite nanosphere composites as fenton catalysts. Nanomaterials 2019, 9, 901. [Google Scholar] [CrossRef]
- Andjelković, M.; Van Camp, J.; De Meulenaer, B.; Depaemelaere, G.; Socaciu, C.; Verloo, M.; Verhe, R. Iron-chelation properties of phenolic acids bearing catechol and galloyl groups. Food Chem. 2006, 98, 23–31. [Google Scholar] [CrossRef]
- Silva, A.M.T.; Nouli, E.; Xekoukoulotakis, N.P.; Mantzavinos, D. Effect of key operating parameters on phenols degradation during H2O2-assisted TiO2 photocatalytic treatment of simulated and actual olive mill wastewaters. Appl. Catal. B Environ. 2007, 73, 11–22. [Google Scholar] [CrossRef]
- Azabou, S.; Najjar, W.; Gargoubi, A.; Ghorbel, A.; Sayadi, S. Catalytic wet peroxide photo-oxidation of phenolic olive oil mill wastewater contaminants. Part II. Degradation and detoxification of low-molecular mass phenolic compounds in model and real effluent. Appl. Catal. B Environ. 2007, 77, 166–174. [Google Scholar] [CrossRef]
- Ramirez, J.H.; Duarte, F.M.; Martins, F.G.; Costa, C.A.; Madeira, L.M. Modelling of the synthetic dye Orange II degradation using Fenton’s reagent: From batch to continuous reactor operation. Chem. Eng. J. 2009, 148, 394–404. [Google Scholar] [CrossRef]
- Satishkumar, G.; Landau, M.V.; Buzaglo, T.; Frimet, L.; Ferentz, M.; Vidruk, R.; Wagner, F.; Gal, Y.; Herskowitz, M. Fe/SiO2 heterogeneous Fenton catalyst for continuous catalytic wet peroxide oxidation prepared in situ by grafting of iron released from LaFeO3. Appl. Catal. B Environ. 2013, 138–139, 276–284. [Google Scholar] [CrossRef]
- Ribeiro, S.; Silva, A.M.T.; Figueiredo, J.L.; Faria, J.L.; Gomes, H.T. The influence of structure and surface chemistry of carbon materials on the decomposition of hydrogen peroxide. Carbon N. Y. 2013, 62, 97–108. [Google Scholar]


| Catalyst | Starting Material | Carbonization | Activation Agent | Carb./Act. Yield (%) |
|---|---|---|---|---|
| OSC-Fe | Olive Stone | 800 °C/N2/2 h | - | 24 |
| OSC-AC-Fe | Olive Stone | 800 °C/N2/2 h | CO2 | 16 |
| OS-AC/KOH-Fe | Olive Stone | - | KOH | 14 |
| SDC-Fe | Sawdust | 800 °C/N2/2 h | - | 23 |
| SDC-AC-Fe | Sawdust | 800 °C/N2/2 h | CO2 | 16 |
| N-Fe | Norit RX3 Extra | Commercial, used as received | - | |
| M-Fe | Merck | Commercial, used as received | - | |
| OMW Source | pH | COD (g/L) | BOD5 (g/L) | TOC (g/L) | TPh (g/L) | TSS (g/L) | References |
|---|---|---|---|---|---|---|---|
| Synthetic solution | 3.8 | 0.77 | 0.19 | 0.21 | 0.35 | - | This work |
| Storage pond (weathered) | 6.3 | 1.7 | 0.47 | 0.31 | 0.18 | 0.25 | [46] |
| Olives washing | 6.3–7.2 | 0.8–4.1 | 0.3–1.5 | - | 0.04–0.10 | 8–18 | [21,57] |
| Extraction centrifuges | 3.5–6.0 | 4–200 | 0.8–100 | 8.3–26.0 | 0.1–7.4 | 2–35 | [21,47,58,59] |
| Sample | pHpzc | SBET (m2/g) | W0 (N2) (cm3/g) | L0 (N2) nm | W0 (CO2) (cm3/g) | Vmeso (cm3/g) | VT (cm3/g) |
|---|---|---|---|---|---|---|---|
| OSC | 10.3 | 136 | 0.06 | n.a. | 0.17 | 0.08 | 0.17 |
| OSC-Fe | 2.2 | 10 | 0.01 | n.a. | 0.16 | 0.03 | 0.04 |
| OSC-AC | 10.6 | 792 | 0.33 | 1.2 | 0.20 | 0.04 | 0.39 |
| OSC-AC-Fe | 2.4 | 546 | 0.23 | 1.4 | 0.13 | 0.05 | 0.30 |
| OS-AC/KOH | 8.3 | 1013 | 0.43 | 1.7 | 0.18 | 0.09 | 0.55 |
| OS-AC/KOH-Fe | 2.0 | 526 | 0.23 | 2.0 | 0.17 | 0.08 | 0.33 |
| SDC | 11.5 | 82 | 0.04 | n.a. | 0.11 | 0.08 | 0.14 |
| SDC-Fe | 4.2 | 9 | 0.00 | n.a. | 0.10 | 0.02 | 0.03 |
| SDC-AC | 10.7 | 565 | 0.24 | 1.6 | 0.15 | 0.10 | 0.39 |
| SDC-AC-Fe | 3.2 | 176 | 0.08 | n.a. | 0.12 | 0.10 | 0.21 |
| N | 11.6 | 1058 | 0.44 | 1.6 | 0.21 | 0.08 | 0.55 |
| N-Fe | 2.4 | 777 | 0.33 | 1.7 | 0.23 | 0.07 | 0.42 |
| M | 7.0 | 831 | 0.35 | 1.5 | 0.25 | 0.07 | 0.44 |
| M-Fe | 1.9 | 663 | 0.28 | 1.6 | 0.22 | 0.06 | 0.36 |
| Catalyst | Atomic Content (%) | ||||
|---|---|---|---|---|---|
| C | O | N | Fe | Others | |
| OSC-Fe | 91.5 | 7.2 | 0.3 | 0.8 | 0.2 |
| OSC-AC-Fe | 88.5 | 9.6 | 0.2 | 1.6 | 0.1 |
| OSC-AC-Fe used | 75.8 | 20.8 | 1.5 | 1.9 | - |
| OS-AC/KOH-Fe | 86.9 | 10.7 | 0.4 | 1.7 | 0.3 |
| SDC-Fe | 80.8 | 13.7 | - | 2.4 | 3.1 |
| SDC-AC-Fe | 77.5 | 15.7 | 0.7 | 4.6 | 1.5 |
| N-Fe | 76.2 | 17.4 | 0.3 | 4.2 | 1.9 |
| M-Fe | 89.8 | 8.0 | 0.3 | 1.8 | 0.1 |
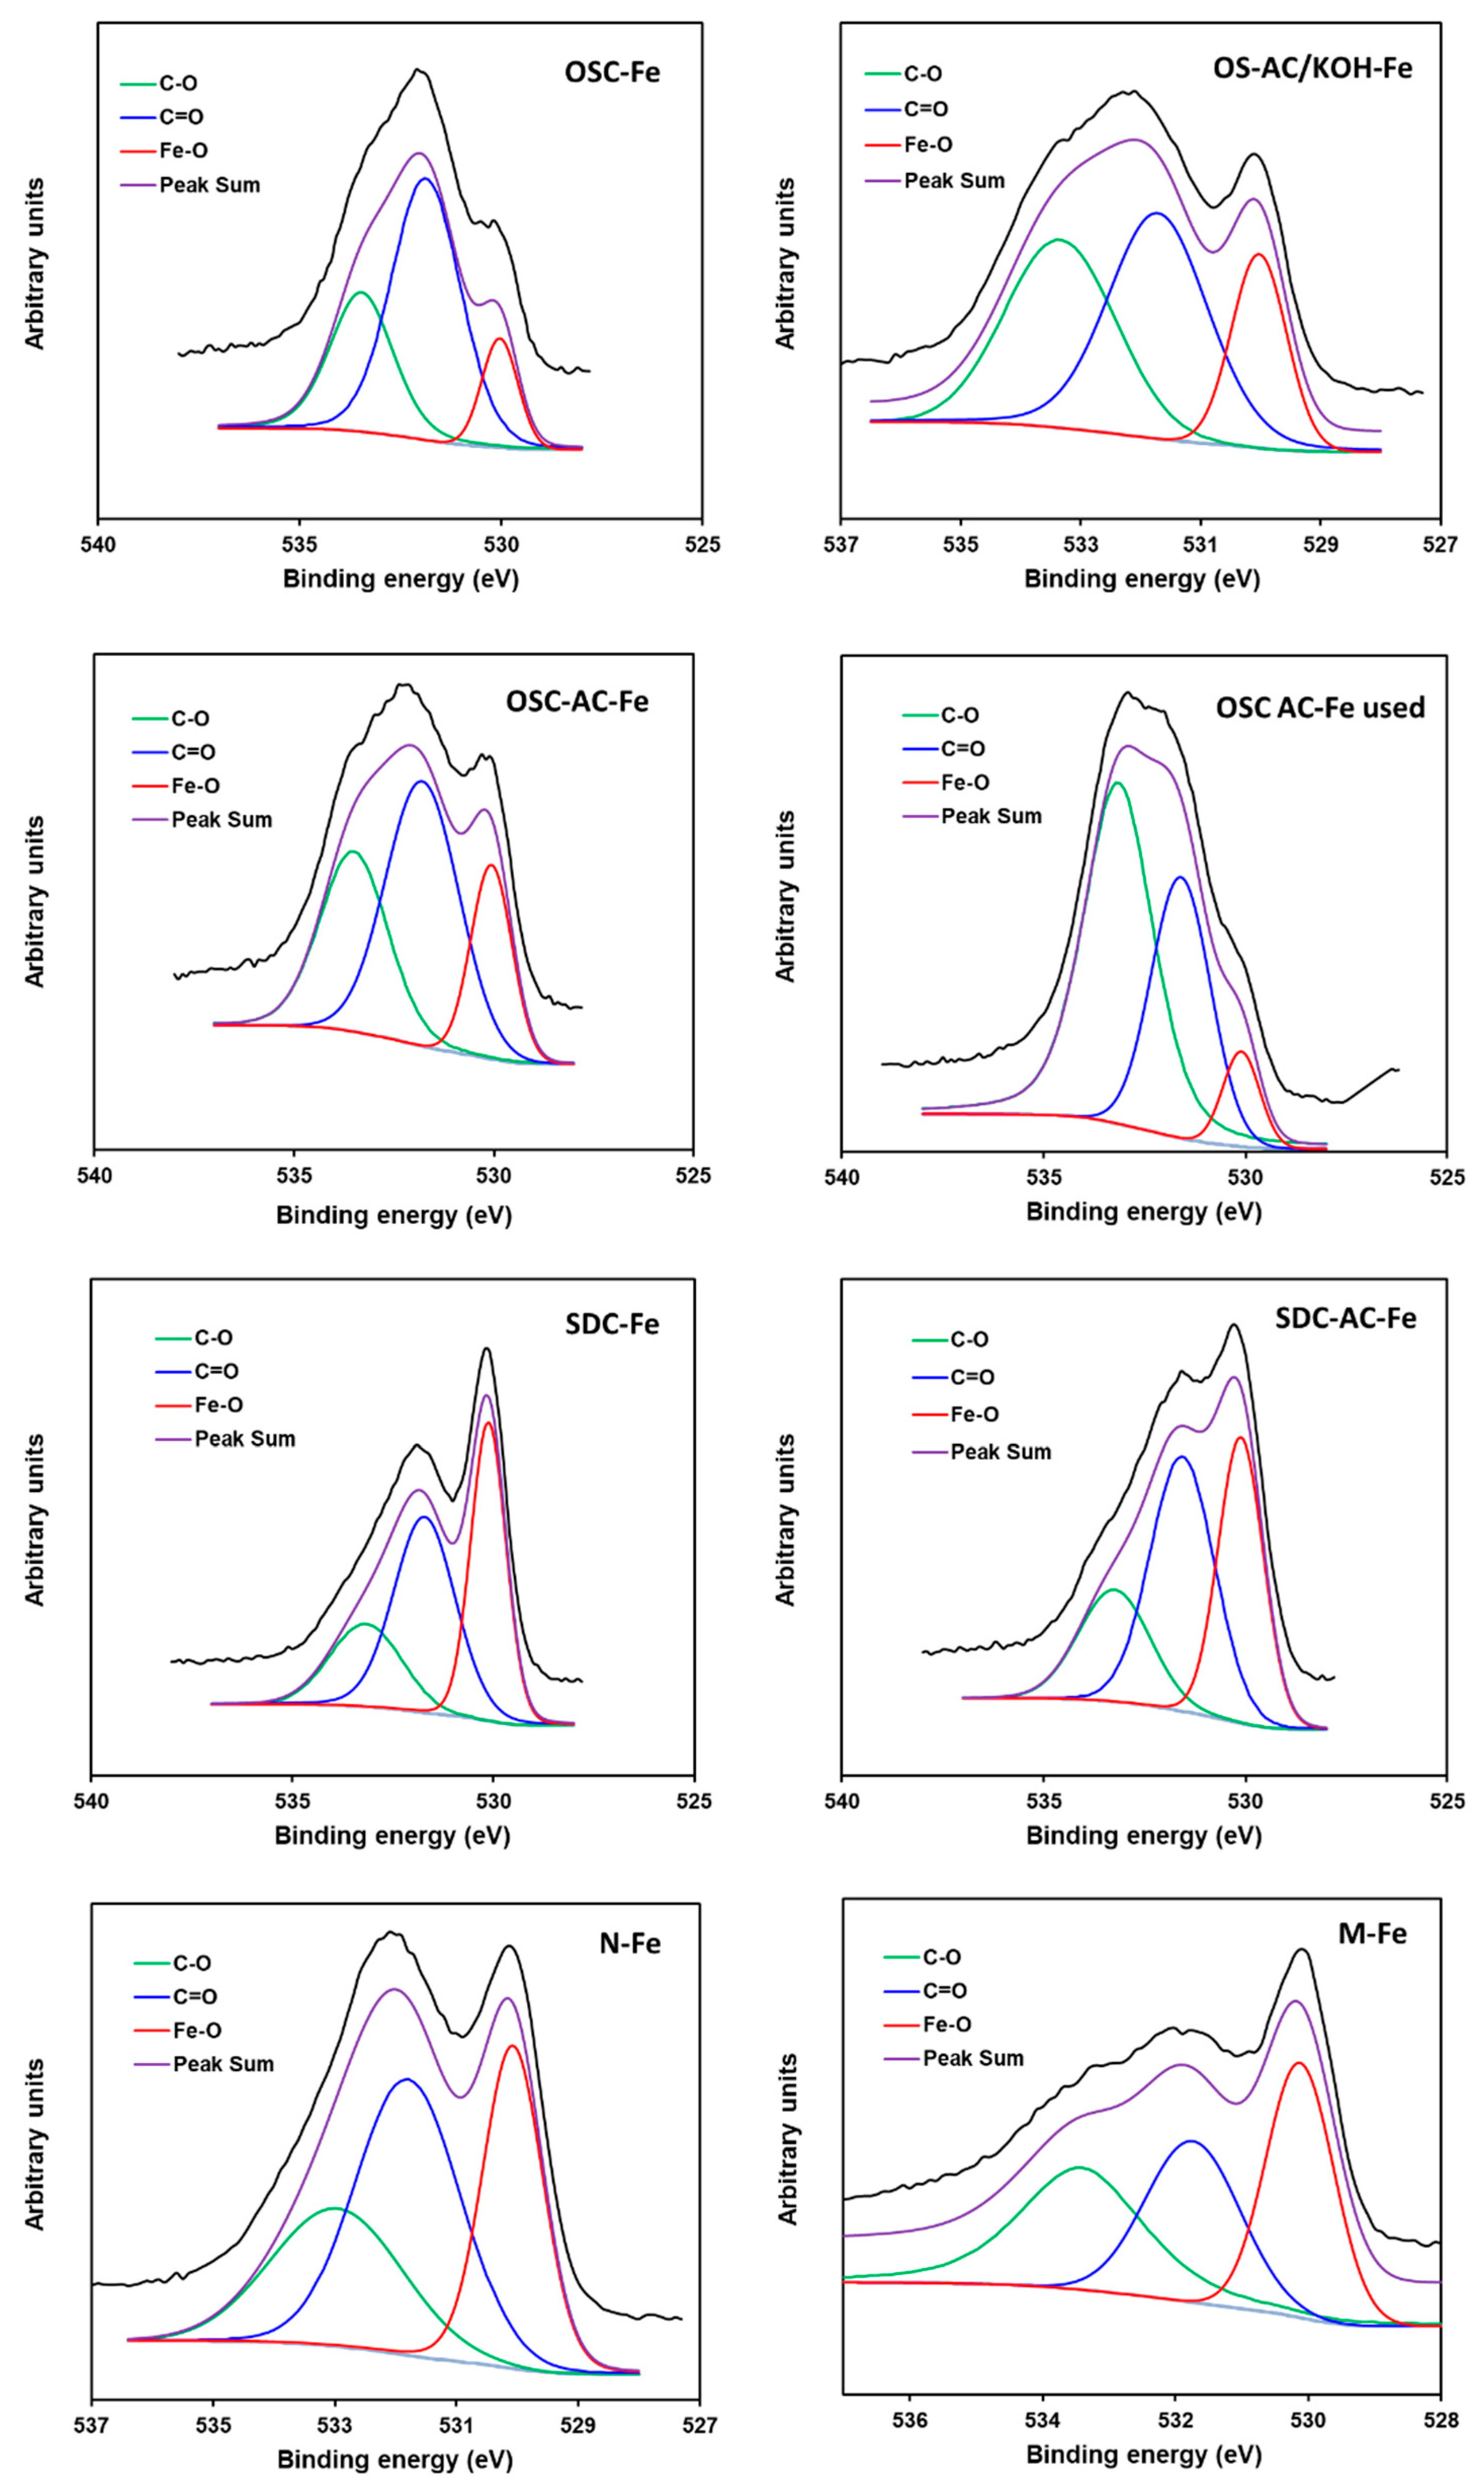
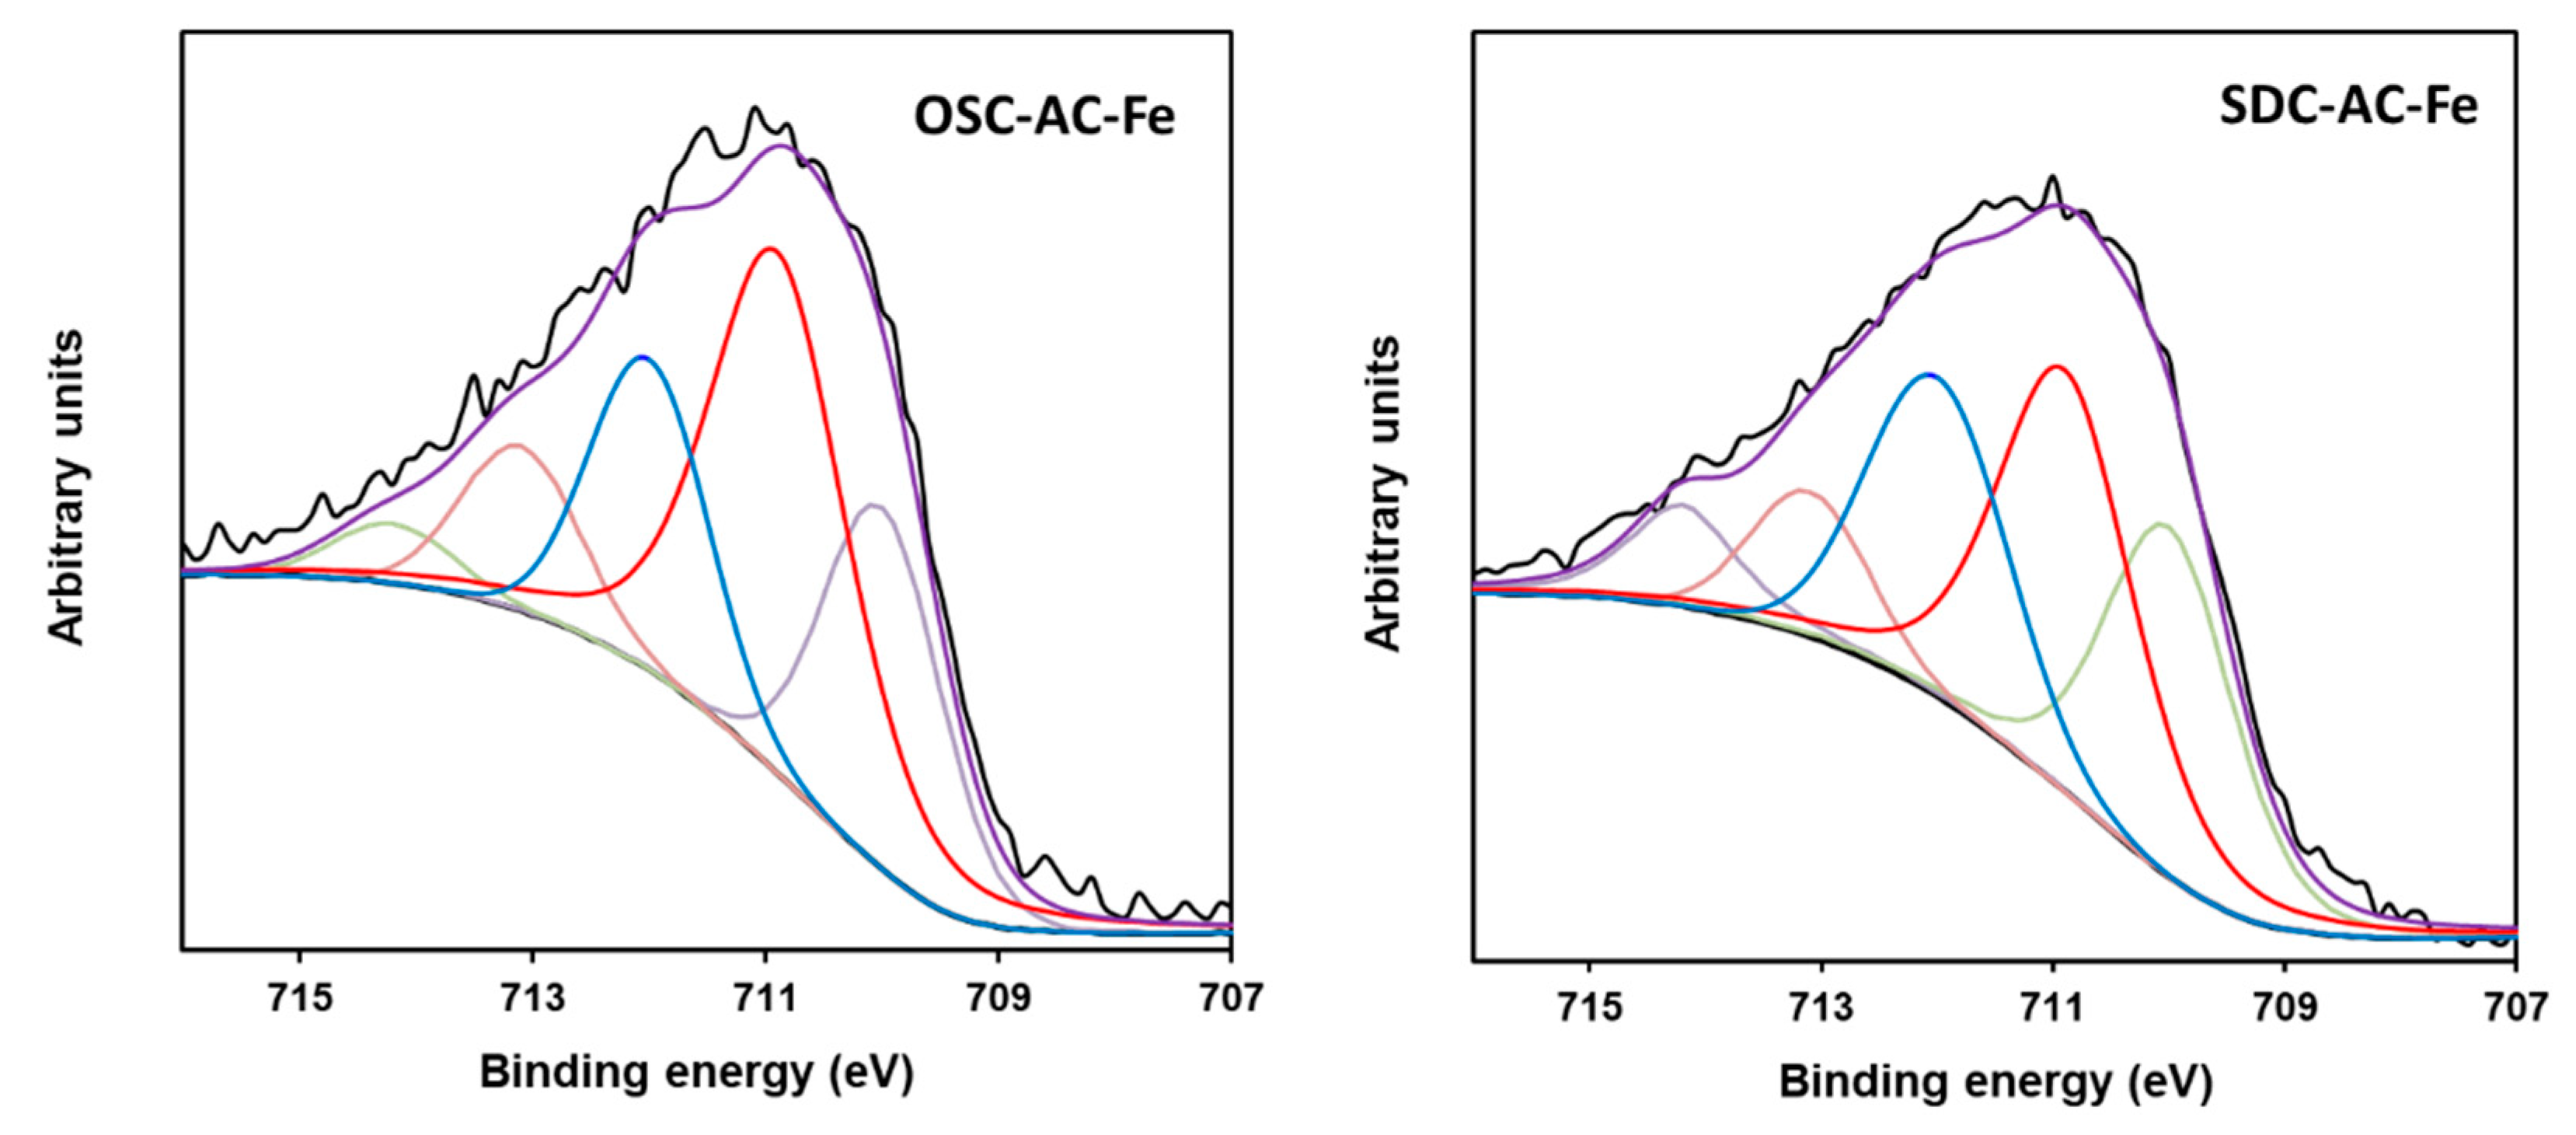
| Peak (eV) | OSC-Fe | OSC-AC-Fe | OSC-AC-Fe Used | OS-AC/KOH-Fe | SDC-Fe | SDC-AC-Fe | M-Fe | N-Fe |
|---|---|---|---|---|---|---|---|---|
| O1s | Area % | |||||||
| Fe–O (530.1) | 12 | 20 | 8 | 20 | 37 | 35 | 34 | 30 |
| C=O (531.6) | 58 | 48 | 33 | 43 | 43 | 44 | 30 | 27 |
| C–O (533.2) | 30 | 32 | 59 | 37 | 20 | 21 | 36 | 43 |
| Fe2p3/2 | Area % | |||||||
| Fe2+ (709.9) | 13 | 22 | 29 | 25 | 29 | 23 | 27 | 20 |
| Fe3+ (710.9) | 30 | 45 | 32 | 40 | 28 | 37 | 36 | 41 |
| Fe3+ (712.0) | 34 | 19 | 18 | 18 | 28 | 17 | 19 | 21 |
| Fe3+ (713.0) | 13 | 10 | 16 | 15 | 9 | 12 | 13 | 11 |
| Fe3+ (714.1) | 10 | 4 | 5 | 2 | 6 | 11 | 5 | 7 |
© 2020 by the authors. Licensee MDPI, Basel, Switzerland. This article is an open access article distributed under the terms and conditions of the Creative Commons Attribution (CC BY) license (http://creativecommons.org/licenses/by/4.0/).
Share and Cite
Esteves, B.M.; Morales-Torres, S.; Maldonado-Hódar, F.J.; Madeira, L.M. Fitting Biochars and Activated Carbons from Residues of the Olive Oil Industry as Supports of Fe- Catalysts for the Heterogeneous Fenton-Like Treatment of Simulated Olive Mill Wastewater. Nanomaterials 2020, 10, 876. https://doi.org/10.3390/nano10050876
Esteves BM, Morales-Torres S, Maldonado-Hódar FJ, Madeira LM. Fitting Biochars and Activated Carbons from Residues of the Olive Oil Industry as Supports of Fe- Catalysts for the Heterogeneous Fenton-Like Treatment of Simulated Olive Mill Wastewater. Nanomaterials. 2020; 10(5):876. https://doi.org/10.3390/nano10050876
Chicago/Turabian StyleEsteves, Bruno M., Sergio Morales-Torres, Francisco J. Maldonado-Hódar, and Luis M. Madeira. 2020. "Fitting Biochars and Activated Carbons from Residues of the Olive Oil Industry as Supports of Fe- Catalysts for the Heterogeneous Fenton-Like Treatment of Simulated Olive Mill Wastewater" Nanomaterials 10, no. 5: 876. https://doi.org/10.3390/nano10050876
APA StyleEsteves, B. M., Morales-Torres, S., Maldonado-Hódar, F. J., & Madeira, L. M. (2020). Fitting Biochars and Activated Carbons from Residues of the Olive Oil Industry as Supports of Fe- Catalysts for the Heterogeneous Fenton-Like Treatment of Simulated Olive Mill Wastewater. Nanomaterials, 10(5), 876. https://doi.org/10.3390/nano10050876