Article

Peculiarities of the Crystal Structure Evolution of BiFeO3–BaTiO3 Ceramics across Structural Phase Transitions

by
Dmitry V. Karpinsky
1,2,3,*,
Maxim V. Silibin
1,2,4,5,
Sergei V. Trukhanov
2,3,*,
Alex V. Trukhanov
2,3,
Alexander L. Zhaludkevich
2,
Siarhei I. Latushka
2,
Dmitry V. Zhaludkevich
2,
Vladimir A. Khomchenko
6,
Denis O. Alikin
7,
Alexander S. Abramov
7,
Tomasz Maniecki
8,
Waldemar Maniukiewicz
8,
Martin Wolff
9,
Volker Heitmann
9 and
Andrei L. Kholkin
7,10
1
Institute of Advanced Materials and Technologies, National Research University of Electronic Technology “MIET”, 124498 Moscow, Russia
2
Laboratory of Technology and Physics of Crystals Growth, Scientific-Practical Materials Research Centre of NAS of Belarus, 220072 Minsk, Belarus
3
Scientific and Educational Center “Nanotechnology”, South Ural State University, 454080 Chelyabinsk, Russia
4
Institute for Bionic Technologies and Engineering, I.M. Sechenov First Moscow State Medical University, 119991 Moscow, Russia
5
Scientific-Manufacturing Complex “Technological Centre” Shokin Square, House 1, Bld. 7, Zelenograd, 124498 Moscow, Russia
6
Center for Physics of the University of Coimbra, Department of Physics, University of Coimbra, 3004-516 Coimbra, Portugal
7
School of Natural Sciences and Mathematics, Ural Federal University, 620026 Ekaterinburg, Russia
8
Institute of General and Ecological Chemistry, Lodz University of Technology, 90-924 Lodz, Poland
9
Institute of Materials Research, Helmholtz-Zentrum Geesthacht, Zentrum für Material- und Küstenforschung GmbH, DE-21502 Geesthacht, Germany
10
Department of Physics & CICECO—Aveiro Institute of Materials, University of Aveiro, 3810-193 Aveiro, Portugal
*
Authors to whom correspondence should be addressed.
Nanomaterials 2020, 10(4), 801; https://doi.org/10.3390/nano10040801
Submission received: 23 March 2020 / Revised: 14 April 2020 / Accepted: 17 April 2020 / Published: 21 April 2020
(This article belongs to the Special Issue Oxide Magnetics)

Abstract

:
Evolution of the crystal structure of ceramics BiFeO3–BaTiO3 across the morphotropic phase boundary was analyzed using the results of macroscopic measuring techniques such as X-ray diffraction, differential scanning calorimetry, and differential thermal analysis, as well as the data obtained by local scale methods of scanning probe microscopy. The obtained results allowed to specify the concentration and temperature regions of the single phase and phase coexistent regions as well as to clarify a modification of the structural parameters across the rhombohedral–cubic phase boundary. The structural data show unexpected strengthening of structural distortion specific for the rhombohedral phase, which occurs upon dopant concentration and temperature-driven phase transitions to the cubic phase. The obtained results point to the non-monotonous character of the phase evolution, which is specific for metastable phases. The compounds with metastable structural state are characterized by enhanced sensitivity to external stimuli, which significantly expands the perspectives of their particular use.

Graphical Abstract

1. Introduction

Materials that simultaneously possess magnetic and electric ferroic orders belong to the multiferroic family and for the last two decades have attracted the attention of researchers in the field of functional oxides and materials science [1,2,3]. Ferrite-based materials, both single-phase [4,5,6] and composite [7,8,9], appear to be very interesting and practically significant. Materials in nanoform are very important at the moment, because they can have electronic properties that are more attractive than their bulk counterparts. Lately, many works have been devoted to obtaining and studying the properties of ferrites in nanoform [10,11,12,13,14]. In addition, magnetic materials are also of interest in nanoscale magnetic phase separation. It should be noted that functional oxides based on transition metal ions are promising materials for various technological applications as magnetic field sensors, working components in tunable microwave resonators, phase shifters, and other electronic devices and sensors [3,6,7,8,9,10].
One of the most promising materials in the area of multiferroics is bismuth orthoferrite (BiFeO3), which is characterized by transitions to magnetically ordered and ferroelectric state at temperatures well above room temperature, viz. TN ~650 K and TC ~1100 K, respectively [15,16]. It is known that chemical substitution of bismuth and iron ions allow to modify crystal structure of the compounds and thus change their physical properties, viz. magnetization, resistivity, electromechanical, and magnetoelectric parameters [17,18,19,20,21,22,23,24,25,26].
Chemical substitution by large rare earth ions (viz. La-Sm) settled in the A position of perovskite lattice leads to the following sequence of the structural transitions: polar rhombohedral-antipolar orthorhombic-nonpolar orthorhombic phase [19,27,28]. The compounds in the vicinity of the polar rhombohedral-antipolar orthorhombic phase boundary are characterized by rapid increase in piezoelectric coefficients as well as an increase in remnant magnetization. These phenomena have been associated with the metastable structural state ascribed to the compounds [19,29,30,31].
Substitution of bismuth ions with aliovalent alkali-earth ions Sr2+ and Ba2+ having ionic radii larger than that of Bi3+ ions leads to increase of the unit cell volume and causes structural transition from the polar rhombohedral phase to either the pseudo-cubic [32,33] or tetragonal phase [19,34]. Structural transformation occurs at the doping level of about 15–20%, regardless of the method used to prepare the compounds. Chemical substitution of Bi3+ by alkali-earth ions having a smaller ionic radius (e.g., Ca2+) causes more complicated structural transformations [29,30]. It should be noted that the threshold dopant concentration inducing the phase transitions to pseudo-cubic phase significantly depends on preparation conditions, oxygen content, and average grain size of the compounds. The mentioned factors hamper a determination of crystal structure evolution across the mentioned transitions and lead to ambiguous results in the literature [19,27,33].
Simultaneous doping at the A- and B-positions of the perovskite lattice allows to modify the sub-lattices responsible for polar and magnetic orders [35,36,37]. Thus, in compounds Bi1−xBaxFe1−xTixO3, an increase of the dopant content leads to structural transition from the polar rhombohedral phase to the polar tetragonal phase through the formation of an intermediate (pseudo)-cubic structure [8,37,38,39]. The compounds in vicinity of the rhombohedral-pseudocubic phase boundary are characterized by increased piezoelectric coefficient d33, reaching maximum value of about 250 pm/V in the compounds with 33% of BaTiO3 content. It should be noted that structural state of the solid solution with one-third of BaTiO3 content is characterized by the dominant pseudocubic phase with minor (~35%) fraction of the rhombohedral phase [37,38,39]. Moreover, our recent investigation involving the piezoresponse force microscopy measurements has revealed a polarizable state in compounds with x ~0.33, 0.35, while according to the XRD data, these compounds possess single phase cubic structure [37].
The available data describing the evolution of the crystal structure in the system Bi1−xBaxFe1−xTixO3 as well as the physical parameters declared in the different studies [37,40,41,42,43] have an ambiguous character and should be clarified. Our recent temperature-dependent structural measurements [38] performed for the compounds having dominant a rhombohedral phase within the mentioned phase boundary have revealed unexpected strengthening of the rhombohedral distortions at elevated temperatures. The most recent structural data obtained by the authors point to the non-monotonous character of the phase evolution from the polar rhombohedral to the cubic-like phase assuming a reinforcement of polar type distortion, which also affects piezoresponse in the compounds. Wide concentration range (~10%) of the phase coexistence area estimated for the compounds Bi1−xBaxFe1−xTixO3 facilitates careful and detailed analysis of the phase evolution driven by the dopant content and temperature. The current study is focused on structural aspects of the dopant and temperature-driven evolution of the structural state in the Bi1−xBaxFe1−xTixO3 compounds within the phase boundary region.

2. Materials and Methods

Polycrystalline compounds of Bi1−xBaxFe1−xTixO3 with 0.2 ≤ x ≤ 0.4 were prepared by a two-stage ceramic technique [38] using high-purity (≥99.5%) oxides Bi2O3, Fe2O3, TiO2, and carbonite BaCO3. The reagents taken in the following contents of the components x = 0.2 (20 mol.% of BaCO3 and TiO2), 0.25, 0.27, 0.3, 0.33, 0.35 and x = 0.4 were thoroughly mixed in a planetary ball mill (Retsch PM 200, Haan, Germany). Preliminary synthesis of the compounds pressed into tablets was performed at 900 °C. Final synthesis lasted for 20 h with temperature gradually increasing with the dopant content from 920 °C for the compound with x = 0.2 to T = 950 °C for the compounds with x = 0.4. After synthesis, the samples were quickly (100 °C/h) cooled down to room temperature.
Phase purity of the compounds was attested by X-ray diffraction (XRD) measurements recorded in the 2 Thetta range 20–80° with a step of 0.02° using a Bruker D8 diffractometer (Bruker Corporation, Billerica, MA, USA) with Cu-Kα radiation. The diffraction data were analyzed by the Rietveld method using the FullProf software (v2.5, ILL, Grenoble, France) [44]. Differential scanning calorimetry (DSC) and thermal analysis (DTA) were performed using a Mettler-Toledo GmbH (Mettler-Toledo GmbH, Columbus, OH, USA) instrument in argon flow. Scanning electron microscopy (SEM) images were taken for the morphology characterization with Hitachi SU-70 SEM (Hitachi Ltd., Tokyo, Japan). Piezoresponse force microscopy was done using a Ntegra Prima commercial scanning probe microscope (NT-MDT, Spectrum Instruments, Zelenograd, Moscow, Russia) equipped with external Zurich instruments HFLI lock-in amplifier and Scansens HA_NC tips (Scansens, Hamburg, Germany) with (stiffness 12 N/m, 30 nm nominal radius) under AC voltage with amplitude Vac = 6 V and frequency f = 21 kHz. Cantilever displacements was evaluated from vertical and lateral force calibrations [45]. Calibration of the probe tip displacements was made based on the quasi-static force-distance curves.

3. Results and Discussion

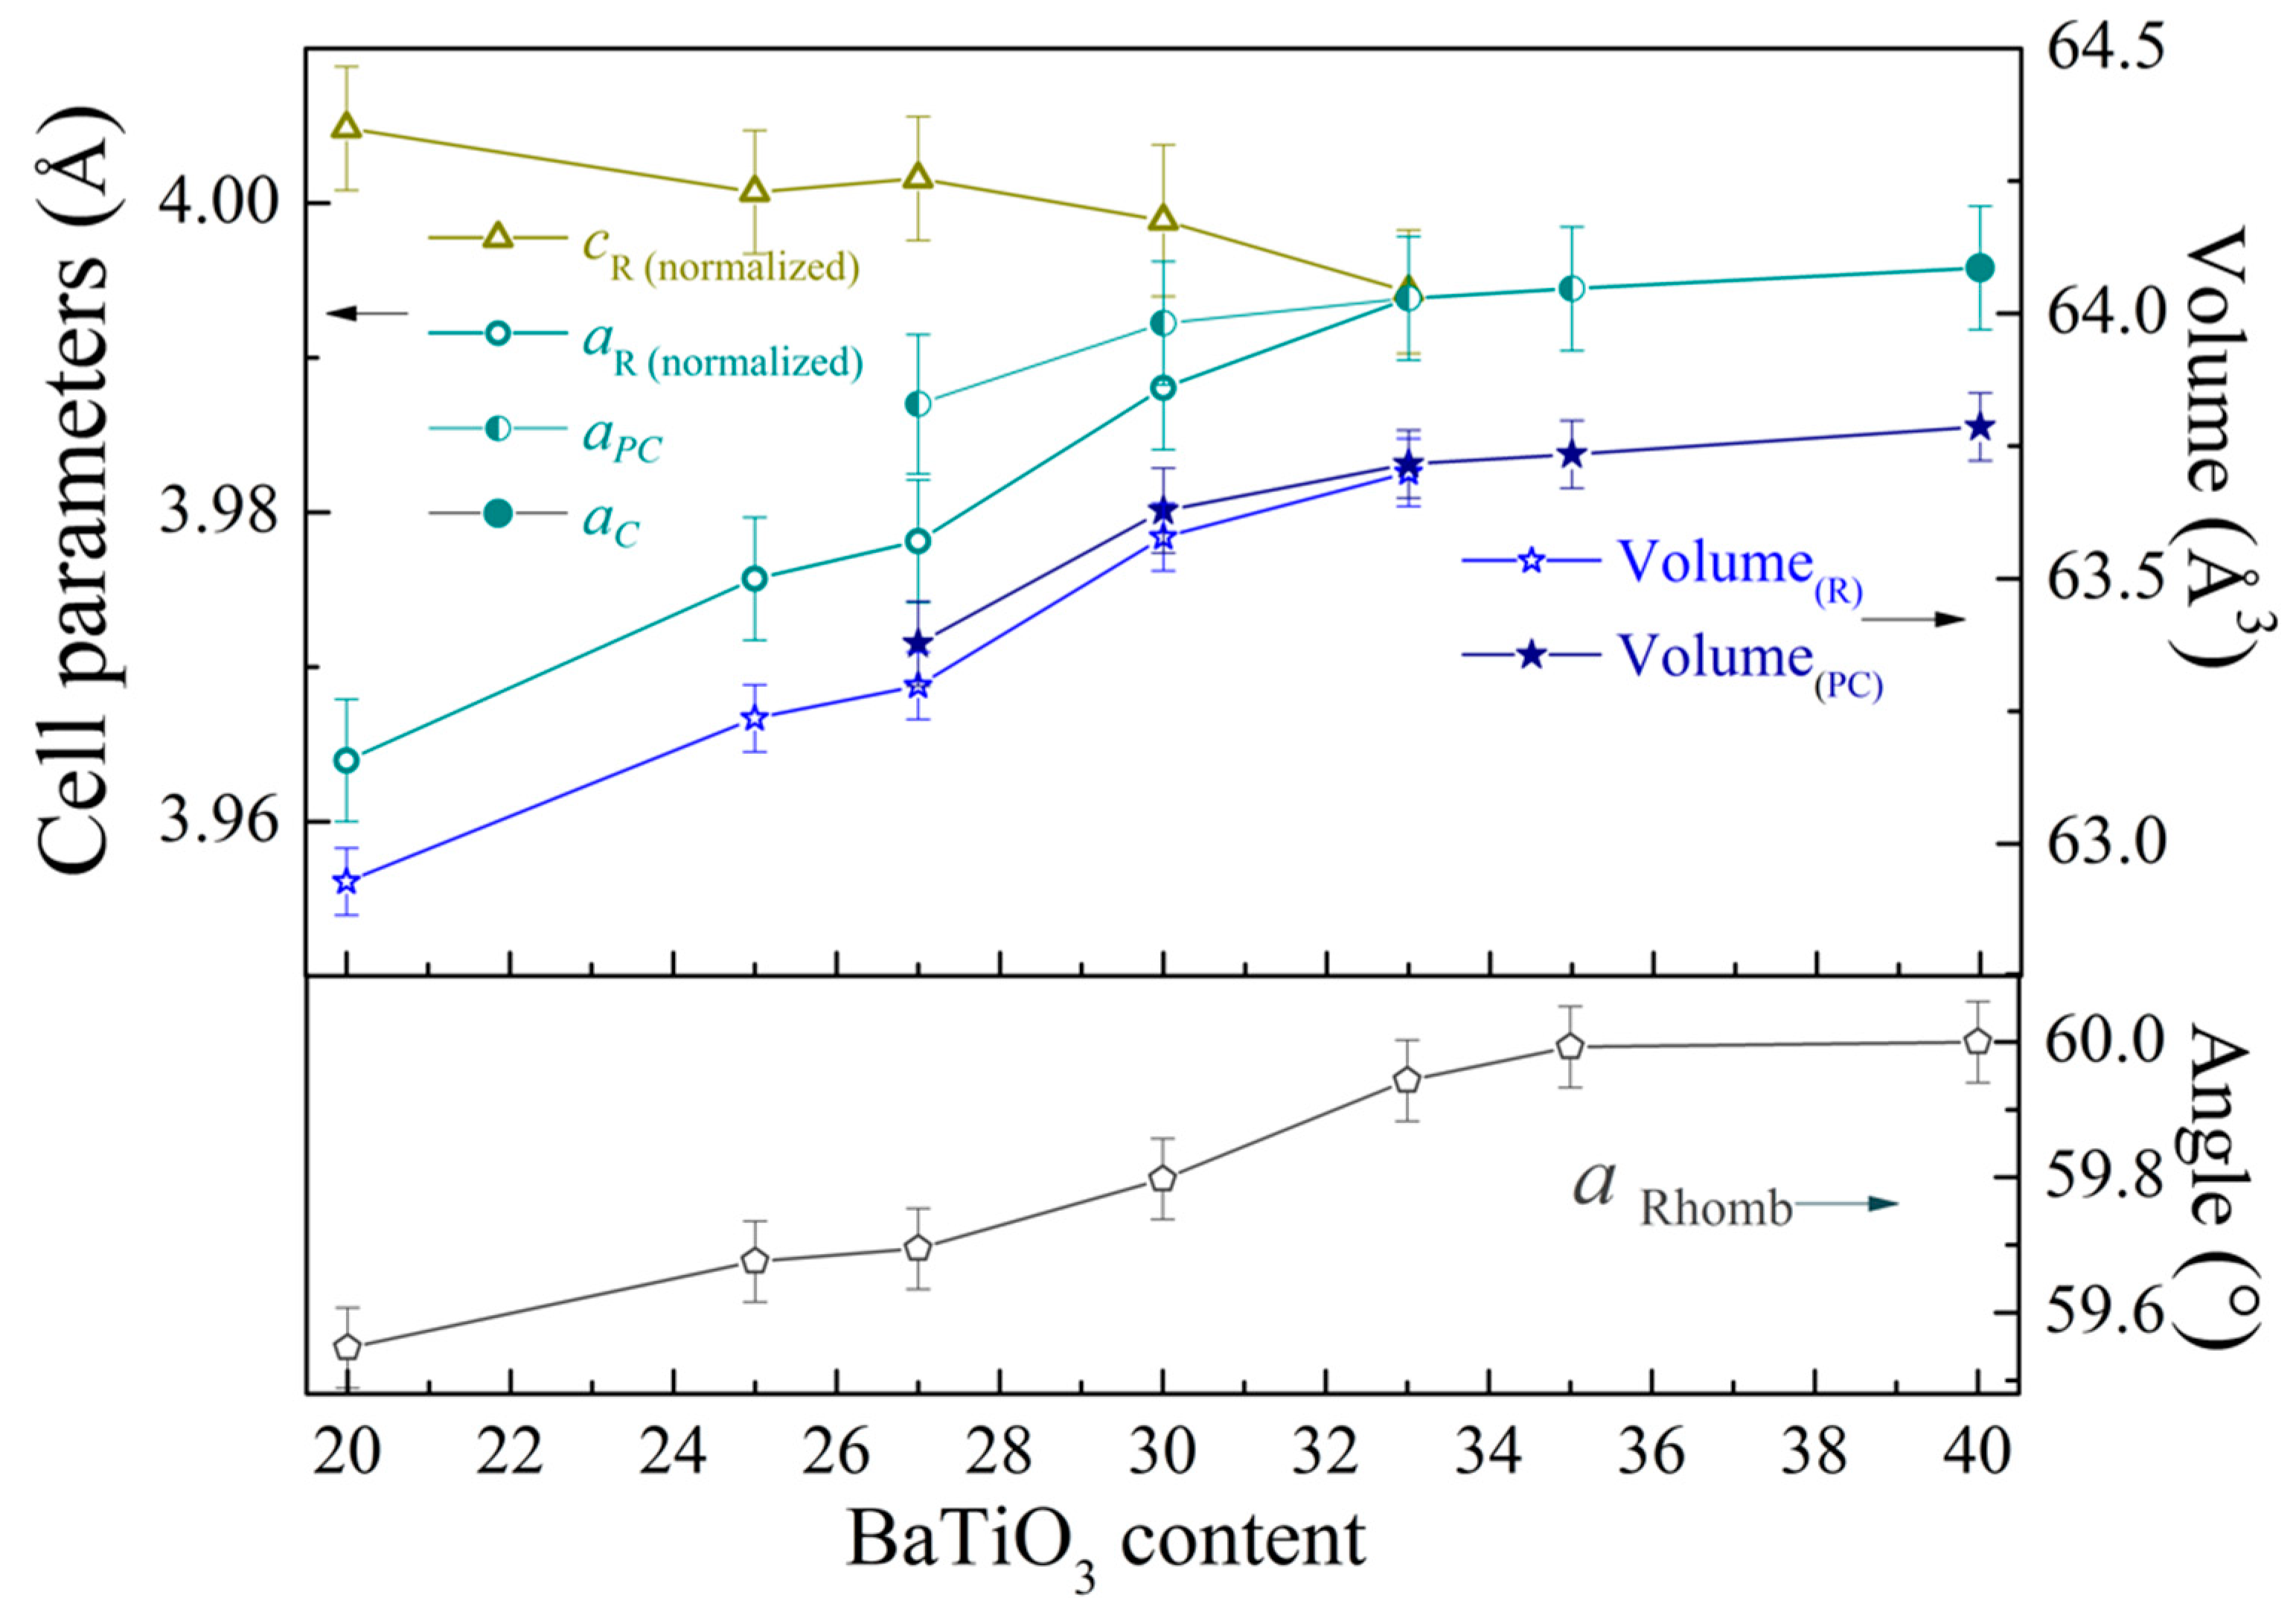
The results of the diffraction measurements testify that compound with x = 0.2 is characterized by the single-phase structural state with rhombohedral distortion (space group R3c); the magnitude of the structural distortion was quite low compared to the initial compound BiFeO3 [18,21]. The character of the structural distortion was confirmed by negligible intensity of the specific reflection 113R and weak splitting of the reflections 202R and 006R (Figure 1). Increase in Ba and Ti content leads to an increase in unit cell volume accompanied with a gradual reduction of rhombohedral distortion. The angle αR describing rhombohedral distortion gradually increases from 59.55° for the compound with x = 0.2 up to 59.98° for the compound with x = 0.35, where rhombohedral distortion is hardly detectable (Figure 2). Modification of the unit cell parameters a- and c- shows a different character on chemical doping. The a- parameter gradually increases with the dopant content, while c- parameter remains nearly constant and start to decrease in the compounds with x ≥ 0.27, so the c/a ratio decreases down to unity in the compound with x = 0.35 (Figure 2).
While the XRD patterns of the compounds with 0.2 < x < 0.3 can be satisfactorily refined using a single phase model with rhombohedral distortion, adding to the model the second cubic phase (space group Pm-3m) notably improves the reliability factors of the refinement. Slight asymmetry of the reflections ascribed to the rhombohedral phase confirms the presence of the secondary phase with larger unit cell parameters as compared to the rhombohedral phase (Figure 1, inset). It should be noted that the XRD patterns of the compounds with 0.2 ≤ x ≤ 0.3 are characterized by notable broadening of the X-ray reflections, as compared to other compounds within the phase boundary region (Figure 1, inset). An observed widening of the peaks is in accordance with a reduction in the average size of crystallines, as confirmed by SEM images (Figure 3). Micrometer size of the crystallines as well as a two-phase structural state of the compounds significantly reduces accuracy of the calculations using the Scherrer equation [46,47]. According to the SEM data, average size of the particles gradually decreases with dopant content (Figure 3). It should be noted that significant broadening of the X-ray reflections is observed only for compounds with x ≤ 0.3, unlike the compounds with higher dopant content (Figure 1, inset). The obtained results of XRD and SEM experiments for the compounds with x ≤ 0.3 can be explained in the model, which assumes the presence of the two different structural phases coexisting at the nanoscale level.
A reduction in the average crystalline size causes an increase of grain boundary volume fraction, which can hamper estimation of the ratio of different structural phases based on the diffraction data [48]. The piezoresponse force microscopy (PFM) results presented below for two-phase compounds confirm the mentioned issue, while the tendency of the phase evolution can be distinctly clarified based on the diffraction results. Based on the obtained results, one can conclude that the concentration driven structural transition from the polar rhombohedral to cubic-like phase occurs through coexisting phases having nanoscale average size and this effect is mostly pronounced in compounds with 0.2 ≤ x ≤ 0.3. Further increase in the dopant content is associated with an increase in the fraction of the cubic-like phase and its average size up to microscopic level, as confirmed by narrow X-ray reflections. The EDS analysis shows high chemical homogeneity of the compounds under study. The difference in the content of Bi and Ba ions calculated for different places within one grain as well as for the data obtained for different grains of the compounds is about 1%. The obtained results could not allow to distinguish crystallines ascribed to either rhombohedral or cubic-like phase, thus confirming the nanoscale character of different structural phases coexistent in the crystallines; this phenomenon is most pronounced in compounds with 0.2 ≤ x ≤ 0.3.
According to diffraction data, the phase coexistence region lasts till concentration x ~0.35 and the compounds with x ≥ 0.35 can be considered as a single phase having cubic structure. Local scale measurements performed by piezoelectric force microscopy (PFM) provide complementary information about the structural state of the compounds with mixed rhombohedral and pseudo-cubic phases.
The results of the local piezoelectric measurements performed for the compounds Bi1−xBaxFe1−xTixO3 with 0.2 ≤ x ≤ 0.35 demonstrate a decrease of piezoresponse signal with dopant content. According to the XRD data, the dopant content leads to a reduction in “tetragonality” (e.g., cR(norm)/aR(norm) ratio, which allows to estimate elongation of the lattice along cR axis and thus evaluate changes in polarization value [45,46,47]) of the unit cell (Figure 1) and decrease in off-center displacement of Bi(Ba) ions, which are mainly responsible for polar properties of the compounds. Gradual reduction of the piezoelectric signal observed by PFM measurements is in accordance with continuing modification of the crystal structure of the compounds. The PFM data also show a distribution of the polar active phase throughout a surface of the compounds, and the obtained data allowed to itemize the polar active and the non-polar phases within separate crystallines (Figure 4). Figure 4 shows that the polar regions contain a clearly distinguished domain structure, while the non-polar grains are characterized by the absence of piezoelectric signal. The PFM data obtained for the compounds with x = 0.27 do not show a clearly distinguished domain structure (Figure 4), which can be caused by weak piezo signals and high mixing of the structural phases resembling relaxor-like behavior.
Based on the structural data and complementary results obtained by the PFM method, one can ascribe polar active regions to the rhombohedral phase, while the regions without distinct PFM contrast can be attributed to the cubic-like phase considered from the XRD data. It should be noted that PFM data were able to distinguish low intensity piezoelectric signal in the compounds having single phase cubic-like structure (e.g., x = 0.35) determined by the diffraction experiments. The observed phenomena can be explained by assuming the presence of polar distortion of the unit cell specific for the mentioned compounds, while the magnitude of the structural distortion was too low to be detected by conventional diffraction methods.
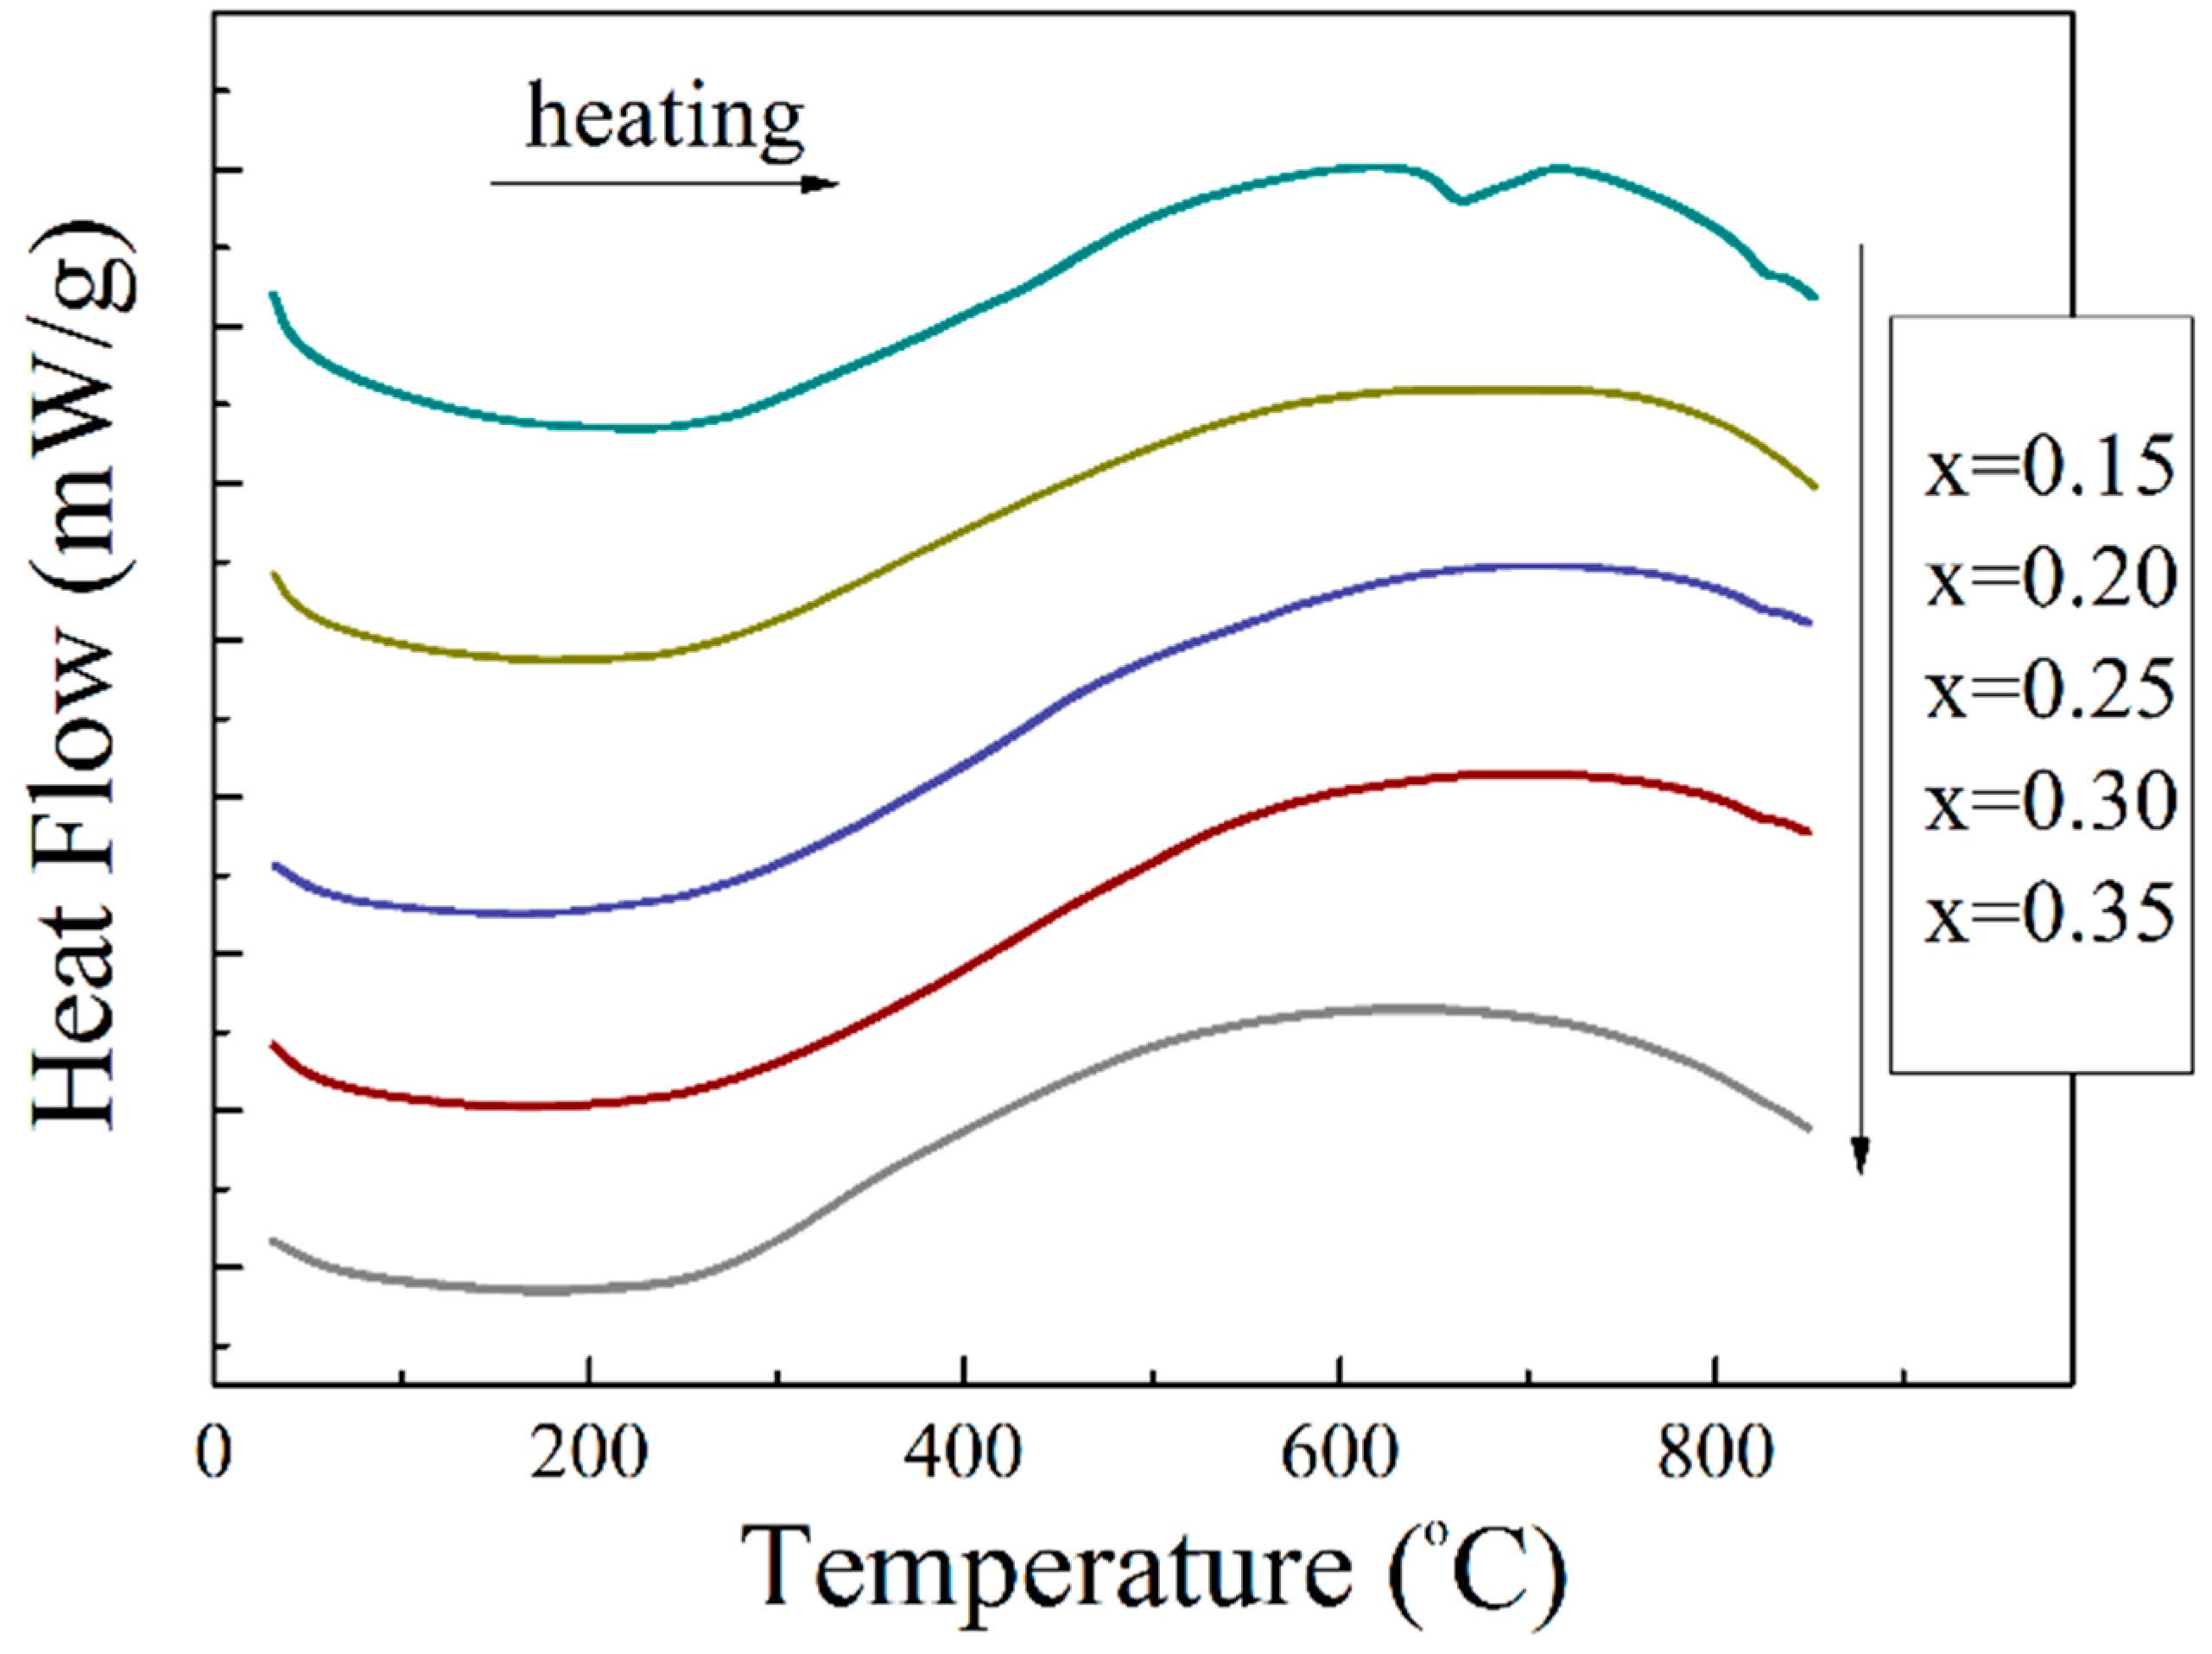
Temperature-dependent structural measurements allowed to itemize complex structural state ascribed to the compounds within the phase boundary region. Evolution of the crystal structure as a function of temperature was analyzed based on X-ray diffraction data as well as the results of DSC/DTA measurements. The compounds having a two-phase structural state at room temperature show gradual transition into single phase state characterized by a cubic structure. Temperature of the structural transformation into the cubic phase decreases with dopant content from ~ 650 °C for the compound with x = 0.2 down to ~350 °C for the compound with x = 0.35, which is in accordance with previously published data [37]. It should be noted that the evolution of mixed structural state into single phase cubic structure is characterized by small enthalpy associated with the transition and conventional DSC measurements performed for the compounds could not reveal this structural transition, unlike the structural data detecting this phenomenon (Figure 5). In contrast, the structural transition from the rhombohedral phase to the cubic phase observed in the compound with x = 0.15 can be easily detected by DSC measurements as well as the diffraction experiments [38]. The evolution of the mixed structural state into the single phase state confirms the intrinsic character of the phase separation observed for the compounds with 0.2 ≤ x ≤ 0.35, which is associated with high chemical homogeneity of the compounds. The obtained structural data allowed to reveal notable peculiarities of the temperature-driven structural transition, which was not declared in previous studies on the BiFeO3–BaTiO3 system [37,40].
The X-ray diffraction data obtained for the compounds under study testify an increase in unit cell parameters with temperature increase, while the a- and c- parameters of the rhombohedral lattice change in different ways. The evolution of the a- parameter shows nearly linear increase with temperature, while an increase in the magnitude of the c- parameter demonstrates a non-monotonous character. The calculated structural data testify of gradual increase in the magnitude of the c- parameter, followed by a rapid decrease after certain temperature, and the temperature of this modification decreases with dopant content (Figure 6). It should be noted that the observed modification in the unit cell parameters occurs at temperatures notably lower than the temperature of structural transition to the cubic phase. Unusual behavior of the unit cell parameters can be directly evidenced by an evolution of specific diffraction peaks. Careful analysis of the XRD patterns reveals that splitting of the rhombohedral reflections 006 and 202 becomes more pronounced at elevated temperatures (Figure 6).
For compound with x = 0.27, the noted effect is observed in the temperature range of ~130–240 °C and the mentioned temperature range declines and shrinks with dopant content down to nearly room temperature for the compound with x = 0.33 (Figure 6). A strengthening of the rhombohedral distortion observed at elevated temperatures for the compounds within the phase boundary region resembles a modification of the crystal structure driven by dopant concentration. An increase in the fraction of the cubic phase driven by either dopant content or temperature leads to competing structural distortions. Splitting of the rhombohedral reflections 006R and 202R is associated with elongation of the unit cell and thus with polar distortion of the lattice mainly caused by off-center displacement of the Bi(Ba) ions.
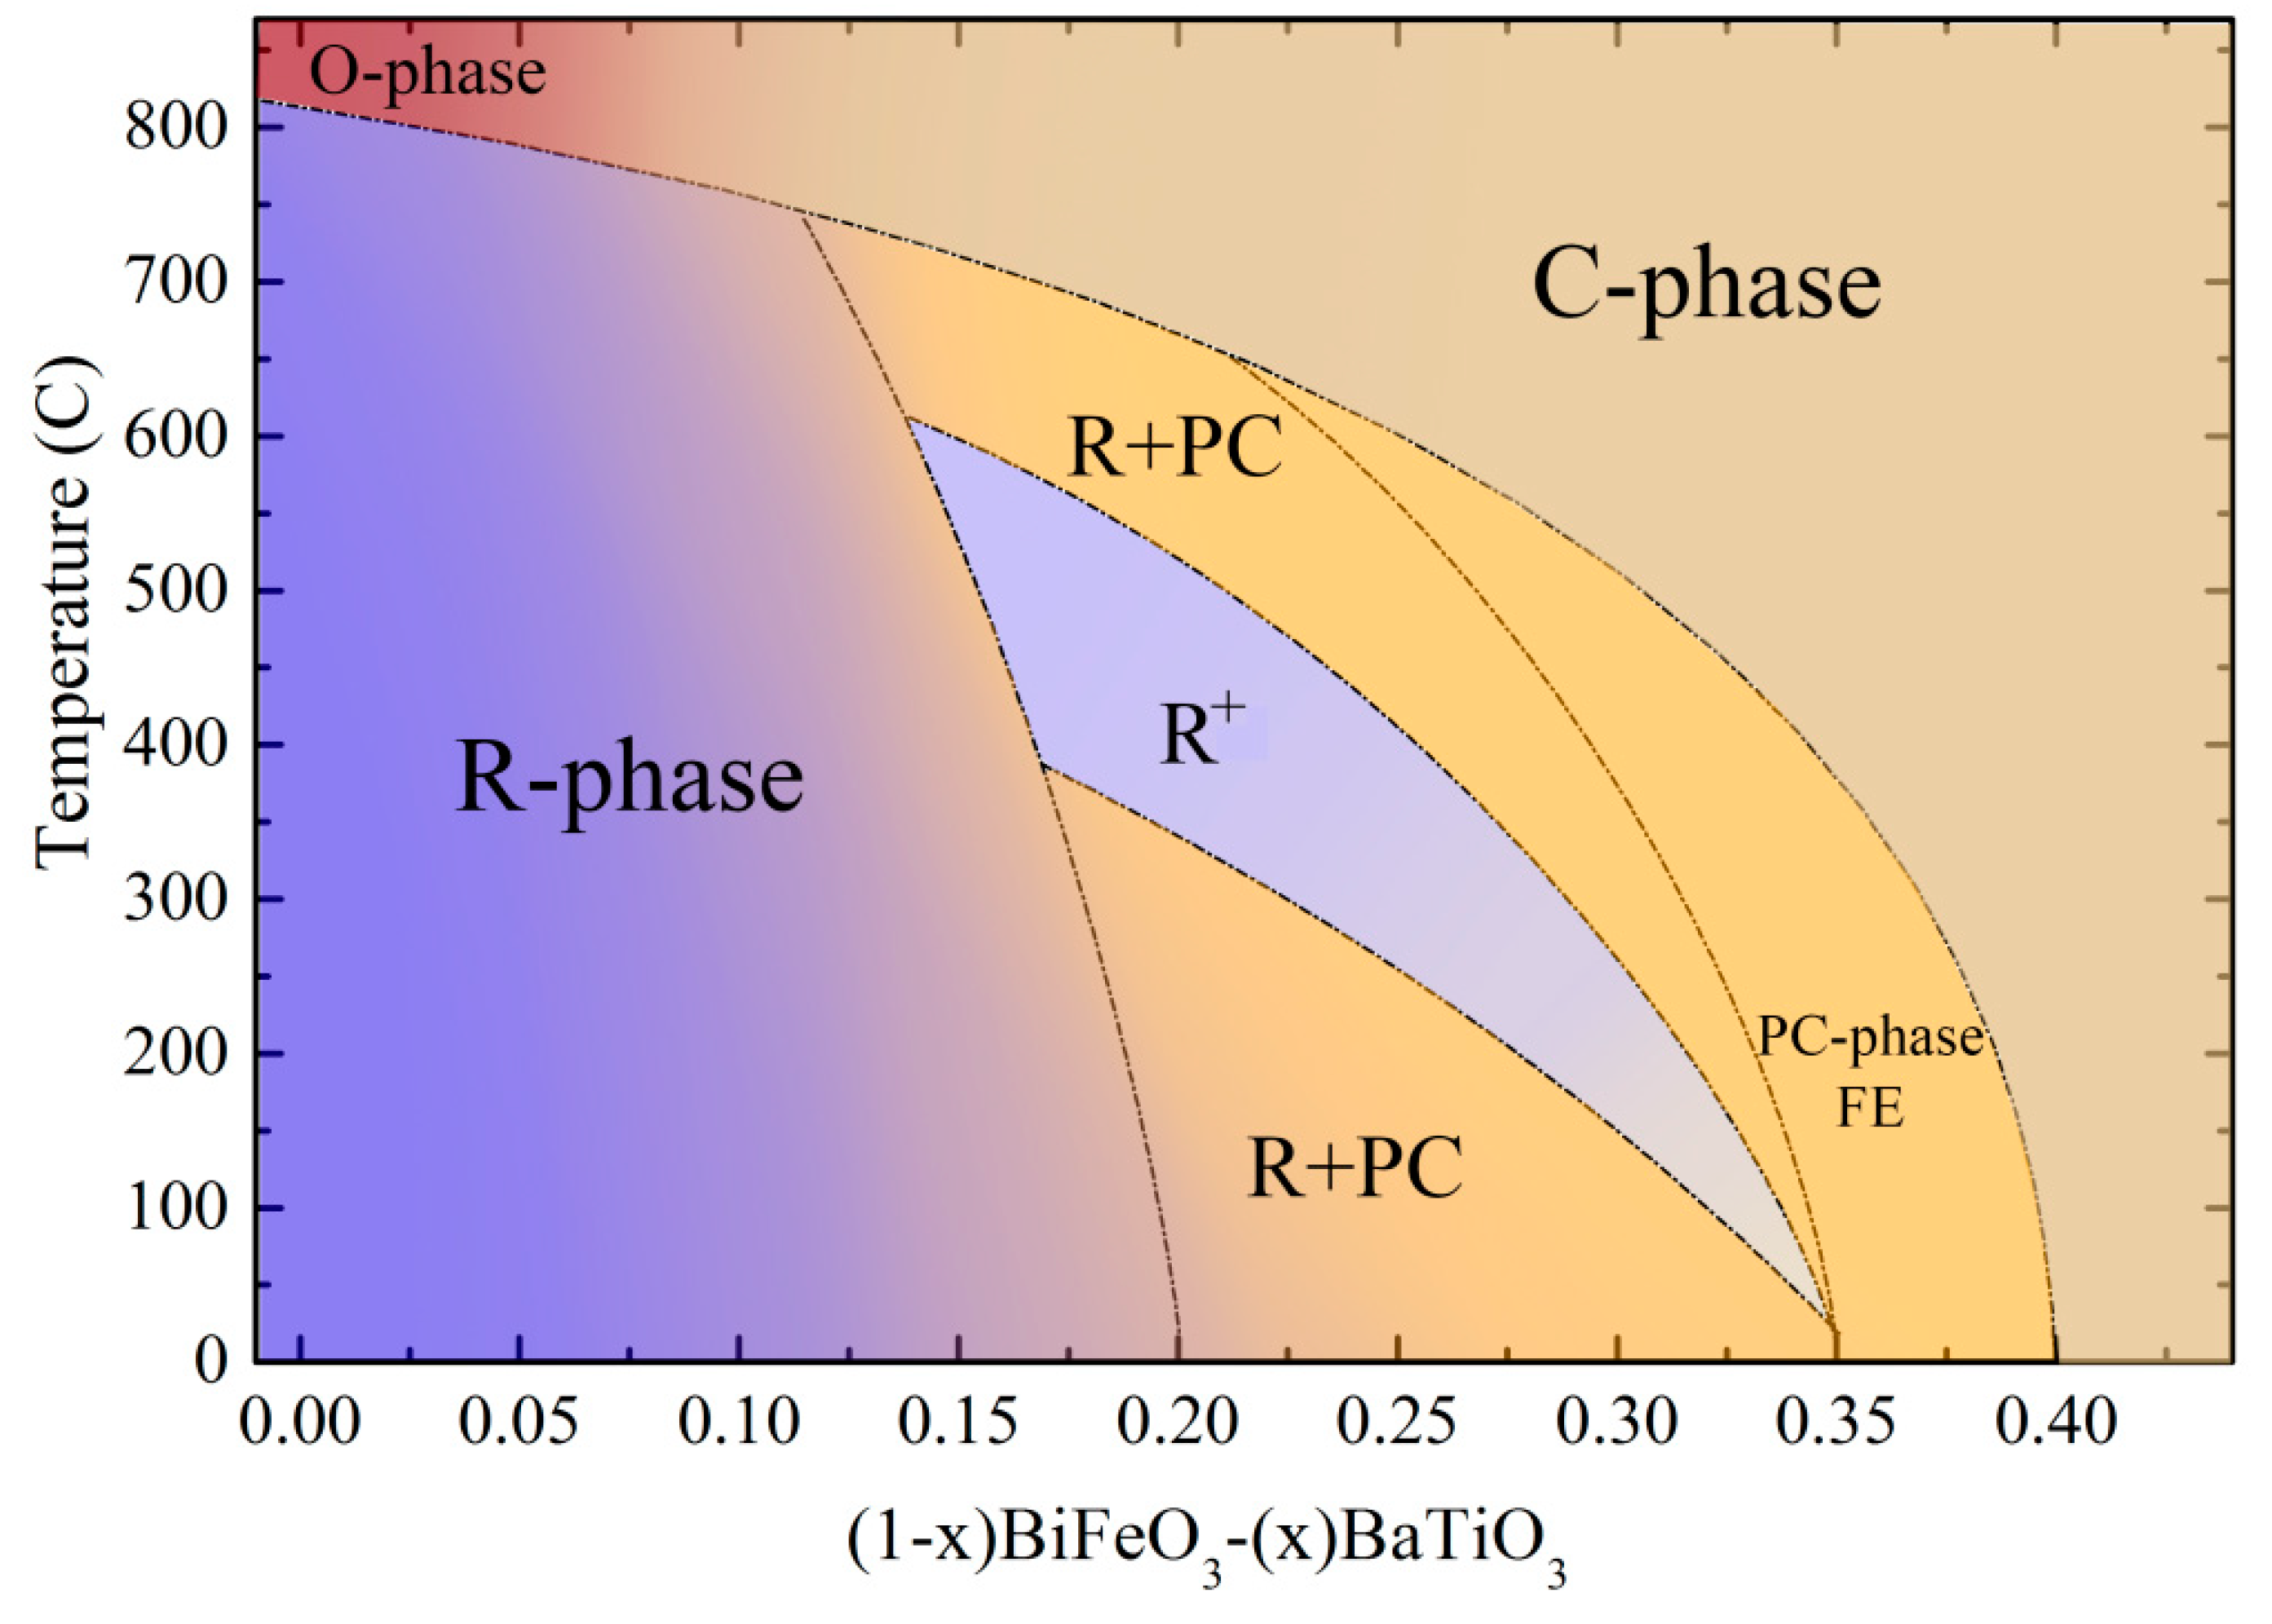
Based on the obtained diffraction data, the results of DSC/DTA and PFM measurements performed for Bi1−xBaxFe1−xTixO3 solid solutions, as well as our previous data (reported in [38]), the temperature-composition phase diagram was clarified (Figure 7).
The phase diagram represents the concentration and temperature regions of the single phase and phase coexistent states. The concentration-driven transition from the polar rhombohedral phase to the cubic phase for the compounds at room temperature is located in the dopant content range 0.20 ≤ x ≤ 0.35. One should note that this transition occurs through the formation of the pseudo-cubic phase having insignificant polar distortion undetectable by the diffraction measurements. The compounds having dominant rhombohedral phase in the phase boundary region at room temperature are characterized by temperature-driven transition into the single phase cubic structure, wherein this structural transformation is accompanied by a strengthening of the rhombohedral distortion at elevated temperatures, thus showing the non-monotonous character of the phase transition.

4. Conclusions

Based on the obtained results, we conclude that the concentration-driven structural transition from the rhombohedral polar phase to the cubic phase extends in the range 0.20 ≤ x ≤ 0.35 and occurs through the formation of a polar active pseudocubic phase. The phase transition is characterized by a formation of coexistent structural phases of nanoscale size. The crystal structure of the compounds having a dominant pseudo cubic phase is considered to possess polar displacements of ions that are too slight to be detected by conventional diffraction methods. The two-phase compounds are characterized by strengthening of the rhombohedral distortion that occurred at elevated temperatures. Observed strengthening of the rhombohedral distortion reflects a non-monotonous change in the ratio of the coexistent phases within the phase transition and can be caused by competing trends associated with rotation of oxygen octahedra and dipole interactions changing with dopant concentration increase. The obtained structural data provide novel information on the mechanism of the structural transitions occurring in the BiFeO3–BaTiO3 system, which is important for development of new functional materials based on complex oxide systems.

Author Contributions

Conceptualization, D.V.K., M.V.S., S.V.T., and A.V.T.; methodology, A.L.Z., S.I.L., and D.V.Z.; software, D.O.A.; validation, V.A.K., A.S.A., and D.V.Z.; formal analysis, A.L.K.; investigation, D.V.K.; resources, D.V.K., T.M. and W.M.; data curation, D.V.K., M.W. and M.V.S.; writing—original draft preparation, D.V.K., S.V.T., and M.V.S.; writing—review and editing, D.V.K., A.S.A., W.M., V.H., and A.L.K.; visualization, D.O.A. and A.L.Z.; supervision, D.V.K., M.V.S., W.M., V.H., and A.L.K.; project administration, D.V.K. and S.V.T.; funding acquisition, D.V.K. and M.V.S. All authors have read and agreed to the published version of the manuscript.

Funding

This work was supported by the RSF (project #18-19-00307). Investigations performed at the Center for Physics of the University of Coimbra were supported by Fundação para a Ciência e a Tecnologia (project UID/04564/2020). M.V.S. acknowledges Russian academic excellence project “5-100” for Sechenov University. Part of work done at the University of Aveiro was developed within the scope of the project CICECO-Aveiro Institute of Materials, refs. UIDB/50011/2020 & UIDP/50011/2020, financed by national funds through the FCT/MEC.

Conflicts of Interest

The authors declare no conflict of interest.

References

  1. Rao, C.N.R.; Sundaresan, A.; Saha, R. Multiferroic and magnetoelectric oxides: The emerging scenario. J. Phys. Chem. Lett. 2012, 3, 2237–2246. [Google Scholar] [CrossRef] [PubMed]
  2. Hill, N.A. Why are there so few magnetic ferroelectrics? J. Phys. Chem. B 2000, 104, 6694–6709. [Google Scholar] [CrossRef]
  3. Spaldin, N.A.; Ramesh, R. Advances in magnetoelectric multiferroics. Nat. Mater. 2019, 18, 203–212. [Google Scholar] [CrossRef]
  4. Trukhanov, A.V.; Turchenko, V.O.; Bobrikov, I.A.; Trukhanov, S.V.; Kazakevich, I.S.; Balagurov, A.M. Crystal structure and magnetic properties of the BaFe12−xAlxO19 (x = 0.1–1.2) solid solutions. J. Magn. Magn. Mater. 2015, 393, 253–259. [Google Scholar] [CrossRef]
  5. Trukhanov, A.V.; Kostishyn, V.G.; Panina, L.V.; Korovushkin, V.V.; Turchenko, V.A.; Thakur, P.; Thakur, A.; Yang, Y.; Vinnik, D.A.; Yakovenko, E.S.; et al. Control of electromagnetic properties in substituted M-type hexagonal ferrites. J. Alloy Compd. 2018, 754, 247–256. [Google Scholar] [CrossRef]
  6. Trukhanov, S.V.; Trukhanov, A.V.; Turchenko, V.A.; Trukhanov, A.V.; Trukhanova, E.L.; Tishkevich, D.I.; Ivanov, V.M.; Zubar, T.I.; Salem, M.; Kostishyn, V.G.; et al. Polarization origin and iron positions in indium doped barium hexaferrites. Ceram. Int. 2018, 44, 290–300. [Google Scholar] [CrossRef]
  7. Yakovenko, O.S.; Matzui, L.Y.; Vovchenko, L.L.; Trukhanov, A.V.; Kazakevich, I.S.; Trukhanov, S.V.; Prylutskyy, Y.I.; Ritter, U. Magnetic anisotropy of the graphite nanoplatelet–epoxy and MWCNT–epoxy composites with aligned barium ferrite filler. J. Mater. Sci. 2017, 52, 5345–5358. [Google Scholar] [CrossRef]
  8. Trukhanov, S.V.; Trukhanov, A.V.; Salem, M.M.; Trukhanova, E.L.; Panina, L.V.; Kostishyn, V.G.; Darwish, M.A.; Trukhanov, A.V.; Zubar, T.I.; Tishkevich, D.I.; et al. Preparation and investigation of structure, magnetic and dielectric properties of (BaFe11.9Al0.1O19)1-x—(BaTiO3)x bicomponent ceramics. Ceram. Int. 2018, 44, 21295–21302. [Google Scholar] [CrossRef]
  9. Salem, M.M.; Panina, L.V.; Trukhanova, E.L.; Darwish, M.A.; Morchenko, A.T.; Zubar, T.I.; Trukhanov, S.V.; Trukhanov, A.V. Structural, electric and magnetic properties of (BaFe11.9Al0.1O19)1-x–(BaTiO3)x composites. Compos. Part B Eng. 2019, 174, 107054. [Google Scholar] [CrossRef]
  10. Almessiere, M.A.; Slimani, Y.; Güngüne, H.; Baykal, A.; Trukhanov, S.V.; Trukhanov, A.V. Manganese/Yttrium codoped strontium nanohexaferrites: Evaluation of magnetic susceptibility and Mössbauer spectra. Nanomaterials 2019, 9, 24. [Google Scholar] [CrossRef] [Green Version]
  11. Almessiere, M.A.; Trukhanov, A.V.; Slimani, Y.; You, K.Y.; Trukhanov, S.V.; Trukhanova, E.L.; Esa, F.; Sadaqat, A.; Chaudhary, K.; Zdorovets, M.; et al. Correlation between composition and electrodynamics properties in nanocomposites based on hard/soft ferrimagnetics with strong exchange coupling. Nanomaterials 2019, 9, 202. [Google Scholar] [CrossRef] [PubMed] [Green Version]
  12. Dukenbayev, K.; Korolkov, I.V.; Tishkevich, D.I.; Kozlovskiy, A.L.; Trukhanov, S.V.; Gorin, Y.G.; Shumskaya, E.E.; Kaniukov, E.Y.; Vinnik, D.A.; Zdorovets, M.V.; et al. Fe3O4 nanoparticles for complex targeted delivery and boron neutron capture therapy. Nanomaterials 2019, 9, 494. [Google Scholar] [CrossRef] [PubMed] [Green Version]
  13. Matzui, L.Y.; Trukhanov, A.V.; Yakovenko, O.S.; Vovchenko, L.L.; Zagorodnii, V.V.; Oliynyk, V.V.; Borovoy, M.O.; Trukhanova, E.L.; Astapovich, K.A.; Karpinsky, D.V.; et al. Functional magnetic composites based on hexaferrites: Correlation of the composition, magnetic and high-frequency properties. Nanomaterials 2019, 9, 1720. [Google Scholar] [CrossRef] [PubMed] [Green Version]
  14. Darwish, M.A.; Trukhanov, A.V.; Senatov, O.S.; Morchenko, A.T.; Saafan, S.A.; Astapovich, K.A.; Trukhanov, S.V.; Trukhanova, E.L.; Pilyushkin, A.A.; Sombra, A.S.B.; et al. Investigation of AC-measurements of epoxy/ferrite composites. Nanomaterials 2020, 10, 492. [Google Scholar] [CrossRef] [Green Version]
  15. Selbach, S.M.; Tybell, T.; Einarsrud, M.-A.; Grande, T. The ferroic phase transitions of BiFeO3. Adv. Mater. 2008, 20, 3692–3696. [Google Scholar] [CrossRef]
  16. Catalan, G.; Scott, J.F. Physics and applications of bismuth ferrite. Adv. Mater. 2009, 21, 2463–2485. [Google Scholar] [CrossRef]
  17. Wang, Y.P.; Yuan, G.L.; Chen, X.Y.; Liu, J.M.; Liu, Z.G. Electrical and magnetic properties of single-phased and highly resistive ferroelectromagnet BiFeO3 ceramic. J. Phys. D Appl. Phys. 2006, 39, 2019–2023. [Google Scholar] [CrossRef]
  18. Karpinsky, D.V.; Silibin, M.V.; Trukhanov, A.V.; Zhaludkevich, A.L.; Maniecki, T.; Maniukiewicz, W.; Sikolenko, V.; Paixão, J.A.; Khomchenko, V.A. A correlation between crystal structure and magnetic properties in co-doped BiFeO3 ceramics. J. Phys. Chem. Solids 2019, 126, 164–169. [Google Scholar] [CrossRef]
  19. Wang, D.; Wang, G.; Murakami, S.; Fan, Z.; Feteira, A.; Zhou, D.; Sun, S.; Zhao, Q.; Reaney, I.M. BiFeO3-BaTiO3: A new generation of lead-free electroceramics. J. Adv. Dielect. 2018, 8, 1830004. [Google Scholar] [CrossRef] [Green Version]
  20. Morozovska, A.N.; Eliseev, E.A.; Glinchuk, M.D.; Fesenko, O.M.; Shvartsman, V.V.; Gopalan, V.; Silibin, M.V.; Karpinsky, D.V. Rotomagnetic coupling in fine-grained multiferroic BiFeO3: Theory and experiment. Phys. Rev. B 2018, 97, 134115. [Google Scholar] [CrossRef] [Green Version]
  21. Khomchenko, V.A.; Karpinsky, D.V.; Paixão, J.A. Magnetostructural correlations in BiFeO3-based multiferroics. J. Mater. Chem. C 2017, 5, 3623–3629. [Google Scholar] [CrossRef]
  22. Karpinsky, D.V.; Eliseev, E.A.; Xue, F.; Silibin, M.V.; Franz, A.; Glinchuk, M.D.; Troyanchuk, I.O.; Gavrilov, S.A.; Gopalan, V.; Chen, L.-Q.; et al. Thermodynamic potential and phase diagram for multiferroic bismuth ferrite (BiFeO3). NPJ Comput. Mater. 2017, 3, 1–10. [Google Scholar] [CrossRef]
  23. Nomoto, M.; Inoshita, T.; Inoue, Y.; Horibe, Y.; Koyama, Y. Crystallographic features in the vicinity of the morphotropic phase boundary in the multiferroic material Bi1−xSmxFeO3. MRS Adv. 2016, 1, 573–578. [Google Scholar] [CrossRef]
  24. Shimada, T.; Wang, J.; Ueda, T.; Uratani, Y.; Arisue, K.; Mrovec, M.; Elsässer, C.; Kitamura, T. Multiferroic grain boundaries in oxygen-deficient ferroelectric lead titanate. Nano Lett. 2015, 15, 27–33. [Google Scholar] [CrossRef]
  25. Karpinsky, D.V.; Fesenko, O.M.; Silibin, M.V.; Dubkov, S.V.; Chaika, M.; Yaremkevich, A.; Lukowiak, A.; Gerasymchuk, Y.; Stręk, W.; Pakalniškis, A.; et al. Ferromagnetic-like behavior of Bi0.9La0.1FeO3–KBr nanocomposites. Sci. Rep. 2019, 9, 1–10. [Google Scholar] [CrossRef] [Green Version]
  26. Dippong, T.; Levei, E.A.; Cadar, O.; Deac, I.G.; Diamandescu, L.; Barbu-Tudoran, L. Effect of nickel content on structural, morphological and magnetic properties of NixCo1−xFe2O4/SiO2 nanocomposites. J. Alloys Compd. 2019, 786, 330–340. [Google Scholar] [CrossRef]
  27. Arnold, D. Composition-driven structural phase transitions in rare-earth-doped BiFeO3 ceramics: A review. IEEE Trans. Ultrason. Ferroelectr. Freq. Control. 2015, 62, 62–82. [Google Scholar] [CrossRef]
  28. Karpinsky, D.V.; Troyanchuk, I.O.; Tovar, M.; Sikolenko, V.; Efimov, V.; Efimova, E.; Shur, V.Y.; Kholkin, A.L. Temperature and composition-induced structural transitions in Bi1−xLa(Pr)xFeO3 ceramics. J. Am. Ceram. Soc. 2014, 97, 2631–2638. [Google Scholar] [CrossRef]
  29. Mahbub, R.; Fakhrul, T.; Fakhrul Islam, M.; Hasan, M.; Hussain, A.; Matin, M.A.; Hakim, M.A. Structural, dielectric, and magnetic properties of Ba-doped multiferroic bismuth ferrite. Acta Metall. Sin. 2015, 28, 958–964. [Google Scholar] [CrossRef]
  30. Troyanchuk, I.O.; Karpinsky, D.V.; Bushinsky, M.V.; Khomchenko, V.A.; Kakazei, G.N.; Araujo, J.P.; Tovar, M.; Sikolenko, V.; Efimov, V.; Kholkin, A.L. Isothermal structural transitions, magnetization and large piezoelectric response in Bi1-xLaxFeO3 perovskites. Phys. Rev. B 2011, 83, 054109. [Google Scholar] [CrossRef]
  31. Damjanovic, D. A morphotropic phase boundary system based on polarization rotation and polarization extension. Appl. Phys. Lett. 2010, 97, 062906. [Google Scholar] [CrossRef]
  32. Mostafavi, E.; Ataie, A.; Ahmadzadeh, M.; Palizdar, M.; Comyn, T.P.; Bell, A.J. Synthesis of nano-structured Bi1−xBaxFeO3 ceramics with enhanced magnetic and electrical properties. Mater. Chem. Phys. 2015, 162, 106–112. [Google Scholar] [CrossRef]
  33. Troyanchuk, I.O.; Bushinsky, M.V.; Karpinsky, D.V.; Sirenko, V.; Sikolenko, V.; Efimov, V. Structural and magnetic phases of Bi1−xAxFeO3−δ (A = Sr, Pb) perovskites. Eur. Phys. J. B 2010, 73, 375–381. [Google Scholar] [CrossRef]
  34. Mardani, R. The synthesis of Ba2+-doped multiferroic BiFeO3 nanoparticles using co-precipitation method in the presence of various surfactants and the investigation of structural and magnetic features. Mod. Phys. Lett. B 2017, 31, 1750169. [Google Scholar] [CrossRef]
  35. Khomchenko, V.A.; Troyanchuk, I.O.; Többens, D.M.; Sikolenko, V.; Paixão, J.A. Composition- and temperature-driven structural transitions in Bi1-xCaxFeO3 multiferroics: A neutron diffraction study. J. Phys. Condens. Matter 2013, 25, 135902. [Google Scholar] [CrossRef]
  36. Kozakov, A.T.; Kochur, A.G.; Torgashev, V.I.; Googlev, K.A.; Kubrin, S.P.; Trotsenko, V.G.; Bush, A.A.; Nikolskii, A.V. Bi1-xCaxFeO3-δ (0≤x≤1) ceramics: Crystal structure, phase and elemental composition, and chemical bonding from X-ray diffraction, Raman scattering, Mössbauer, and X-ray photoelectron spectra. J. Alloys Compd. 2016, 664, 392–405. [Google Scholar] [CrossRef]
  37. Kim, S.; Khanal, G.P.; Nam, H.-W.; Fujii, I.; Ueno, S.; Moriyoshi, C.; Kuroiwa, Y.; Wada, S. Structural and electrical characteristics of potential candidate lead-free BiFeO3-BaTiO3 piezoelectric ceramics. J. Appl. Phys. 2017, 122, 164105. [Google Scholar] [CrossRef]
  38. Karpinsky, D.V.; Silibin, M.V.; Trukhanov, A.V.; Zhaludkevich, A.L.; Latushka, S.I.; Zhaludkevich, D.V.; Sikolenko, V.; Khomchenko, V.A. Evolution of crystal structure of Ba and Ti co-doped BiFeO3 ceramics at the morphotropic phase boundary. J. Alloys Compd. 2019, 803, 1136–1140. [Google Scholar] [CrossRef]
  39. Pakalniškis, A.; Lukowiak, A.; Niaura, G.; Głuchowski, P.; Karpinsky, D.V.; Alikin, D.O.; Abramov, A.S.; Zhaludkevich, A.; Silibin, M.; Kholkin, A.L.; et al. Nanoscale ferroelectricity in pseudo-cubic sol-gel derived barium titanate—Bismuth ferrite (BaTiO3–BiFeO3) solid solutions. J. Alloys Compd. 2020, 830, 154632. [Google Scholar] [CrossRef]
  40. Singh, A.; Moriyoshi, C.; Kuroiwa, Y.; Pandey, D. Evidence for local monoclinic structure, polarization rotation, and morphotropic phase transitions in (1-x)BiFeO3–(x)BaTiO3 solid solutions: A high-energy synchrotron x-ray powder diffraction study. Phys. Rev. B 2013, 88, 024113. [Google Scholar] [CrossRef]
  41. Singh, A.; Senyshyn, A.; Fuess, H.; Chatterji, T.; Pandey, D. Neutron powder diffraction study of nuclear and magnetic structures of multiferroic Bi0.8Ba0.2Fe0.8Ti0.2O3: Evidence for isostructural phase transition and magnetoelastic and magnetoelectric couplings. Phys. Rev. B 2011, 83, 054406. [Google Scholar] [CrossRef]
  42. Leontsev, S.O.; Eitel, R.E. Dielectric and piezoelectric properties in Mn-modified (1−x)BiFeO3–xBaTiO3 ceramics. J. Am. Ceram. Soc. 2009, 92, 2957–2961. [Google Scholar] [CrossRef]
  43. Tanasescu, S.; Botea, A.; Ianculescu, A. Effects of doping and oxygen nonstoichiometry on the thermodynamic properties of some multiferroic ceramics. In Ferroelectrics–Physical Effects; Lallart, M., Ed.; Intech Open 10: London, UK, 2011. [Google Scholar] [CrossRef] [Green Version]
  44. Rodríguez-Carvajal, J. Recent advances in magnetic structure determination by neutron powder diffraction. Phys. B 1993, 192, 55–69. [Google Scholar] [CrossRef]
  45. Balke, N.; Jesse, S.; Yu, P.; Ben, C.; Kalinin, S.V.; Tselev, A. Quantification of surface displacements and electromechanical phenomena via dynamic atomic force microscopy. Nanotechnology 2016, 27, 425707. [Google Scholar] [CrossRef] [PubMed]
  46. Mote, V.D.; Purushotham, Y.; Dole, B.N. Williamson-Hall analysis in estimation of lattice strain in nanometer-sized ZnO particles. J. Theor. Appl. Phys. 2012, 6, 6. [Google Scholar] [CrossRef] [Green Version]
  47. Khomchenko, V.A.; Ivanov, M.S.; Karpinsky, D.V.; Dubkov, S.V.; Silibin, M.V.; Paixão, J.A. Weak ferromagnetic state in the polar phase of Bi1-xCaxFe1-x/2Nbx/2O3 multiferroics. Mater. Lett. 2019, 235, 46–48. [Google Scholar] [CrossRef]
  48. Mazilkin, A.A.; Straumal, B.B.; Kilmametov, A.R.; Boll, T.; Baretzky, B.; Kogtenkova, O.A.; Korneva, A.; Zięba, P. Competition for impurity atoms between defects and solid solution during high pressure torsion. Scripta Mater. 2019, 173, 46–50. [Google Scholar] [CrossRef]
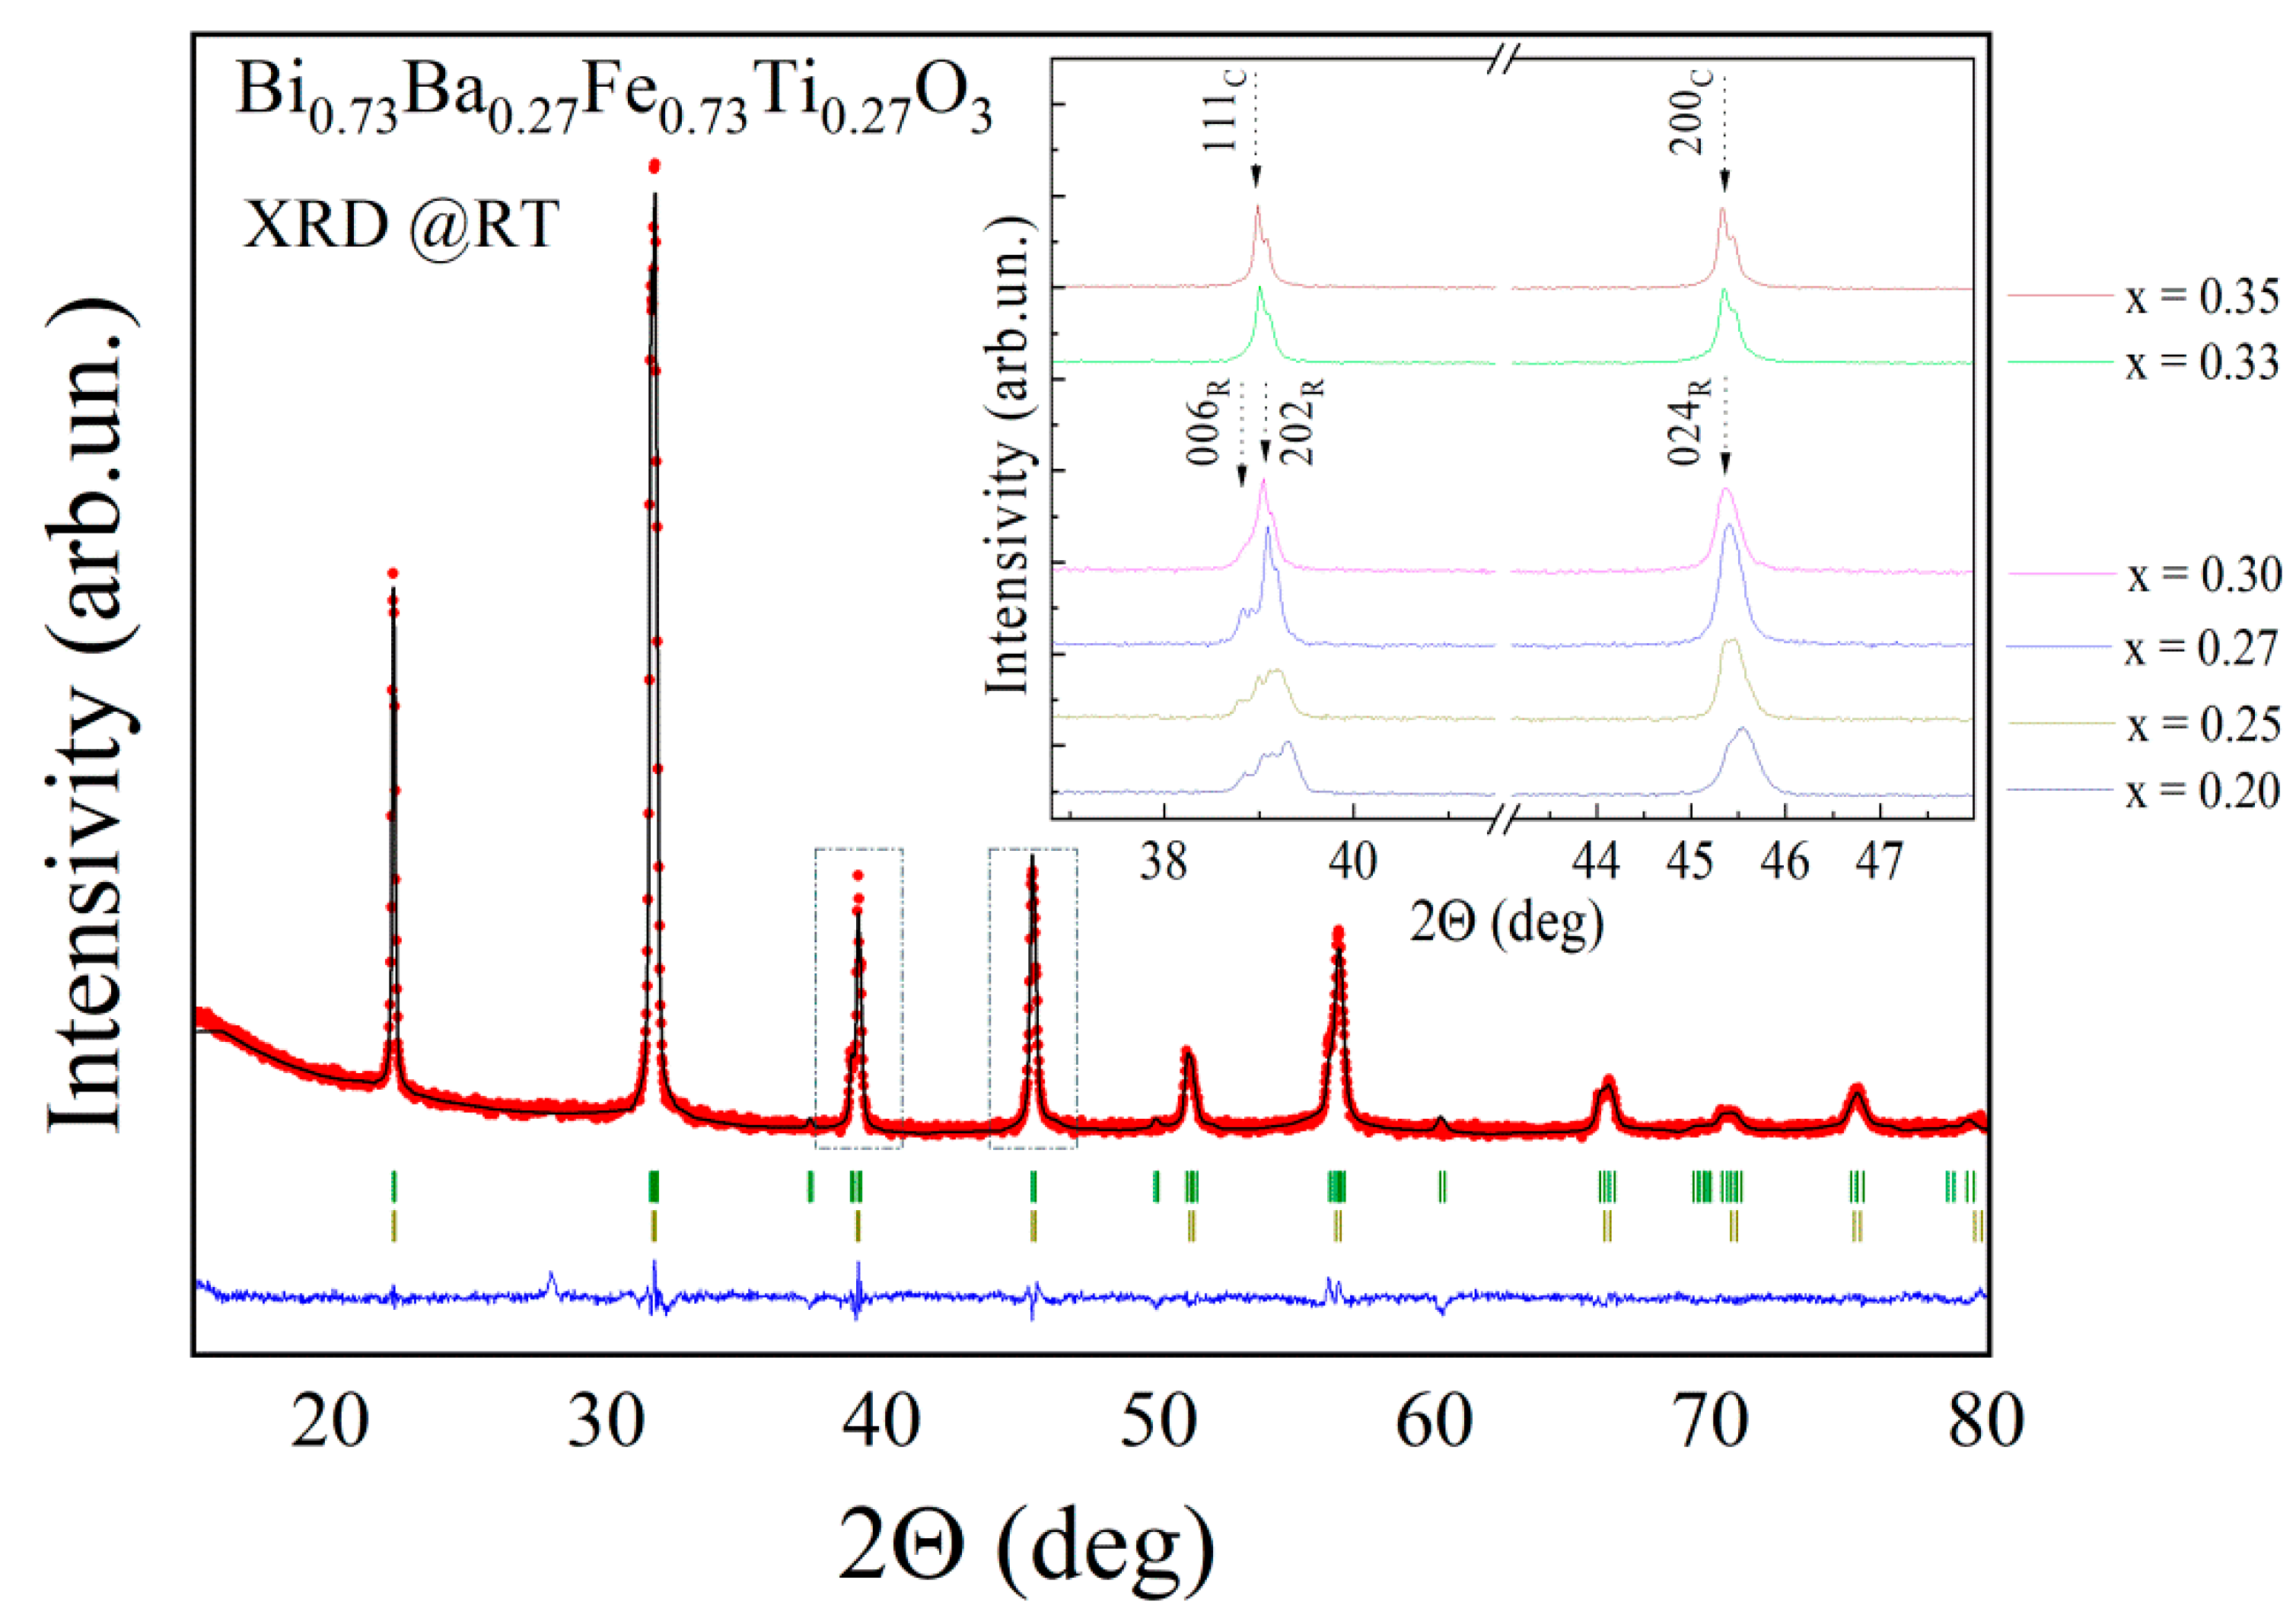
Figure 1. Room-temperature XRD pattern of compound Bi0.73Ba0.27Fe0.73Ti0.27O3. Observed and calculated profiles are marked by dots and solid line, respectively; the line below the pattern refers to the difference between the profiles. The upper row of the ticks denotes Bragg reflections ascribed to the rhombohedral phase, the second row—to the cubic phase. The inset shows concentration-driven evolution of the selected diffraction peaks.
Nanomaterials 10 00801 g001
Figure 2. The dopant concentration driven evolution of the unit cell parameters, unit cell volume of the rhombohedral and pseudo-cubic phases, and the rhombohedral angle αR calculated for compounds with 0.2 ≤ x ≤ 0.4. The aR- and cR- parameters are presented in normalized form, viz. calculated as aR(norm) = aR/√2·and cR(norm) = cR/2·√3, where aR- and cR- are parameters of the rhombohedral lattice in hexagonal settings.
Nanomaterials 10 00801 g002
Figure 3. SEM images of the compounds Bi1−xBaxFe1−xTixO3 with x = 0.27 (a), 0.3 (b), and 0.35 (c) (left to right). The insets show the distribution of crystal grain size.
Nanomaterials 10 00801 g003
Figure 4. Topagraphy (ac, crystallines are marked by solid lines) and out-of-plane PFM images (df) of the compounds Bi1−xBaxFe1−xTixO3 with x = 0.20 (a,d), 0.25 (b,e), 0.27 (c,f).
Nanomaterials 10 00801 g004
Figure 5. The dependency of heat transfer curves (DSC) obtained for the compounds with 0.15 ≤ x ≤ 0.35.
Nanomaterials 10 00801 g005
Figure 6. Temperature evolution of the diffraction peaks 006|202R and 024R and the unit cell parameters calculated for the compounds with 0.27 ≤ x ≤ 0.35. Temperature evolution of the diffraction peaks 006|202R (located at ~38.9 deg.) and 024R (located at ~45.2 deg.) and the unit cell parameters calculated for the compounds with 0.27 ≤ x ≤ 0.35.
Nanomaterials 10 00801 g006
Figure 7. Structural phase diagram of the Bi1−xBaxFe1−xTixO3 compounds with 0 < x < 0.5, the phase boundaries between single phase and phase coexistent states are drawn by the dot-dashed lines; the region ascribed to strengthening of the rhombohedral distortion is marked by as R+.
Nanomaterials 10 00801 g007