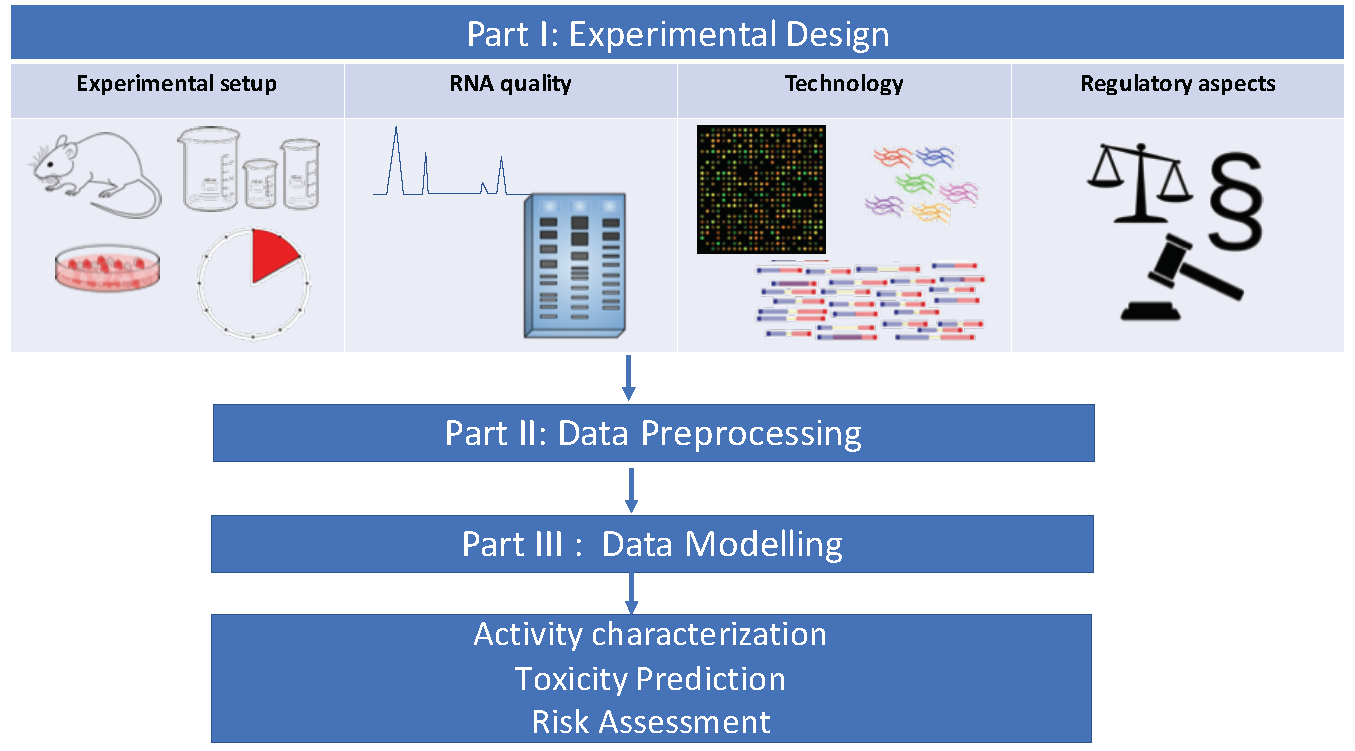
Transcriptomics in Toxicogenomics, Part I: Experimental Design, Technologies, Publicly Available Data, and Regulatory Aspects

 , ,
, ,  , , , , , , ,
  , ,
, ,  ,
,  ,
,  and
and 
Abstract
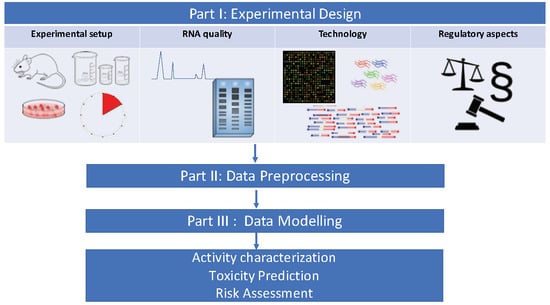
1. Introduction
2. Replicates and Reference Samples
3. Time and Dose Selection
3.1. Exposures and Sample Quality
3.2. Minimizing the Variation
3.3. Model Systems
3.4. Other Technical Considerations
4. Transcriptomic Technologies in Toxicogenomics
4.1. Polymerase Chain Reaction, PCR
4.2. DNA Microarray
4.3. RNA-Sequencing
4.4. Single Cell RNA-Sequencing
4.5. High-Throughput Transcriptomics
5. Publicly Available Datasets for Toxicogenomics
6. Regulatory Aspects
“The Commission, Member States, industry and other stakeholders should continue to contribute to the promotion of alternative test methods on an international and national level including computer supported methodologies, in vitro methodologies, as appropriate, those based on toxicogenomics, and other relevant methodologies. The Community’s strategy to promote alternative test methods is a priority and the Commission should ensure that within its future Research Framework Programmes and initiatives such as the Community Action Plan on the Protection and Welfare of Animals 2006 to 2010 this remains a priority topic. Participation of stakeholders and initiatives involving all interested parties should be sought [139].”
7. Conclusions
Author Contributions
Funding
Acknowledgments
Conflicts of Interest
Abbreviations
| AOP | adverse outcome pathways |
| BMD | benchmark dose |
| CDC | Centers for Disease Control and Prevention |
| CEBS | Chemical Effects in Biological Systems |
| cDNA | complementary DNA |
| CMAP | Connectivity Map |
| EAGMST | Extended Advisory Group for Molecular Screening and Toxicogenomics |
| ECHA | European chemicals agency |
| ECVAM | European Centre for the Validation of Alternative Methods |
| EFSA | European Food Safety Authority |
| eUTOPIA | A solUTion for Omics data PreprocessIng and Analysis |
| FAIR | Findable, Accessible, Interoperable and Reusable Data Principle |
| FDA | Food and Drug Administration |
| GEO | Gene Expression Omnibus |
| GO | gene ontology |
| GTEx | Genotype-Tissue Expression |
| JRC | Joint Research Centre |
| L1000 | Library of Integrated Network-Based Cellular Signatures 1000 |
| MIAME | Minimum Information About a Microarray Experiment |
| MINSEQE | Minimal Information about a high throughput SEQuencing Experiment |
| MOA | mechanism of action |
| NCT | National Center for Toxicogenomics |
| NCTR | National Center for Toxicological Research |
| NIEHS | National Institute of Environmental Health Sciences |
| NIH | National Institutes of Health |
| NIOSH | The National Institute for Occupational Safety and Health |
| NTP | The National Toxicology Program |
| OECD | Organisation for Economic Co-operation and Development |
| TG-GATE | Toxicogenomics Project-Genomics Assisted Toxicity Evaluation System |
| PCR | polymerase chain reaction |
| POD | point of departure |
| QSAR | quantitative structure activity relationship |
| REACH | Registration, Evaluation, Authorisation and Restriction of Chemicals |
| RNA-Seq | RNA sequencing |
| scRNA-Seq | single-cell RNA sequencing |
| TGx | toxicogenomics |
| 3R | Replacement, Reduction and Refinement in animal testing |
References
- EU. Regulation (EC) No 1223/2009 of the european parliament and of the council. Off. J. Eur. Union L 2009, 342, 59. [Google Scholar]
- Nel, A.; Xia, T.; Mädler, L.; Li, N. Toxic potential of materials at the nanolevel. Science 2006, 311, 622–627. [Google Scholar] [CrossRef] [PubMed]
- Poland, C.A.; Duffin, R.; Kinloch, I.; Maynard, A.; Wallace, W.A.; Seaton, A.; Stone, V.; Brown, S.; MacNee, W.; Donaldson, K. Carbon nanotubes introduced into the abdominal cavity of mice show asbestos-like pathogenicity in a pilot study. Nat. Nanotechnol. 2008, 3, 423. [Google Scholar] [CrossRef] [PubMed]
- Sweeney, S.; Berhanu, D.; Misra, S.K.; Thorley, A.J.; Valsami-Jones, E.; Tetley, T.D. Multi-walled carbon nanotube length as a critical determinant of bioreactivity with primary human pulmonary alveolar cells. Carbon 2014, 78, 26–37. [Google Scholar] [CrossRef] [PubMed]
- Kettler, K.; Veltman, K.; van de Meent, D.; van Wezel, A.; Hendriks, A.J. Cellular uptake of nanoparticles as determined by particle properties, experimental conditions, and cell type. Environ. Toxicol. Chem. 2014, 33, 481–492. [Google Scholar] [CrossRef]
- Liu, Z.; Huang, R.; Roberts, R.; Tong, W. Toxicogenomics: A 2020 Vision. Trends Pharmacol. Sci. 2019, 40, 92–103. [Google Scholar] [CrossRef]
- Alexander-Dann, B.; Pruteanu, L.L.; Oerton, E.; Sharma, N.; Berindan-Neagoe, I.; Módos, D.; Bender, A. Developments in toxicogenomics: Understanding and predicting compound-induced toxicity from gene expression data. Mol. Omics 2018, 14, 218–236. [Google Scholar] [CrossRef]
- Grafström, R.C.; Nymark, P.; Hongisto, V.; Spjuth, O.; Ceder, R.; Willighagen, E.; Hardy, B.; Kaski, S.; Kohonen, P. Toward the replacement of animal experiments through the bioinformatics-driven analysis of ‘omics’ data from human cell cultures. Altern. Lab. Anim. 2015, 43, 325–332. [Google Scholar] [CrossRef]
- Noordzij, M.; Dekker, F.W.; Zoccali, C.; Jager, K.J. Sample size calculations. Nephron Clin. Pract. 2011, 118, c319–c323. [Google Scholar] [CrossRef]
- Li, C.I.; Samuels, D.C.; Zhao, Y.Y.; Shyr, Y.; Guo, Y. Power and sample size calculations for high-throughput sequencing-based experiments. Brief. Bioinform. 2018, 19, 1247–1255. [Google Scholar] [CrossRef]
- Son, D.S.; Lee, D.; Lee, K.; Jung, S.H.; Ahn, T.; Lee, E.; Sohn, I.; Chung, J.; Park, W.; Huh, N.; et al. Practical approach to determine sample size for building logistic prediction models using high-throughput data. J. Biomed. Inform. 2015, 53, 355–362. [Google Scholar] [CrossRef] [PubMed]
- Alin, A. Minitab. Wiley Interdisc. Rev. Comput. Stat. 2010, 2, 723–727. [Google Scholar] [CrossRef]
- Tibshirani, R. A simple method for assessing sample sizes in microarray experiments. BMC Bioinform. 2006, 7, 106. [Google Scholar] [CrossRef] [PubMed]
- Lin, W.J.; Hsueh, H.M.; Chen, J.J. Power and sample size estimation in microarray studies. BMC Bioinform. 2010, 11, 48. [Google Scholar] [CrossRef]
- Liu, Y.; Zhou, J.; White, K.P. RNA-seq differential expression studies: More sequence or more replication? Bioinformatics 2014, 30, 301–304. [Google Scholar] [CrossRef]
- Frattini, A.; Fabbri, M.; Valli, R.; De Paoli, E.; Montalbano, G.; Gribaldo, L.; Pasquali, F.; Maserati, E. High variability of genomic instability and gene expression profiling in different HeLa clones. Sci. Rep. 2015, 5, 15377. [Google Scholar] [CrossRef]
- Bajak, E.; Fabbri, M.; Ponti, J.; Gioria, S.; Ojea-Jiménez, I.; Collotta, A.; Mariani, V.; Gilliland, D.; Rossi, F.; Gribaldo, L. Changes in Caco-2 cells transcriptome profiles upon exposure to gold nanoparticles. Toxicol. Lett. 2015, 233, 187–199. [Google Scholar] [CrossRef]
- Poulsen, S.S.; Saber, A.T.; Williams, A.; Andersen, O.; Købler, C.; Atluri, R.; Pozzebon, M.E.; Mucelli, S.P.; Simion, M.; Rickerby, D.; et al. MWCNTs of different physicochemical properties cause similar inflammatory responses, but differences in transcriptional and histological markers of fibrosis in mouse lungs. Toxicol. Appl. Pharmacol. 2015, 284, 16–32. [Google Scholar] [CrossRef]
- Bourdon, J.A.; Halappanavar, S.; Saber, A.T.; Jacobsen, N.R.; Williams, A.; Wallin, H.; Vogel, U.; Yauk, C.L. Hepatic and pulmonary toxicogenomic profiles in mice intratracheally instilled with carbon black nanoparticles reveal pulmonary inflammation, acute phase response, and alterations in lipid homeostasis. Toxicol. Sci. 2012, 127, 474–484. [Google Scholar] [CrossRef]
- Dymacek, J.; Snyder-Talkington, B.N.; Porter, D.W.; Mercer, R.R.; Wolfarth, M.G.; Castranova, V.; Qian, Y.; Guo, N.L. mRNA and miRNA regulatory networks reflective of multi-walled carbon nanotube-induced lung inflammatory and fibrotic pathologies in mice. Toxicol. Sci. 2015, 144, 51–64. [Google Scholar] [CrossRef][Green Version]
- Ong, K.J.; MacCormack, T.J.; Clark, R.J.; Ede, J.D.; Ortega, V.A.; Felix, L.C.; Dang, M.K.; Ma, G.; Fenniri, H.; Veinot, J.G.; et al. Widespread nanoparticle-assay interference: Implications for nanotoxicity testing. PLoS ONE 2014, 9, e90650. [Google Scholar] [CrossRef] [PubMed]
- Rydman, E.M.; Ilves, M.; Vanhala, E.; Vippola, M.; Lehto, M.; Kinaret, P.A.; Pylkkänen, L.; Happo, M.; Hirvonen, M.R.; Greco, D.; et al. A single aspiration of rod-like carbon nanotubes induces asbestos-like pulmonary inflammation mediated in part by the IL-1 receptor. Toxicol. Sci. 2015, 147, 140–155. [Google Scholar] [CrossRef] [PubMed]
- Palomäki, J.; Sund, J.; Vippola, M.; Kinaret, P.; Greco, D.; Savolainen, K.; Puustinen, A.; Alenius, H. A secretomics analysis reveals major differences in the macrophage responses towards different types of carbon nanotubes. Nanotoxicology 2015, 9, 719–728. [Google Scholar] [CrossRef] [PubMed]
- Nymark, P.; Wijshoff, P.; Cavill, R.; van Herwijnen, M.; Coonen, M.L.; Claessen, S.; Catalán, J.; Norppa, H.; Kleinjans, J.C.; Briede, J.J. Extensive temporal transcriptome and microRNA analyses identify molecular mechanisms underlying mitochondrial dysfunction induced by multi-walled carbon nanotubes in human lung cells. Nanotoxicology 2015, 9, 624–635. [Google Scholar] [CrossRef]
- Council, N.R. Applications of Toxicogenomic Technologies to Predictive Toxicology and Risk Assessment; National Academies Press: Washington, DC, USA, 2007. [Google Scholar]
- Lamon, L.; Asturiol, D.; Vilchez, A.; Cabellos, J.; Damásio, J.; Janer, G.; Richarz, A.; Worth, A. Physiologically based mathematical models of nanomaterials for regulatory toxicology: A review. Comput. Toxicol. 2019, 9, 133–142. [Google Scholar] [CrossRef]
- Warheit, D.B. Hazard and risk assessment strategies for nanoparticle exposures: How far have we come in the past 10 years? F1000Research 2018, 7. [Google Scholar] [CrossRef]
- Poulsen, S.S.; Jackson, P.; Kling, K.; Knudsen, K.B.; Skaug, V.; Kyjovska, Z.O.; Thomsen, B.L.; Clausen, P.A.; Atluri, R.; Berthing, T.; et al. Multi-walled carbon nanotube physicochemical properties predict pulmonary inflammation and genotoxicity. Nanotoxicology 2016, 10, 1263–1275. [Google Scholar] [CrossRef]
- Wallin, H.; Kyjovska, Z.O.; Poulsen, S.S.; Jacobsen, N.R.; Saber, A.T.; Bengtson, S.; Jackson, P.; Vogel, U. Surface modification does not influence the genotoxic and inflammatory effects of TiO2 nanoparticles after pulmonary exposure by instillation in mice. Mutagenesis 2017, 32, 47–57. [Google Scholar] [CrossRef]
- Kinaret, P.; Ilves, M.; Fortino, V.; Rydman, E.; Karisola, P.; Lahde, A.; Koivisto, J.; Jokiniemi, J.; Wolff, H.; Savolainen, K.; et al. Inhalation and oropharyngeal aspiration exposure to rod-like carbon nanotubes induce similar airway inflammation and biological responses in mouse lungs. ACS Nano 2017, 11, 291–303. [Google Scholar] [CrossRef]
- Scala, G.; Kinaret, P.; Marwah, V.; Sund, J.; Fortino, V.; Greco, D. Multi-omics analysis of ten carbon nanomaterials effects highlights cell type specific patterns of molecular regulation and adaptation. NanoImpact 2018, 11, 99–108. [Google Scholar] [CrossRef]
- Phillips, J.R.; Svoboda, D.L.; Tandon, A.; Patel, S.; Sedykh, A.; Mav, D.; Kuo, B.; Yauk, C.L.; Yang, L.; Thomas, R.S.; et al. BMDExpress 2: Enhanced transcriptomic dose-response analysis workflow. Bioinformatics 2019, 35, 1780–1782. [Google Scholar] [CrossRef] [PubMed]
- Farmahin, R.; Williams, A.; Kuo, B.; Chepelev, N.L.; Thomas, R.S.; Barton-Maclaren, T.S.; Curran, I.H.; Nong, A.; Wade, M.G.; Yauk, C.L. Recommended approaches in the application of toxicogenomics to derive points of departure for chemical risk assessment. Arch. Toxicol. 2017, 91, 2045–2065. [Google Scholar] [CrossRef] [PubMed]
- Jackson, A.F.; Williams, A.; Recio, L.; Waters, M.D.; Lambert, I.B.; Yauk, C.L. Case study on the utility of hepatic global gene expression profiling in the risk assessment of the carcinogen furan. Toxicol. Appl. Pharmacol. 2014, 274, 63–77. [Google Scholar] [CrossRef]
- Moffat, I.; Chepelev, N.L.; Labib, S.; Bourdon-Lacombe, J.; Kuo, B.; Buick, J.K.; Lemieux, F.; Williams, A.; Halappanavar, S.; Malik, A.I.; et al. Comparison of toxicogenomics and traditional approaches to inform mode of action and points of departure in human health risk assessment of benzo [a] pyrene in drinking water. Crit. Rev. Toxicol. 2015, 45, 1–43. [Google Scholar] [CrossRef] [PubMed]
- Webster, A.F.; Chepelev, N.; Gagné, R.; Kuo, B.; Recio, L.; Williams, A.; Yauk, C.L. Impact of genomics platform and statistical filtering on transcriptional benchmark doses (BMD) and multiple approaches for selection of chemical point of departure (PoD). PLoS ONE 2015, 10, e0136764. [Google Scholar] [CrossRef]
- Labib, S.; Williams, A.; Yauk, C.L.; Nikota, J.K.; Wallin, H.; Vogel, U.; Halappanavar, S. Nano-risk Science: Application of toxicogenomics in an adverse outcome pathway framework for risk assessment of multi-walled carbon nanotubes. Part. Fibre Toxicol. 2015, 13, 15. [Google Scholar] [CrossRef]
- Zhang, Q.; Li, J.; Middleton, A.; Bhattacharya, S.; Conolly, R.B. Bridging the data gap from in vitro toxicity testing to chemical safety assessment through computational modeling. Front. Public Health 2018, 6, 261. [Google Scholar] [CrossRef]
- Lamb, J.; Crawford, E.D.; Peck, D.; Modell, J.W.; Blat, I.C.; Wrobel, M.J.; Lerner, J.; Brunet, J.P.; Subramanian, A.; Ross, K.N.; et al. The Connectivity Map: Using gene-expression signatures to connect small molecules, genes, and disease. Science 2006, 313, 1929–1935. [Google Scholar] [CrossRef]
- Yauk, C.L.; Cheung, C.; Barton-Maclaren, T.S.; Boucher, S.; Bourdon-Lacombe, J.; Chauhan, V.; Gagné, M.; Gillespie, Z.; Halappanavar, S.; Honeyman, M.; et al. Toxicogenomic applications in risk assessment at Health Canada. Curr. Opin. Toxicol. 2019, 18, 34–45. [Google Scholar] [CrossRef]
- Ciallella, H.L.; Zhu, H. Advancing computational toxicology in the big data era by artificial intelligence: Data-driven and mechanism-driven modeling for chemical toxicity. Chem. Res. Toxicol. 2019, 32, 536–547. [Google Scholar] [CrossRef]
- Vo, A.H.; Van Vleet, T.R.; Gupta, R.R.; Liguori, M.J.; Rao, M.S. An Overview of Machine Learning and Big Data for Drug Toxicity Evaluation. Chem. Res. Toxicol. 2019, 33, 20–37. [Google Scholar] [CrossRef] [PubMed]
- Nuwaysir, E.F.; Bittner, M.; Trent, J.; Barrett, J.C.; Afshari, C.A. Microarrays and toxicology: The advent of toxicogenomics. Mol. Carcinog. 1999, 24, 153–159. [Google Scholar] [CrossRef]
- Poulsen, S.S.; Jacobsen, N.R.; Labib, S.; Wu, D.; Husain, M.; Williams, A.; Bøgelund, J.P.; Andersen, O.; Købler, C.; Mølhave, K.; et al. Transcriptomic analysis reveals novel mechanistic insight into murine biological responses to multi-walled carbon nanotubes in lungs and cultured lung epithelial cells. PLoS ONE 2013, 8, e80452. [Google Scholar] [CrossRef] [PubMed]
- Schmid, O.; Cassee, F.R. On the Pivotal Role of Dose for Particle Toxicology and Risk Assessment: Exposure Is a Poor Surrogate for Delivered Dose. Part Fibre Toxicol. 2017, 14, 52. [Google Scholar] [CrossRef] [PubMed]
- Organisation for Economic Co-operation and Development. Guidance Document on the Validation of (Quantitative) Structure-Activity Relationship [(Q) SAR] Models; OECD Publishing: Paris, France, 2014. [Google Scholar]
- Aslantürk, Ö.S. In Vitro Cytotoxicity and Cell Viability Assays: Principles, Advantages, and Disadvantages; InTechOpen: London, UK, 2018; Volume 2, Chapter 1. [Google Scholar]
- Drasler, B.; Sayre, P.; Steinhäuser, K.G.; Petri-Fink, A.; Rothen-Rutishauser, B. In vitro approaches to assess the hazard of nanomaterials. NanoImpact 2017, 8, 99–116. [Google Scholar] [CrossRef]
- Schroeder, A.; Mueller, O.; Stocker, S.; Salowsky, R.; Leiber, M.; Gassmann, M.; Lightfoot, S.; Menzel, W.; Granzow, M.; Ragg, T. The RIN: An RNA integrity number for assigning integrity values to RNA measurements. BMC Mol. Biol. 2006, 7, 3. [Google Scholar] [CrossRef]
- Scherer, A. Batch Effects and Noise in Microarray Experiments: Sources and Solutions; John Wiley & Sons: London, UK, 2009; Volume 868. [Google Scholar]
- Leek, J.T.; Scharpf, R.B.; Bravo, H.C.; Simcha, D.; Langmead, B.; Johnson, W.E.; Geman, D.; Baggerly, K.; Irizarry, R.A. Tackling the widespread and critical impact of batch effects in high-throughput data. Nat. Rev. Genet. 2010, 11, 733–739. [Google Scholar] [CrossRef]
- Verdugo, R.A.; Deschepper, C.F.; Muñoz, G.; Pomp, D.; Churchill, G.A. Importance of randomization in microarray experimental designs with Illumina platforms. Nucleic Acids Res. 2009, 37, 5610–5618. [Google Scholar] [CrossRef]
- Naidoo, S.; Denby, K.J.; Berger, D.K. Microarray experiments: Considerations for experimental design. S. Afr. J. Sci. 2005, 101, 347–354. [Google Scholar]
- Barrett, T.; Wilhite, S.E.; Ledoux, P.; Evangelista, C.; Kim, I.F.; Tomashevsky, M.; Marshall, K.A.; Phillippy, K.H.; Sherman, P.M.; Holko, M.; et al. NCBI GEO: Archive for functional genomics data sets—Update. Nucleic Acids Res. 2012, 41, D991–D995. [Google Scholar] [CrossRef]
- Parkinson, H.; Kapushesky, M.; Shojatalab, M.; Abeygunawardena, N.; Coulson, R.; Farne, A.; Holloway, E.; Kolesnykov, N.; Lilja, P.; Lukk, M.; et al. ArrayExpress—A public database of microarray experiments and gene expression profiles. Nucleic Acids Res. 2007, 35, D747–D750. [Google Scholar] [CrossRef] [PubMed]
- Brazma, A.; Hingamp, P.; Quackenbush, J.; Sherlock, G.; Spellman, P.; Stoeckert, C.; Aach, J.; Ansorge, W.; Ball, C.A.; Causton, H.C.; et al. Minimum information about a microarray experiment (MIAME)—toward standards for microarray data. Nat. Genet. 2001, 29, 365. [Google Scholar] [CrossRef] [PubMed]
- Wilkinson, M.D.; Dumontier, M.; Aalbersberg, I.J.; Appleton, G.; Axton, M.; Baak, A.; Blomberg, N.; Boiten, J.W.; da Silva Santos, L.B.; Bourne, P.E.; et al. The FAIR Guiding Principles for scientific data management and stewardship. Sci. Data 2016, 3. [Google Scholar] [CrossRef]
- Williams-Devane, C.R.; Wolf, M.A.; Richard, A.M. Toward a public toxicogenomics capability for supporting predictive toxicology: Survey of current resources and chemical indexing of experiments in GEO and ArrayExpress. Toxicol. Sci. 2009, 109, 358–371. [Google Scholar] [CrossRef] [PubMed]
- Sayes, C.M.; Reed, K.L.; Warheit, D.B. Assessing toxicity of fine and nanoparticles: Comparing in vitro measurements to in vivo pulmonary toxicity profiles. Toxicological sciences 2007, 97, 163–180. [Google Scholar] [CrossRef] [PubMed]
- Seagrave, J.; McDonald, J.D.; Mauderly, J.L. In vitro versus in vivo exposure to combustion emissions. Exp. Toxicol. Pathol. 2005, 57, 233–238. [Google Scholar] [CrossRef]
- Sayes, C.M.; Reed, K.L.; Subramoney, S.; Abrams, L.; Warheit, D.B. Can in vitro assays substitute for in vivo studies in assessing the pulmonary hazards of fine and nanoscale materials? J. Nanopart. Res. 2009, 11, 421–431. [Google Scholar] [CrossRef]
- Warheit, D.; Sayes, C.; Reed, K. Nanoscale and fine zinc oxide particles: Can in vitro assays accurately forecast lung hazards following inhalation exposures? Environ. Sci. Technol. 2009, 43, 7939–7945. [Google Scholar] [CrossRef]
- Sayes, C.M.; Marchione, A.A.; Reed, K.L.; Warheit, D.B. Comparative pulmonary toxicity assessments of C60 water suspensions in rats: Few differences in fullerene toxicity in vivo in contrast to in vitro profiles. Nano Lett. 2007, 7, 2399–2406. [Google Scholar] [CrossRef]
- Johnston, H.J.; Hutchison, G.R.; Christensen, F.M.; Peters, S.; Hankin, S.; Aschberger, K.; Stone, V. A critical review of the biological mechanisms underlying the in vivo and in vitro toxicity of carbon nanotubes: The contribution of physico-chemical characteristics. Nanotoxicology 2010, 4, 207–246. [Google Scholar] [CrossRef]
- Dhawan, A.; Sharma, V. Toxicity assessment of nanomaterials: Methods and challenges. Anal. Bioanal. Chem. 2010, 398, 589–605. [Google Scholar] [CrossRef] [PubMed]
- Kinaret, P.; Marwah, V.; Fortino, V.; Ilves, M.; Wolff, H.; Ruokolainen, L.; Auvinen, P.; Savolainen, K.; Alenius, H.; Greco, D. Network analysis reveals similar transcriptomic responses to intrinsic properties of carbon nanomaterials in vitro and in vivo. ACS Nano 2017, 11, 3786–3796. [Google Scholar] [CrossRef] [PubMed]
- Marwah, V.S.; Kinaret, P.A.S.; Serra, A.; Scala, G.; Lauerma, A.; Fortino, V.; Greco, D. Inform: Inference of network response modules. Bioinformatics 2018, 34, 2136–2138. [Google Scholar] [CrossRef]
- Kroll, A.; Pillukat, M.H.; Hahn, D.; Schnekenburger, J. Current in vitro methods in nanoparticle risk assessment: Limitations and challenges. Eur. J. Pharm. Biopharm. 2009, 72, 370–377. [Google Scholar] [CrossRef] [PubMed]
- Monteiro-Riviere, N.; Inman, A.; Zhang, L. Limitations and relative utility of screening assays to assess engineered nanoparticle toxicity in a human cell line. Toxicol. Appl. Pharmacol. 2009, 234, 222–235. [Google Scholar] [CrossRef]
- Pedersen, E.; Fant, K. Guidance Document on Good In Vitro Method Practices (GIVIMP): Series on Testing and Assessment No. 286; OECD Publishing: Paris, France, 2018. [Google Scholar]
- Fei, L.; Perrett, S. Effect of nanoparticles on protein folding and fibrillogenesis. Int. J. Mol. Sci. 2009, 10, 646–655. [Google Scholar] [CrossRef]
- Asuri, P.; Bale, S.S.; Karajanagi, S.S.; Kane, R.S. The protein–nanomaterial interface. Curr. Opin. Biotechnol. 2006, 17, 562–568. [Google Scholar] [CrossRef]
- Kane, R.S.; Stroock, A.D. Nanobiotechnology: Protein-nanomaterial interactions. Biotechnol. Prog. 2007, 23, 316–319. [Google Scholar] [CrossRef]
- Lord, M.S.; Foss, M.; Besenbacher, F. Influence of nanoscale surface topography on protein adsorption and cellular response. Nano Today 2010, 5, 66–78. [Google Scholar] [CrossRef]
- Lynch, I.; Dawson, K.A. Protein-nanoparticle interactions. Nano Today 2008, 3, 40–47. [Google Scholar] [CrossRef]
- Stueker, O.; Ortega, V.A.; Goss, G.G.; Stepanova, M. Understanding interactions of functionalized nanoparticles with proteins: A case study on lactate dehydrogenase. Small 2014, 10, 2006–2021. [Google Scholar] [CrossRef] [PubMed]
- Casey, A.; Herzog, E.; Lyng, F.; Byrne, H.; Chambers, G.; Davoren, M. Single walled carbon nanotubes induce indirect cytotoxicity by medium depletion in A549 lung cells. Toxicol. Lett. 2008, 179, 78–84. [Google Scholar] [CrossRef] [PubMed]
- Hedderman, T.G.; Keogh, S.M.; Chambers, G.; Byrne, H.J. Solubilization of SWNTs with organic dye molecules. J. Phys. Chem. B 2004, 108, 18860–18865. [Google Scholar] [CrossRef]
- Ramakrishna, G.; Ghosh, H.N. Emission from the charge transfer state of xanthene dye-sensitized TiO2 nanoparticles: A new approach to determining back electron transfer rate and verifying the marcus inverted regime. J. Phys. Chem. B 2001, 105, 7000–7008. [Google Scholar] [CrossRef]
- Frohlich, E. Cellular targets and mechanisms in the cytotoxic action of non-biodegradable engineered nanoparticles. Curr. Drug Metab. 2013, 14, 976–988. [Google Scholar] [CrossRef]
- Fröhlich, E. Role of omics techniques in the toxicity testing of nanoparticles. J. Nanobiotechnol. 2017, 15, 84. [Google Scholar] [CrossRef]
- Fröhlich, E.; Meindl, C.; Pieber, T.R. Important issues in the cytotoxicity screening of nano-sized materials. EURO-NanoTox-Lett. 2010, 2, 1–5. [Google Scholar]
- Pisani, C.; Gaillard, J.C.; Nouvel, V.; Odorico, M.; Armengaud, J.; Prat, O. High-throughput, quantitative assessment of the effects of low-dose silica nanoparticles on lung cells: Grasping complex toxicity with a great depth of field. BMC Genom. 2015, 16, 315. [Google Scholar] [CrossRef]
- Foth, H. Abstracts of the 46th Congress of the European Societies of Toxicology (EUROTOX2009). Dresden, Germany. 13–16 September 2009. Toxicol. Lett. 2009, 189, S1–S2. [Google Scholar] [CrossRef] [PubMed]
- Hongisto, V.; Nymark, P.; Kohonen, J.; Hattara, J.; Grafstrom, R. High-Throughput Hazard-Based Scoring, Ranking and Grouping of Engineered Nanomaterials; Toxicology Letters; Elsevier: Amsterdam, The Netherlands, 2019; Volume 314, pp. S202–S203. [Google Scholar]
- Nymark, P. Grouping of Representative Nanomaterials Is Efficiently Executed By Combining High-Throughput-Generated Biological Data With Physicochemical Data; Toxicology Letters, Elsevier: Amsterdam, The Netherlands, 2019; Volume 314, pp. 1–310. [Google Scholar]
- Grzincic, E.; Yang, J.; Drnevich, J.; Falagan-Lotsch, P.; Murphy, C. Global transcriptomic analysis of model human cell lines exposed to surface-modified gold nanoparticles: The effect of surface chemistry. Nanoscale 2015, 7, 1349–1362. [Google Scholar] [CrossRef]
- Li, K.; Zhao, X.; Hammer, K.B.; Du, S.; Chen, Y. Nanoparticles inhibit DNA replication by binding to DNA: Modeling and experimental validation. ACS Nano 2013, 7, 9664–9674. [Google Scholar] [CrossRef] [PubMed]
- Humes, S.T.; Hentschel, S.; Lavelle, C.M.; Smith, L.C.; Lednicky, J.A.; Saleh, N.B.; Sabo-Attwood, T. Overcoming qRT-PCR interference by select carbon nanotubes in assessments of gene expression. BioTechniques 2017, 63, 81–84. [Google Scholar] [CrossRef] [PubMed]
- Gao, C.H.; Mortimer, M.; Zhang, M.; Holden, P.A.; Cai, P.; Wu, S.; Xin, Y.; Wu, Y.; Huang, Q. Impact of metal oxide nanoparticles on in vitro DNA amplification. PeerJ 2019, 7, e7228. [Google Scholar] [CrossRef] [PubMed]
- Sanabria, N.M.; Gulumian, M. The presence of residual gold nanoparticles in samples interferes with the RT-qPCR assay used for gene expression profiling. J. Nanobiotechnol. 2017, 15, 72. [Google Scholar] [CrossRef]
- Zhang, W.; Lai, E.P. Fluorescence detection of Zinc oxide nanoparticles in water contamination analysis based on surface reactivity with porphyrin. AIMS Environ. Sci. 2018, 5, 67. [Google Scholar] [CrossRef]
- Sanabria, N.M.; Vetten, M.; Andraos, C.; Boodhia, K.; Gulumian, M. Gold nanoparticle interference study during the isolation, quantification, purity and integrity analysis of RNA. PLoS ONE 2014, 9, e114123. [Google Scholar] [CrossRef]
- Carmichael, H.; Nelson, L.; Russell, R.; Chandra, V.; Lyon, A.; Cochran, K. Effect of prostaglandin 15 (R) 15 methyl-E2 methyl ester on aspirin and taurocholic acid-induced gastric mucosal haemorrhage in rats. Gut 1976, 17, 33–36. [Google Scholar] [CrossRef]
- Schena, M.; Shalon, D.; Davis, R.W.; Brown, P.O. Quantitative monitoring of gene expression patterns with a complementary DNA microarray. Science 1995, 270, 467–470. [Google Scholar] [CrossRef]
- Yasokawa, D.; Iwahashi, H. Toxicogenomics using yeast DNA microarrays. J. Biosci. Bioeng. 2010, 110, 511–522. [Google Scholar] [CrossRef]
- Lettieri, T. Recent applications of DNA microarray technology to toxicology and ecotoxicology. Environ. Health Perspect. 2006, 114, 4–9. [Google Scholar] [CrossRef]
- Igarashi, Y.; Nakatsu, N.; Yamashita, T.; Ono, A.; Ohno, Y.; Urushidani, T.; Yamada, H. Open TG-GATEs: A large-scale toxicogenomics database. Nucleic Acids Res. 2015, 43, D921–D927. [Google Scholar] [CrossRef] [PubMed]
- Shi, L.; Campbell, G.; Jones, W.D.; Campagne, F.; Wen, Z.; Walker, S.J.; Su, Z.; Chu, T.M.; Goodsaid, F.M.; Pusztai, L.; et al. The MicroArray Quality Control (MAQC)-II study of common practices for the development and validation of microarray-based predictive models. Nat. Biotechnol. 2010, 28, 827. [Google Scholar]
- Shi, L.; Reid, L.H.; Jones, W.D.; Shippy, R.; Warrington, J.A.; Baker, S.C.; Collins, P.J.; De Longueville, F.; Kawasaki, E.S.; Lee, K.Y.; et al. The MicroArray Quality Control (MAQC) project shows inter-and intraplatform reproducibility of gene expression measurements. Nat. Biotechnol. 2006, 24, 1151. [Google Scholar] [PubMed]
- Guo, L.; Lobenhofer, E.K.; Wang, C.; Shippy, R.; Harris, S.C.; Zhang, L.; Mei, N.; Chen, T.; Herman, D.; Goodsaid, F.M.; et al. Rat toxicogenomic study reveals analytical consistency across microarray platforms. Nat. Biotechnol. 2006, 24, 1162–1169. [Google Scholar] [CrossRef] [PubMed]
- Nitsche, B.M.; Ram, A.F.; Meyer, V. The use of open source bioinformatics tools to dissect transcriptomic data. In Plant Fungal Pathogens; Springer: Berlin, Germany, 2012; pp. 311–331. [Google Scholar]
- Slonim, D.K.; Yanai, I. Getting started in gene expression microarray analysis. PLoS Comput. Biol. 2009, 5. [Google Scholar] [CrossRef] [PubMed]
- Draghici, S.; Khatri, P.; Eklund, A.C.; Szallasi, Z. Reliability and reproducibility issues in DNA microarray measurements. Trends Genet. 2006, 22, 101–109. [Google Scholar] [CrossRef] [PubMed]
- Rao, M.S.; Van Vleet, T.R.; Ciurlionis, R.; Buck, W.R.; Mittelstadt, S.W.; Blomme, E.A.; Liguori, M.J. Comparison of RNA-seq and microarray gene expression platforms for the toxicogenomic evaluation of liver from short-term rat toxicity studies. Front. Genet. 2019, 9, 636. [Google Scholar] [CrossRef]
- Scarpato, M.; Federico, A.; Ciccodicola, A.; Costa, V. Novel transcription factor variants through RNA-sequencing: The importance of being “alternative”. Int. J. Mol. Sci. 2015, 16, 1755–1771. [Google Scholar] [CrossRef]
- Bullard, J.H.; Purdom, E.; Hansen, K.D.; Dudoit, S. Evaluation of statistical methods for normalization and differential expression in mRNA-Seq experiments. BMC Bioinform. 2010, 11, 94. [Google Scholar] [CrossRef]
- Ramsköld, D.; Wang, E.T.; Burge, C.B.; Sandberg, R. An abundance of ubiquitously expressed genes revealed by tissue transcriptome sequence data. PLoS Comput. Biol. 2009, 5. [Google Scholar] [CrossRef]
- Tang, F.; Barbacioru, C.; Wang, Y.; Nordman, E.; Lee, C.; Xu, N.; Wang, X.; Bodeau, J.; Tuch, B.B.; Siddiqui, A.; et al. mRNA-Seq whole-transcriptome analysis of a single cell. Nat. Methods 2009, 6, 377. [Google Scholar] [CrossRef] [PubMed]
- Müller, S.; Diaz, A. Single-Cell mRNA sequencing in cancer research: Integrating the genomic fingerprint. Front. Genet. 2017, 8, 73. [Google Scholar] [CrossRef] [PubMed]
- Yang, J.; Tanaka, Y.; Seay, M.; Li, Z.; Jin, J.; Garmire, L.X.; Zhu, X.; Taylor, A.; Li, W.; Euskirchen, G.; et al. Single cell transcriptomics reveals unanticipated features of early hematopoietic precursors. Nucleic Acids Res. 2017, 45, 1281–1296. [Google Scholar] [CrossRef] [PubMed]
- Ofengeim, D.; Giagtzoglou, N.; Huh, D.; Zou, C.; Yuan, J. Single-cell RNA sequencing: Unraveling the brain one cell at a time. Trends Mol. Med. 2017, 23, 563–576. [Google Scholar] [CrossRef]
- Mohammed, H.; Hernando-Herraez, I.; Savino, A.; Scialdone, A.; Macaulay, I.; Mulas, C.; Chandra, T.; Voet, T.; Dean, W.; Nichols, J.; et al. Single-cell landscape of transcriptional heterogeneity and cell fate decisions during mouse early gastrulation. Cell Rep. 2017, 20, 1215–1228. [Google Scholar] [CrossRef]
- Lee, M.C.W.; Lopez-Diaz, F.J.; Khan, S.Y.; Tariq, M.A.; Dayn, Y.; Vaske, C.J.; Radenbaugh, A.J.; Kim, H.J.; Emerson, B.M.; Pourmand, N. Single-cell analyses of transcriptional heterogeneity during drug tolerance transition in cancer cells by RNA sequencing. Proc. Natl. Acad. Sci. USA 2014, 111, E4726–E4735. [Google Scholar] [CrossRef]
- Shalek, A.K.; Satija, R.; Adiconis, X.; Gertner, R.S.; Gaublomme, J.T.; Raychowdhury, R.; Schwartz, S.; Yosef, N.; Malboeuf, C.; Lu, D.; et al. Single-cell transcriptomics reveals bimodality in expression and splicing in immune cells. Nature 2013, 498, 236–240. [Google Scholar] [CrossRef]
- Patel, A.P.; Tirosh, I.; Trombetta, J.J.; Shalek, A.K.; Gillespie, S.M.; Wakimoto, H.; Cahill, D.P.; Nahed, B.V.; Curry, W.T.; Martuza, R.L.; et al. Single-cell RNA-seq highlights intratumoral heterogeneity in primary glioblastoma. Science 2014, 344, 1396–1401. [Google Scholar] [CrossRef]
- Zeisel, A.; Muñoz-Manchado, A.B.; Codeluppi, S.; Lönnerberg, P.; La Manno, G.; Juréus, A.; Marques, S.; Munguba, H.; He, L.; Betsholtz, C.; et al. Cell types in the mouse cortex and hippocampus revealed by single-cell RNA-seq. Science 2015, 347, 1138–1142. [Google Scholar] [CrossRef]
- Picelli, S.; Faridani, O.R.; Björklund, Å.K.; Winberg, G.; Sagasser, S.; Sandberg, R. Full-length RNA-seq from single cells using Smart-seq2. Nat. Protoc. 2014, 9, 171. [Google Scholar] [CrossRef]
- Ziegenhain, C.; Vieth, B.; Parekh, S.; Reinius, B.; Guillaumet-Adkins, A.; Smets, M.; Leonhardt, H.; Heyn, H.; Hellmann, I.; Enard, W. Comparative analysis of single-cell RNA sequencing methods. Molecular Cell 2017, 65, 631–643. [Google Scholar] [CrossRef] [PubMed]
- Huang, H.; Yu, Y.; Hu, Y.; He, X.; Usta, O.B.; Yarmush, M.L. Generation and manipulation of hydrogel microcapsules by droplet-based microfluidics for mammalian cell culture. Lab Chip 2017, 17, 1913–1932. [Google Scholar] [CrossRef] [PubMed]
- Yousuff, C.M.; Ho, E.T.W.; Hussain, K.; Hamid, N.H.B. Microfluidic platform for cell isolation and manipulation based on cell properties. Micromachines 2017, 8, 15. [Google Scholar] [CrossRef]
- Sheng, K.; Cao, W.; Niu, Y.; Deng, Q.; Zong, C. Effective detection of variation in single-cell transcriptomes using MATQ-seq. Nat. Methods 2017, 14, 267. [Google Scholar] [CrossRef] [PubMed]
- Fan, X.; Zhang, X.; Wu, X.; Guo, H.; Hu, Y.; Tang, F.; Huang, Y. Single-cell RNA-seq transcriptome analysis of linear and circular RNAs in mouse preimplantation embryos. Genome Biol. 2015, 16, 148. [Google Scholar] [CrossRef] [PubMed]
- Subramanian, A.; Narayan, R.; Corsello, S.M.; Peck, D.D.; Natoli, T.E.; Lu, X.; Gould, J.; Davis, J.F.; Tubelli, A.A.; Asiedu, J.K.; et al. A next generation connectivity map: L1000 platform and the first 1,000,000 profiles. Cell 2017, 171, 1437–1452. [Google Scholar] [CrossRef]
- Ramaiahgari, S.C.; Auerbach, S.S.; Saddler, T.O.; Rice, J.R.; Dunlap, P.E.; Sipes, N.S.; DeVito, M.J.; Shah, R.R.; Bushel, P.R.; Merrick, B.A.; et al. The power of resolution: Contextualized understanding of biological responses to liver injury chemicals using high-throughput transcriptomics and benchmark concentration modeling. Toxicol. Sci. 2019, 169, 553–566. [Google Scholar] [CrossRef]
- Yeakley, J.M.; Shepard, P.J.; Goyena, D.E.; VanSteenhouse, H.C.; McComb, J.D.; Seligmann, B.E. A trichostatin A expression signature identified by TempO-Seq targeted whole transcriptome profiling. PLoS ONE 2017, 12, e0178302. [Google Scholar] [CrossRef]
- House, J.S.; Grimm, F.A.; Jima, D.D.; Zhou, Y.H.; Rusyn, I.; Wright, F.A. A pipeline for high-throughput concentration response modeling of gene expression for toxicogenomics. Front. Genet. 2017, 8, 168. [Google Scholar] [CrossRef]
- Marwah, V.S.; Scala, G.; Kinaret, P.A.S.; Serra, A.; Alenius, H.; Fortino, V.; Greco, D. eUTOPIA: SolUTion for Omics data PreprocessIng and Analysis. Source Code Biol. Med. 2019, 14, 1. [Google Scholar] [CrossRef]
- Waters, M.; Stasiewicz, S.; Alex Merrick, B.; Tomer, K.; Bushel, P.; Paules, R.; Stegman, N.; Nehls, G.; Yost, K.J.; Johnson, C.H.; et al. CEBS—Chemical Effects in Biological Systems: A public data repository integrating study design and toxicity data with microarray and proteomics data. Nucleic Acids Res. 2007, 36, D892–D900. [Google Scholar] [CrossRef] [PubMed]
- Lea, I.A.; Gong, H.; Paleja, A.; Rashid, A.; Fostel, J. CEBS: A comprehensive annotated database of toxicological data. Nucleic Acids Res. 2017, 45, D964–D971. [Google Scholar] [CrossRef] [PubMed]
- Lamb, J. The Connectivity Map: A new tool for biomedical research. Nat. Rev. Cancer 2007, 7, 54–60. [Google Scholar] [CrossRef] [PubMed]
- Ganter, B.; Snyder, R.D.; Halbert, D.N.; Lee, M.D. Toxicogenomics in Drug Discovery and Development: Mechanistic Analysis of Compound/Class-Dependent Effects Using The DrugMatrix® Database. Pharmacogenomics 2006. [Google Scholar] [CrossRef]
- Kolesnikov, N.; Hastings, E.; Keays, M.; Melnichuk, O.; Tang, Y.A.; Williams, E.; Dylag, M.; Kurbatova, N.; Brandizi, M.; Burdett, T.; et al. ArrayExpress update—Simplifying data submissions. Nucleic Acids Res. 2015, 43, D1113–D1116. [Google Scholar] [CrossRef]
- Edgar, R.; Domrachev, M.; Lash, A.E. Gene Expression Omnibus: NCBI gene expression and hybridization array data repository. Nucleic Acids Res. 2002, 30, 207–210. [Google Scholar] [CrossRef]
- Duan, Q.; Flynn, C.; Niepel, M.; Hafner, M.; Muhlich, J.L.; Fernandez, N.F.; Rouillard, A.D.; Tan, C.M.; Chen, E.Y.; Golub, T.R.; et al. LINCS Canvas Browser: Interactive web app to query, browse and interrogate LINCS L1000 gene expression signatures. Nucleic Acids Res. 2014, 42, W449–W460. [Google Scholar] [CrossRef]
- Cheng, L.; Li, L. Systematic quality control analysis of LINCS data. CPTv Pharm. Syst. Pharmacol. 2016, 5, 588–598. [Google Scholar] [CrossRef]
- Hansen, S.F.; Sørensen, S.N.; Skjolding, L.M.; Hartmann, N.B.; Baun, A. Revising REACH guidance on information requirements and chemical safety assessment for engineered nanomaterials for aquatic ecotoxicity endpoints: Recommendations from the EnvNano project. Environ. Sci. Eur. 2017, 29, 14. [Google Scholar] [CrossRef]
- EFSA. EFSA Scientific Network on Harmonisation of Risk Assessment Methodologies. EFSA Support. Publ. 2013, 10, 489E. [Google Scholar]
- CEC. Regulation (EC) No 1907/2006 of the European Parliament and of the Council of 18 December 2006 Concerning the Registration, Evaluation, Authorisation and Restriction of Chemicals (REACH); European Parliament: Brussels, Belgium, 2006. [Google Scholar]
- Gant, T.W.; Sauer, U.G.; Zhang, S.D.; Chorley, B.N.; Hackermüller, J.; Perdichizzi, S.; Tollefsen, K.E.; Van Ravenzwaay, B.; Yauk, C.; Tong, W.; et al. A generic transcriptomics reporting framework (TRF) for ‘omics data processing and analysis. Regul. Toxicol. Pharmacol. 2017, 91, S36–S45. [Google Scholar] [CrossRef] [PubMed]
- Sauer, U.G.; Deferme, L.; Gribaldo, L.; Hackermüller, J.; Tralau, T.; van Ravenzwaay, B.; Yauk, C.; Poole, A.; Tong, W.; Gant, T.W. The challenge of the application of’omics technologies in chemicals risk assessment: Background and outlook. Regul. Toxicol. Pharmacol. 2017, 91, S14–S26. [Google Scholar] [CrossRef] [PubMed]
- Farhat, A. Adverse Outcome Pathway on Aryl Hydrogen Receptor Activation Leading to Early Life Stage Mortality, via Reduced VEGF; OECD Publishing: Paris, France, 2019. [Google Scholar]
- Corvi, R.; Ahr, H.J.; Albertini, S.; Blakey, D.H.; Clerici, L.; Coecke, S.; Douglas, G.R.; Gribaldo, L.; Groten, J.P.; Haase, B.; et al. Meeting report: Validation of toxicogenomics-based test systems: ECVAM–ICCVAM/NICEATM considerations for regulatory use. Environ. Health Perspect. 2006, 114, 420–429. [Google Scholar] [CrossRef] [PubMed]
- European Commission. Technical Guidance Document on Risk Assessment in Support Of Commission Directive 93/67/EEC on Risk Assessment for New Notified Substances, Commission Regulation (EC) No 1488/94 on Risk Assessment For Existing Substances, and Directive 98/8/EC of the European Parliament and Of the Council Concerning the Placing of Biocidal Products on the Market; European Commission Joint Research Centre, EUR: Ispra, Italy, 2003; Volume 20418. [Google Scholar]
- European Commission. Technical Guidance Document on Risk Assessment. Institute for Health and Consumer Protection, European Chemicals Bureau. Part II. 2003. Available online: https://echa.europa.eu/documents/10162/16960216/tgdpart2_2ed_en.pdf (accessed on 3 April 2020).
- OECD. Environment Directorate, Joint Meeting of the Chemicals Committee and the Working Party on Chemicals, Pesticides and Biotechnology; OECD: Paris, France.
- Thomas, R.S.; Bahadori, T.; Buckley, T.J.; Cowden, J.; Deisenroth, C.; Dionisio, K.L.; Frithsen, J.B.; Grulke, C.M.; Gwinn, M.R.; Harrill, J.A.; et al. The next generation blueprint of computational toxicology at the US Environmental Protection Agency. Toxicol. Sci. 2019, 169, 317–332. [Google Scholar] [CrossRef] [PubMed]

| Sample | Sample ID | Date | Material | Dose | Time | Day | Array.N | Hybr Date | Slot | Slid Bar Code | Operator |
|---|---|---|---|---|---|---|---|---|---|---|---|
| 12 | 121 | 12/03/2019 | 10 | 24 | 2 | 18.3. | PKI |
© 2020 by the authors. Licensee MDPI, Basel, Switzerland. This article is an open access article distributed under the terms and conditions of the Creative Commons Attribution (CC BY) license (http://creativecommons.org/licenses/by/4.0/).
Share and Cite
Kinaret, P.A.S.; Serra, A.; Federico, A.; Kohonen, P.; Nymark, P.; Liampa, I.; Ha, M.K.; Choi, J.-S.; Jagiello, K.; Sanabria, N.; et al. Transcriptomics in Toxicogenomics, Part I: Experimental Design, Technologies, Publicly Available Data, and Regulatory Aspects. Nanomaterials 2020, 10, 750. https://doi.org/10.3390/nano10040750
Kinaret PAS, Serra A, Federico A, Kohonen P, Nymark P, Liampa I, Ha MK, Choi J-S, Jagiello K, Sanabria N, et al. Transcriptomics in Toxicogenomics, Part I: Experimental Design, Technologies, Publicly Available Data, and Regulatory Aspects. Nanomaterials. 2020; 10(4):750. https://doi.org/10.3390/nano10040750
Chicago/Turabian StyleKinaret, Pia Anneli Sofia, Angela Serra, Antonio Federico, Pekka Kohonen, Penny Nymark, Irene Liampa, My Kieu Ha, Jang-Sik Choi, Karolina Jagiello, Natasha Sanabria, and et al. 2020. "Transcriptomics in Toxicogenomics, Part I: Experimental Design, Technologies, Publicly Available Data, and Regulatory Aspects" Nanomaterials 10, no. 4: 750. https://doi.org/10.3390/nano10040750
APA StyleKinaret, P. A. S., Serra, A., Federico, A., Kohonen, P., Nymark, P., Liampa, I., Ha, M. K., Choi, J.-S., Jagiello, K., Sanabria, N., Melagraki, G., Cattelani, L., Fratello, M., Sarimveis, H., Afantitis, A., Yoon, T.-H., Gulumian, M., Grafström, R., Puzyn, T., & Greco, D. (2020). Transcriptomics in Toxicogenomics, Part I: Experimental Design, Technologies, Publicly Available Data, and Regulatory Aspects. Nanomaterials, 10(4), 750. https://doi.org/10.3390/nano10040750