Titania Nanofluids Based on Natural Ester: Cooling and Insulation Properties Assessment


Abstract
1. Introduction
2. Materials and Methods
3. Results
3.1. Characterization of Properties
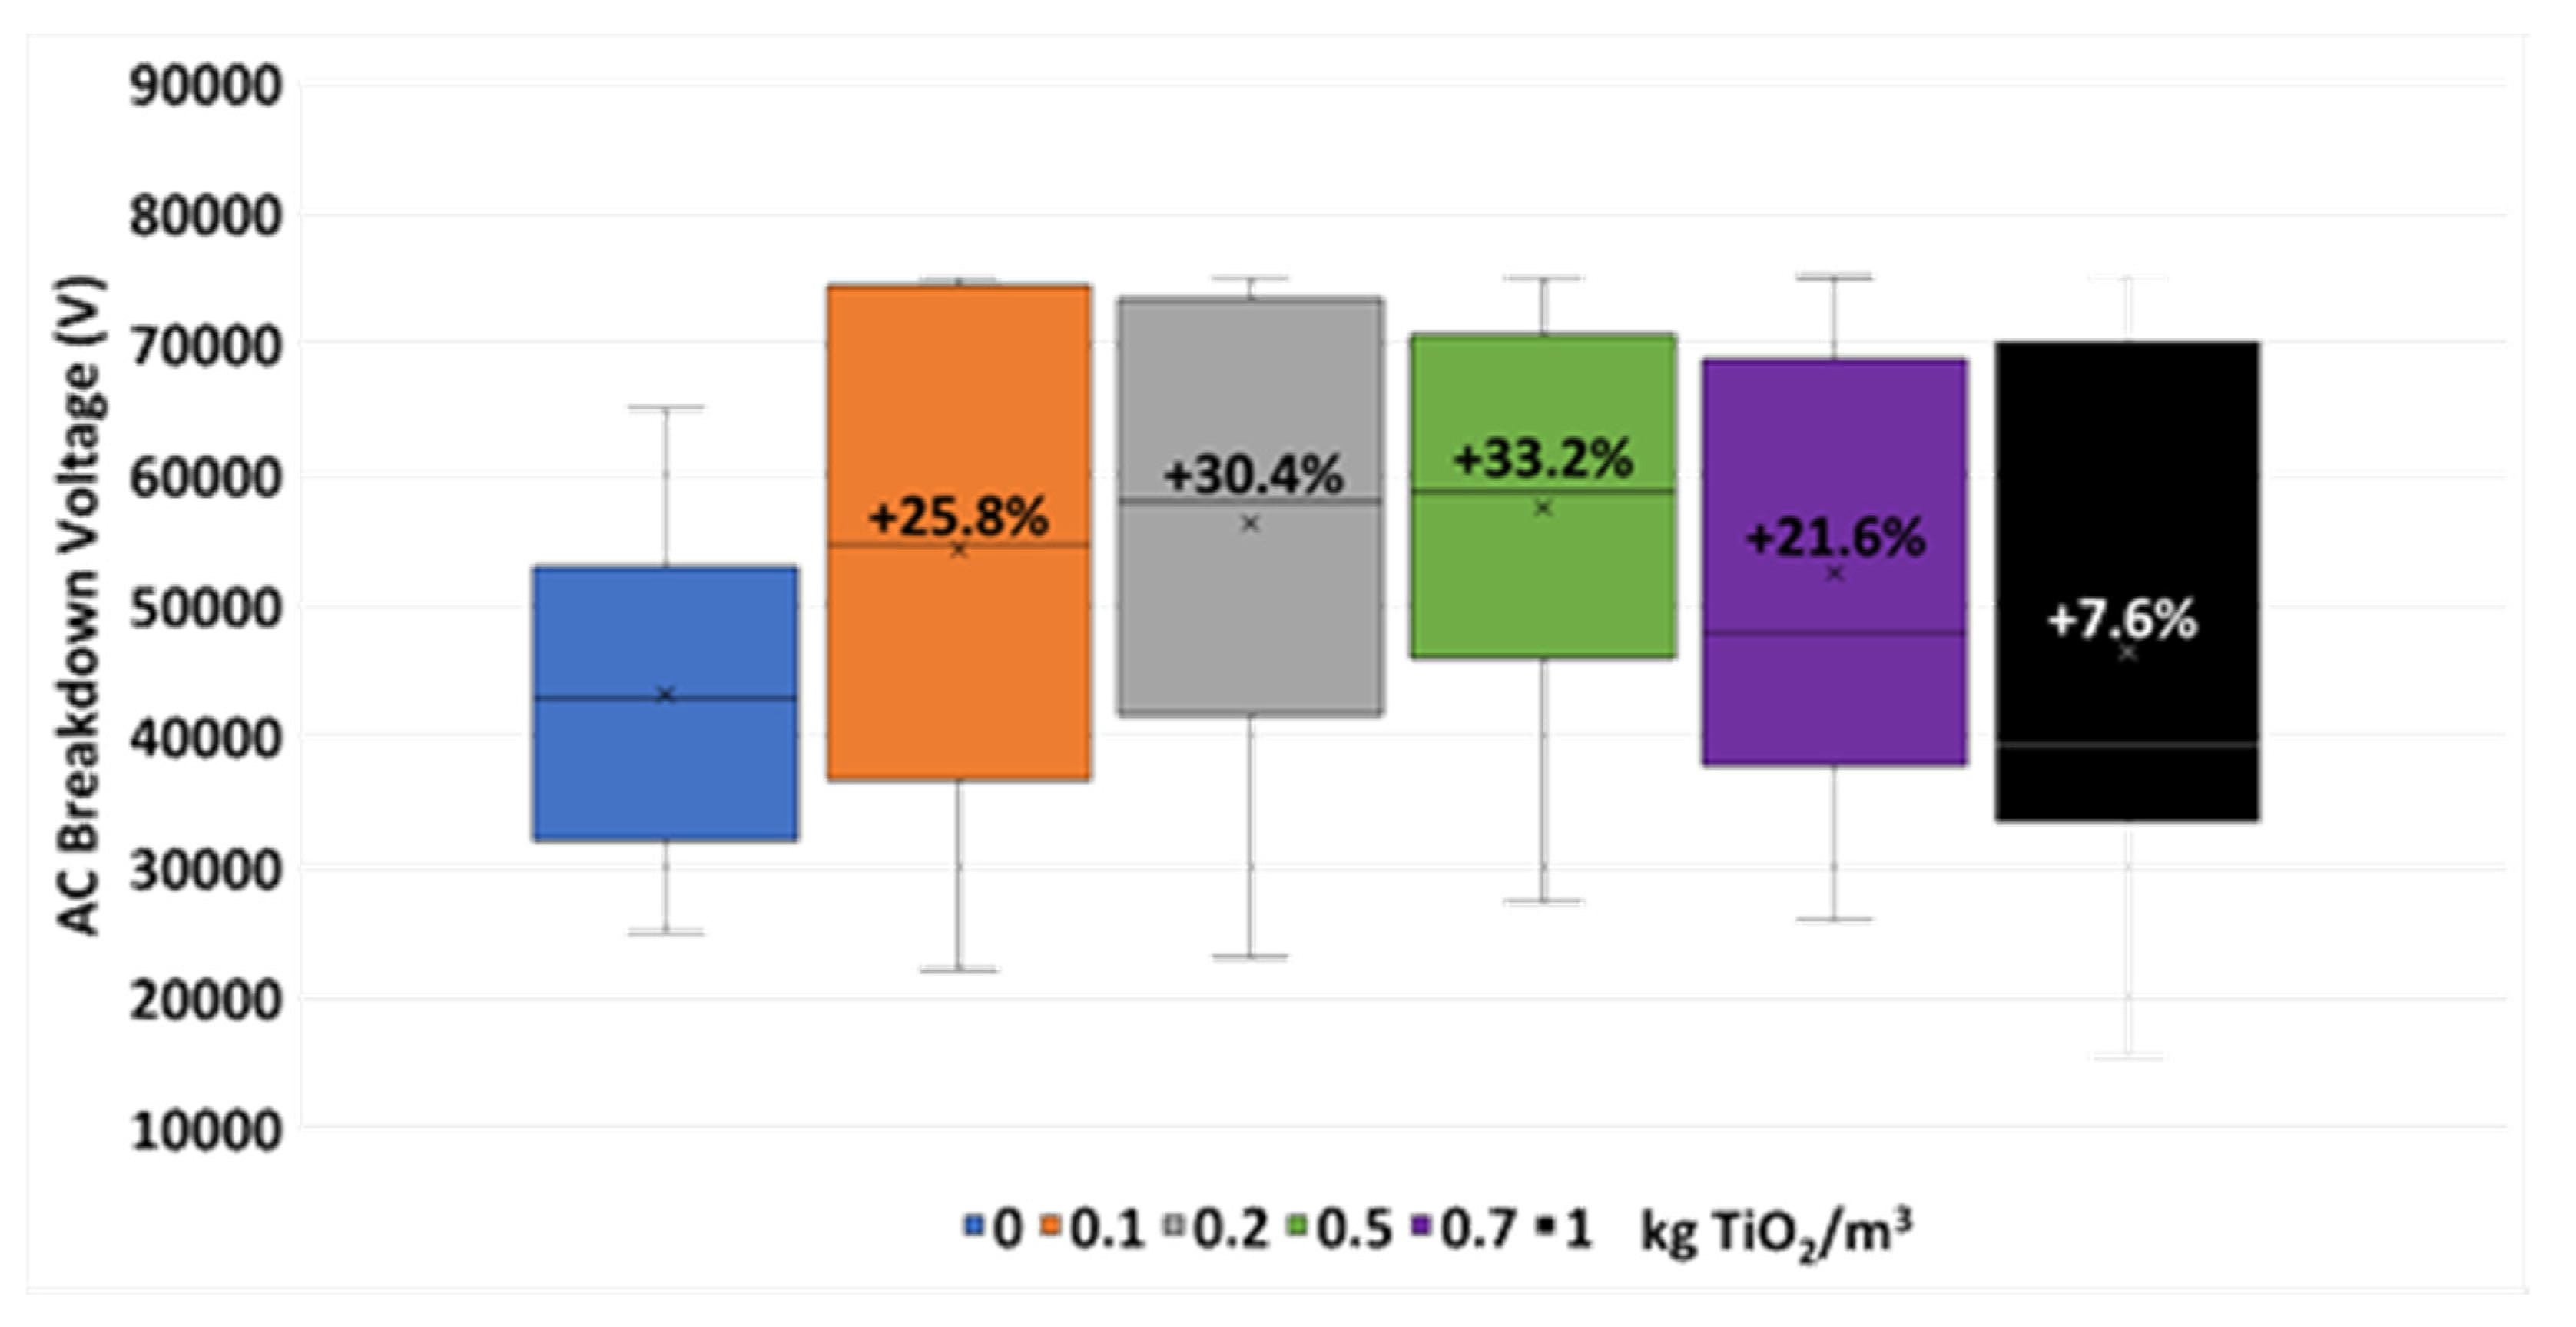
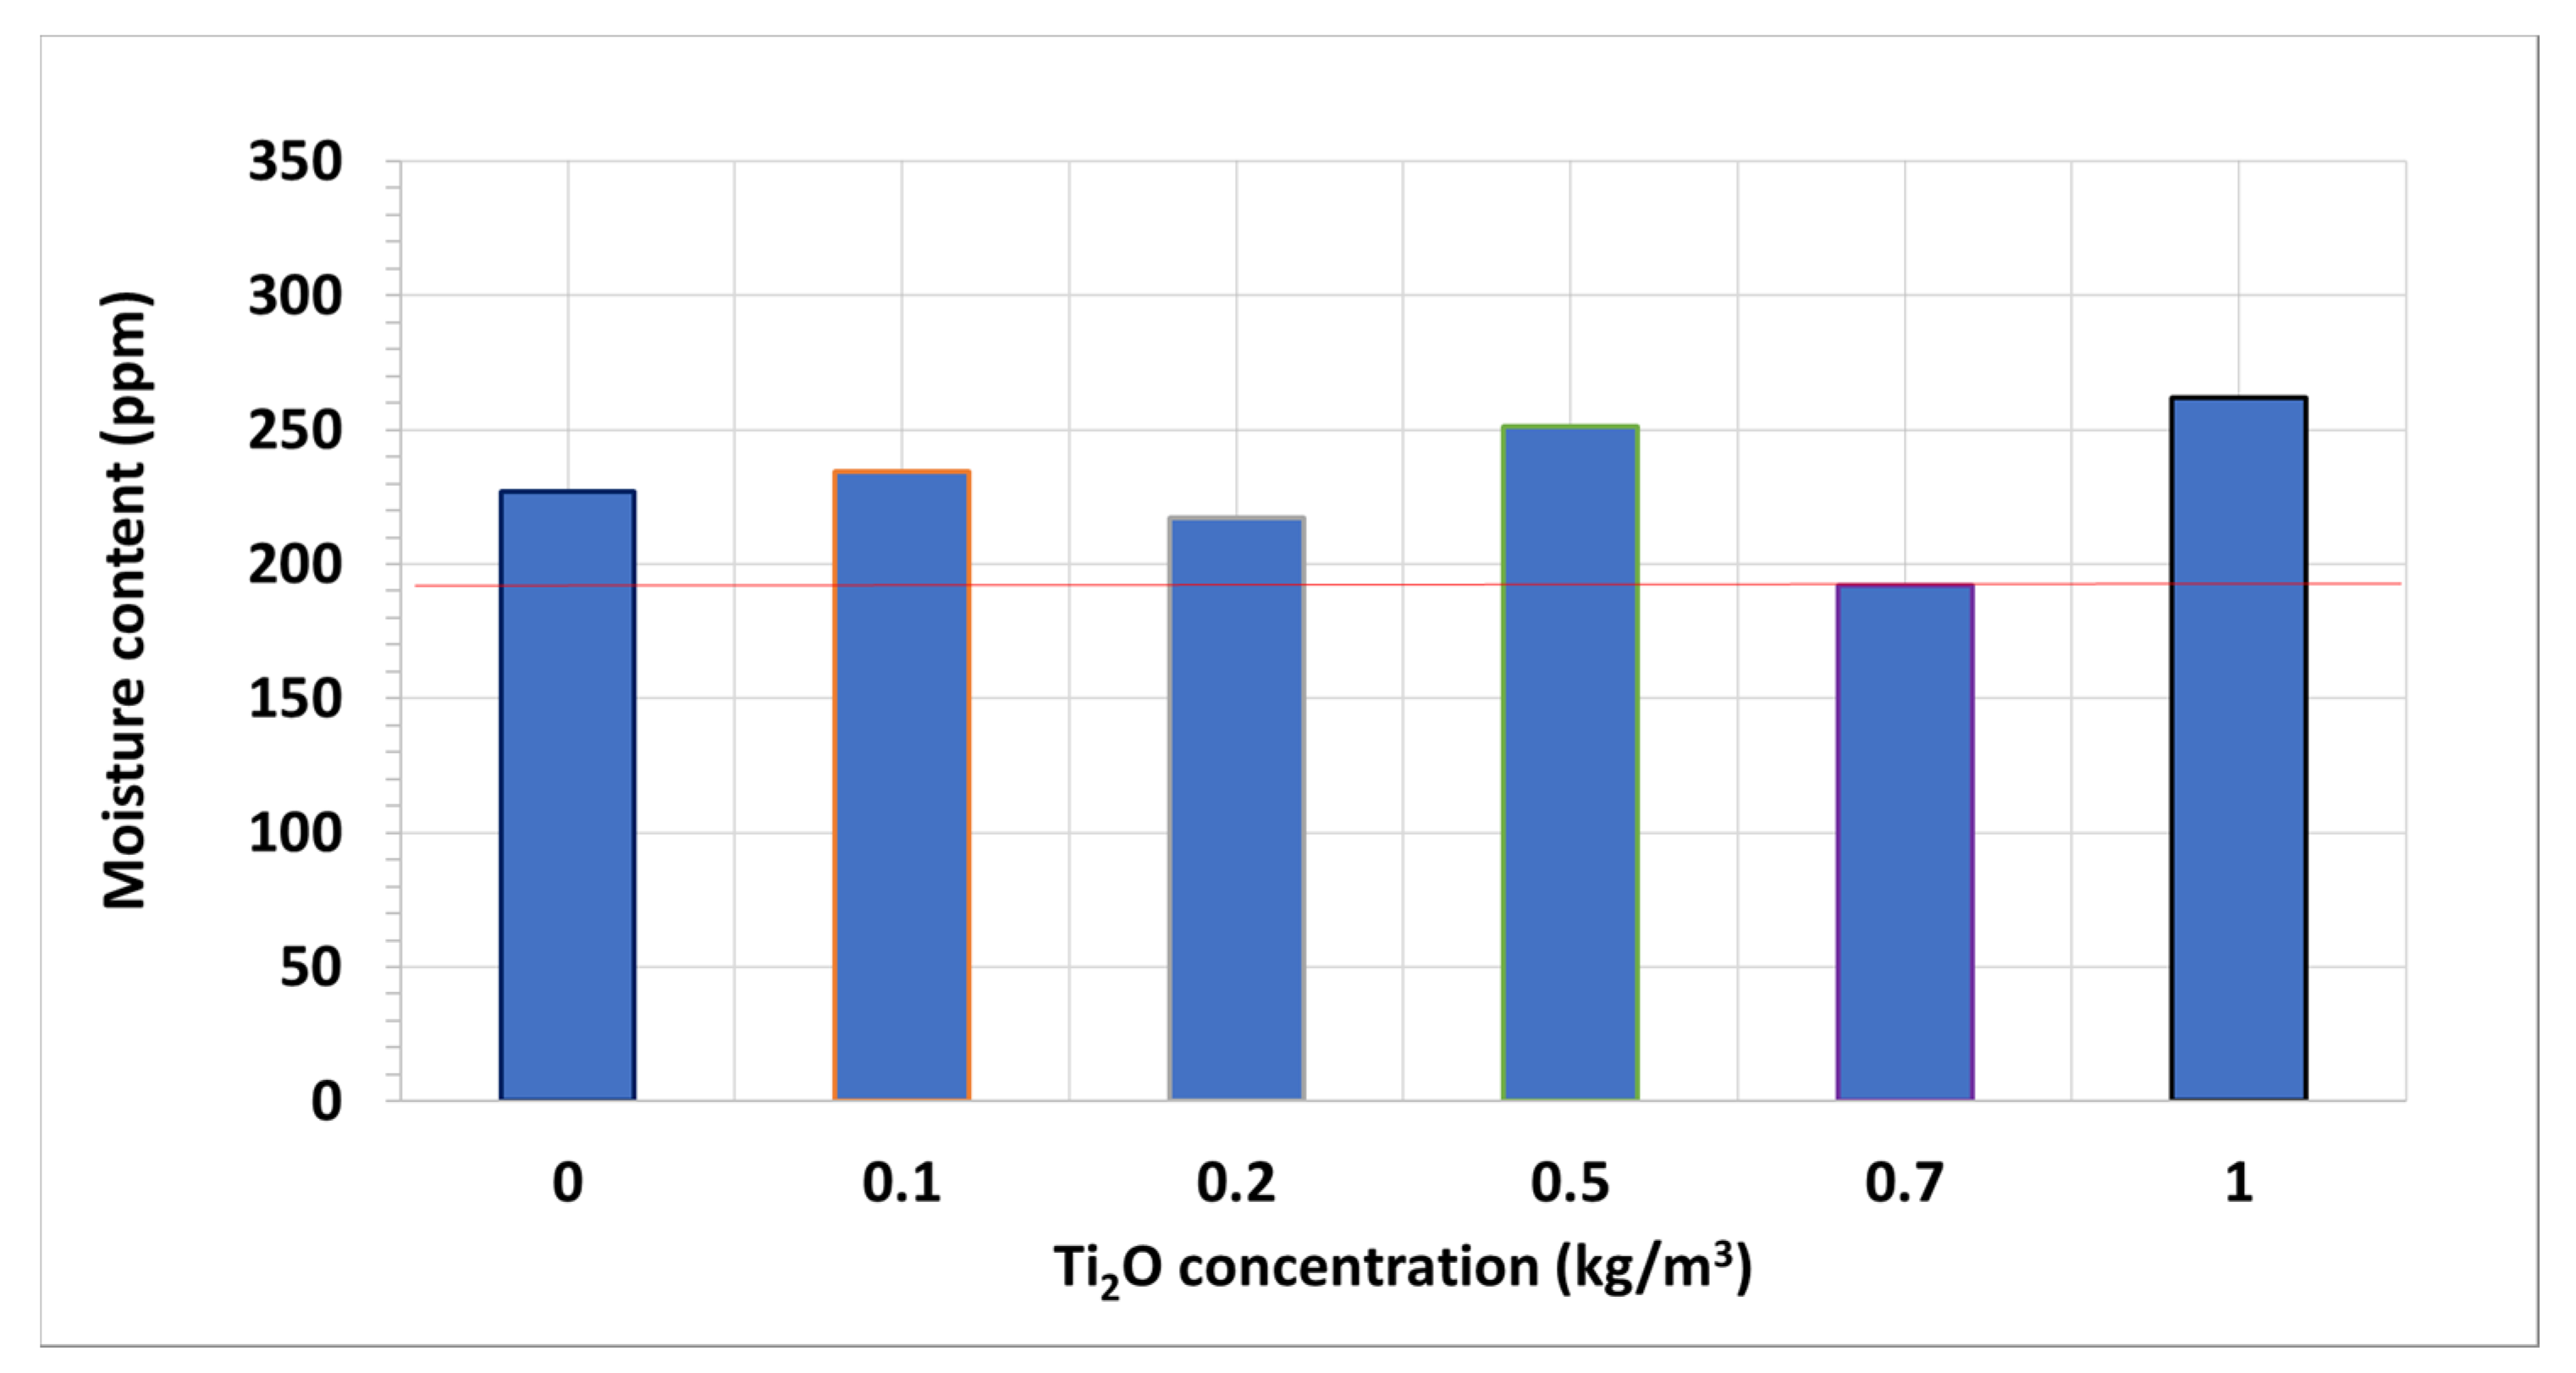
3.1.1. Breakdown Voltage and Moisture Content
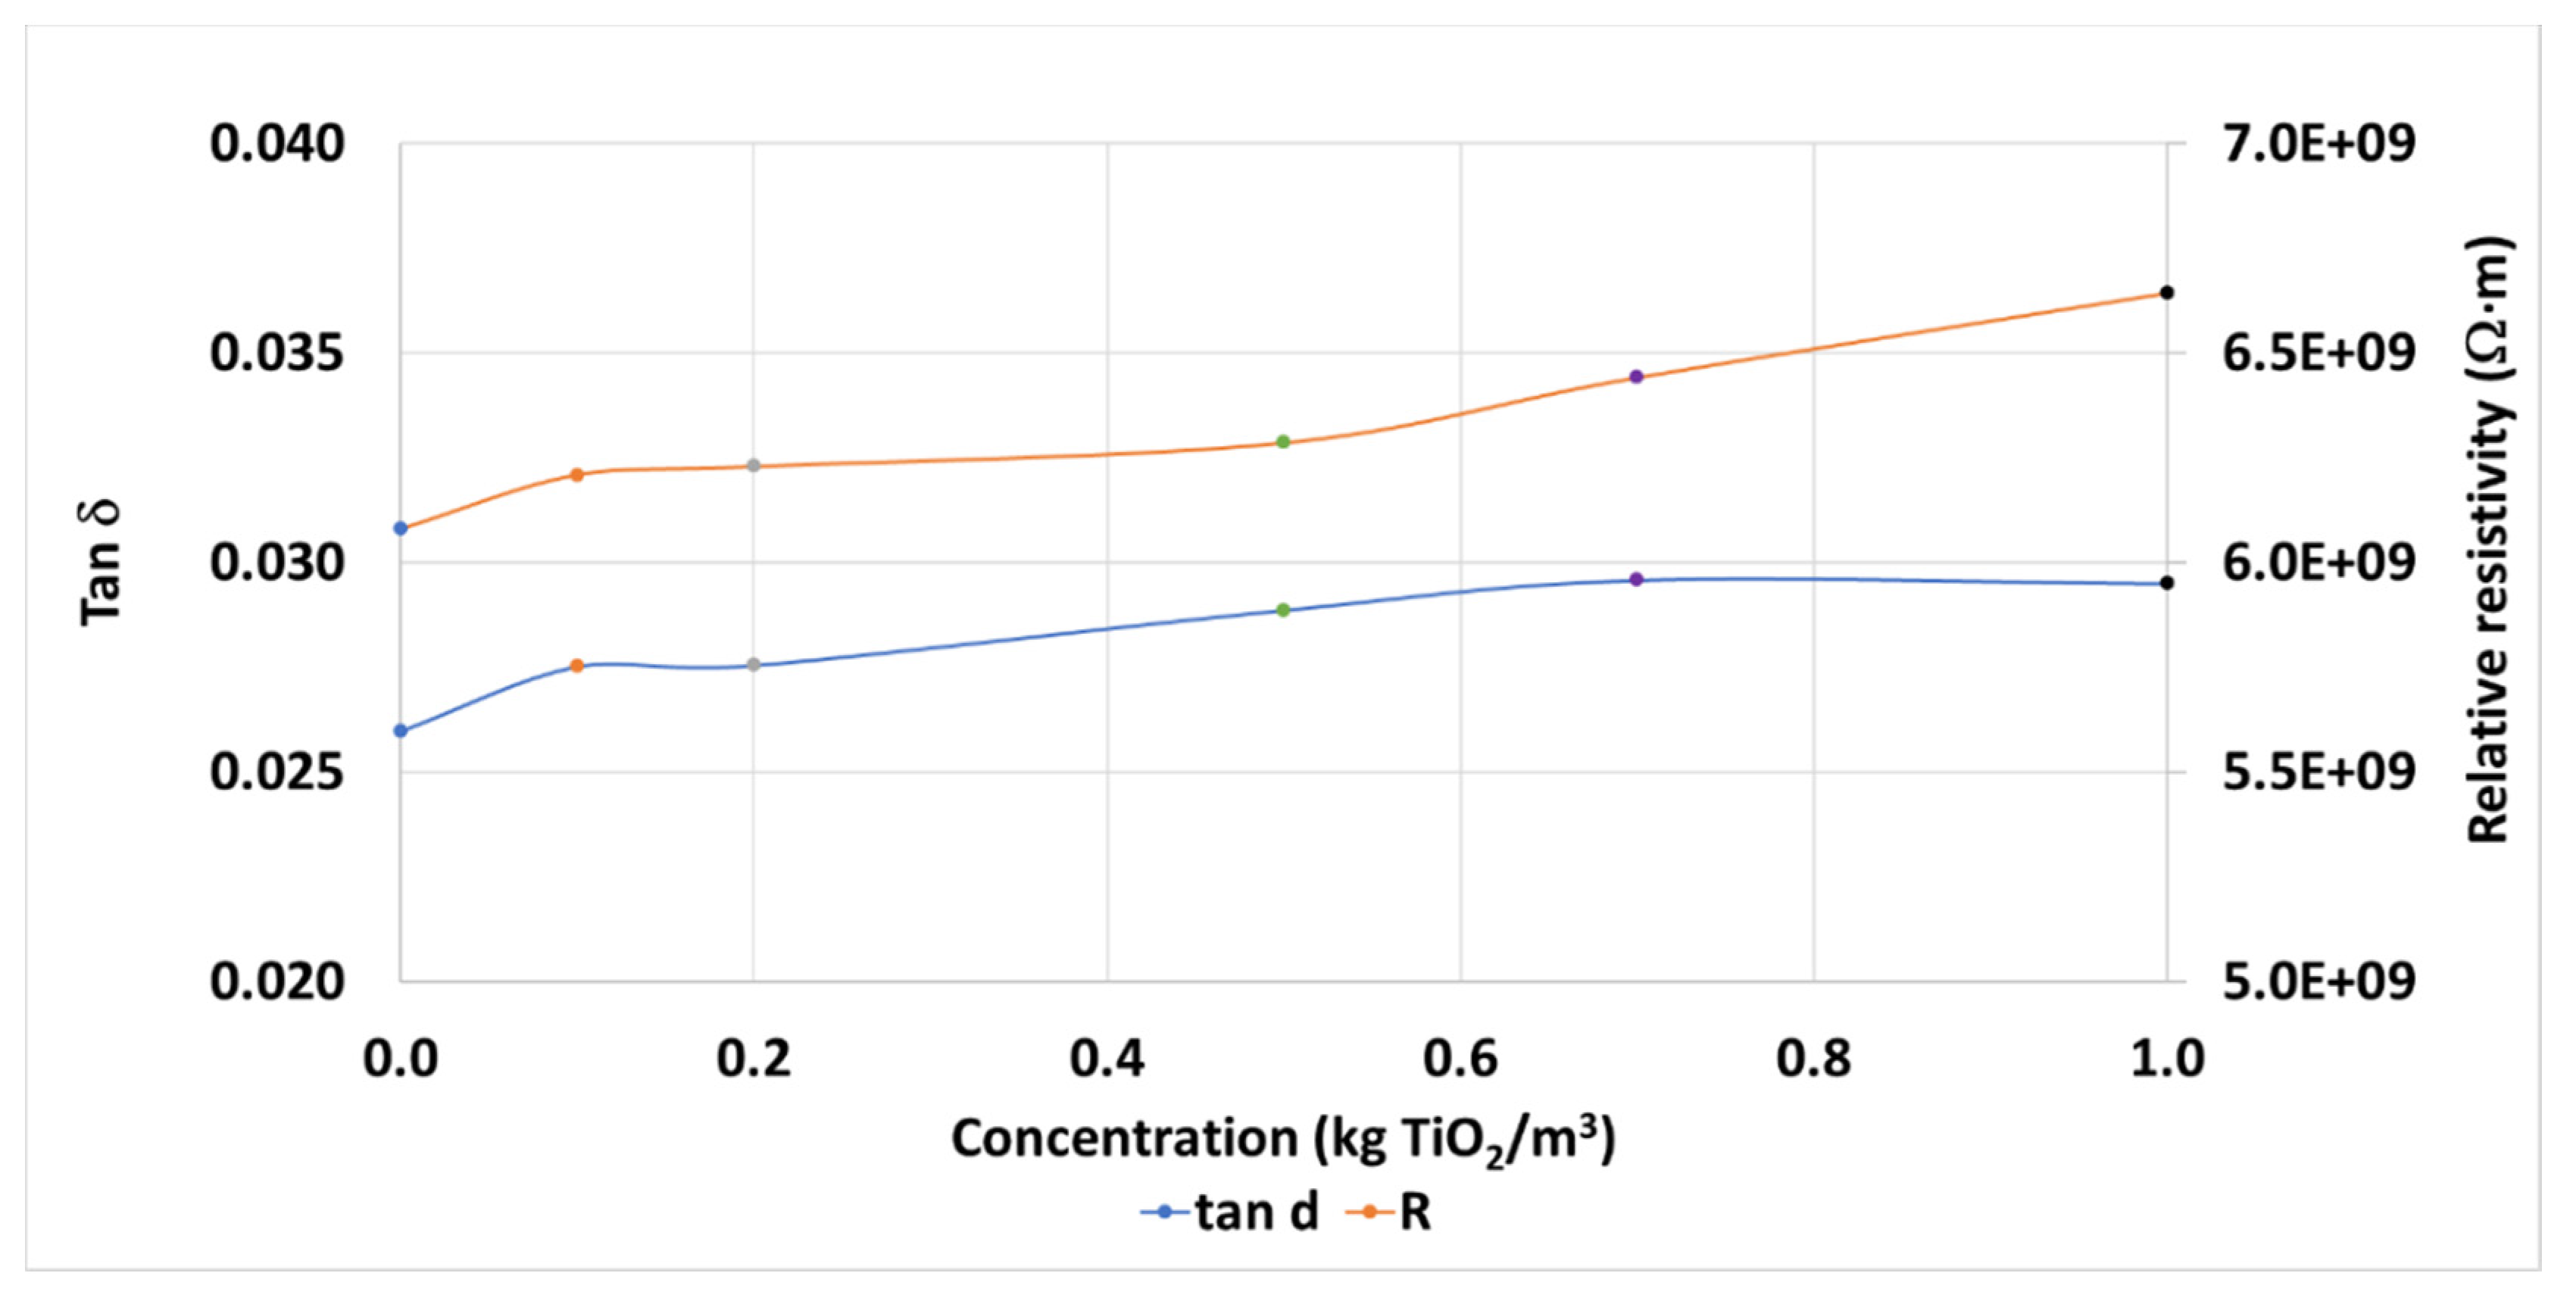
3.1.2. Resistivity and Dielectric Dissipation Factor
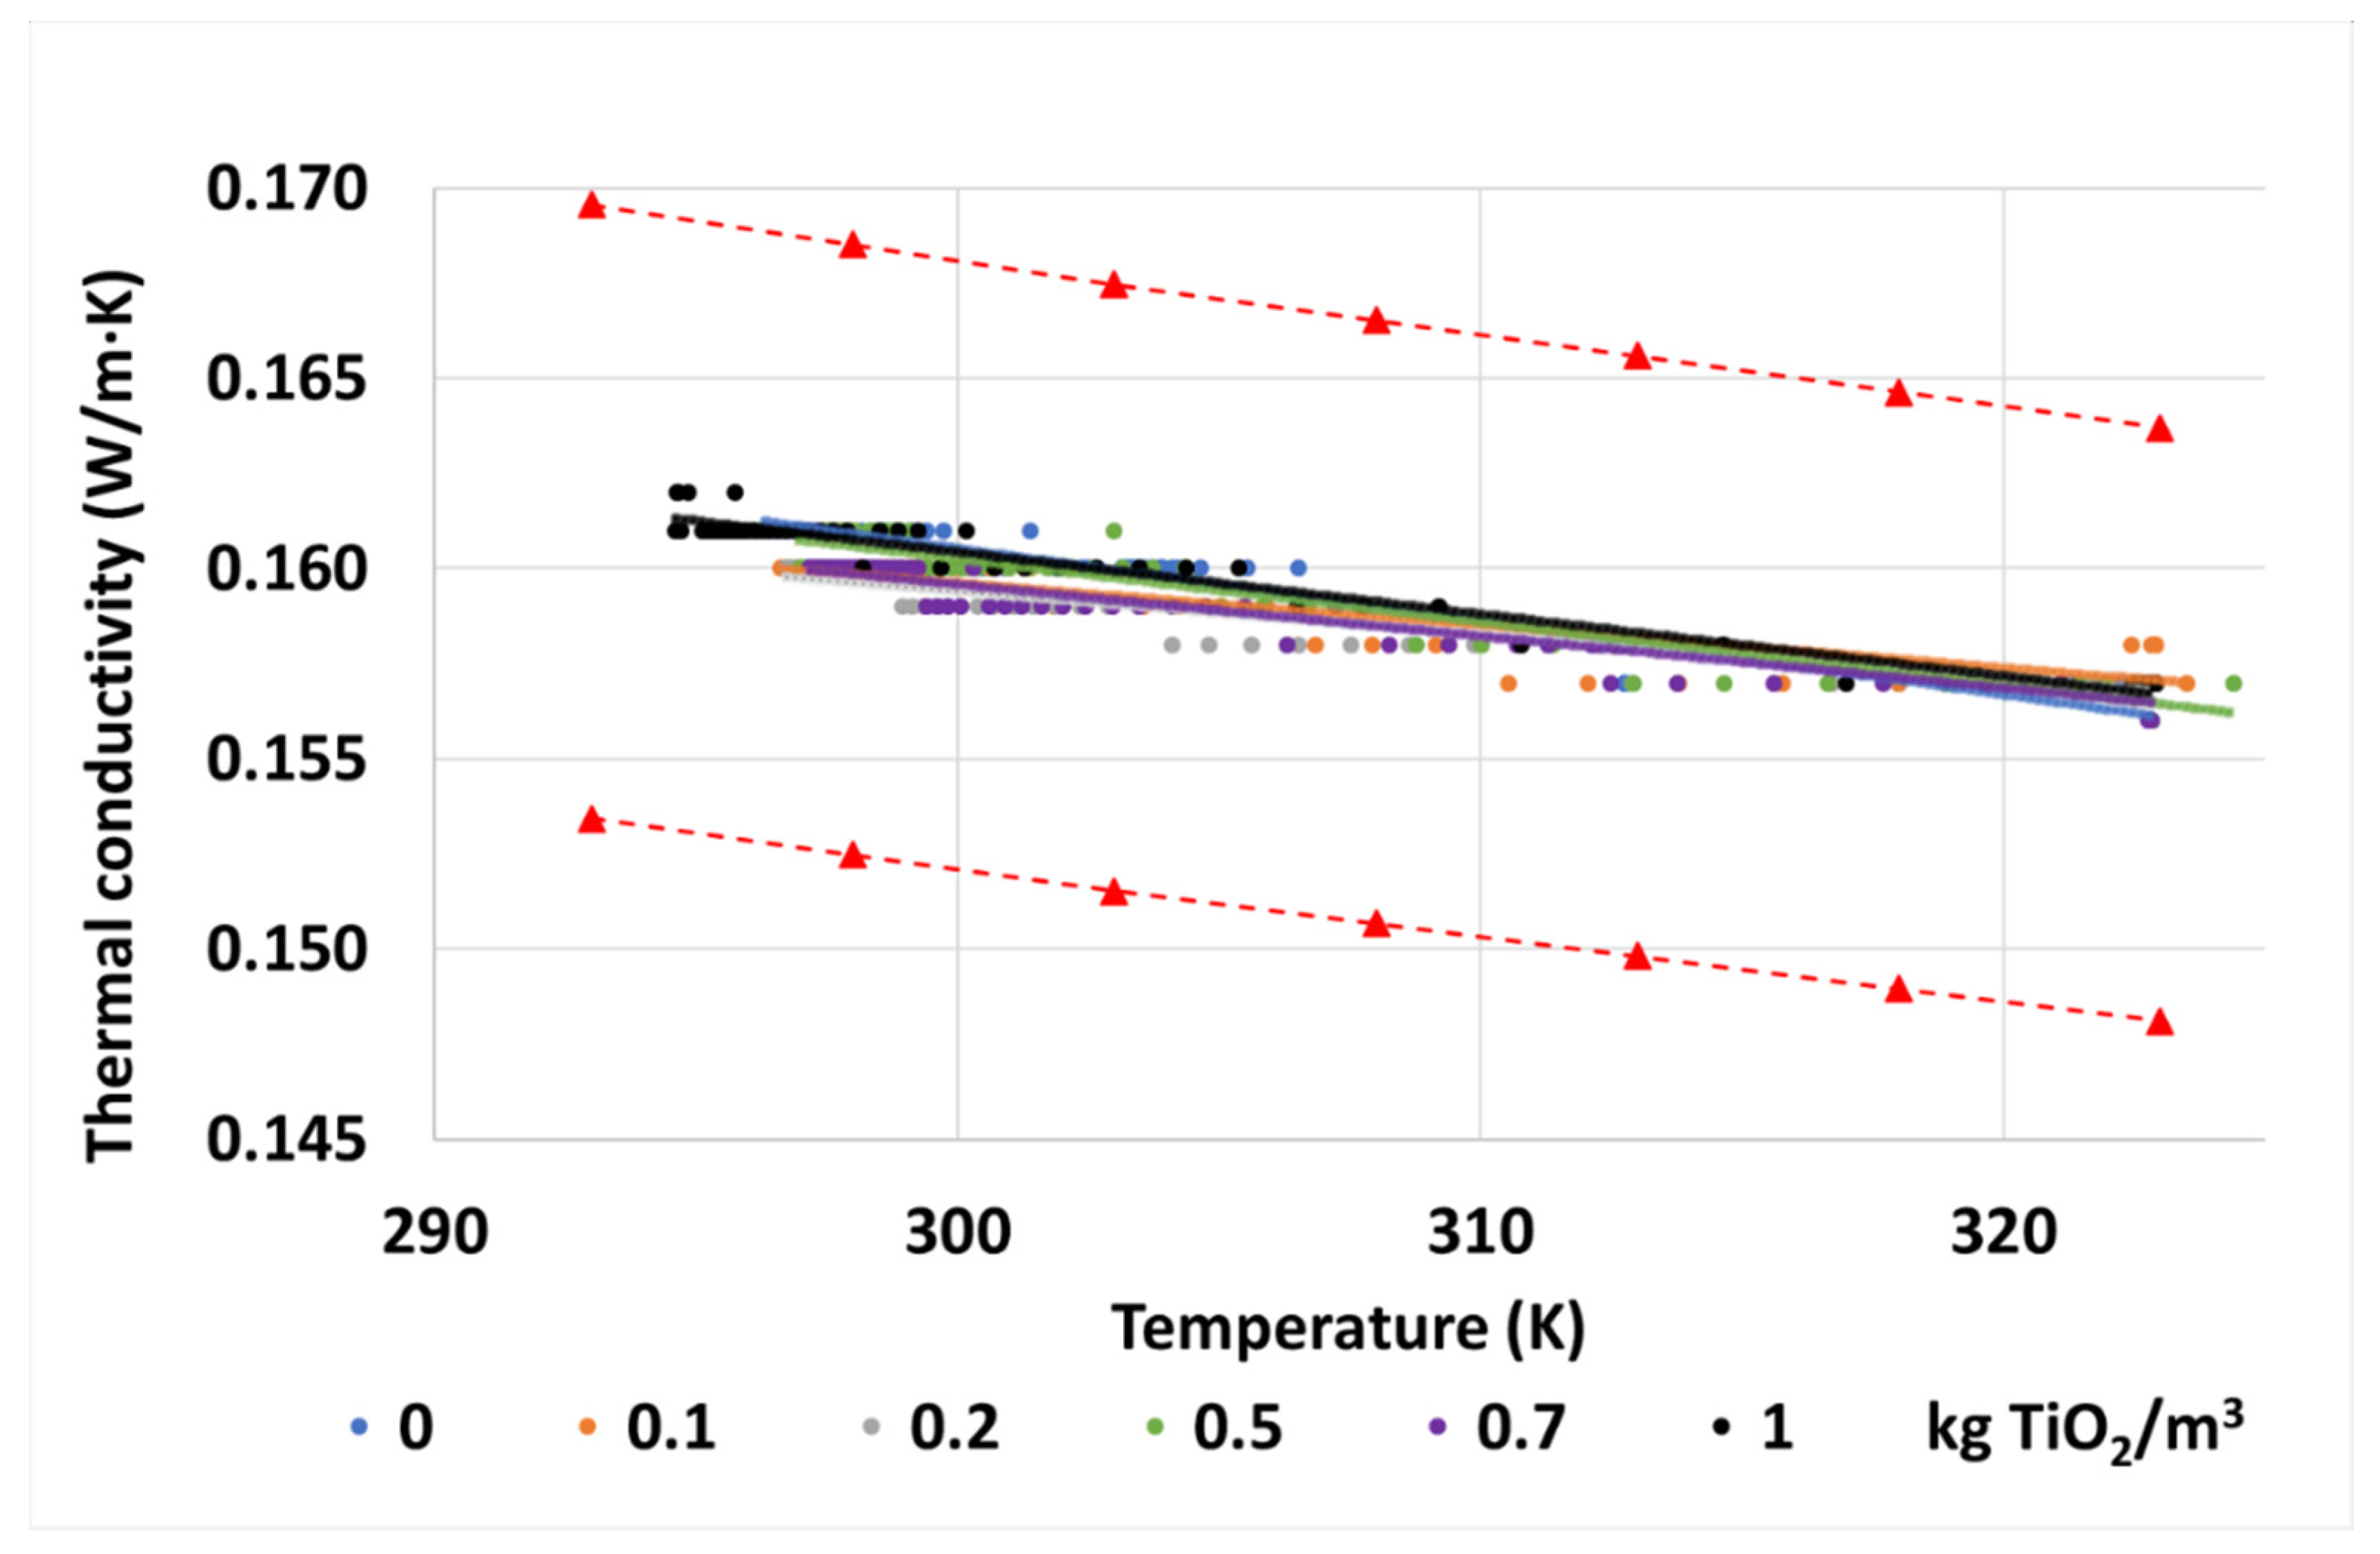
3.1.3. Thermal Conductivity
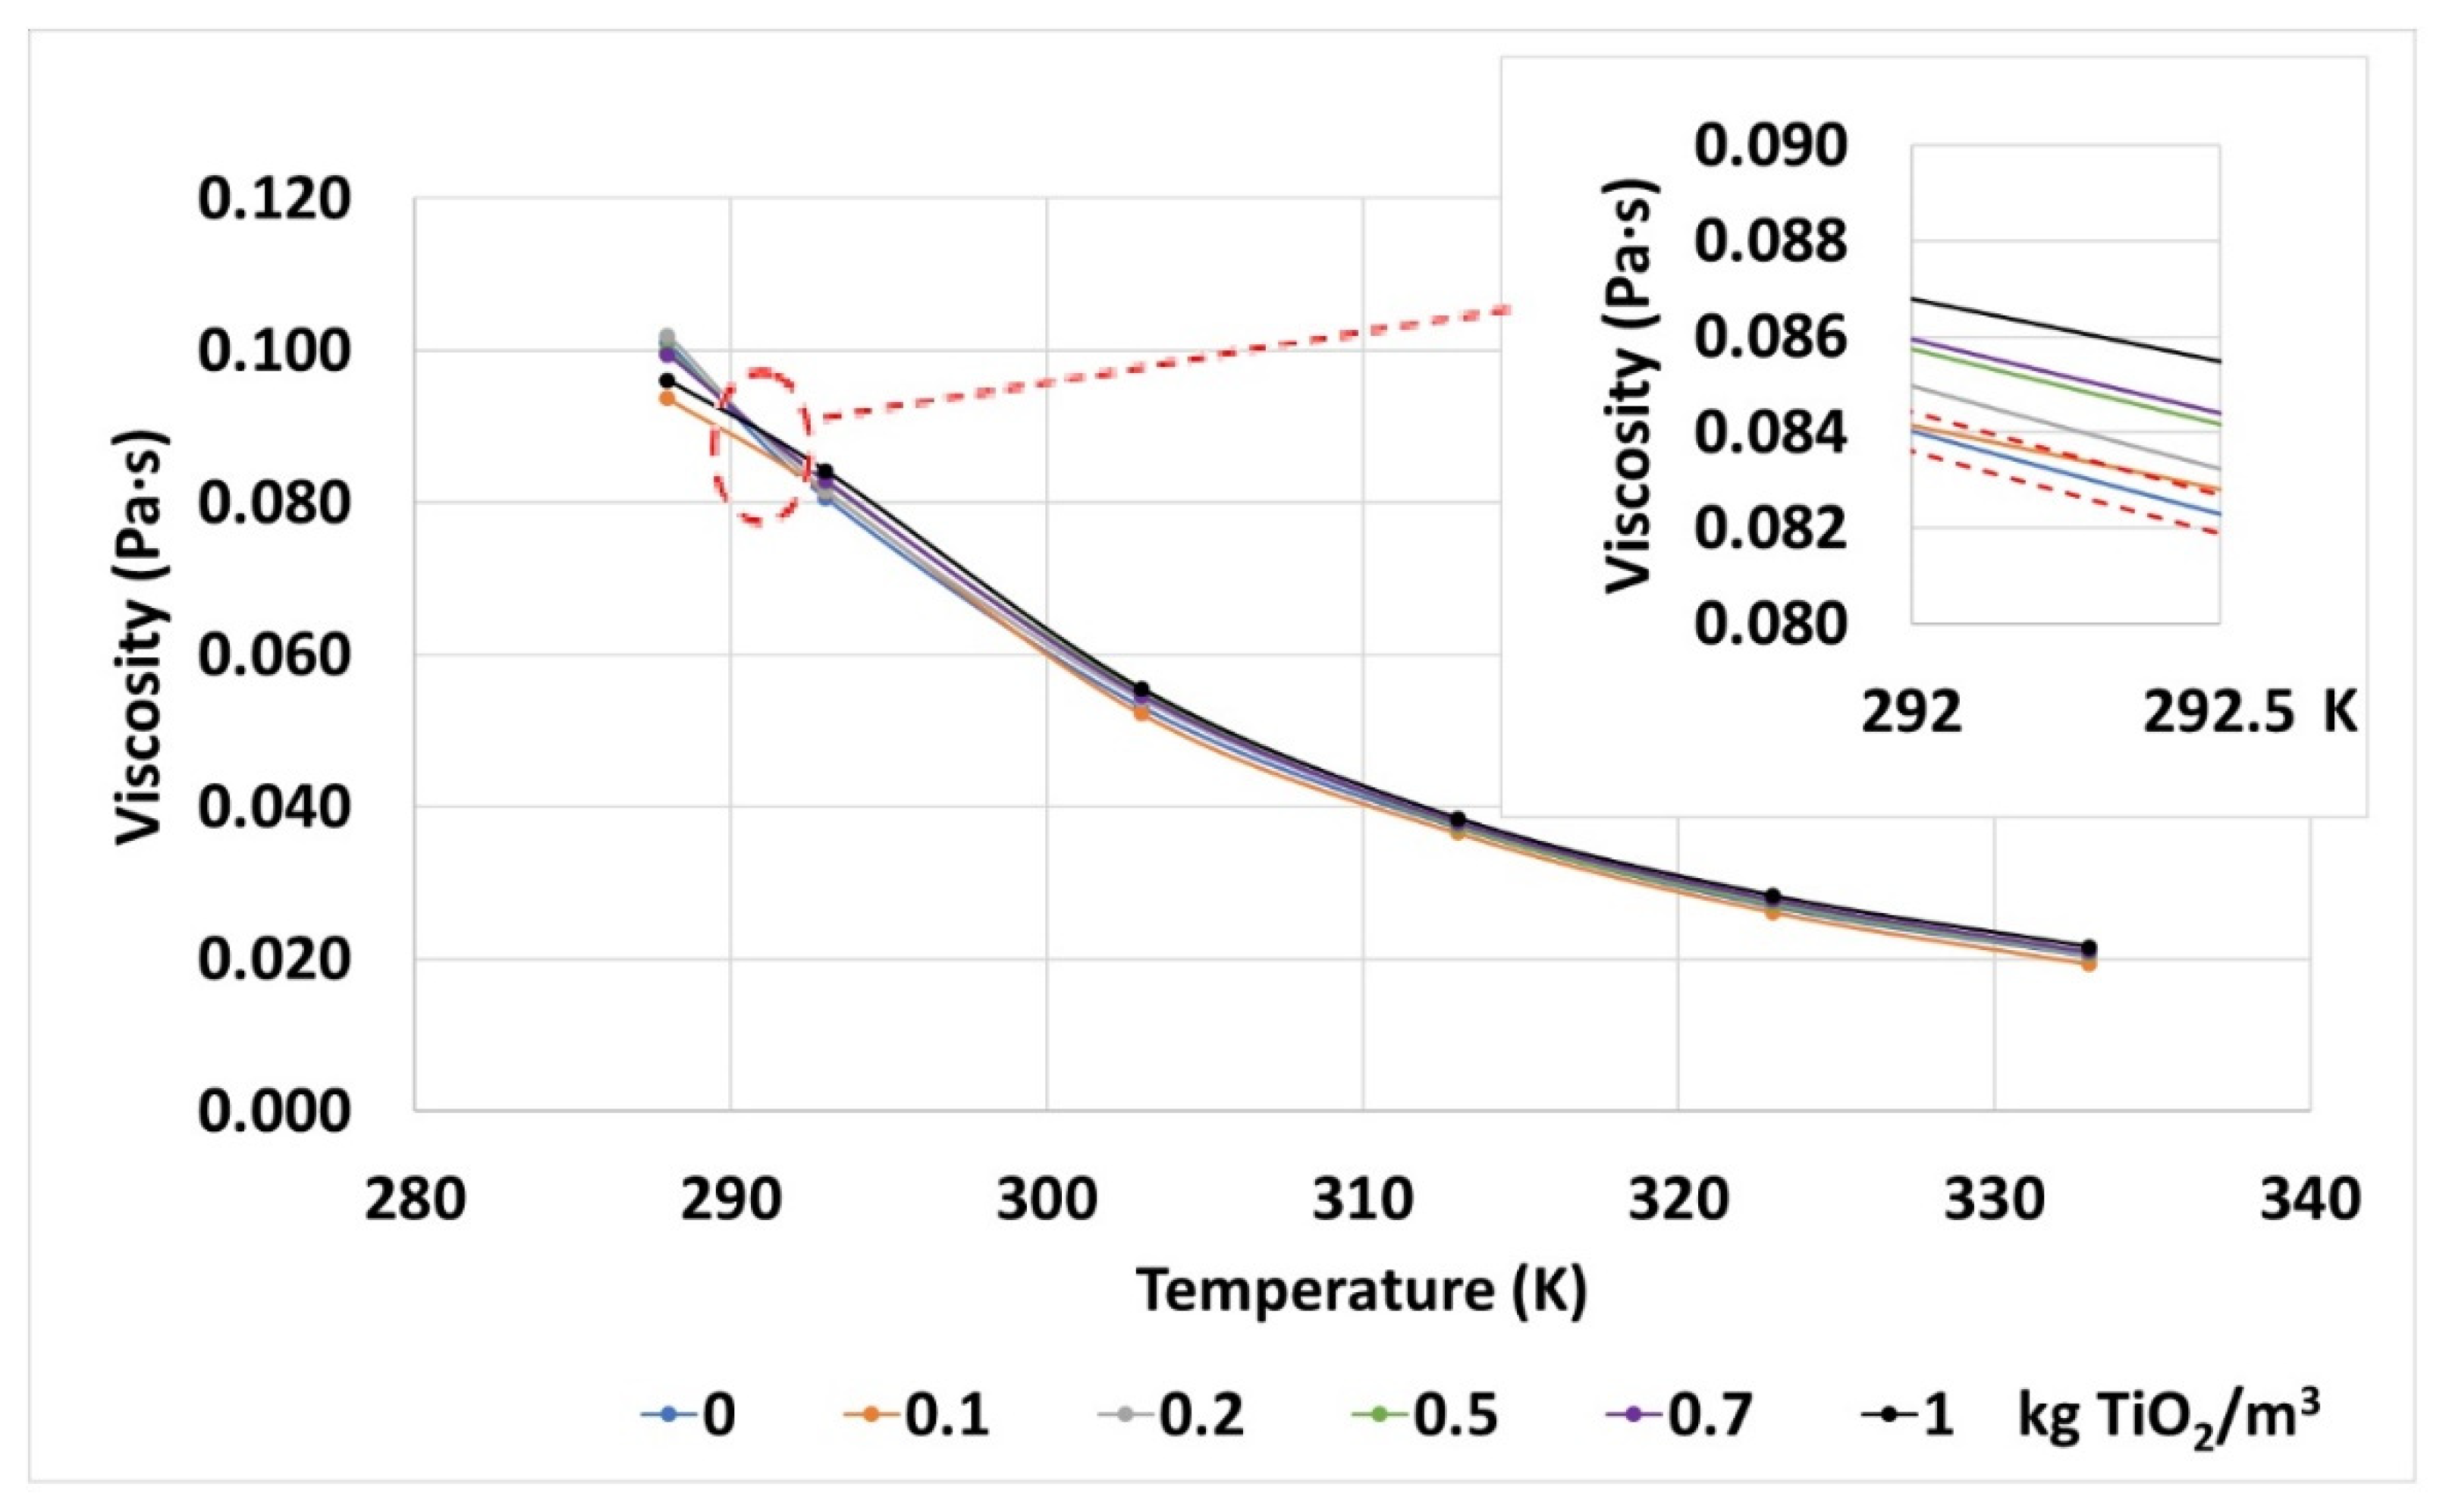
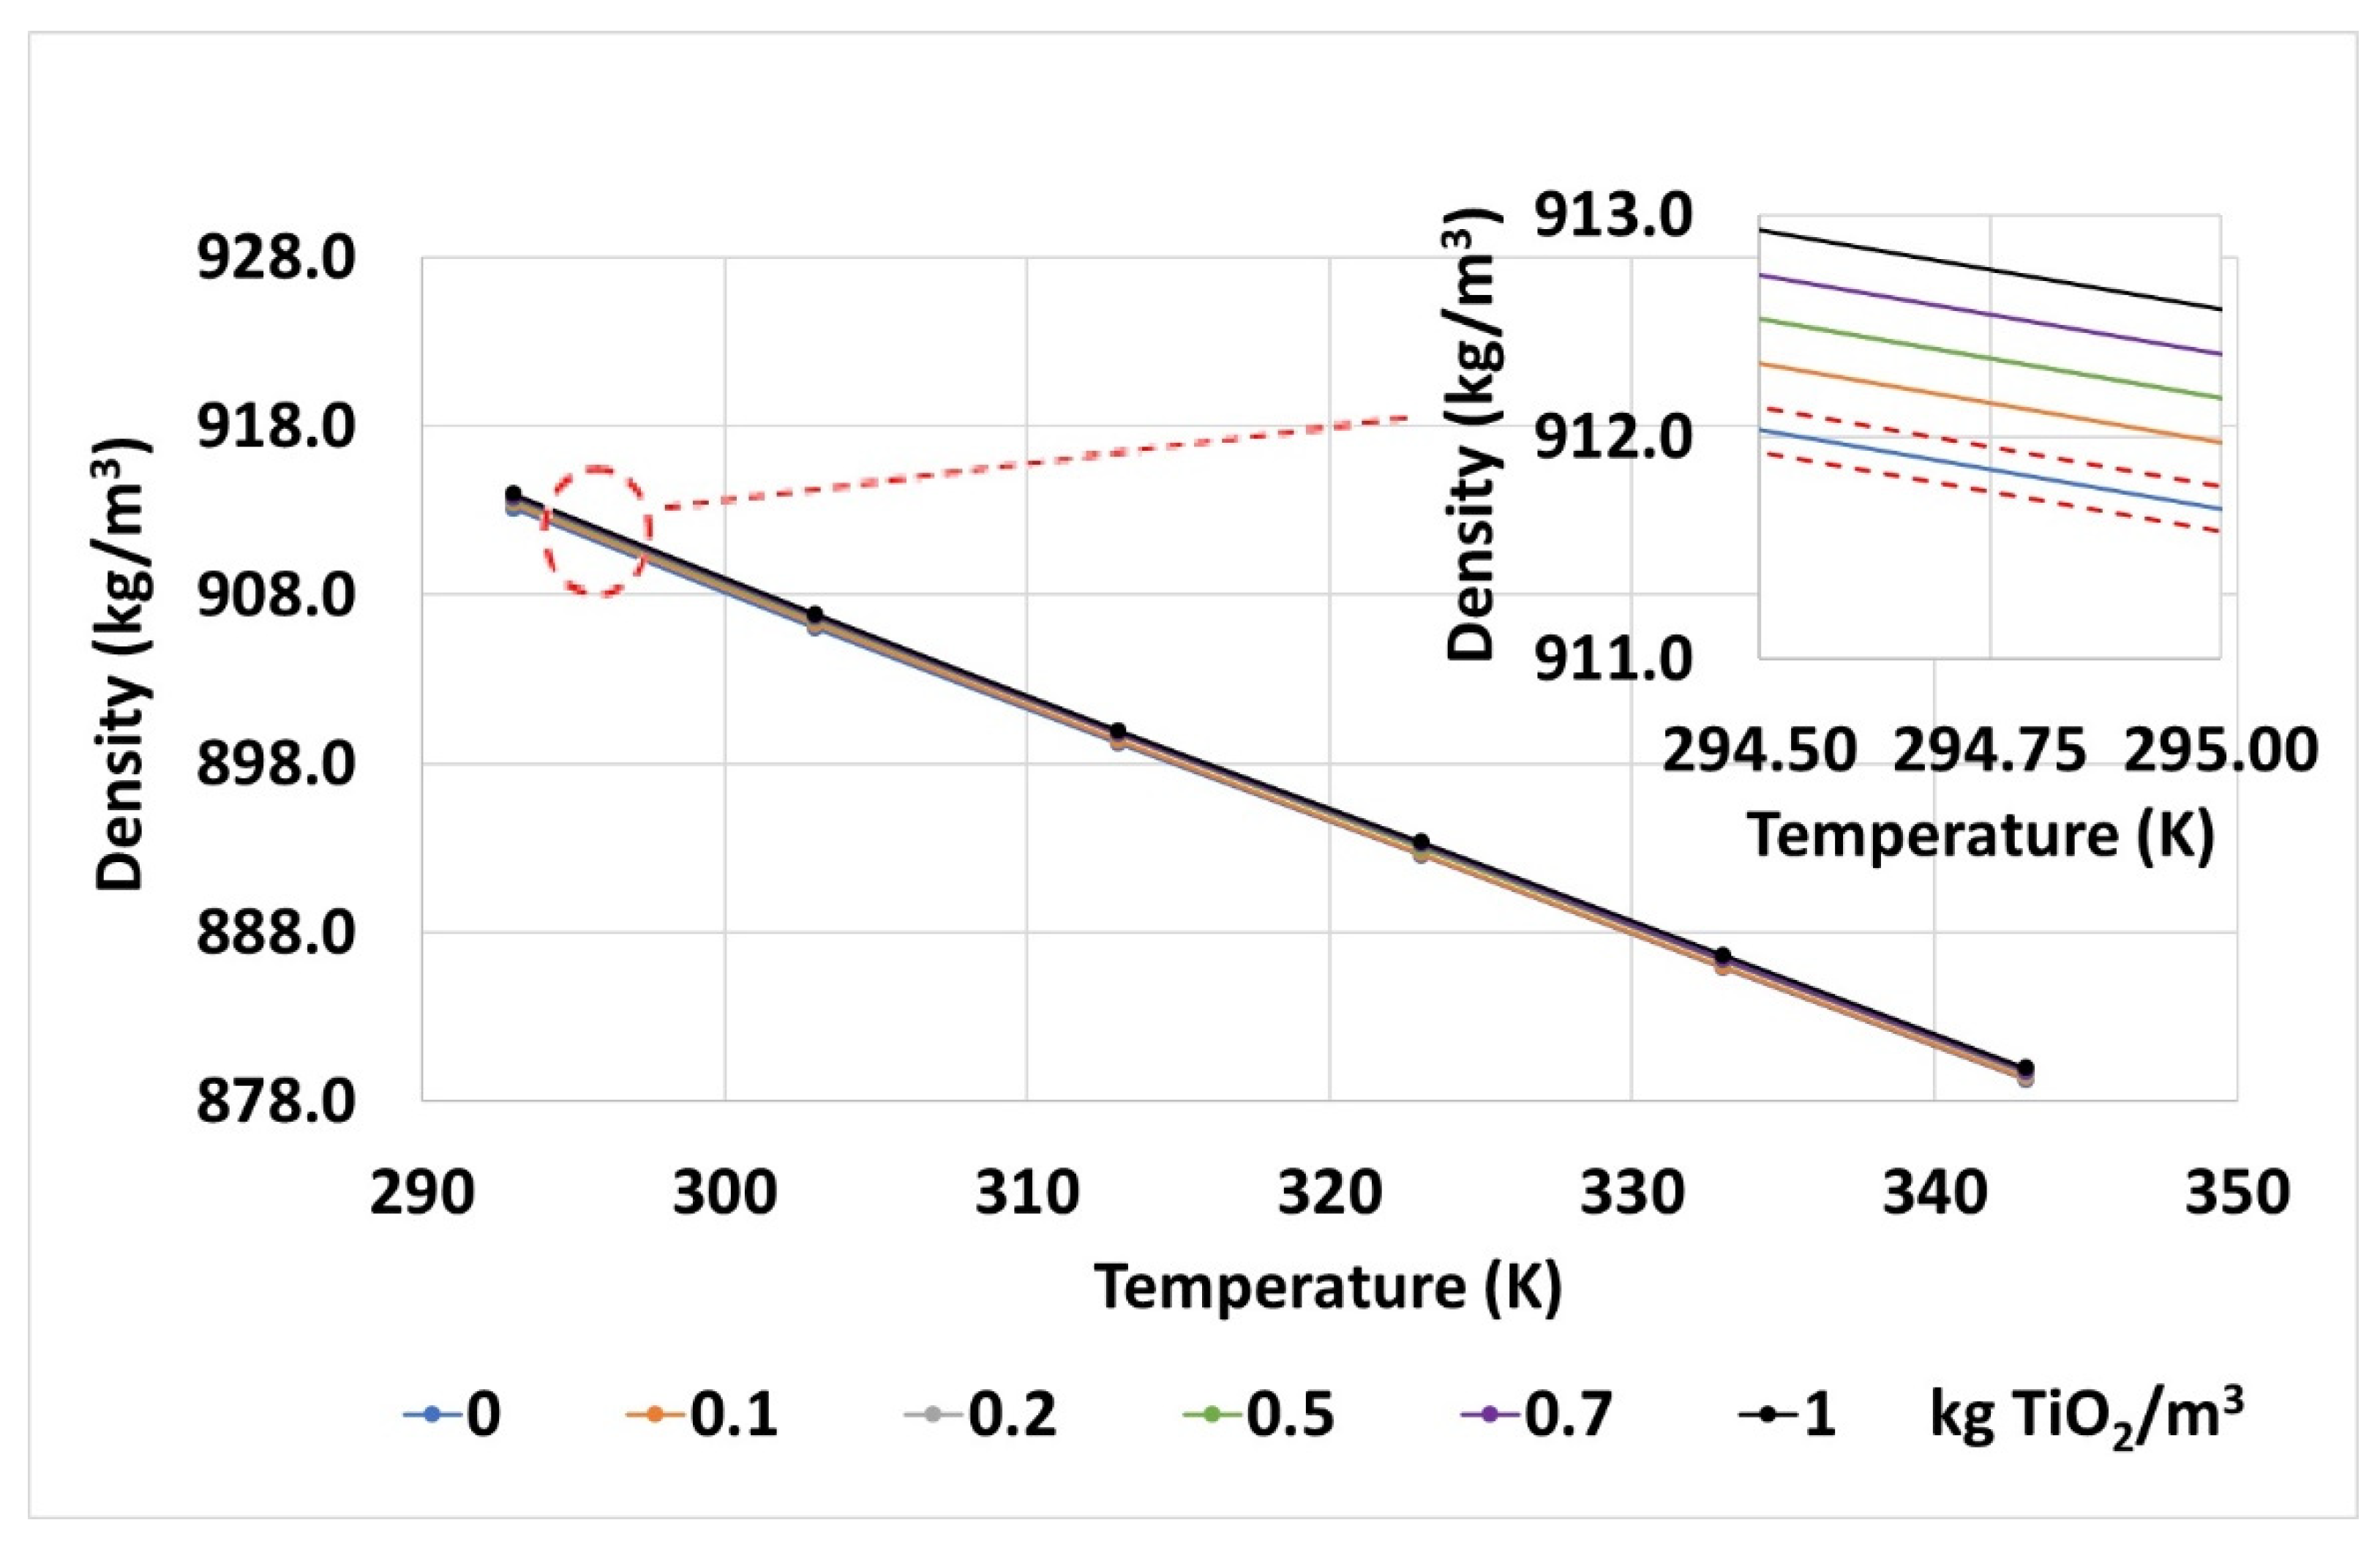
3.1.4. Dynamic Viscosity and Density
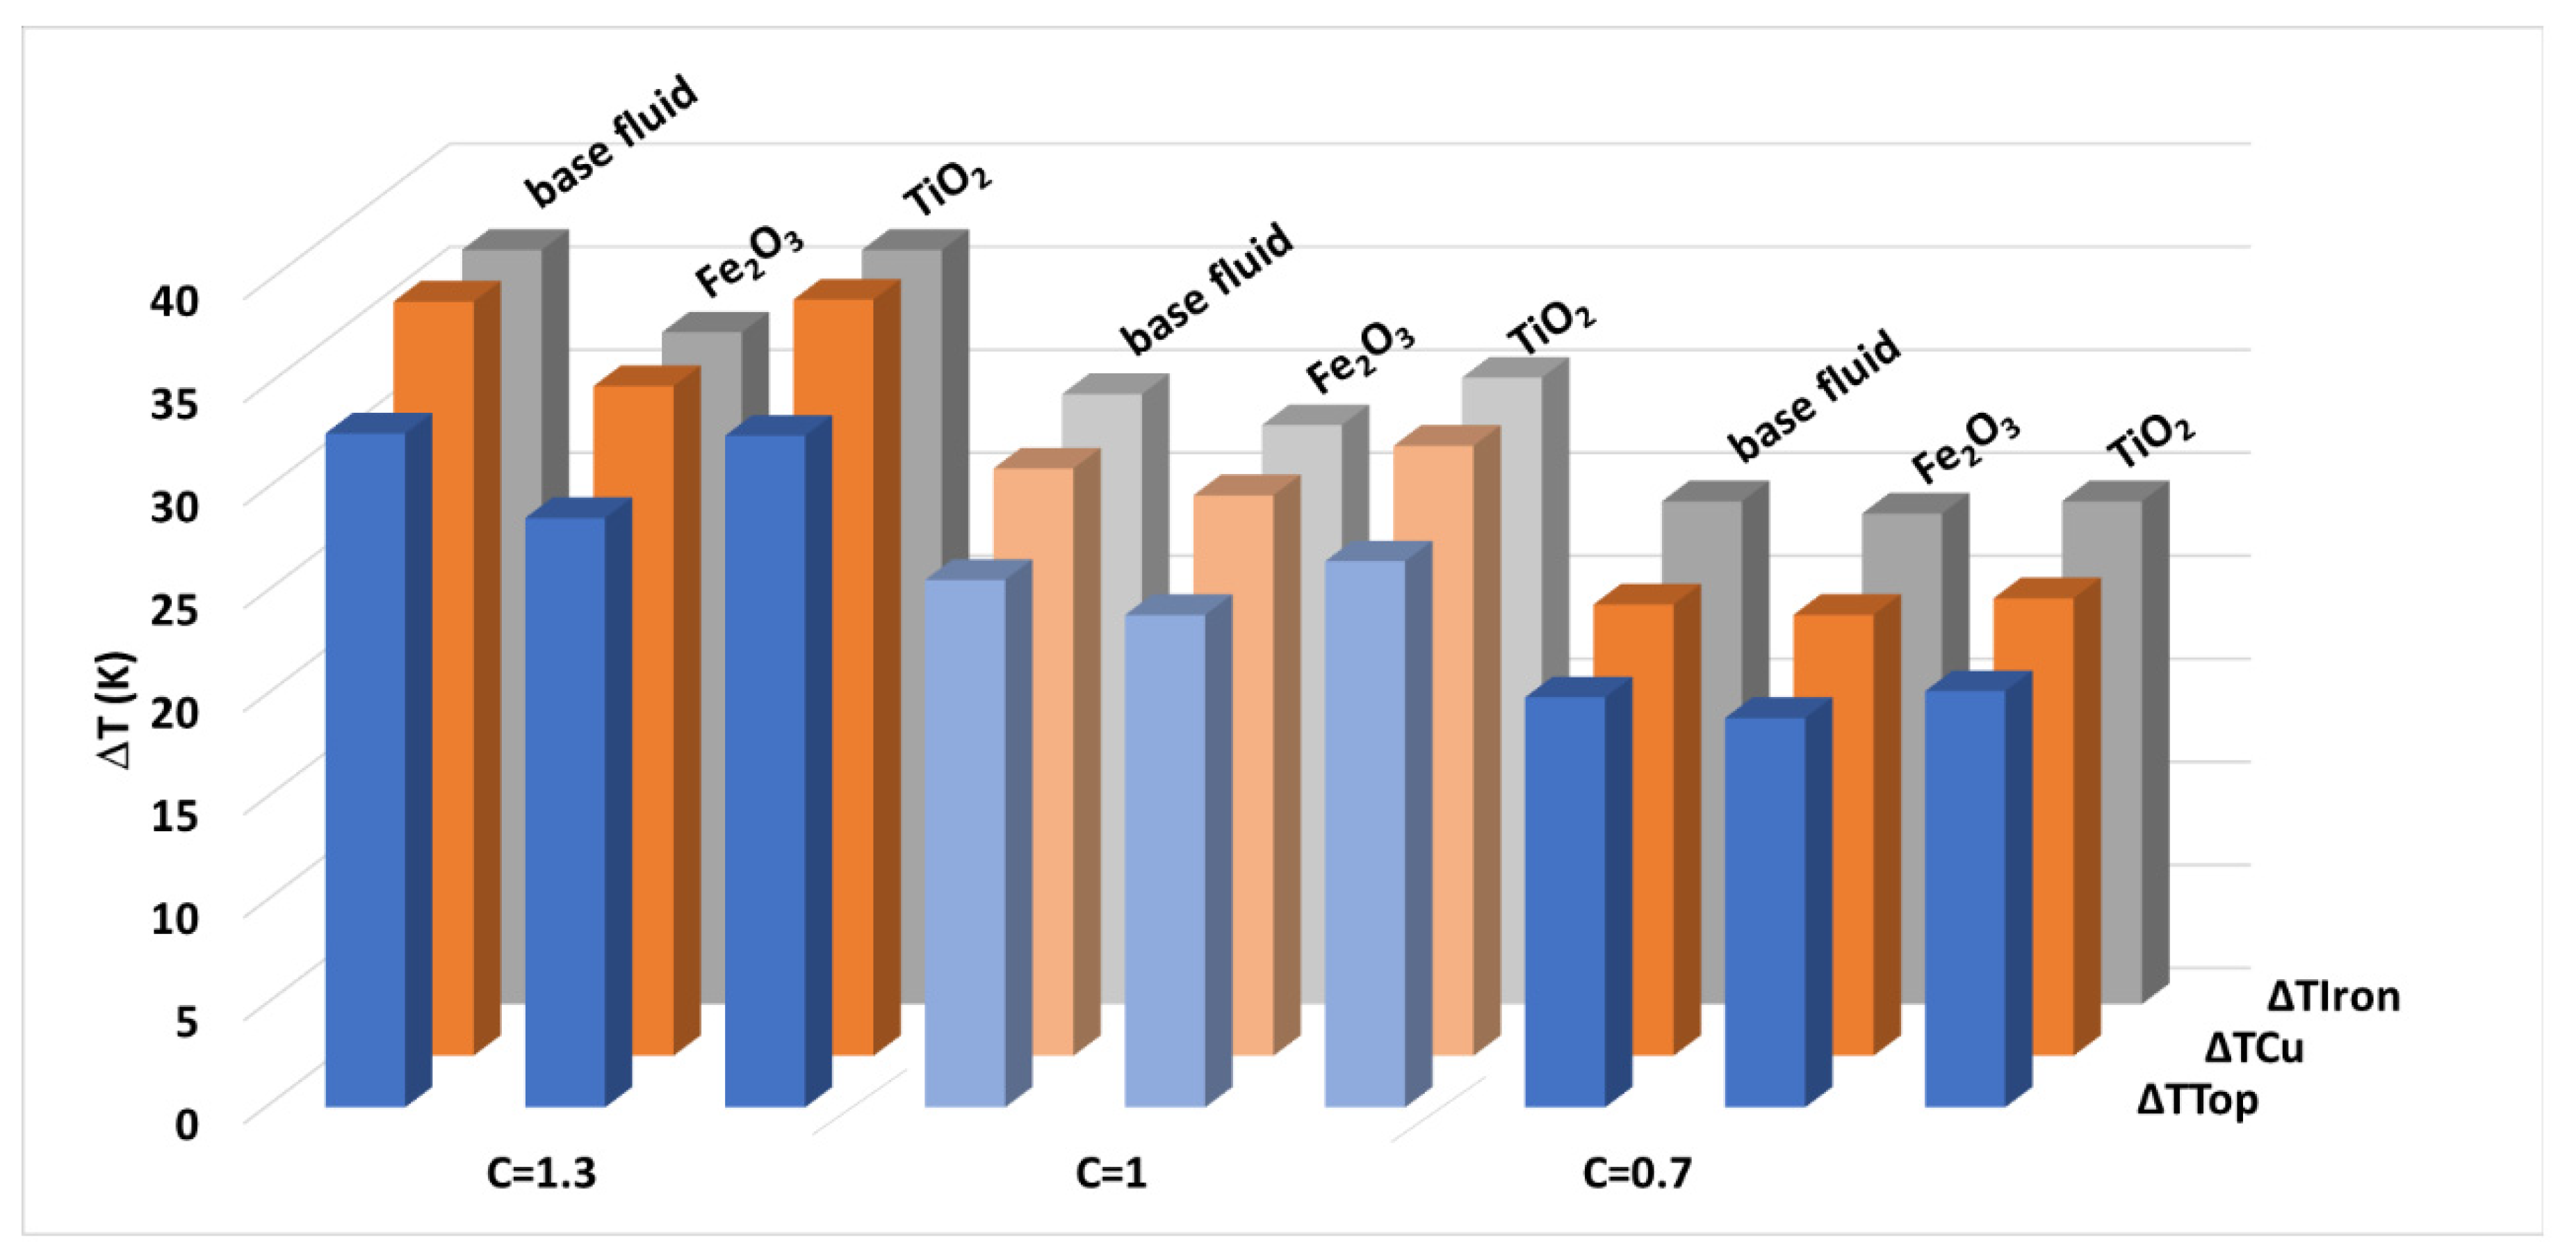
3.2. Nanofluid Cooling Tests
4. Discussion
5. Conclusions
Author Contributions
Funding
Conflicts of Interest
References
- Courtois, J.D.; Bazán, I.; Vera, A.; Leija, L. Temperature increase in magnetic nanoparticles by magnetic field induction for hyperthermia treatment. In Proceedings of the 2019 Global Medical Engineering Physics Exchanges/Pan American Health Care Exchanges, Buenos Aires, Argentina, 26–31 March 2019; pp. 1–6. [Google Scholar]
- Gökçe, M.; Alemdar, A.; İşçi, S. Comparison of ionic polymers in the targeted drug delivery applications as the coating materials on the Fe3O4 nanoparticles. Mater. Sci. Eng. C 2019, 103, 109838. [Google Scholar]
- Nikbin, I.M.; Mohebbi, R.; Dezhampanah, S.; Mehdipour, S.; Mohammadi, R.; Nejat, T. Gamma ray shielding properties of heavy-weight concrete containing Nano-TiO2. Radiat. Phys. Chem. 2019, 162, 157–167. [Google Scholar] [CrossRef]
- Mamidi, N.; Renato, M.; Gamero, M.; Villela, J.; Elías, A. Development of ultra-high molecular weight polyethylene-functionalized carbon nano-onions composites for biomedical applications. Diam. Relat. Mater. 2019, 97, 107435. [Google Scholar] [CrossRef]
- Moradikazerouni, A.; Hajizadeh, A.; Safaei, M.R.; Afrand, M.; Yarmand, H.; Zulkifli, N.W.B.M. Assessment of thermal conductivity enhancement of nano-antifreeze containing single-walled carbon nanotubes: Optimal artificial neural network and curve-fitting. Phys. A 2019, 521, 138–145. [Google Scholar] [CrossRef]
- Mahdi, S.; Sahebi, H.; Zandavar, H.; Mirsadeghi, S. Fabrication of Fe3O4 nanoparticles coated by extracted shrimp peels chitosan as sustainable adsorbents for removal of chromium contaminates from wastewater: The design of experiment. Compos. Part B 2019, 175, 107130. [Google Scholar]
- Wang, L.; Liu, N.; Zhao, Y. Nanoporous TiO2/MoO2/Fe3O4 composite as anode for high-performance lithium-ion batteries. Solid State Sci. 2019, 95, 105930. [Google Scholar] [CrossRef]
- Sheikholeslami, M.; Haq, R.U.; Shafee, A.; Li, Z.; Elaraki, Y.G.; Tlili, I. Heat transfer simulation of heat storage unit with nanoparticles and fins through a heat exchanger. Int. J. Heat Mass Transf. 2019, 135, 470–478. [Google Scholar] [CrossRef]
- Kadirgama, K.; Anamalai, K.; Ramachandran, K.; Ramasamy, D.; Samykano, M.; Kottasamy, A.L.; Rahman, M.M. Thermal analysis of SUS 304 stainless steel using ethylene glycol/nanocellulose-based nanofluid coolant. Int. J. Adv. Manuf. Technol. 2018, 97, 2061–2076. [Google Scholar] [CrossRef]
- Sarafraz, M.M.; Safaei, M.R.; Tian, Z.; Goodarzi, M.; Pedone Bandarra Filho, E.; Arjomandi, M. Thermal assessment of nano-particulate graphene-water/ethylene glycol (WEG 60:40) nano-suspension in a compact heat exchanger M. Energies 2019, 12, 1929. [Google Scholar] [CrossRef]
- Kim, D.; Kwon, Y.; Cho, Y.; Li, C.; Cheong, S.; Hwang, Y.; Lee, J.; Hong, D.; Moon, S. Convective heat transfer characteristics of nanofluids under laminar and turbulent flow conditions. Curr. Appl. Phys. 2009, 9, e119–e123. [Google Scholar] [CrossRef]
- Nguyen, C.T.; Roy, G.; Gauthier, C.; Galanis, N. Heat transfer enhancement using Al2O3-water nanofluid for an electronic liquid cooling system. Appl. Therm. Eng. 2007, 27, 1501–1506. [Google Scholar] [CrossRef]
- Jamalabadi, M.Y.A.; Ghasemi, M.; Alamian, R.; Wongwises, S.; Afrand, M.; Shadloo, M.S. Modeling of subcooled flow boiling with nanoparticles under the influence of a magnetic field. Symmetry 2019, 11, 1275. [Google Scholar] [CrossRef]
- Chiesa, M.; Das, S.K. Experimental investigation of the dielectric and cooling performance of colloidal suspensions in insulating media. Coll. Surf. A Physicochem. Eng. Asp. 2009, 335, 88–97. [Google Scholar] [CrossRef]
- Choi, C.; Yoo, H.S.; Oh, J.M. Preparation and heat transfer properties of nanoparticle-in-transformer oil dispersions as advanced energy-efficient coolants. Curr. Appl. Phys. 2008, 8, 710–712. [Google Scholar] [CrossRef]
- Xie, H.; Wang, J.; Xi, T.; Liu, Y.; Ai, F. Dependence of the thermal conductivity on nanoparticle-fluid mixture on the base fluid. J. Mater. Sci. Lett. 2002, 21, 1469–1471. [Google Scholar] [CrossRef]
- Jin, H.; Andritsch, T.; Tsekmes, I.A.; Kochetov, R.; Morshuis, P.H.F.; Smit, J.J. Thermal conductivity of fullerene and TiO2 nanofluids. In Proceedings of the IEEE Conference on Electrical Insulation and Dielectric Phenomena (CEIDP), Shenzhen, China, 20–23 October 2013; pp. 711–714. [Google Scholar]
- Lv, Y.; Li, C.; Sun, Q.; Huang, M.; Li, C.; Qi, B. Effect of dispersion method on stability and dielectric strength of transformer oil-based TiO2 nanofluids. Nanoscale Res. Lett. 2016, 11, 4–9. [Google Scholar] [CrossRef]
- Nkurikiyimfura, I.; Wang, Y.; Pan, Z. Effect of chain-like magnetite nanoparticle aggregates on thermal conductivity of magnetic nanofluid in magnetic field. Exp. Therm. Fluid Sci. 2013, 44, 607–612. [Google Scholar] [CrossRef]
- Peppas, G.D.; Bakandritsos, A.; Charalampakos, V.P.; Pyrgioti, E.C.; Tucek, J.; Zboril, R.; Gonos, I.F. Ultrastable natural ester-based nano fluids for high voltage insulation applications. ACS Appl. Mater. Interfaces 2016, 8, 25202–25209. [Google Scholar] [CrossRef]
- Hanai, M.; Hosomi, S.; Kojima, H.; Hayakawa, N.; Okubo, H. Dependence of TiO2 and ZnO nanoparticle concentration on electrical insulation characteristics of insulating oil. In Proceedings of the IEEE Conference on Electrical Insulation and Dielectric Phenomena (CEIDP), Shenzhen, China, 20–23 October 2013; pp. 780–783. [Google Scholar]
- Muangpratoom, P.; Pattanadech, N. Breakdown and partial discharge characteristics of mineral oil-based nanofluids. IET Sci. Meas. Technol. 2018, 15, 609–616. [Google Scholar] [CrossRef]
- Irwanto; Azcarraga, C.G.; Suwarno; Cavallini, A.; Negri, F. Ferrofluid effect in mineral oil: PDIV, streamer, and breakdown voltage. In Proceedings of the IEEE International Conference on High Voltage Engineering and Application (ICHVE), Poznan, Poland, 8–11 September 2014; pp. 3–6. [Google Scholar]
- Rafiq, M.; Li, C.; Ge, Y.; Lv, Y.; Yi, K. Effect of Fe3O4 nanoparticle concentrations on dielectric property of transformer oil. In Proceedings of the IEEE international conference on high voltage engineering and application (ICHVE), Chengdu, China, 19–22 September 2016; pp. 1–4. [Google Scholar]
- Primo, V.A.; Pérez-Rosa, D.; García, B.; Cabanelas, J.C. Evaluation of the stability of dielectric nanofluids for use in transformers under real operating conditions. Nanomaterials 2019, 9, 143. [Google Scholar] [CrossRef]
- Primo, V.A.; Garcia, B.; Albarracin, R. Improvement of transformer liquid insulation using nanodielectric fluids: A review. IEEE Electr. Insul. Mag. 2018, 34, 13–26. [Google Scholar] [CrossRef]
- Ahmad, F.; Khan, A.A.; Khan, Q.; Hussain, M.R. State-of-art in nano-based dielectric oil: A review. IEEE Access 2019, 7, 13396–13410. [Google Scholar] [CrossRef]
- Patil, M.S.; Seo, J.H.; Kang, S.J.; Lee, M.Y. Review on synthesis, thermo-physical property, and heat transfer mechanism of nanofluids. Energies 2016, 9, 840. [Google Scholar] [CrossRef]
- Olmo, C.; Mendez, C.; Ortiz, F.; Delgado, F.; Valiente, R.; Werle, P. Maghemite nanofluid based on natural ester: Cooling and insulation properties assessment. IEEE Access 2019, 7, 145851–145860. [Google Scholar] [CrossRef]
- Nazari, M.; Rasoulifard, M.H.; Hosseini, H. Dielectric breakdown strength of magnetic nanofluid based on insulation oil after impulse test. J. Magn. Magn. Mater. 2016, 399, 1–4. [Google Scholar] [CrossRef]
- IEC. Insulating Liquids—Determination of the Breakdown Voltage at Power Frequency—Test Method; IEC 60156:2018; 61010-1© IEC2001; IEC: Geneva, Switzerland, 2018; Volume 2006, p. 41. [Google Scholar]
- IEC. Insulating liquids—Measurement of relative Permittivity, Dielectric Dissipation Factor (tan d) and d.c. Resistivity; IEC 60247:2004; IEC: Geneva, Switzerland, 2014. [Google Scholar]
- IEC. Insulating Liquids—Oil-impregnated Paper and Pressboard—Determination of Water by Automatic Coulometric Karl Fischer Titration; IEC 60814:1997; IEC: Geneva, Switzerland, 1997; p. 43. [Google Scholar]
- Patel, J.; Parekh, K.; Upadhyay, R.V. Prevention of hot spot temperature in a distribution transformer using magnetic fluid as a coolant. Int. J. Therm. Sci. 2016, 103, 35–40. [Google Scholar] [CrossRef]
- Ortiz, A.; Delgado, F.; Ortiz, F.; Fernández, I.; Santisteban, A. The aging impact on the cooling capacity of a natural ester used in power transformers. Appl. Therm. Eng. 2018, 144, 797–803. [Google Scholar] [CrossRef]
- Dhar, P.; Katiyar, A.; Maganti, L.S.; Pattamatta, A.; Das, S.K. Superior dielectric breakdown strength of graphene and carbon nanotube infused nano-oils. IEEE Trans. Dielectr. Electr. Insul. 2016, 23, 943–956. [Google Scholar] [CrossRef]
- Bakrutheen, M.; Karthik, R.; Madavan, R. Investigation of critical parameters of insulating mineral oil using semiconductive nanoparticles. In Proceedings of the International Conference on Circuits, Power and Computing Technologies (ICCPCT), Nagercoil, India, 21–22 March 2013; pp. 294–299. [Google Scholar]
- Zhong, Y.; Lv, Y.; Li, C.; Du, Y.; Chen, M.; Zhang, S.; Zhou, Y.; Chen, L. Insulating properties and charge characteristics of natural ester fluid modified by TiO2 semiconductive nanoparticles. IEEE Trans. Dielectr. Electr. Insul. 2013, 20, 135. [Google Scholar] [CrossRef]
- Atiya, E.G.; Mansour, D.E.A.; Khattab, R.M.; Azmy, A.M. Dispersion behavior and breakdown strength of transformer oil filled with TiO2 nanoparticles. IEEE Trans. Dielectr. Electr. Insul. 2015, 22, 2463–2472. [Google Scholar] [CrossRef]
- Jin, H.; Andritsch, T.; Morshuis, P.H.F.; Smit, J.J. AC breakdown voltage and viscosity of mineral oil based SiO2 nanofluids. In Proceedings of the IEEE Conference on Electrical Insulation and Dielectric Phenomena (CEIDP), Montreal, QC, Canada, 14–17 October 2012; pp. 902–905. [Google Scholar]
- Jin, H.; Andritsch, T.; Morshuis, P.H.F.; Smit, J.J. AC breakdown voltage and viscosity of mineral oil based fullerene nanofluids. In Proceedings of the IEEE Conference on Electrical Insulation and Dielectric Phenomena (CEIDP), Shenzhen, China, 20–23 October 2013; pp. 703–706. [Google Scholar]
- Du, B.; Li, J.; Wang, F.; Yao, W.; Yao, S. Influence of monodisperse Fe3O4 nanoparticle size on electrical properties of vegetable oil-based nanofluids. J. Nanomater. 2015, 2015, 560352. [Google Scholar] [CrossRef]
- Liu, R.; Pettersson, L.A.A.; Auletta, T.; Hjortstam, O. Fundamental research on the application of nano dielectrics to transformers. In Proceedings of the IEEE Conference on Electrical Insulation and Dielectric Phenomena (CEIDP), Cancun, Mexico, 16–19 October 2011; pp. 423–427. [Google Scholar]
- Imani, M.T.; Miethe, J.F.; Werle, P.; Bigall, N.C.; Borsi, H. Engineering of multifunctional nanofluids for insulation systems of high voltage apparatus. In Proceedings of the IEEE Conference on Electrical Insulation and Dielectric Phenomena (CEIDP), Toronto, ON, Canada, 16–19 October 2016; pp. 44–47. [Google Scholar]
- Taha-Tijerina, J.; Narayanan, T.N.; Gao, G.; Rohde, M.; Tsentalovich, D.A.; Pasquali, M.; Ajayan, P.M. Electrically insulating thermal nano-oils using 2D fillers. ACS Nano 2012, 6, 1214–1220. [Google Scholar] [CrossRef] [PubMed]
- Du, B.X.; Li, X.L.; Li, J. Thermal conductivity and dielectric characteristics of transformer oil filled with bn and Fe3O4 nanoparticles. IEEE Trans. Dielectr. Electr. Insul. 2015, 22, 2530–2536. [Google Scholar] [CrossRef]
- Jin, H.; Andritsch, T.; Tsekmes, I.A.; Kochetov, R.; Morshuis, P.H.F.; Smit, J.J. Properties of mineral oil based silica nanofluids. IEEE Trans. Dielectr. Electr. Insul. 2014, 21, 1100–1108. [Google Scholar]
- Pislaru-Danescu, L.; Morega, A.M.; Morega, M.; Stoica, V.; Marinica, O.M.; Nouras, F.; Paduraru, N.; Borbath, I.; Borbath, T. Prototyping a ferrofluid-cooled transformer. IEEE Trans. Ind. Appl. 2013, 49, 1289–1298. [Google Scholar] [CrossRef]


| Density (283 K) (kg/m3) | 910 |
| Dynamic viscosity (313 K)(Pa·s) | <0.0455 |
| Thermal conductivity (298 K)(W/K·m) | 0.1691 |
| Dissipation factor (Tan δ) | <0.05 |
| AC Breakdown Voltage (kV) | >35 |
| Tester | Property | Measurement Range | Measurement Precision |
|---|---|---|---|
| Baur DPA 75 | Breakdown voltage | 0–75 kV | 1 kV |
| Baur DTL 2a | Tan δ | 0.00001–4.910 | 0.0001–0.0491 |
| Resistivity | 2.5 MΩ·m–20 TΩ·m | 0.075 MΩ·m–0.6 TΩ·m | |
| KD2 pro | Thermal Conductivity | 0.02–0.2 W/m·K | 0.01 W/m·K |
| Haake 550 | Dynamic viscosity | 0.02–7 Pa·s | 0.0001–0.035 Pa·s |
| Overload C = 1.3; P = 1040 W | |
| Primary winding | Secondary winding |
| Ip = 9 A Vp = 115 V | Is = 4.5 A Vs = 230 V Req.s = 51.11 Ω |
| Rated power C = 1; P = 800 W | |
| Primary winding | Secondary winding |
| Ip = 6.96 A Vp = 115 V | Is = 3.48 A Vs = 230 V Req.s = 65.71 Ω |
| Underload C = 0.7; P = 560 W | |
| Primary winding | Secondary winding |
| Ip = 4.87 A Vp = 115 V | Is = 2.43 A Vs = 230 V Req.s = 94.46 Ω |
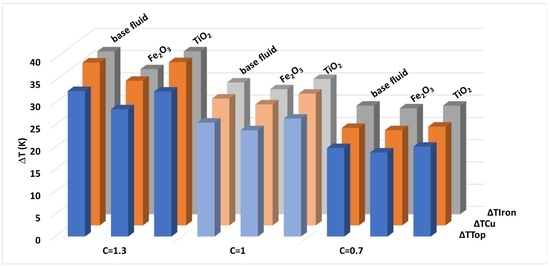
| C | Fluid | ΔTTop | ΔTCu | ΔTIron |
|---|---|---|---|---|
| 1.3 | Base fluid | 32.7 | 36.6 | 36.6 |
| 0.5 kg/m3 Nanofluid | 32.6 | 36.7 | 36.6 | |
| 1 | Base fluid | 25.6 | 28.5 | 29.6 |
| 0.5 kg/m3 Nanofluid | 26.5 | 29.6 | 30.4 | |
| 0.7 | Base fluid | 19.9 | 21.9 | 24.4 |
| 0.5 kg/m3 Nanofluid | 20.2 | 22.2 | 24.4 |
© 2020 by the authors. Licensee MDPI, Basel, Switzerland. This article is an open access article distributed under the terms and conditions of the Creative Commons Attribution (CC BY) license (http://creativecommons.org/licenses/by/4.0/).
Share and Cite
Olmo, C.; Méndez, C.; Ortiz, F.; Delgado, F.; Ortiz, A. Titania Nanofluids Based on Natural Ester: Cooling and Insulation Properties Assessment. Nanomaterials 2020, 10, 603. https://doi.org/10.3390/nano10040603
Olmo C, Méndez C, Ortiz F, Delgado F, Ortiz A. Titania Nanofluids Based on Natural Ester: Cooling and Insulation Properties Assessment. Nanomaterials. 2020; 10(4):603. https://doi.org/10.3390/nano10040603
Chicago/Turabian StyleOlmo, Cristian, Cristina Méndez, Félix Ortiz, Fernando Delgado, and Alfredo Ortiz. 2020. "Titania Nanofluids Based on Natural Ester: Cooling and Insulation Properties Assessment" Nanomaterials 10, no. 4: 603. https://doi.org/10.3390/nano10040603
APA StyleOlmo, C., Méndez, C., Ortiz, F., Delgado, F., & Ortiz, A. (2020). Titania Nanofluids Based on Natural Ester: Cooling and Insulation Properties Assessment. Nanomaterials, 10(4), 603. https://doi.org/10.3390/nano10040603