Specific Features of Reactive Pulsed Laser Deposition of Solid Lubricating Nanocomposite Mo–S–C–H Thin-Film Coatings
Abstract
1. Introduction
2. Materials and Methods
3. Results
3.1. Composition of Mo–S–C–H Films Obtained by RPLD
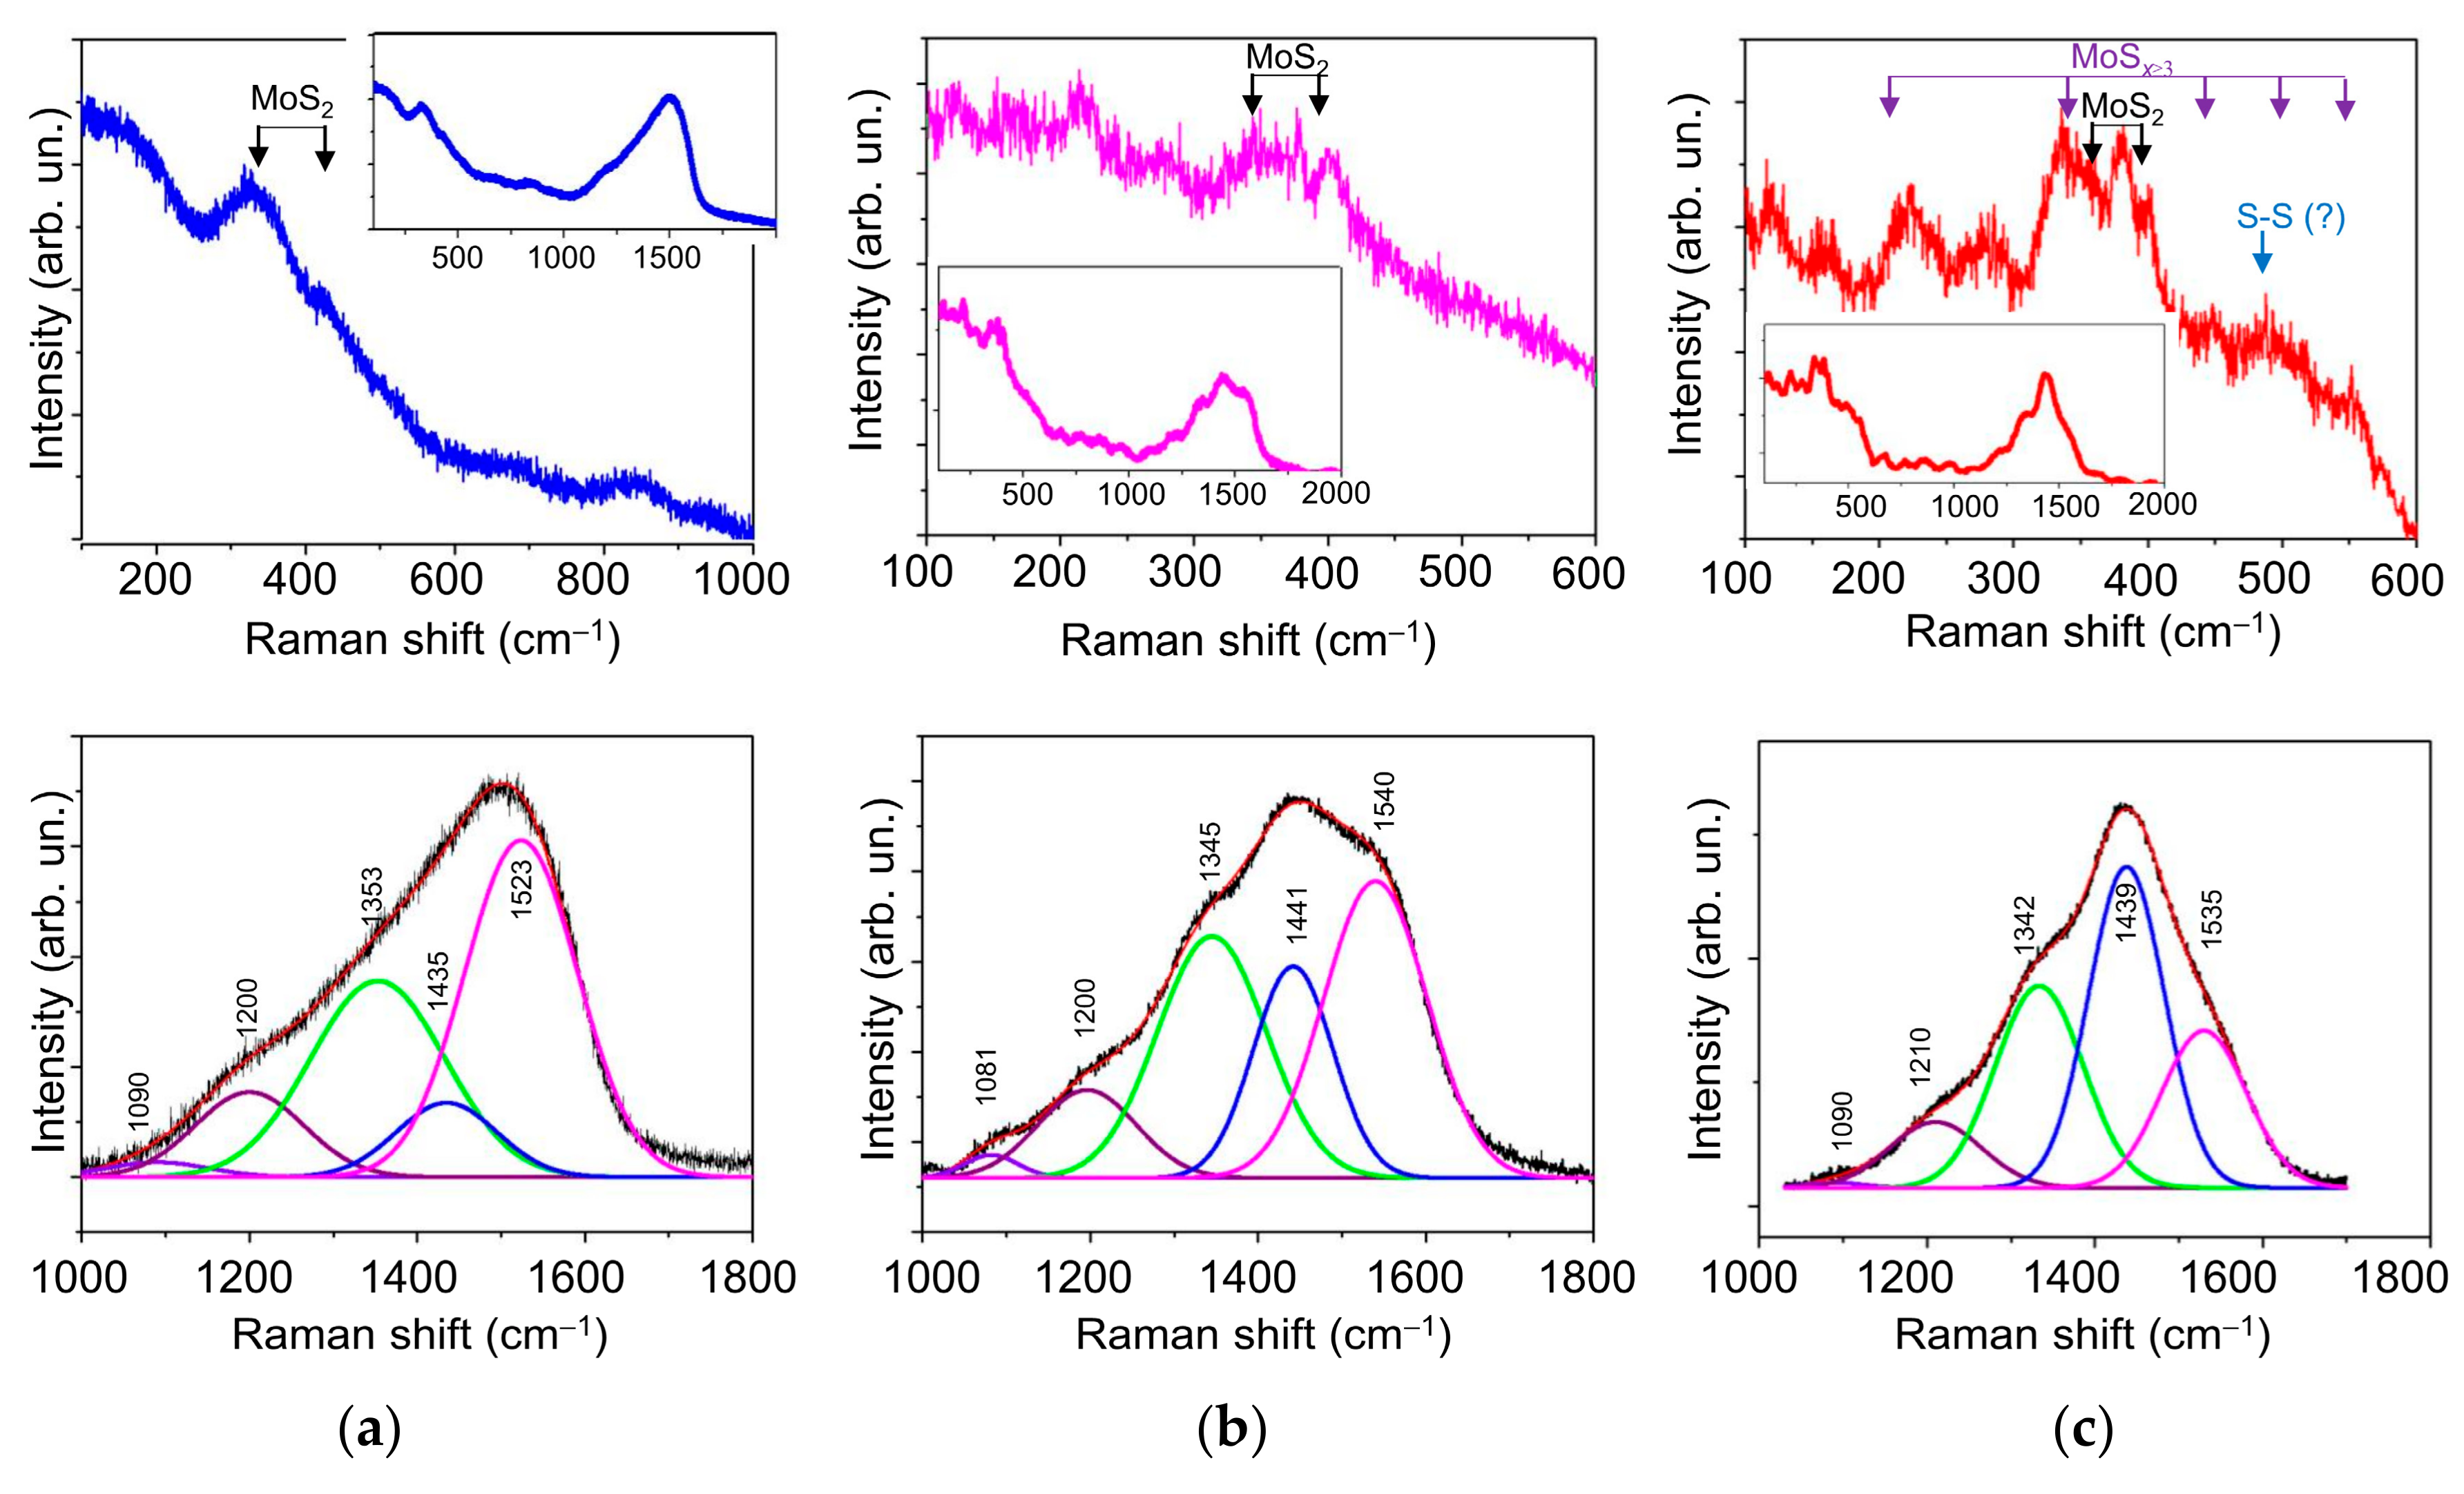
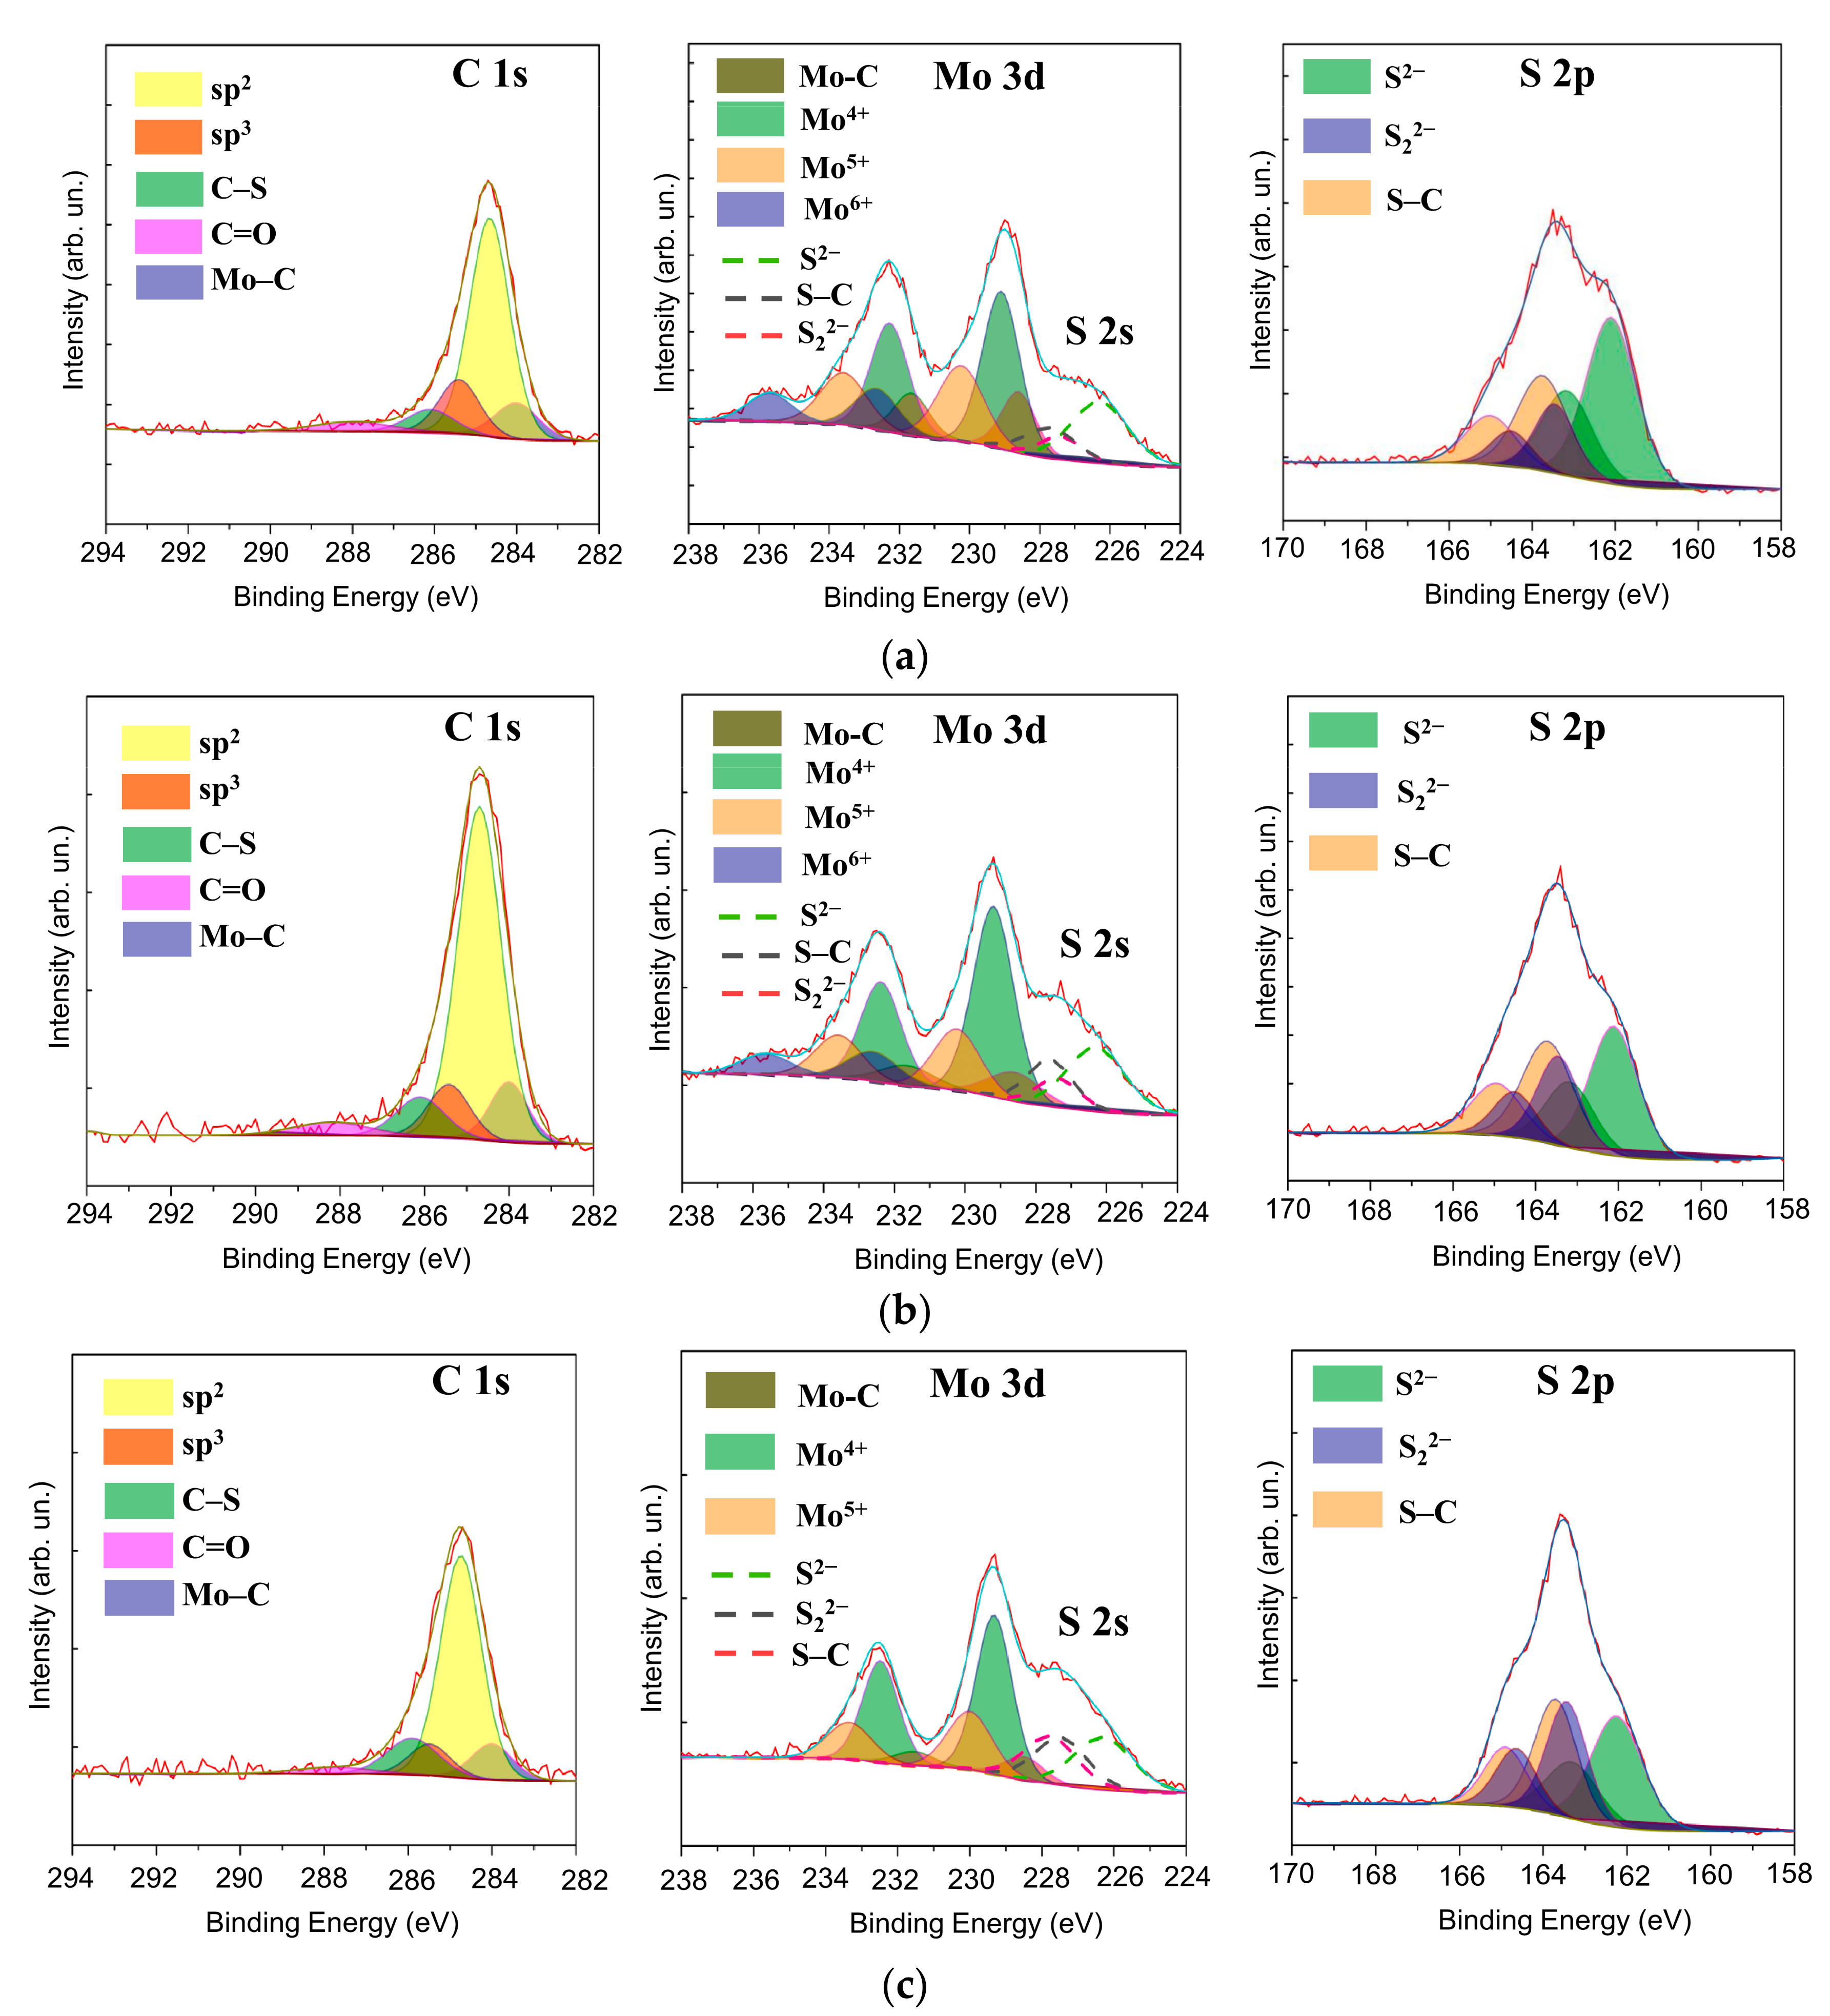
3.2. Morphology, Structure, and Chemical State of Mo–S–C–H Films Obtained by RPLD
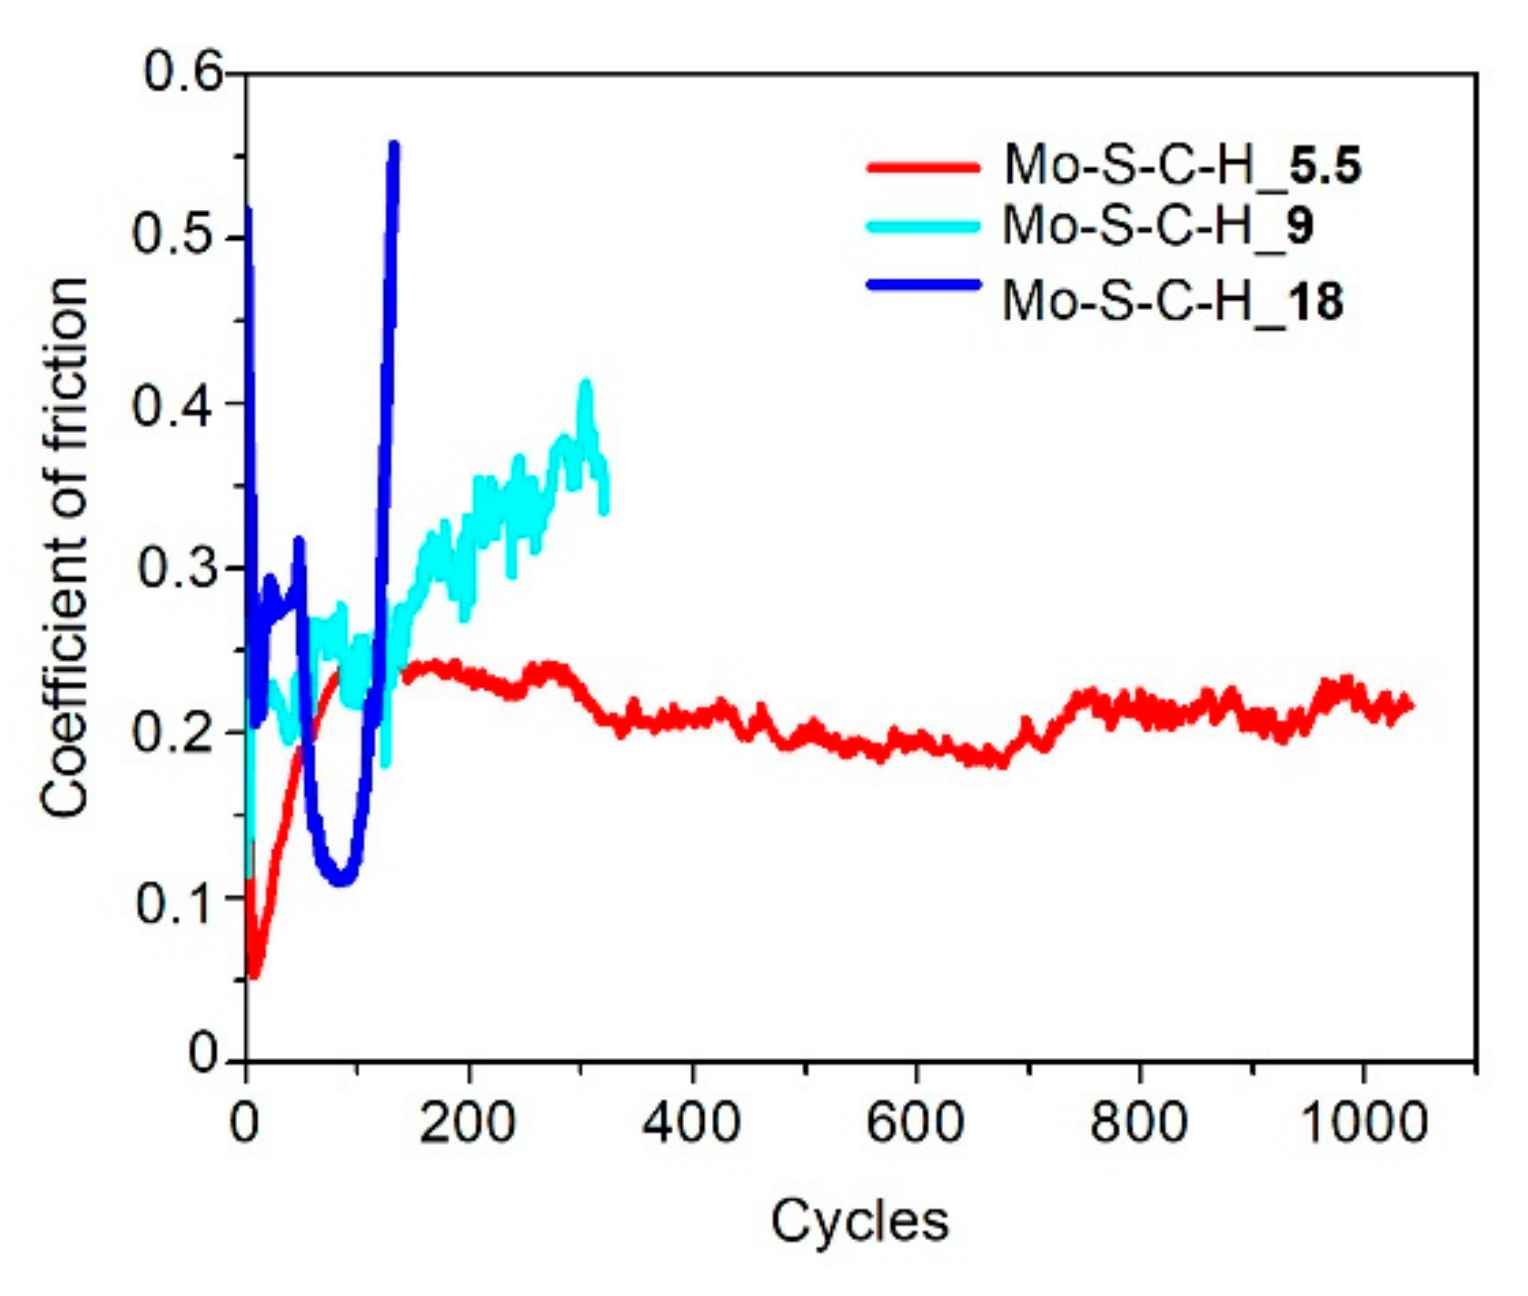
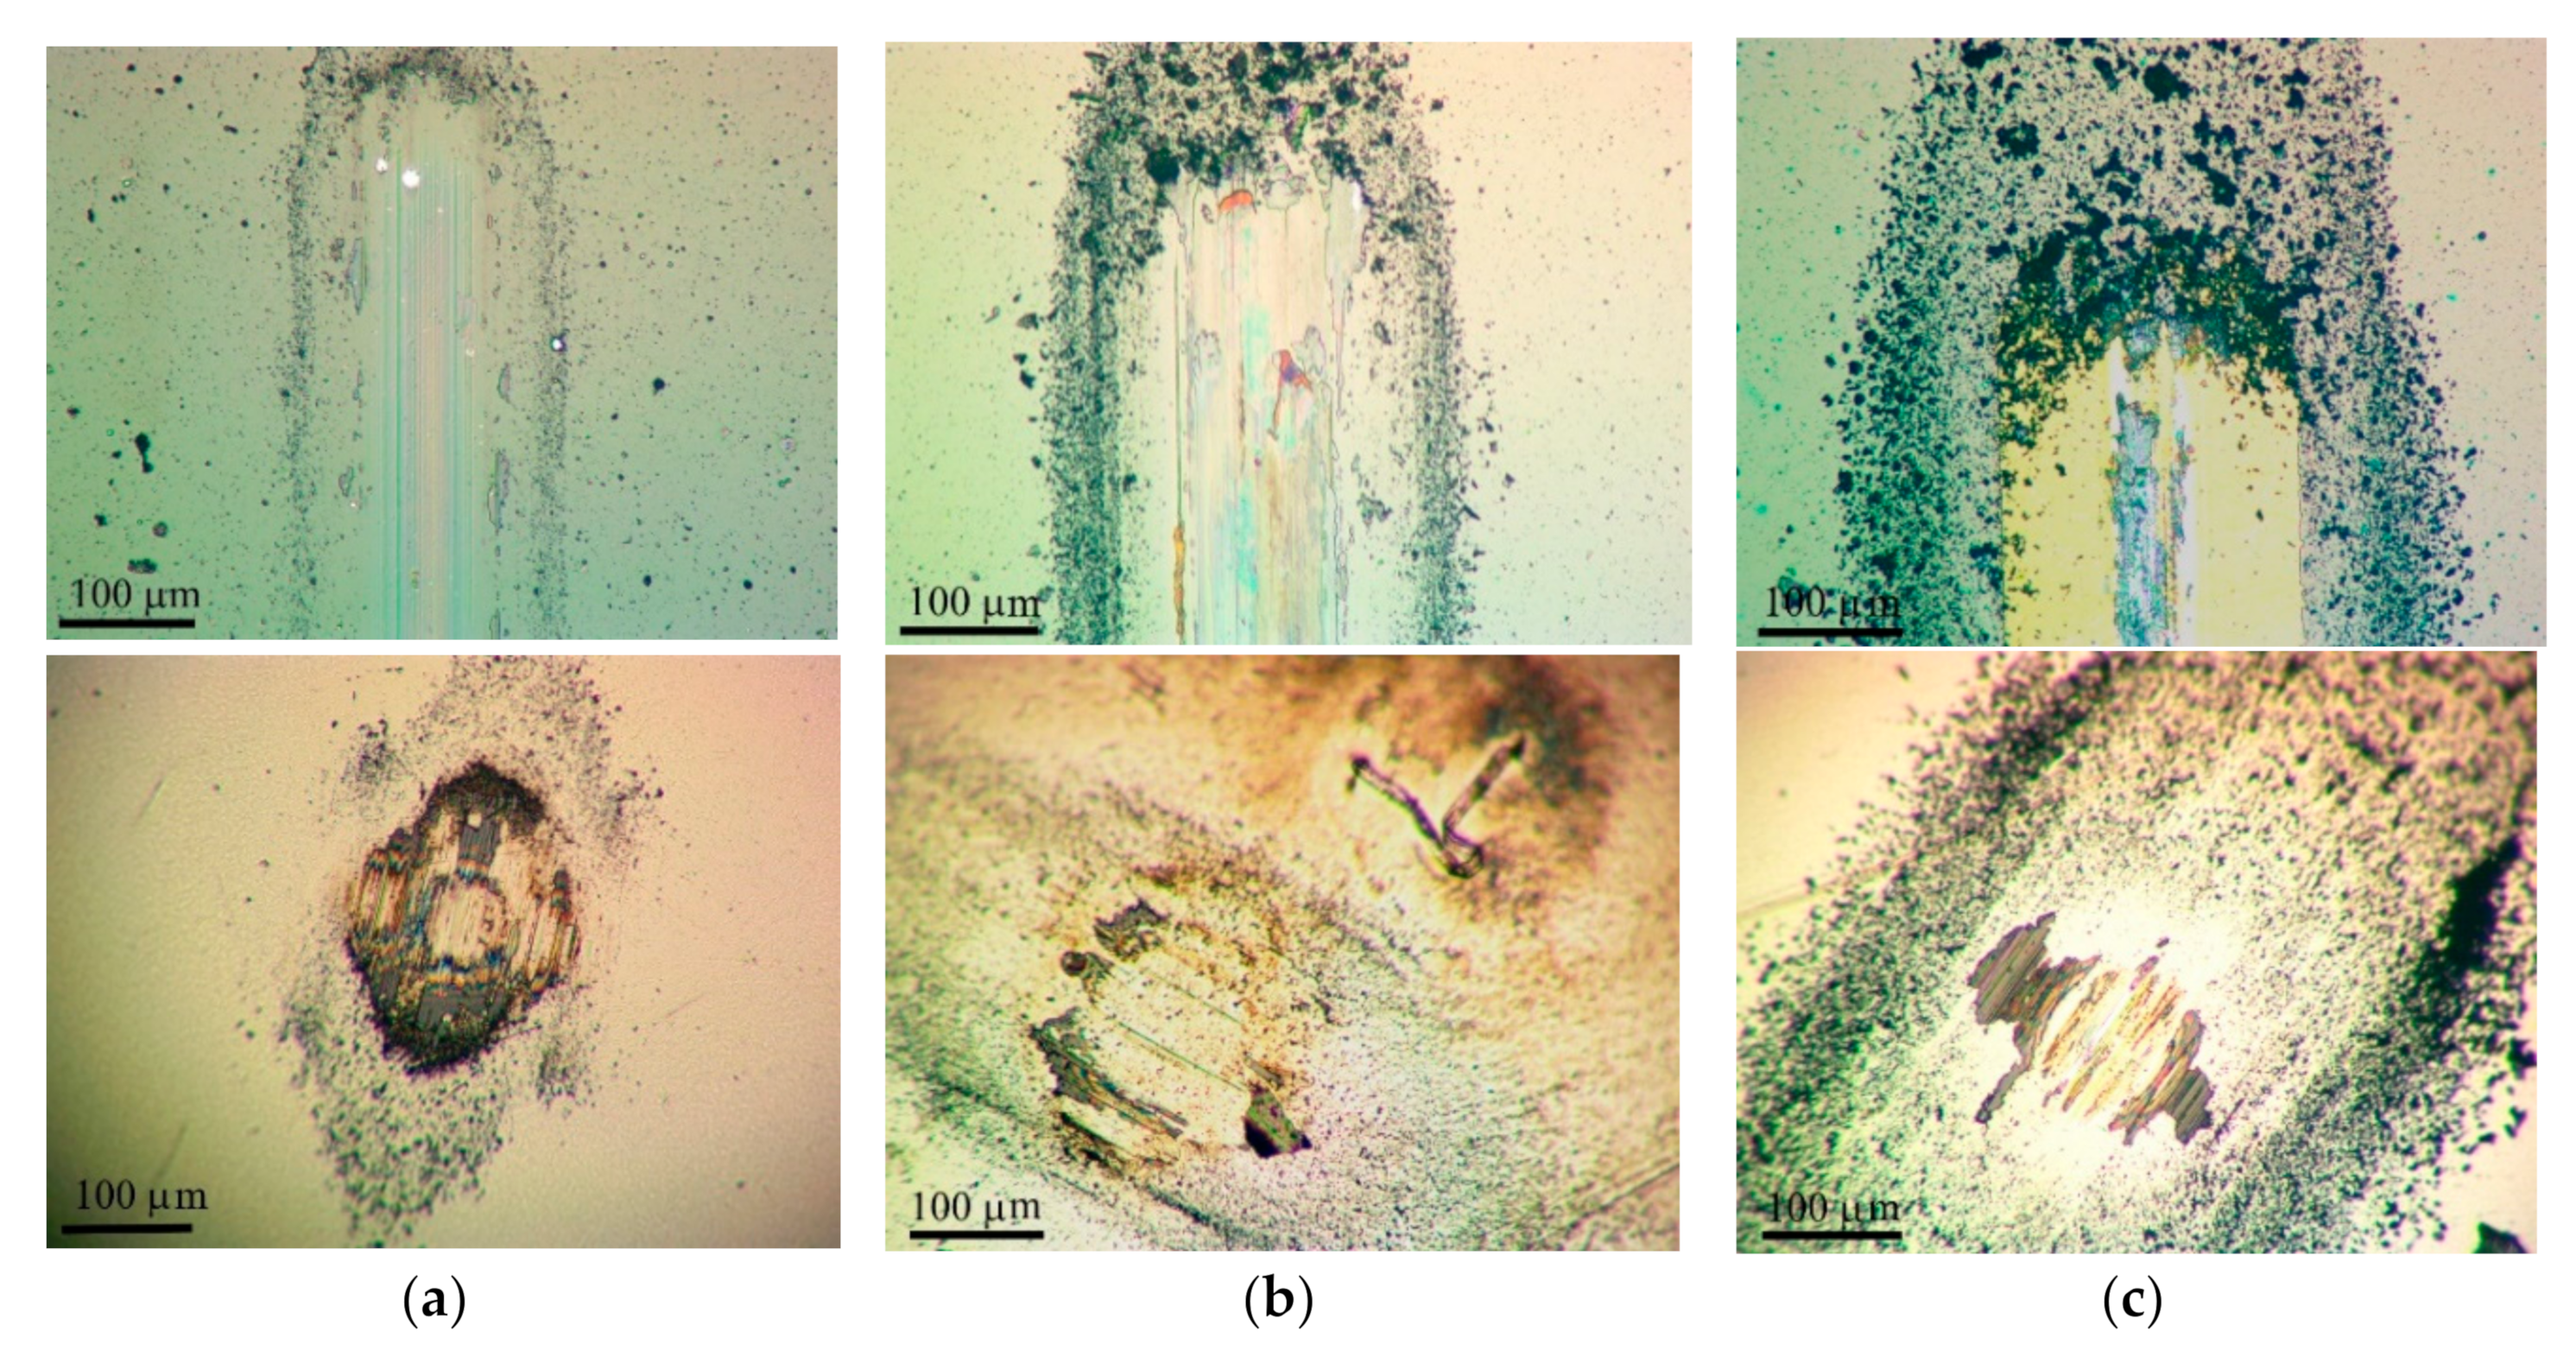
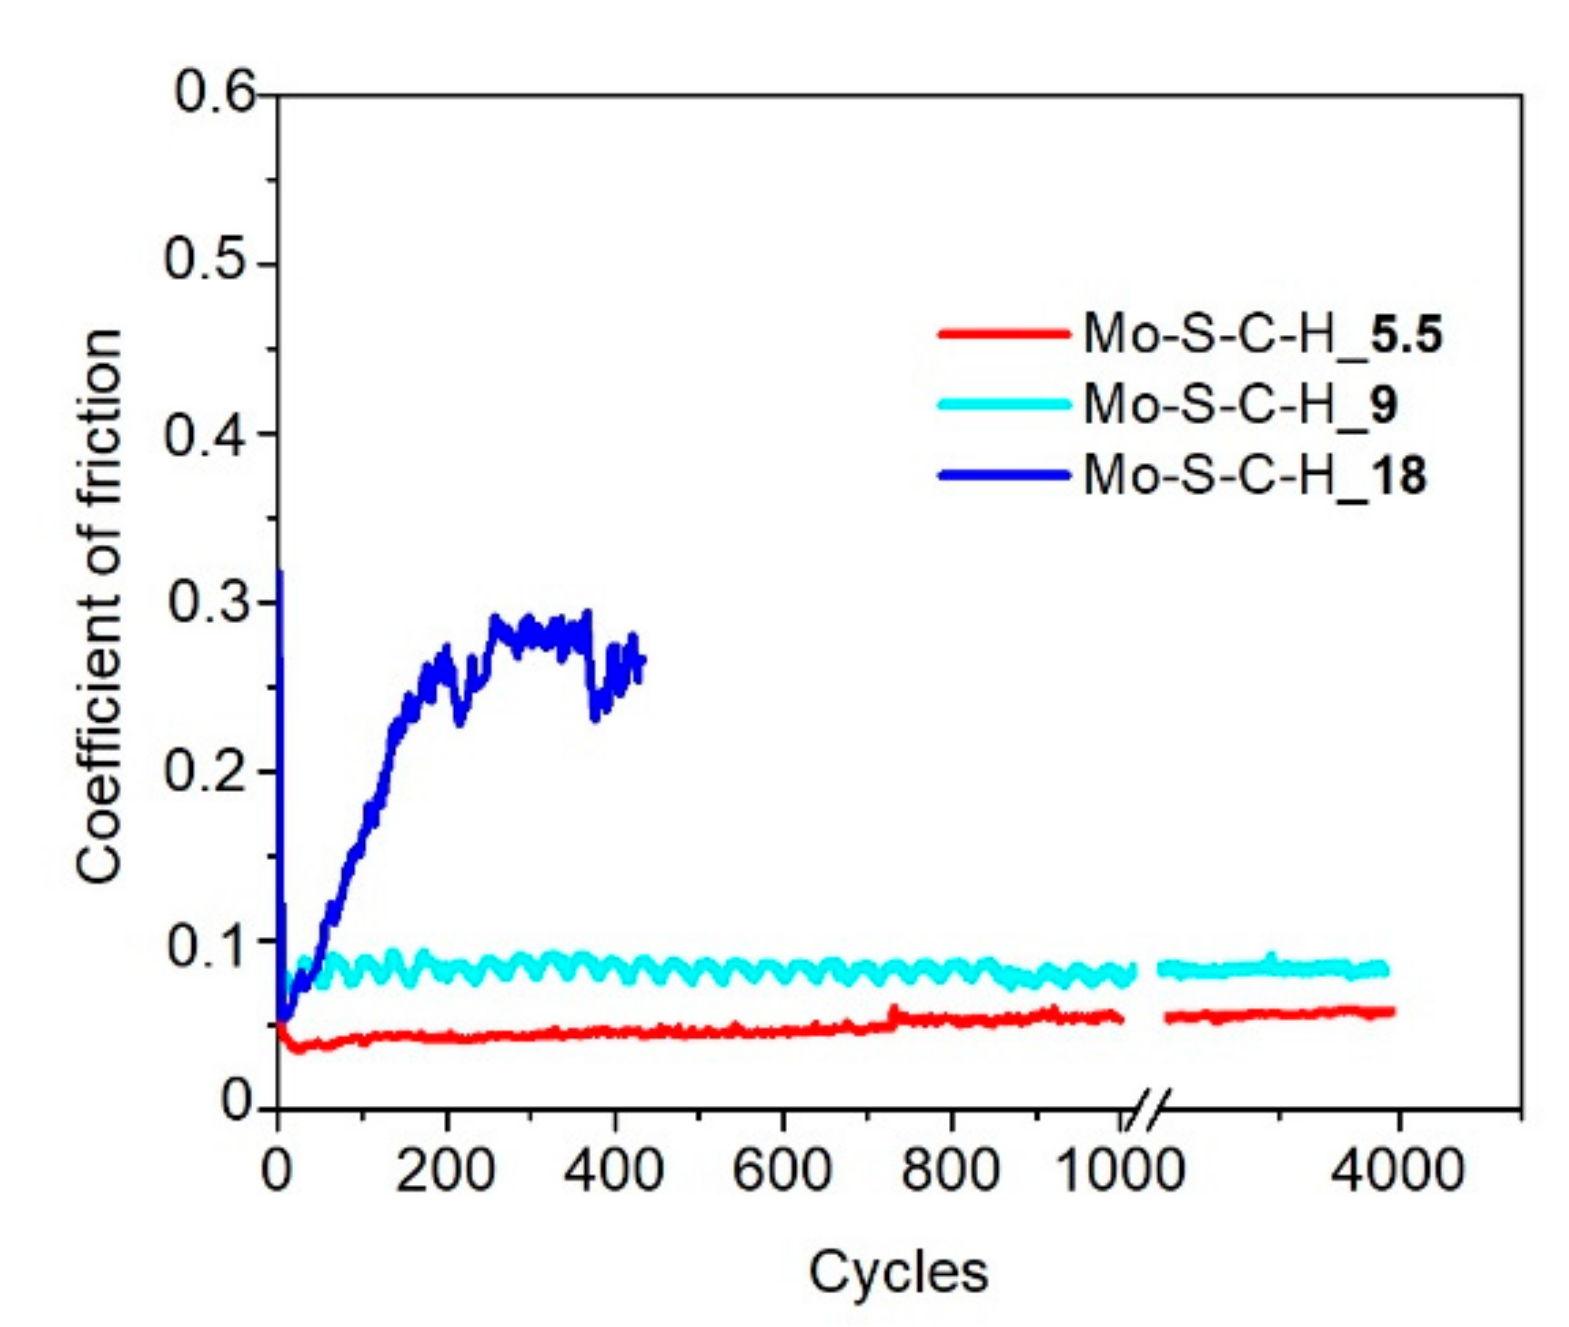
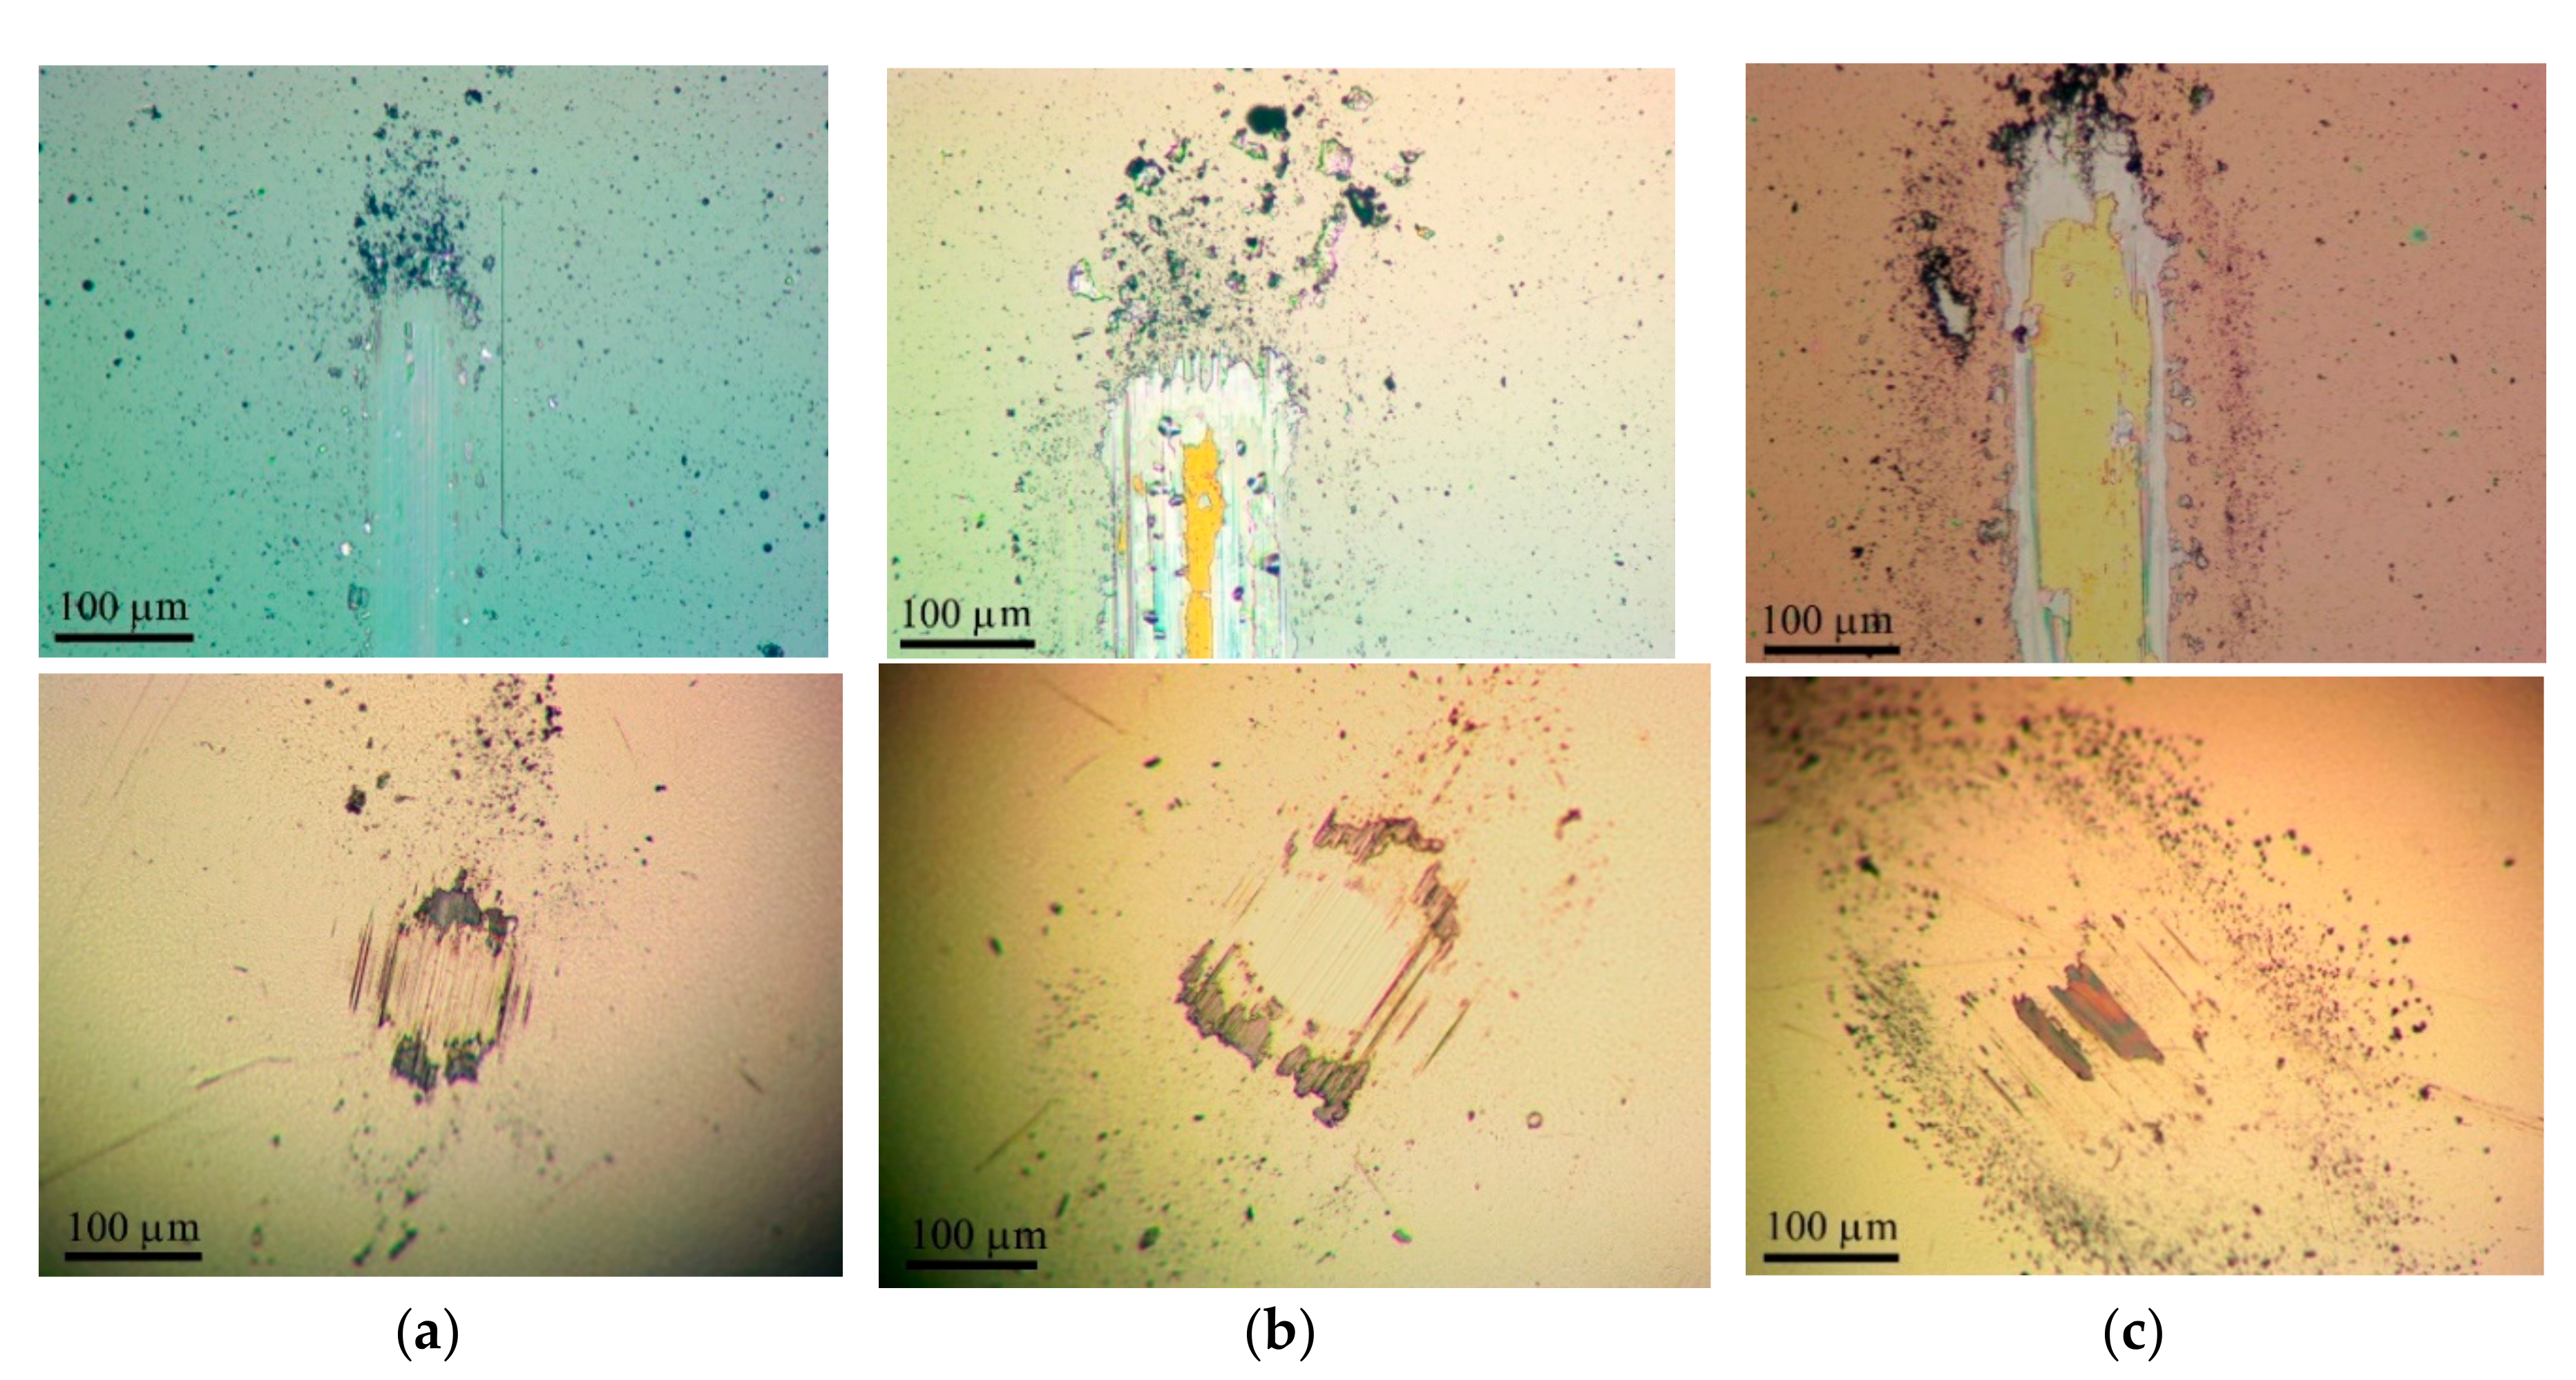
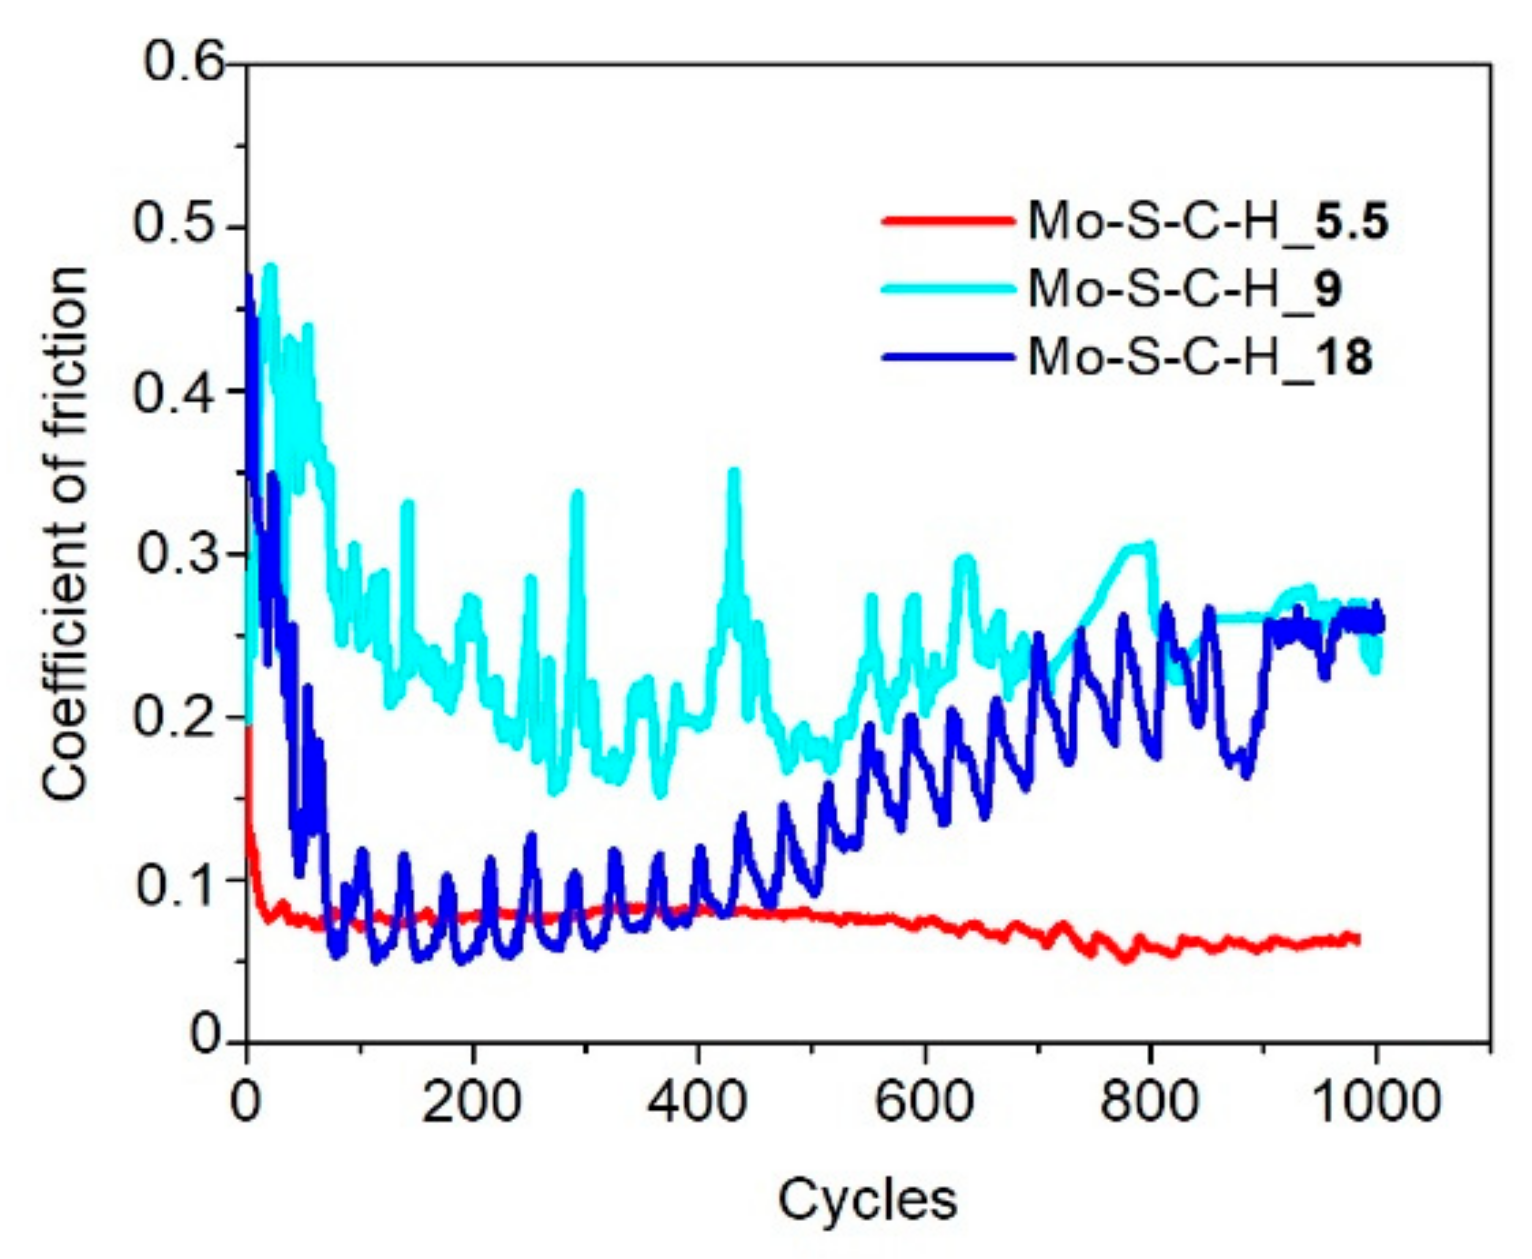
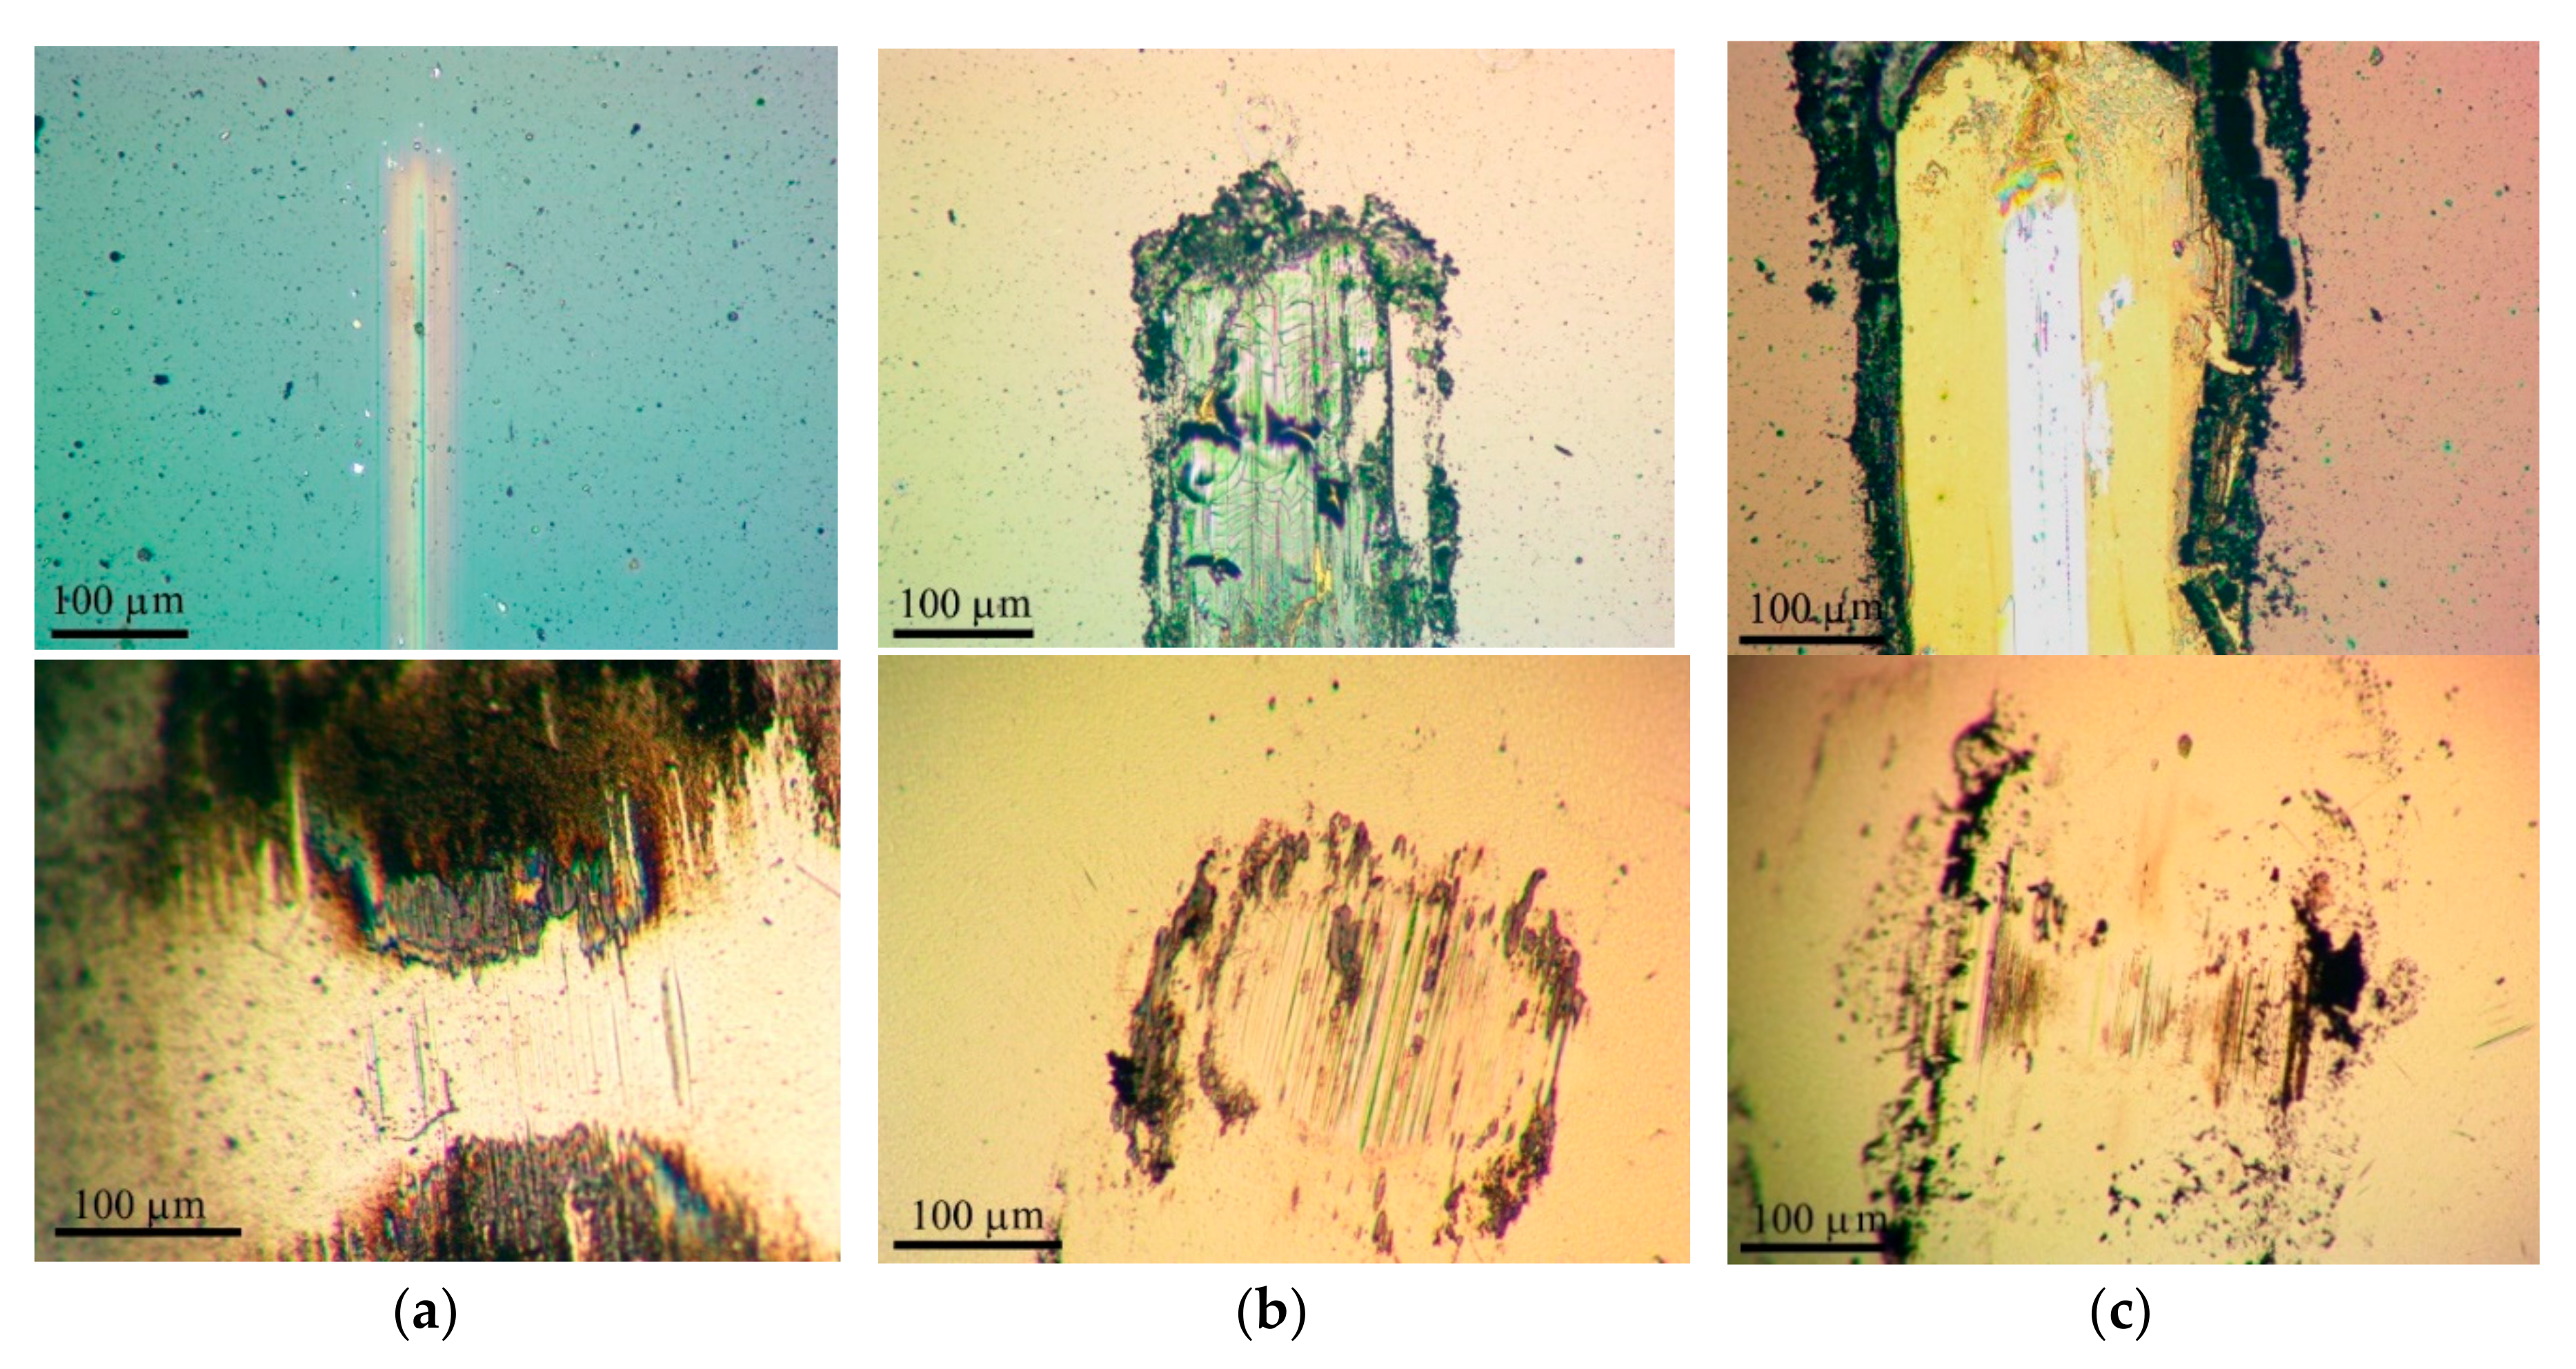
3.3. Tribological Properties of Mo–S–C–H Films Obtained by RPLD
4. Discussion
5. Conclusions
Supplementary Materials
Author Contributions
Funding
Acknowledgments
Conflicts of Interest
References
- Spalvins, T. A review of recent advances in solid film lubrication. J. Vac. Sci. Technol. A 1987, 5, 212–219. [Google Scholar] [CrossRef]
- Fleischauer, P.D. Fundamental aspects of the electronic structure, materials properties and lubrication performance of sputtered MoS2 films. Thin Solid Films 1987, 154, 309–322. [Google Scholar] [CrossRef]
- Müller, C.; Menoud, C.; Mailat, M.; Hintermann, H.E. Thick compact MoS2 coatings. Surf. Coat. Technol. 1988, 36, 351–359. [Google Scholar] [CrossRef]
- Pope, L.E.; Panitz, J.K.G. The effect of hertzian stress and test atmosphere on the friction coefficients of MoS2 coatings. Surf. Coat. Technol. 1988, 36, 341–350. [Google Scholar] [CrossRef]
- Voevodin, A.A.; O’Neill, J.P.; Zabinski, J.S. WC/DLC/WS2 nanocomposite coatings for aerospace tribology. Tribol. Lett. 1999, 6, 75–78. [Google Scholar] [CrossRef]
- Hudec, T.; Mikula, M.; Satrapinskyy, L.; Roch, T.; Truchlý, M.; Jr, P.S.; Huminiuc, T.; Polcar, T. Structure, mechanical and tribological properties of Mo-S-N solid lubricant coatings. Appl. Surf. Sci. 2019, 486, 1–14. [Google Scholar] [CrossRef]
- Gustavsson, F.; Bugnet, M.; Polcar, T.; Cavaleiro, A.; Jacobson, S. A high-resolution TEM/EELS study of the effect of doping elements on the sliding mechanisms of sputtered WS2 coatings. Tribol. Trans. 2015, 58, 113–118. [Google Scholar] [CrossRef]
- Zeng, C.; Pu, J.; Wang, H.; Zheng, S.; Wang, L.; Xue, Q. Study on atmospheric tribology performance of MoS2–W films with self-adaption to temperature. Ceram. Int. 2019, 45, 15834–15842. [Google Scholar] [CrossRef]
- Voevodin, A.A.; Zabinski, J.S. Supertough wear-resistant coatings with ‘chameleon’ surface adaptation. Thin Solid Films 2000, 370, 223–231. [Google Scholar] [CrossRef]
- Mutyala, K.C.; Wu, Y.A.; Erdemir, A.; Sumant, A.V. Graphene-MoS2 ensembles to reduce friction and wear in DLC-Steel contacts. Carbon 2019, 146, 524–527. [Google Scholar] [CrossRef]
- Cho, D.-H.; Jung, J.; Kim, C.; Lee, J.; Oh, S.-D.; Kim, K.S.; Lee, C. Comparison of frictional properties of CVD-Grown MoS2 and graphene films under dry sliding conditions. Nanomaterials 2019, 9, 293. [Google Scholar] [CrossRef] [PubMed]
- Guo, J.; Peng, R.; Du, H.; Shen, Y.; Li, Y.; Li, J.; Dong, G. The application of nano-MoS2 quantum dots as liquid lubricant additive for tribological behavior improvement. Nanomaterials 2020, 10, 200. [Google Scholar] [CrossRef] [PubMed]
- Yaqub, T.B.; Vuchkov, T.; Sanguino, P.; Polcar, T.; Cavaleiro, A. Comparative study of DC and RF sputtered MoSe2 coatings containing carbon—An approach to optimize stoichiometry, microstructure, crystallinity and hardness. Coatings 2020, 10, 133. [Google Scholar] [CrossRef]
- Xu, J.; He, T.; Chai, L.; Qiao, L.; Wang, P.; Liu, W. Growth and characteristics of self-assembled MoS2/Mo-S-C nanoperiod multilayers for enhanced tribological performance. Sci. Rep. 2016, 6, 25378. [Google Scholar] [CrossRef] [PubMed]
- Polcar, T.; Cavaleiro, A. Review on self-lubricant transition metal dichalcogenide nanocomposite coatings alloyed with carbon. Surf. Coat. Technol. 2011, 206, 686–695. [Google Scholar] [CrossRef]
- Berman, D.; Narayanan, B.; Cherukara, M.J.; Sankaranarayanan, S.K.R.S.; Erdemir, A.; Zinovev, A.; Sumant, A.V. Operando tribochemical formation of onion-like-carbon leads to macroscale superlubricity. Nat. Commun. 2018, 9, 1164. [Google Scholar] [CrossRef]
- Yu, G.; Gong, Z.; Jiang, B.; Wang, D.; Bai, C. Superlubricity for hydrogenated diamond like carbon induced by thin MoS2 and DLC layer in moist air. Diam. Relat. Mater. 2020, 102, 107668. [Google Scholar] [CrossRef]
- Gong, Z.; Shi, J.; Zhang, B.; Zhang, J. Graphene nano scrolls responding to superlow friction of amorphous carbon. Carbon 2017, 116, 310–317. [Google Scholar] [CrossRef]
- Berman, D.; Deshmukh, S.A.; Sankaranarayanan, S.K.R.S.; Erdemir, A.; Sumant, A.V. Macroscale superlubricity enabled by graphene nanoscroll formation. Science 2015, 348, 6238. [Google Scholar] [CrossRef]
- Muratore, C.; Voevodin, A.A. Control of molybdenum disulfide plane orientation during coating growth in pulsed magnetron sputtering discharges. Thin Solid Films 2009, 517, 5605–5610. [Google Scholar] [CrossRef]
- Tillmann, W.; Wittig, A.; Stangier, D.; Moldenhauer, H.; Thomann, C.-A.; Debus, J.; Aurich, D.; Bruemmer, A. Influence of the bias-voltage, the argon pressure and the heating power on the structure and the tribological properties of HiPIMS sputtered MoSx films. Surf. Coat. Technol. 2020, 385, 125358. [Google Scholar] [CrossRef]
- Donley, M.S.; Murray, P.T.; Barber, S.A.; Haas, T.W. Deposition and properties of MoS2 thin films grown by pulsed laser evaporation. Surf. Coat. Technol. 1988, 36, 329–340. [Google Scholar] [CrossRef]
- Hu, J.J.; Bultman, J.E.; Muratore, C.; Phillips, B.S.; Zabinski, J.S.; Voevodin, A.A. Tribological properties of pulsed laser deposited Mo–S–Te composite films at moderate high temperatures. Surf. Coat. Technol. 2009, 203, 2322–2327. [Google Scholar] [CrossRef]
- Grigoriev, S.N.; Fominski, V.Y.; Romanov, R.I.; Gnedovets, A.G. Tribological properties of gradient Mo-Se-Ni-C thin films obtained by pulsed laser deposition in standard and shadow mask configurations. Thin Solid Films 2014, 556, 35–43. [Google Scholar] [CrossRef]
- Theiler, G.; Gradt, T.; Österle, W.; Brückner, A.; Weihnacht, V. Friction and endurance of MoS2/ta-C coatings produced by Laser Arc deposition. Wear 2013, 297, 791–801. [Google Scholar] [CrossRef]
- Fominski, V.Y.; Romanov, R.I.; Nevolin, V.N.; Fominski, D.V.; Komleva, O.V.; Popov, V.V. Formation of ultrathin MoS2 films using laser-based methods. J. Phys. Conf. Ser. 2019, 1238, 1–5. [Google Scholar] [CrossRef]
- Fominski, V.Y.; Romanov, R.I.; Gusarov, A.V.; Celis, J.-P. Pulsed laser deposition of antifriction thin-film MoSex coatings at the different vacuum conditions. Surf. Coat. Technol. 2007, 201, 7813–7821. [Google Scholar] [CrossRef]
- Fominski, V.Y.; Grigoriev, S.N.; Gnedovets, A.G.; Romanov, R.I. Specific features of ion-initiated processes during pulsed laser deposition of MoSe2 coatings in pulsed electric fields. Tech. Phys. Lett. 2012, 38, 683–686. [Google Scholar] [CrossRef]
- Walck, S.D.; Zabinski, J.S.; Donley, M.S.; Bultman, J.E. Evolution of surface topography in pulsed-laser-deposited thin films of MoS2. Surf. Coat. Technol. 1993, 62, 412–416. [Google Scholar] [CrossRef]
- Fominski, V.; Demin, M.; Fominski, D.; Romanov, R.; Goikhman, A.; Maksimova, K. Comparative study of the structure, composition, and electrocatalytic performance of hydrogen evolution in MoSx~2+δ/Mo and MoSx~3+δ films obtained by pulsed laser deposition. Nanomaterials 2020, 10, 201. [Google Scholar] [CrossRef]
- Fominski, V.Y.; Grigoriev, S.N.; Gnedovets, A.G.; Romanov, R.I. On the mechanism of encapsulated particle formation during pulsed laser deposition of WSex thin-film coatings. Tech. Phys. Lett. 2013, 39, 312–315. [Google Scholar] [CrossRef]
- Grigoriev, S.N.; Fominski, V.Y.; Romanov, R.I.; Volosova, M.A.; Shelyakov, A.V. Pulsed laser deposition of nanocomposite MoSex/Mo thin-film catalyst for hydrogen evolution reaction. Thin Solid Films 2015, 592, 175–181. [Google Scholar] [CrossRef]
- Fominski, V.Y.; Nevolin, V.N.; Romanov, R.I.; Titov, V.I.; Scharff, W. Tribological properties of pulsed laser deposited WSex(Ni)/DLC coatings. Tribol. Lett. 2004, 17, 289–294. [Google Scholar] [CrossRef]
- Muratore, C.; Hu, J.J.; Voevodin, A.A. Tribological coatings for lubrication over multiple thermal cycles. Surf. Coat. Technol. 2009, 203, 957–962. [Google Scholar] [CrossRef]
- Fominski, V.; Demin, M.; Nevolin, V.; Fominski, D.; Romanov, R.; Gritskevich, M.; Smirnov, N. Reactive pulsed laser deposition of clustered-type MoSx (x ~ 2, 3, and 4) films and their solid lubricant properties at low temperature. Nanomaterials 2020, 10, 653. [Google Scholar] [CrossRef]
- Cemin, F.; Boeira, C.D.; Figuero, C.A. On the understanding of the silicon-containing adhesion interlayer in DLC deposited on steel. Tribol. Int. 2016, 94, 464–469. [Google Scholar] [CrossRef]
- Grigoriev, S.N.; Fominski, V.Y.; Romanov, R.I.; Shelyakov, A.V.; Volosova, M.A. Effect of energy fluence and Ti/W co-deposition on the structural, mechanical and tribological characteristics of diamond-like carbon coatings obtained by pulsed Nd:YAG laser deposition on a steel substrate. Surf. Coat. Technol. 2014, 259, 415–425. [Google Scholar] [CrossRef]
- Niakan, H.; Zhang, C.; Yang, L.; Yang, Q.; Szpunar, J.A. Structure and properties of DLC–MoS2 thin films synthesized by BTIBD method. J. Phys. Chem. Solids 2014, 75, 1289–1294. [Google Scholar] [CrossRef]
- Zhang, X.; Xu, J.; Chai, L.; He, T.; Yu, F.; Wang, P. Carbon and nitrogen co-doping self-assembled MoS2 multilayer films. Appl. Surf. Sci. 2017, 406, 30–38. [Google Scholar] [CrossRef]
- Gu, L.; Ke, P.; Zou, Y.; Li, X.; Wang, A. Amorphous self-lubricant MoS2-C sputtered coating with high hardness. Appl. Surf. Sci. 2015, 331, 66–71. [Google Scholar] [CrossRef]
- Weise, G.; Mattern, N.; Hermann, H.; Teresiak, A.; Bächer, I.; Brückner, W.; Bauer, H.-D.; Vinzelberg, H.; Reiss, G.; Kreissig, U.; et al. Preparation, structure and properties of MoSx films. Thin Solid Films 1997, 298, 98–106. [Google Scholar] [CrossRef]
- Moser, J.; Lévy, F. Random stacking in MoS2−x sputtered thin films. Thin Solid Films 1994, 240, 56–59. [Google Scholar] [CrossRef]
- Lee, C.-H.; Lee, S.; Lee, Y.-K.; Jung, Y.C.; Ko, Y.-I.; Lee, D.C.; Joh, H.-I. Understanding on the origin of formation and active sites for thiomolybdate [Mo3S13]2− clusters as hydrogen-evolution catalyst through the selective control of sulfur atoms. ACS Catal. 2018, 8, 5221–5227. [Google Scholar] [CrossRef]
- Wu, Q.; Abraham, A.; Wang, L.; Tong, X.; Takeuchi, E.S.; Takeuchi, K.J.; Marschilok, A.C. Electrodeposition of MoSx: Tunable fabrication of sulfur equivalent electrodes for high capacity or high power. J. Electrochem. Soc. 2020, 167, 050513. [Google Scholar] [CrossRef]
- Escalera-López, D.; Lou, Z.; Rees, N.V. Benchmarking the activity, stability, and inherent electrochemistry of amorphous molybdenum sulfide for hydrogen production. Adv. Energy Mater. 2019, 9, 1802614. [Google Scholar] [CrossRef]
- Xu, J.; Chai, L.; Qiao, L.; He, T.; Wang, P. Influence of C dopant on the structure, mechanical and tribologicalproperties of r.f.-sputtered MoS2/a-C composite films. Appl. Surf. Sci. 2016, 364, 249–256. [Google Scholar] [CrossRef]
- Wu, Y.; Li, H.; Ji, L.; Liu, L.; Ye, Y.; Chen, J.; Zhou, H. Structure, mechanical, and tribological properties of MoS2/a-C:H composite films. Tribol. Lett. 2013, 52, 371–380. [Google Scholar] [CrossRef]
- Filik, J.; Lane, I.M.; May, P.W.; Pearce, S.R.J.; Hallam, K.R. Incorporation of sulfur into hydrogenated amorphous carbon films. Diam. Relat. Mater. 2004, 13, 1377–1384. [Google Scholar] [CrossRef]
- Honglertkongsakul, K.; May, P.W.; Paosawatyanyong, B. Effect of temperature on sulfur-doped diamond-like carbon films deposited by pulsed laser ablation. Diam. Relat. Mater. 2011, 20, 1218–1221. [Google Scholar] [CrossRef]
- Saeheng, A.; Tonanon, N.; Bhanthumnavin, W.; Paosawatyanyong, B. Sulphur doped DLC films deposited by DC magnetron sputtering. Can. J. Chem. Eng. 2012, 90, 909–914. [Google Scholar] [CrossRef]
- Takeuchi, T.; Kojima, T.; Kageyama, H. Carbon Sulfur Materials and Methods for Producing Same. U.S. Patent 10,710,960 B2, 14 July 2020. [Google Scholar]
- Deng, Y.; Ting, L.R.L.; Neo, P.H.L.; Zhang, Y.-J.; Peterson, A.A.; Yeo, B.S. Operando Raman spectroscopy of amorphous molybdenum sulfide (MoSx) during the electrochemical hydrogen evolution reaction: Identification of sulfur atoms as catalytically active sites for H+ reduction. ACS Catal. 2016, 6, 7790–7798. [Google Scholar] [CrossRef]
- Lassalle-Kaiser, B.; Merki, D.; Vrubel, H.; Gul, S.; Yachandra, V.K.; Hu, X.; Yano, J. Evidence from in situ X-ray absorption spectroscopy for the involvement of terminal disulfide in the reduction of protons by an amorphous molybdenum sulfide electrocatalyst. J. Am. Chem. Soc. 2015, 137, 314–321. [Google Scholar] [CrossRef] [PubMed]
- Lince, J.R.; Pluntze, A.M.; Jackson, S.A.; Radhakrishnan, G.; Adams, P.M. Tribochemistry of MoS3 nanoparticle coatings. Tribol. Lett. 2014, 53, 543–554. [Google Scholar] [CrossRef]
- Lu, X.F.; Yu, L.; Zhang, J.; Lou, X.W. Ultrafine dual-phased carbide nanocrystals confined in porous nitrogen-doped carbon dodecahedrons for efficient hydrogen evolution reaction. Adv. Mater. 2019, 31, 1900699. [Google Scholar] [CrossRef] [PubMed]
- Chen, M.; Ma, Y.; Zhou, Y.; Liu, C.; Qin, Y.; Fang, Y.; Guan, G.; Li, X.; Zhang, Z.; Wang, T. Influence of transition metal on the hydrogen evolution reaction over nano-molybdenum-carbide catalyst. Catalysts 2018, 8, 294. [Google Scholar] [CrossRef]
- Wang, C.; Guo, Z.; Shen, W.; Zhang, A.; Xu, Q.; Liu, H.; Wang, Y. Application of sulfur-doped carbon coating on the surface of Li3V2(PO4)3 composite facilitate li-ion storage as cathode materials. J. Mater. Chem. A 2015, 3, 6064–6072. [Google Scholar] [CrossRef]
- Fominski, V.Y.; Markeev, A.M.; Nevolin, V.N.; Prokopenko, V.B.; Vrublevski, A.R. Pulsed laser deposition of MoSx films in a buffer gas atmosphere. Thin Solid Films 1994, 248, 240–246. [Google Scholar] [CrossRef]
- Su, Y.; Zhang, Y.; Zhuang, X.; Li, S.; Wu, D.; Zhang, F.; Feng, X. Low-temperature synthesis of nitrogen/sulfur co-doped three-dimensional graphene frameworks as efficient metal-free electrocatalyst for oxygen reduction reaction. Carbon 2013, 62, 296–301. [Google Scholar] [CrossRef]
- Paraknowitsch, J.P.; Wienert, B.; Zhang, Y.; Thomas, A. Intrinsically Sulfur- and Nitrogen-Co-doped Carbons from Thiazolium Salts. Chem. Eur. J. 2012, 18, 15416–15423. [Google Scholar] [CrossRef]
- Polcar, T.; Nossa, A.; Evaristo, M.; Cavaleiro, A. Nanocomposite Coatings of Carbon-based and Transition Metal Dichalcogenides Phases: A Review. Rev. Adv. Mater. Sci. 2007, 15, 118–126. Available online: http://www.ipme.ru/e-journals/RAMS/no_21507/cavaleiro.pdf (accessed on 7 December 2020).
- Wang, X.; Wang, T.; Ye, M.; Wang, L.; Zhang, G. Microstructure and tribological properties of GLC/MoS2 composite films deposited by magnetron sputtering. Diam. Relat. Mater. 2019, 98, 107471. [Google Scholar] [CrossRef]
- Li, L.; Lu, Z.; Pu, J.; Wang, H.; Li, Q.; Chen, S.; Zhang, Z.; Wang, L. The superlattice structure and self-adaptive performance of C–Ti/MoS2 composite coatings. Ceram. Int. 2020, 46, 5733–5744. [Google Scholar] [CrossRef]
- Zhao, X.; Lu, Z.; Zhang, G.; Wang, L.; Xue, Q. Self-adaptive MoS2-Pb-Ti film for vacuum and humid air. Surf. Coat. Technol. 2018, 345, 152–166. [Google Scholar] [CrossRef]
- Cao, H.; Wen, F.; Kumar, S.; Rudolf, P.; de Hosson, J.T.M.; Pei, Y. On the S/W stoichiometry and triboperformance of WSxC(H) coatings deposited by magnetron sputtering. Surf. Coat. Technol. 2019, 365, 41–51. [Google Scholar] [CrossRef]
- Wu, Y.; Li, H.; Ji, L.; Ye, Y.; Chen, J.; Zhou, H. A long-lifetime MoS2/a-C:H nanoscale multilayer film with extremely low internal stress. Surf. Coat. Technol. 2013, 236, 439–443. [Google Scholar] [CrossRef]
- Fominski, V.Y.; Grigor’ev, S.N.; Romanov, R.I.; Nevolin, V.N. Effect of the pulsed laser deposition conditions on the tribological properties of thin-film nanostructured coatings based on molybdenum diselenide and carbon. Tech. Phys. 2012, 57, 516–523. [Google Scholar] [CrossRef]
- Gao, K.; Lai, Z.; Jia, Z.; Zhang, B.; Wei, X.; Zhang, J. Bilayer a-C:H/MoS2 film to realize superlubricity in open atmosphere. Diam. Relat. Mater. 2020, 108, 107973. [Google Scholar] [CrossRef]
- Freyman, C.A.; Chen, Y.; Chung, Y.-W. Synthesis of carbon films with ultra-low friction in dry and humid air. Surf. Coat. Technol. 2006, 201, 164–167. [Google Scholar] [CrossRef]
- Moolsradoo, N.; Watanabe, S. Deposition and tribological properties of sulfur-doped DLC Films deposited by PBII method. Adv. Mater. Sci. Eng. 2010, 168, 1–7. [Google Scholar] [CrossRef][Green Version]
- Huang, P.; Qi, W.; Yin, X.; Choi, J.; Chen, X.; Tian, J.; Xu, J.; Wu, H.; Luo, J. Ultra-low friction of a-C:H films enabled by lubrication of nanodiamond and graphene in ambient air. Carbon 2019, 154, 203–210. [Google Scholar] [CrossRef]
- Matamoros-Veloza, A.; Cespedes, O.; Johnson, B.R.G.; Stawski, T.M.; Terranova, U.; de Leeuw, N.H.; Benning, L.G. A highly reactive precursor in the iron sulfide system. Nat. Commun. 2018, 9, 1–7. [Google Scholar] [CrossRef]
- Cai, S.; Guo, P.; Liu, J.; Zhang, D.; Ke, P.; Wang, A.; Zhu, Y. Friction and wear mechanism of MoS2/C composite coatings under atmospheric environment. Tribol. Lett. 2017, 65, 79. [Google Scholar] [CrossRef]
- Wang, K.; Yang, B.; Zhang, B.; Bai, C.; Mou, Z.; Gao, K.; Yushkov, G.; Oks, E. Modification of a-C:H films via nitrogen and silicon doping: The way to the superlubricity in moisture atmosphere. Diam. Relat. Mater. 2020, 107, 107873. [Google Scholar] [CrossRef]
- Yin, X.; Wu, F.; Chen, X.; Xu, J.; Wu, P.; Li, J.; Zhang, C.; Luo, J. Graphene-induced reconstruction of the sliding interface assisting the improved lubricity of various tribo-couples. Mater. Des. 2020, 191, 108661. [Google Scholar] [CrossRef]
- Liang, J.; Jiao, Y.; Jaroniec, M.; Shi Qiao, S.Z. Sulfur and nitrogen dual-doped mesoporous graphene electrocatalyst for oxygen reduction with synergistically enhanced performance. Angew. Chem. Int. Ed. 2012, 51, 11496–11500. [Google Scholar] [CrossRef] [PubMed]
- Bautista-Flores, C.; Arellano-Peraza, J.S.; Sato-Berrú, R.Y.; Camps, E.; Mendoza, D. Sulfur and few-layer graphene interaction under thermal treatments. Chem. Phys. Lett. 2016, 665, 121–126. [Google Scholar] [CrossRef]
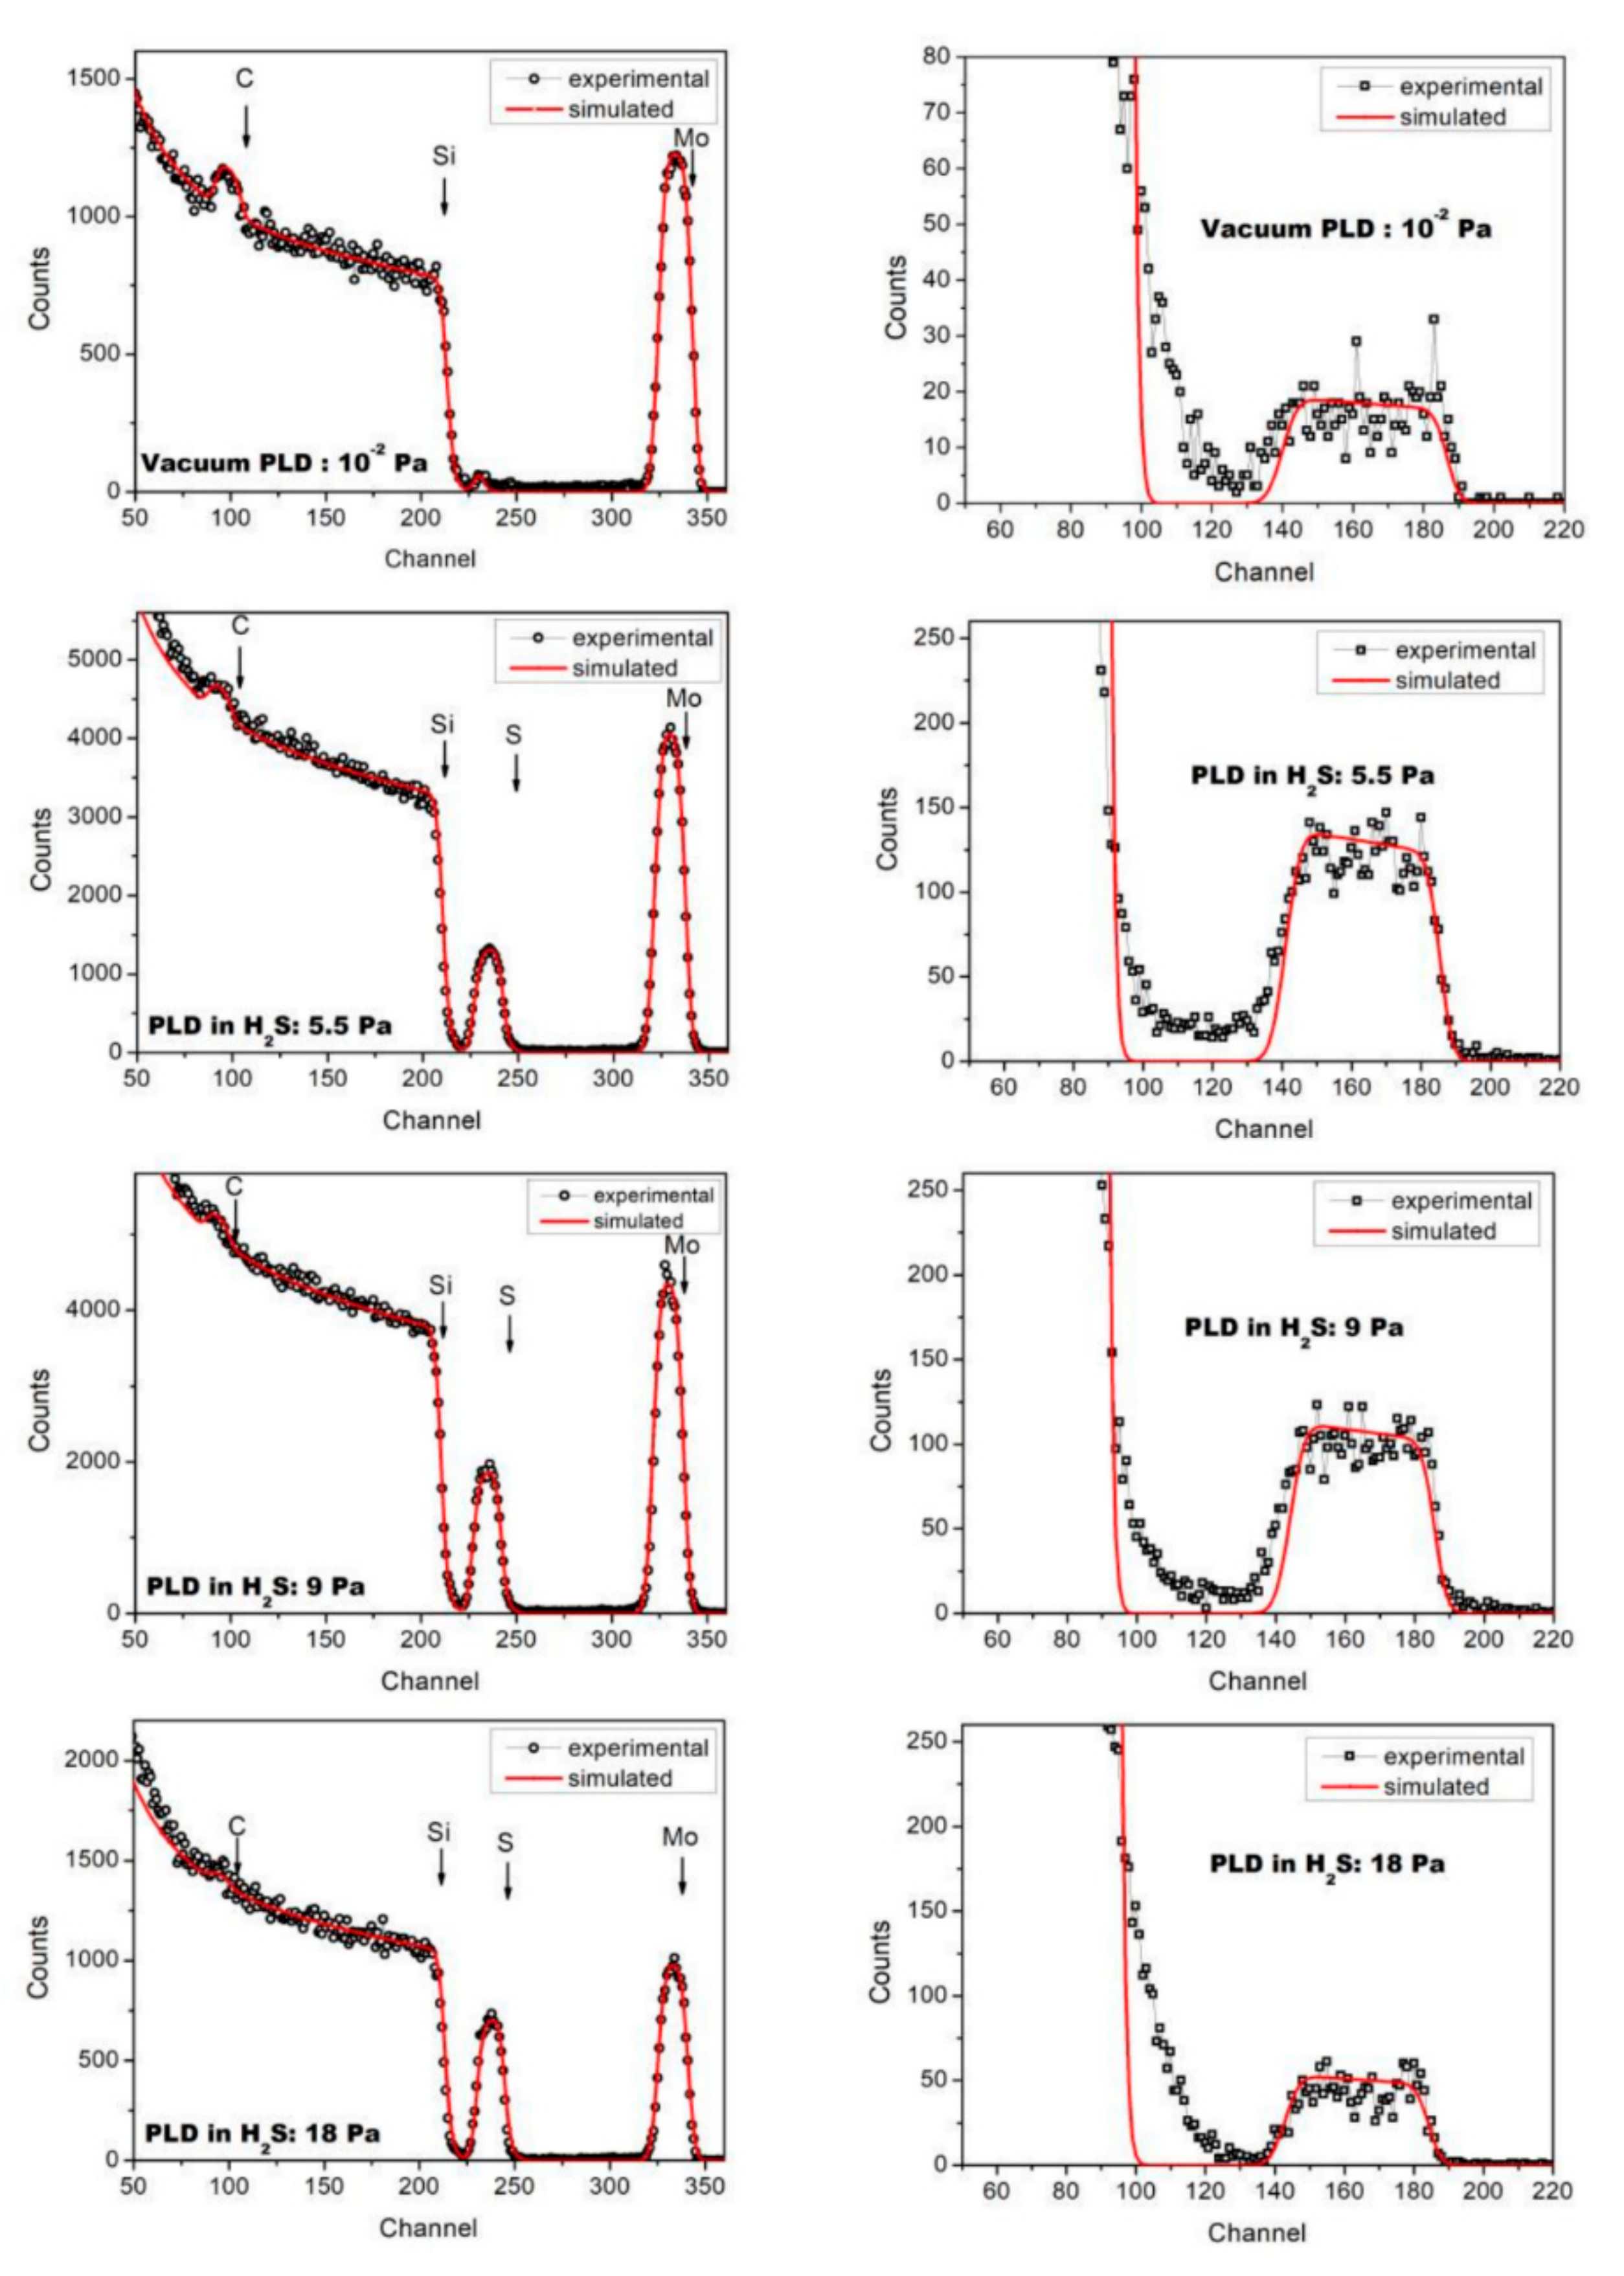
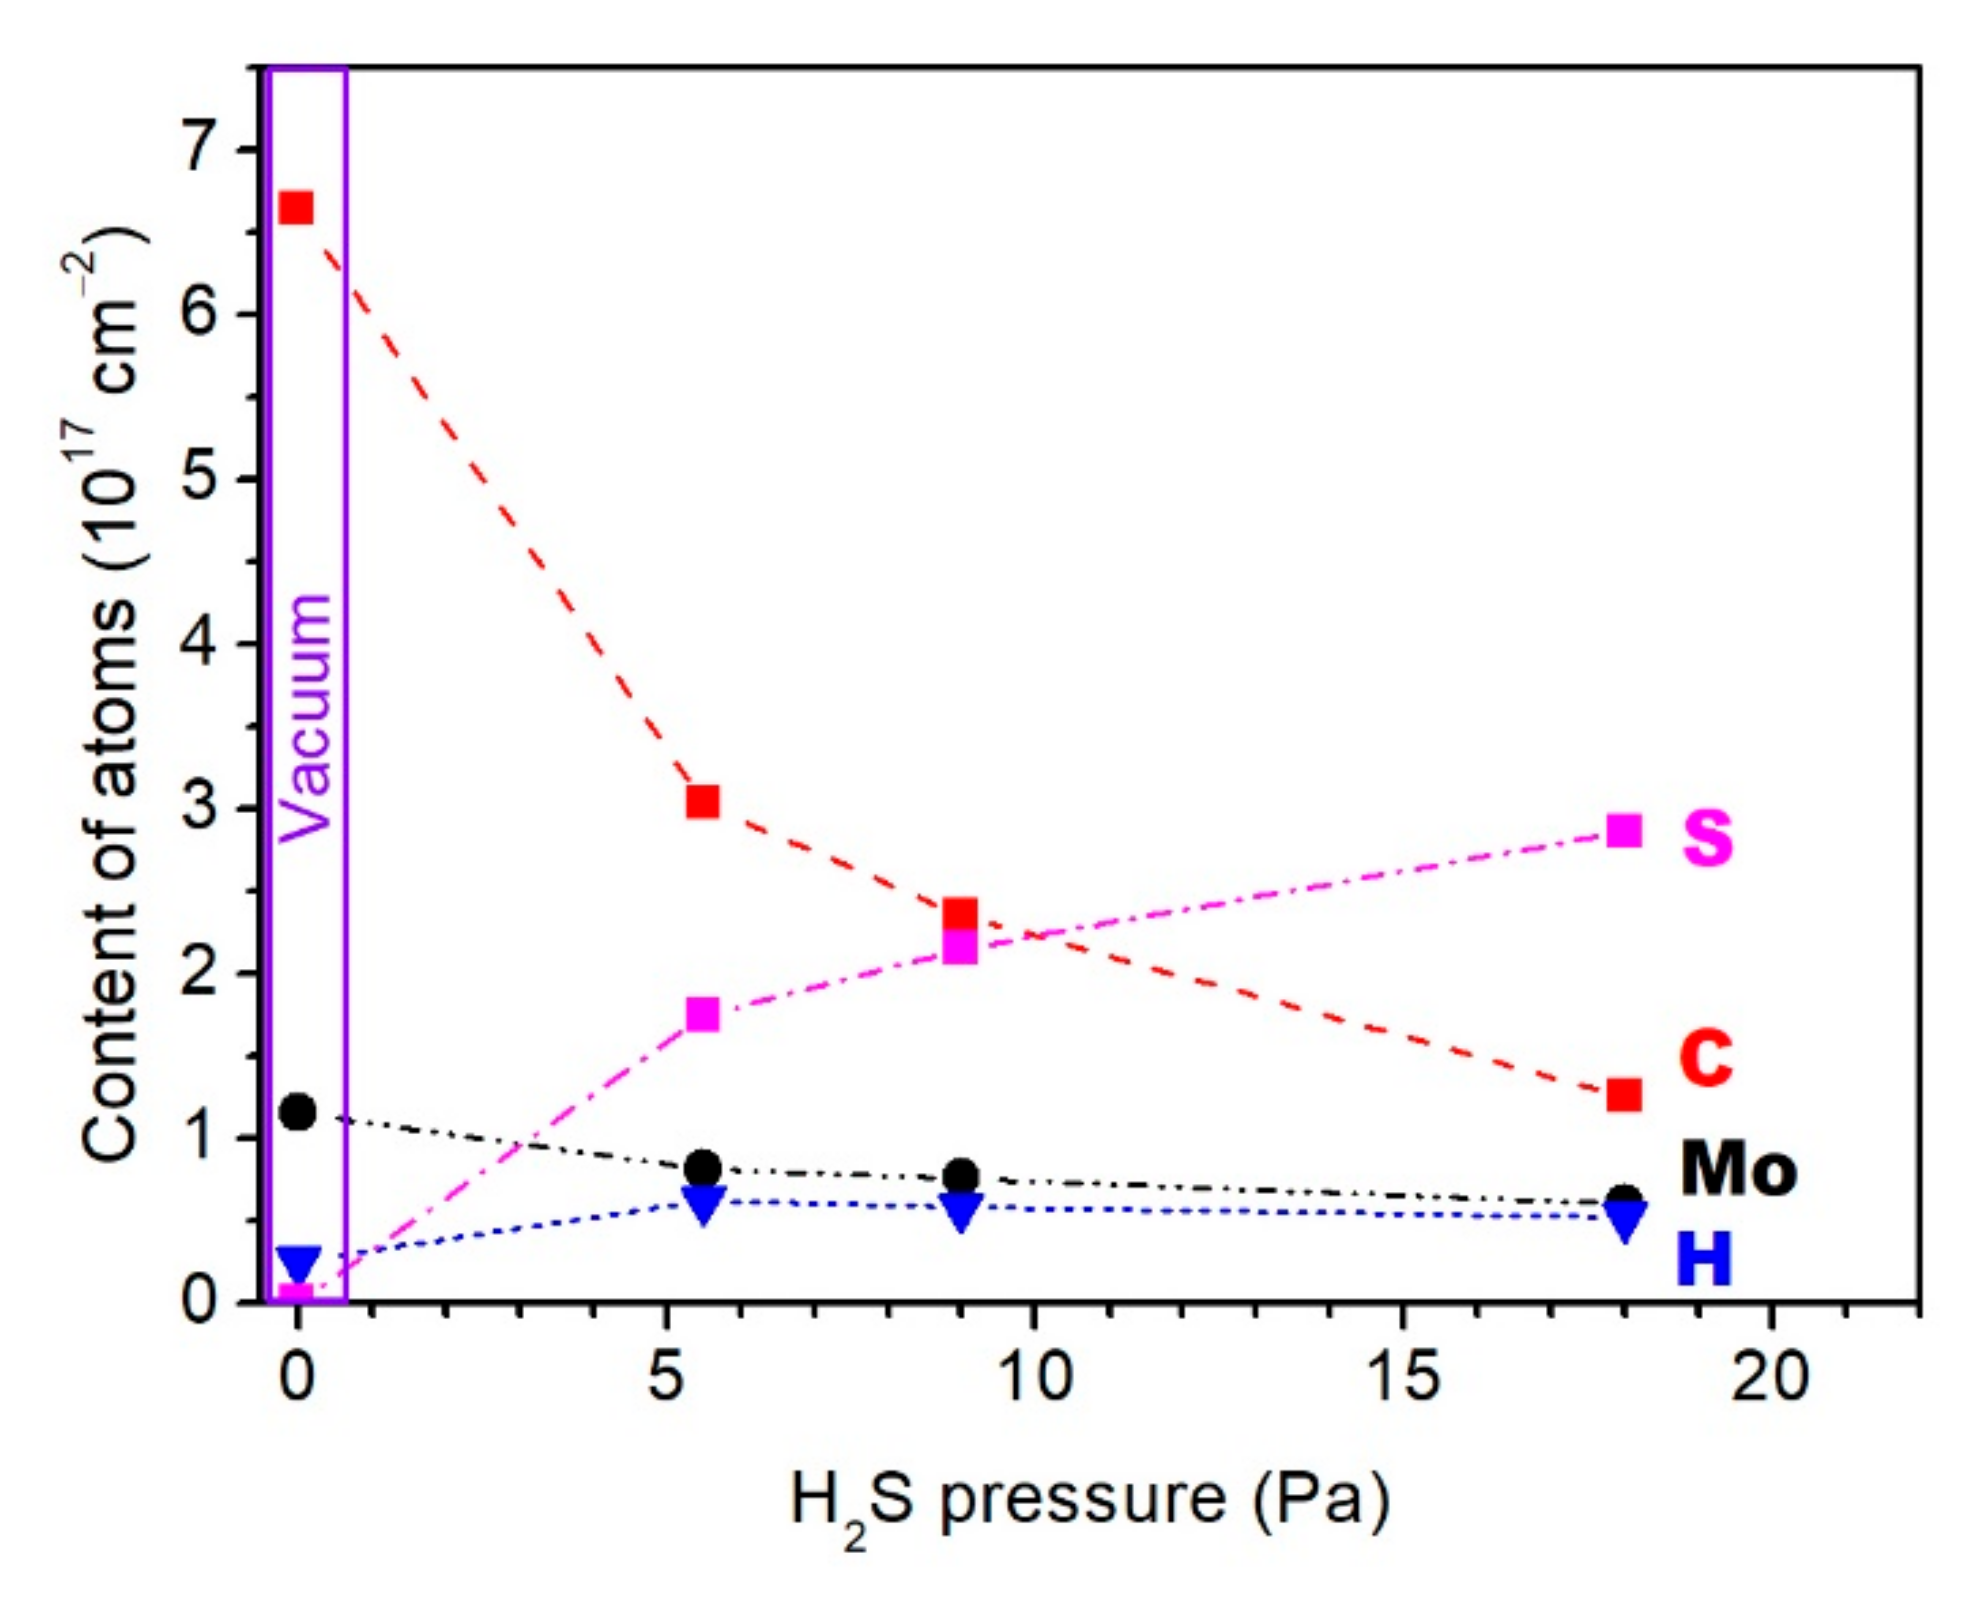

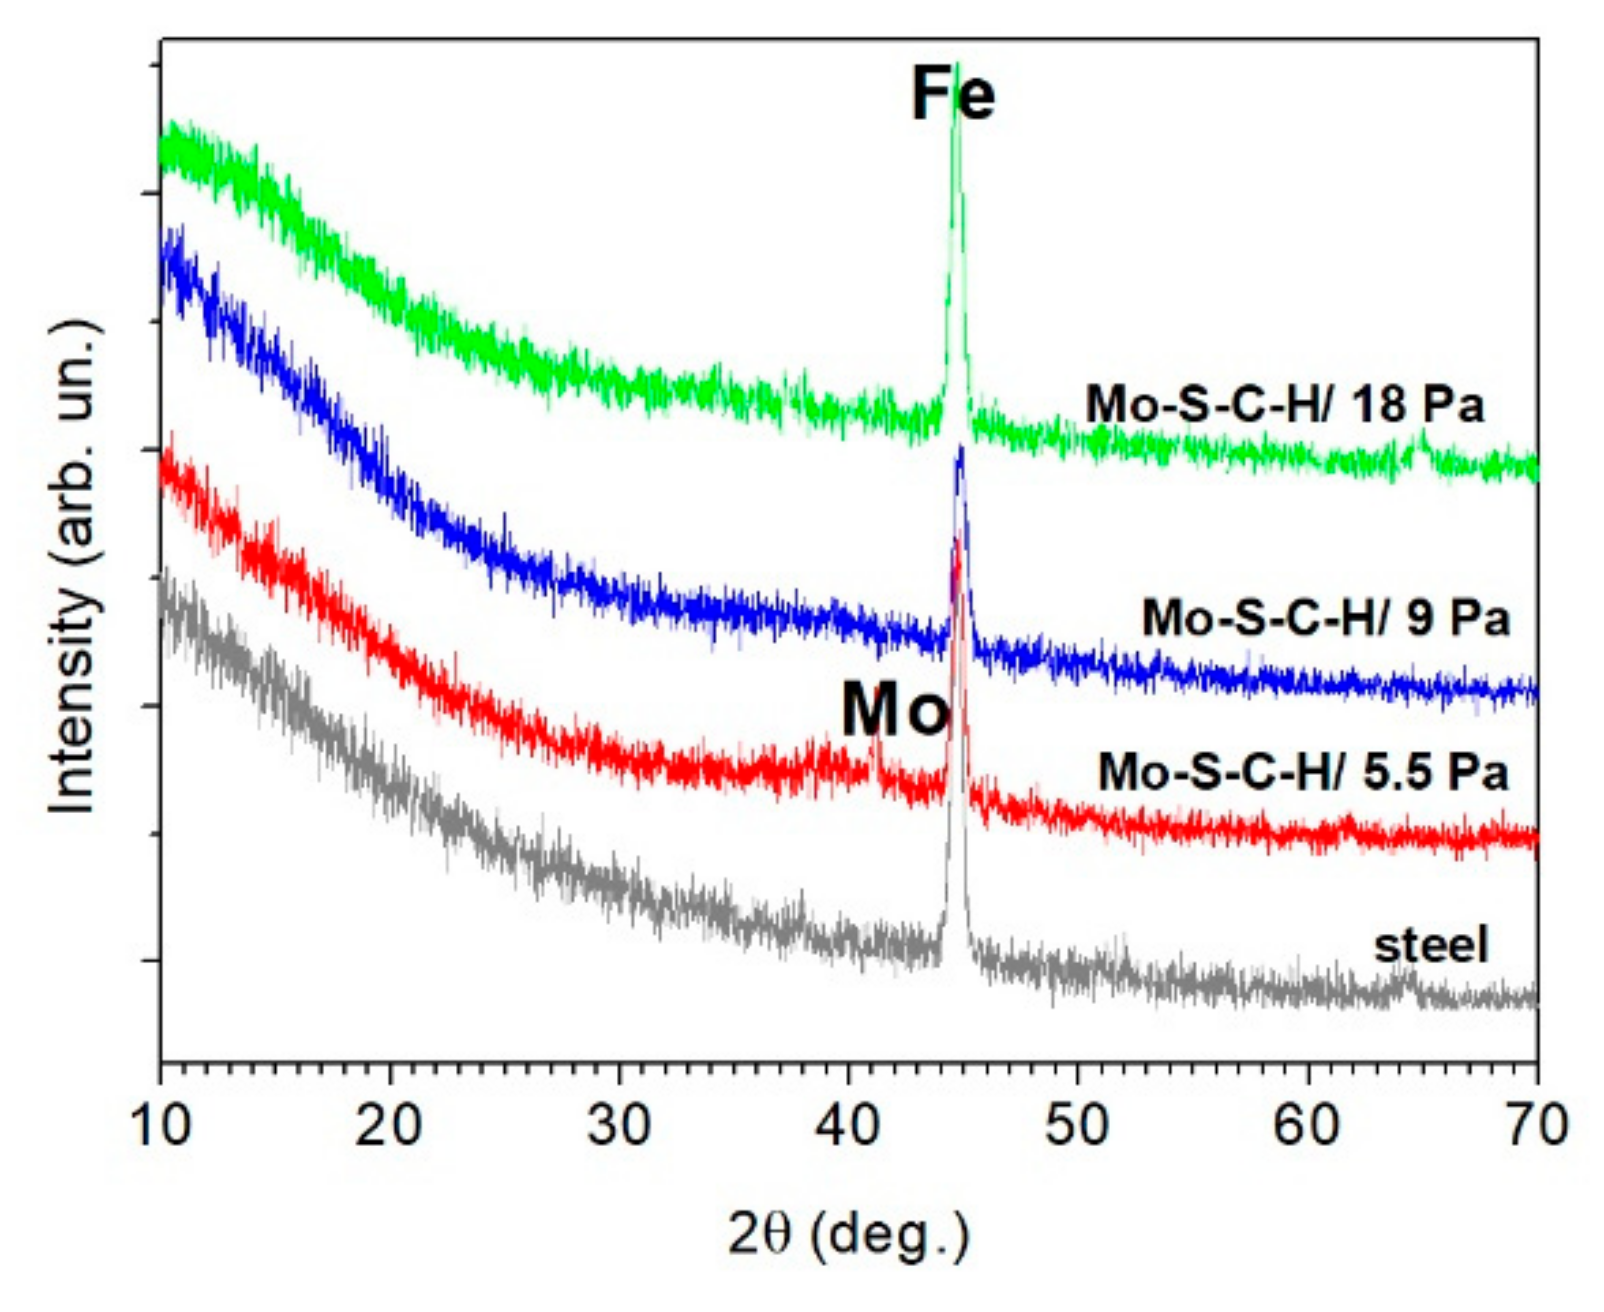
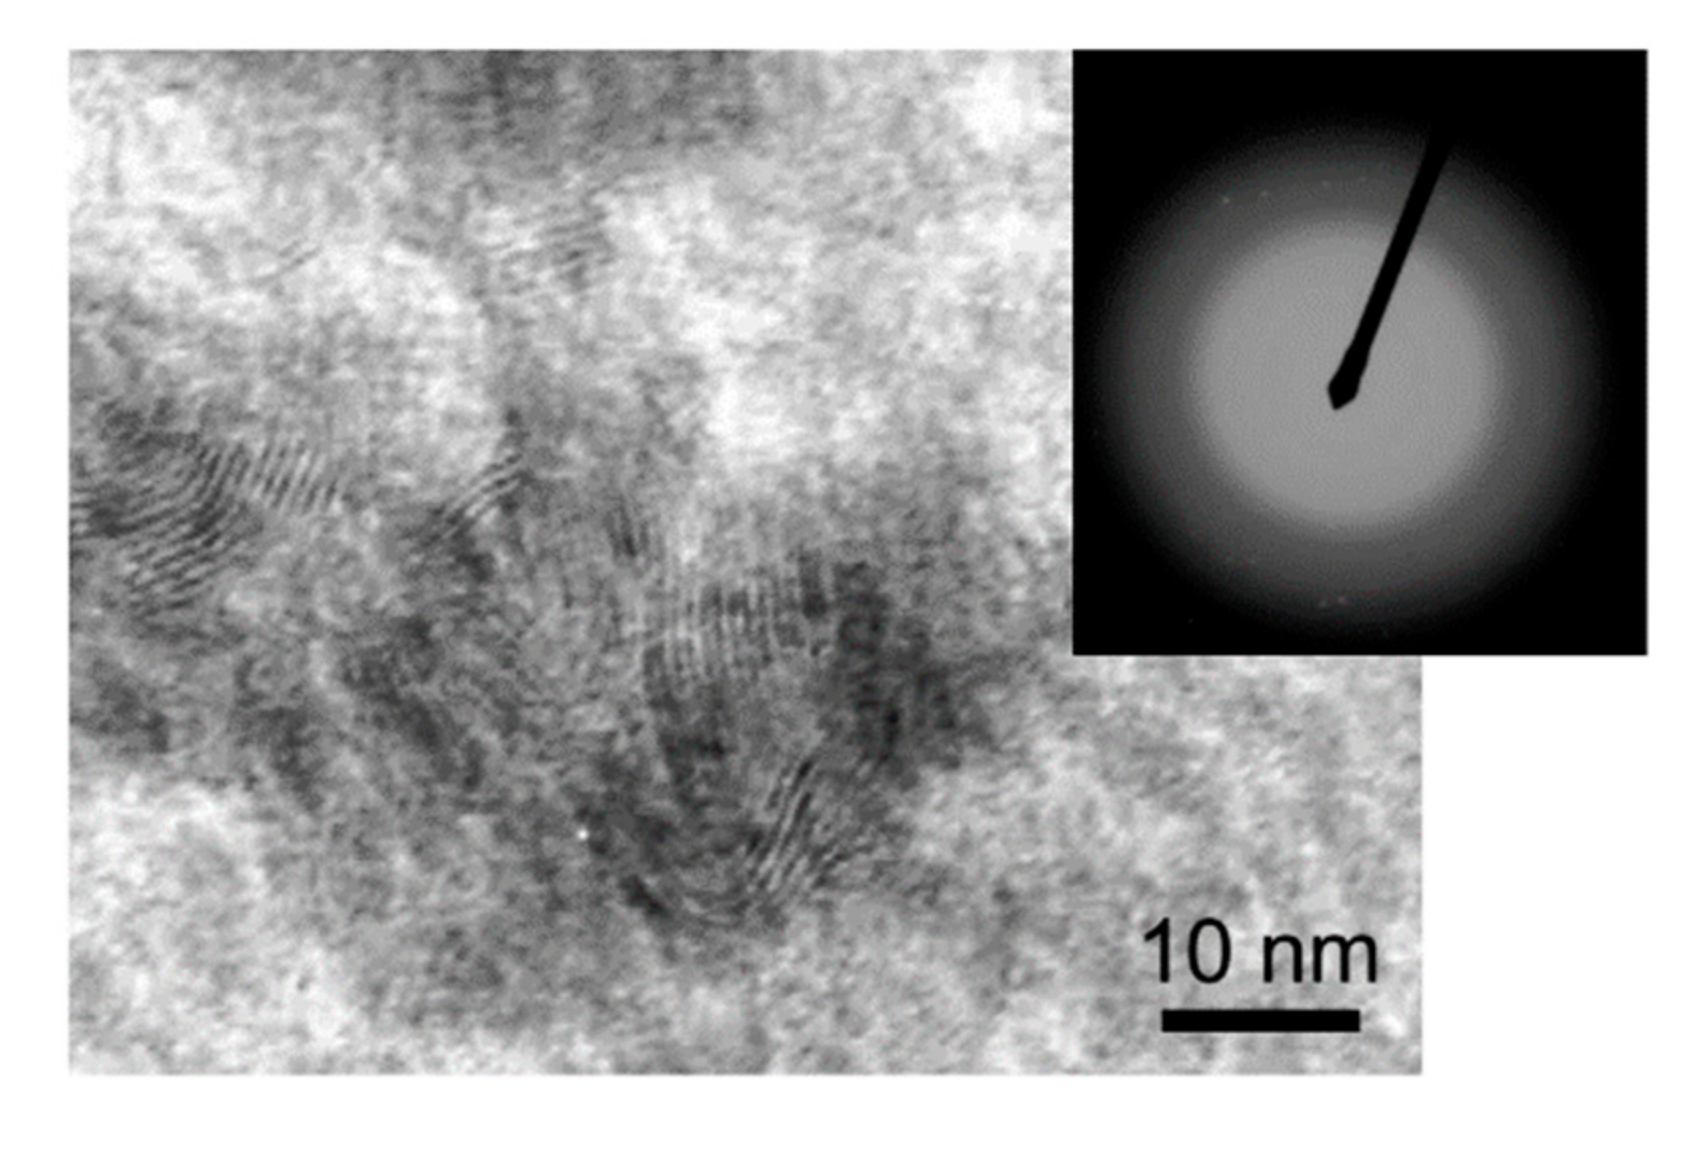
Publisher’s Note: MDPI stays neutral with regard to jurisdictional claims in published maps and institutional affiliations. |
© 2020 by the authors. Licensee MDPI, Basel, Switzerland. This article is an open access article distributed under the terms and conditions of the Creative Commons Attribution (CC BY) license (http://creativecommons.org/licenses/by/4.0/).
Share and Cite
Fominski, V.; Fominski, D.; Romanov, R.; Gritskevich, M.; Demin, M.; Shvets, P.; Maksimova, K.; Goikhman, A. Specific Features of Reactive Pulsed Laser Deposition of Solid Lubricating Nanocomposite Mo–S–C–H Thin-Film Coatings. Nanomaterials 2020, 10, 2456. https://doi.org/10.3390/nano10122456
Fominski V, Fominski D, Romanov R, Gritskevich M, Demin M, Shvets P, Maksimova K, Goikhman A. Specific Features of Reactive Pulsed Laser Deposition of Solid Lubricating Nanocomposite Mo–S–C–H Thin-Film Coatings. Nanomaterials. 2020; 10(12):2456. https://doi.org/10.3390/nano10122456
Chicago/Turabian StyleFominski, Vyacheslav, Dmitry Fominski, Roman Romanov, Mariya Gritskevich, Maxim Demin, Petr Shvets, Ksenia Maksimova, and Alexander Goikhman. 2020. "Specific Features of Reactive Pulsed Laser Deposition of Solid Lubricating Nanocomposite Mo–S–C–H Thin-Film Coatings" Nanomaterials 10, no. 12: 2456. https://doi.org/10.3390/nano10122456
APA StyleFominski, V., Fominski, D., Romanov, R., Gritskevich, M., Demin, M., Shvets, P., Maksimova, K., & Goikhman, A. (2020). Specific Features of Reactive Pulsed Laser Deposition of Solid Lubricating Nanocomposite Mo–S–C–H Thin-Film Coatings. Nanomaterials, 10(12), 2456. https://doi.org/10.3390/nano10122456


