Article

Peroxide Electrochemical Sensor and Biosensor Based on Nanocomposite of TiO2 Nanoparticle/Multi-Walled Carbon Nanotube Modified Glassy Carbon Electrode

by
L. Andrés Guerrero
1,2,
Lenys Fernández
1,3,*,
Gema González
2,4,*,
Marjorie Montero-Jiménez
1,
Rafael Uribe
5,
Antonio Díaz Barrios
2 and
Patricio J. Espinoza-Montero
1,*
1
Escuela de Ciencias Químicas, Pontificia Universidad Católica del Ecuador, Av. 12 de Octubre 1076, Apartado, Quito 17-01-2184, Ecuador
2
School of Physics and Nanotechnology, Yachay Tech University, Urcuqui 100650, Ecuador
3
Departamento de Química, Universidad Simón Bolívar, Caracas 89000, Venezuela
4
Instituto Venezolano de Investigaciones Científicas, Centro de Ingeniería Materiales y Nanotecnología, Caracas 1020-A, Venezuela
5
Departamento de Ingeniería Química, Escuela Politécnica Nacional, Quito 17-01-2759, Ecuador
*
Authors to whom correspondence should be addressed.
Nanomaterials 2020, 10(1), 64; https://doi.org/10.3390/nano10010064
Submission received: 12 November 2019 / Revised: 9 December 2019 / Accepted: 15 December 2019 / Published: 27 December 2019
(This article belongs to the Section Biology and Medicines)

Abstract

:
A hydrogen peroxide (H2O2) sensor and biosensor based on modified multi-walled carbon nanotubes (CNTs) with titanium dioxide (TiO2) nanostructures was designed and evaluated. The construction of the sensor was performed using a glassy carbon (GC) modified electrode with a TiO2–CNT film and Prussian blue (PB) as an electrocalatyzer. The same sensor was also employed as the basis for H2O2 biosensor construction through further modification with horseradish peroxidase (HRP) immobilized at the TiO2–fCNT film. Functionalized CNTs (fCNTs) and modified TiO2–fCNTs were characterized by Transmission Electron Microscopy (TEM), Fourier Transform Infrared Spectroscopy (FTIR), and X-Ray DifFraction (XRD), confirming the presence of anatase over the fCNTs. Depending on the surface charge, a solvent which optimizes the CNT dispersion was selected: dimethyl formamide (DMF) for fCNTs and sodium dodecylsulfate (SDS) for TiO2–fCNTs. Calculated values for the electron transfer rate constant (ks) were 0.027 s−1 at the PB–fCNT/GC modified electrode and 4.7 × 10⁻⁴ s−1 at the PB–TiO2/fCNT/GC electrode, suggesting that, at the PB–TiO2/fCNT/GC modified electrode, the electronic transfer was improved. According to these results, the PB–fCNT/GC electrode exhibited better Detection Limit (LD) and Quantification Limit (LQ) than the PB–TiO2/fCNT/GC electrode for H2O2. However, the PB film was very unstable at the potentials used. Therefore, the PB–TiO2/fCNT/GC modified electrode was considered the best for H2O2 detection in terms of operability. Cyclic Voltammetry (CV) behaviors of the HRP–TiO2/fCNT/GC modified electrodes before and after the chronoamperometric test for H2O2, suggest the high stability of the enzymatic electrode. In comparison with other HRP/fCNT-based electrochemical biosensors previously described in the literature, the HRP–fCNTs/GC modified electrode did not show an electroanalytical response toward H2O2.

Graphical Abstract

1. Introduction

The use of nanomaterials in biosensing is a subject of intense research, with a significant impact on everyday life [1]. Carbon nanotubes (CNTs) are at the forefront of this intense research, reflecting unique and remarkable mechanical, thermal, electrical, and elastic properties [2,3]. These properties include having characteristics of semiconductors or conductors [4]. CNTs have a significant potential application in nano-devices, particularly field-effect transistors [5,6] nano-probes [7], bioelectronics, sensors [8,9], and biosensors [10,11]. CNTs are used in biosensors to enhance bioanalytical performance or offer innovative routes of interfacing the transduction processes in the development of electrochemical biosensors [12]. It was reported that CNT-modified electrodes are widely used in the catalytic and detection electrochemistry of some interesting biomolecules [13,14,15,16]. Hydrogen peroxide is one of the most common analytes of biological interest because of its importance in biological, environmental, and industrial processes. In the human body, H2O2 can be converted into hydroxyl radicals (OH), which are highly reactive [17]. The overproduction of reactive species such as OH and superoxide (O2)⦁− in the cellular interstices is demonstrated to promote cell damage and tissue malfunction [18]. Also, H2O2 detection forms the diagnosis response of medical devices such as glucose sensors because, in the presence of oxygen, H2O2 is produced by the action of glucose oxidase [19,20]. Hydrogen peroxide is also found in food and drinking water, and it is also used in waste treatment and bleaching applications [21,22]. The presence of H2O2 in everyday life, such as in glucose monitors, food, bleaching processes, and even the regulation of human processes, highlights its important role in the detection of analytes. Therefore, the design of a biosensor should accomplish parameters such as versatility, high sensitivity, and fast response.
The successful application of CNT-based composite materials usually requires chemical modification of the CNTs [23,24]. Nanostructured metal oxides were found to exhibit strong adsorption ability, catalytic properties, and biocompatibility, making them ideal for sensor surface development and offering excellent interfaces for biological recognition [25]. Metal-oxide nanoparticles attached to the carbon nanotube surface are also receiving notable interest because of the potential applications when designing electrochemically functional nanostructures [2], which include a higher surface area and better biocompatibility, and they help in addressing the design of a biosensing interface allowing the analyte to interact effectively over the biosensing surface. Titanium dioxide received tremendous interest in promising areas such as photovoltaics, biosensing, and photocatalysis [26]. TiO2 nanostructures exhibit a large surface area, as well as unique chemical and electronic properties [27]. Considering electronic band structure, TiO2 is electron-rich, belonging to the n-type semiconductor category. TiO2 nanomaterials are used for sensors in the detection of soluble organics in aqueous media, as well as for gas, chemical, and biological substance detection [27].
One of the challenges in biosensing is to successfully design an interface between the analyte and the electrode surface [12]. In the matter of enzyme-based biosensors, the immobilization of the enzyme denotes an enormous task to lead the communication between its active site and the analyte. Furthermore, due to the remarkable properties mentioned above, the presence of modified CNTs could lead to an improved route of interfacing and a superior response in H2O2 detection. In this paper, the evaluation of TiO2 nanoparticles/multi-walled carbon nanotubes on glassy carbon (TiO2/MWCNT/GC) modified electrodes and Prussian blue (PB) helped us to design a model electrode to analyze the performance and contribution of carbon nanotubes and titanium dioxide nanostructures in the electrochemical detection of H2O2 by horseradish peroxidase (HRP)/TiO2/MWCNT/GC modified glassy carbon electrode.

2. Materials and Methods

2.1. Materials and Reagents

Nitric acid (HNO3, 68%) and hydrogen peroxide (H2O2, 30%) were purchased from Sigma-Aldrich Sigma, (Darmstadt, Germany). Potassium phosphate monobasic (KH2PO4) and sodium hydroxide (NaOH, 99.9%) were purchased from Fisher Scientific (Waltham, MA, USA). Phosphate-buffered saline (PBS, 20 mmol∙L−1 KH2PO4 + 20 mmol∙L−1 K2HPO4 + 0.1 mol∙L−1 KCl, pH 6.8) was used as a supporting electrolyte. Potassium ferricyanide (K3[Fe(CN)6]), iron trichloride (FeCl3), and potassium chloride (KCl) were from BDH Chemicals (Philadelphia, PA, USA), hydrochloric acid (HCl, 37%) was from Fisher Scientific (Waltham, MA, USA), carbon nanotubes were from Nanocyl (Sambreville Belgium), glassy carbon (GC), silver/silver chloride reference electrode, and graphite counter-electrode were from CH-Instruments (Austin, TX, USA), sulfuric acid (H2SO4, 98%) was from Fisher Scientific (Waltham, MA, USA), titanium isopropoxide, isopropanol (99%), and 1 µm, 0.3 µm, and 0.05 µm alumina powder were from CH-Instruments (Austin, TX, USA), dimethylformamide (DMF) was from BDH Chemicals (Philadelphia, PA, USA), and sodium dodecyl sulfate (SDS) and poly(diallyldimethylammonium chloride) (PDDA, 4% w/w in water) were from Sigma. Solutions (Darmstadt, Germany) were prepared using distilled/deionized water (18 MΩ resistivity).

2.2. Functionalization of Carbon Nanotubes

Pristine multi-walled carbon nanotubes (pCNTs) (NANOCYL®NC7000, Austin, TX, USA) with 90% purity, average diameter of 9.5 nm and average length of 1.5 μm, transition metal-oxide content <1%, surface area of 250 m2/g, and resistivity of cm 10−4 Ω∙m) were subjected to a pre-functionalization and functionalization process. To perform this work, the materials were obtained pre-functionalized and modified with TiO2 NPs. A brief description of the process is given below. Pre-functionalization was performed with 3 mol∙L−1 HNO3 and 1 mol∙L−1 H2SO4 solutions. Then, pCNTs were dispersed into the nitric acid solution while the sulfuric acid solution was slowly added. The solution was placed under reflux at 80 °C with stirring at 400 rpm for 6 h. Then, the nanotubes were filtered, rinsed, dried (12 h) and finally ground with a pestle and mortar. The pre-functionalization process caused the addition of carboxylic and hydroxyl groups to the nanotube surface. These groups were added to improve the compatibility with substrates and the media. The procedure was done by adding a 68% w/w HNO3 solution to pre-functionalized CNTs, submitted to sonication and stirring at 400 rpm at 80 °C for 2 h. The final suspension was filtered, rinsed, and dried (16 h). The resultant nanotubes were milled in a mortar and sieved with a 125 µm sieve.

2.3. Synthesis of TiO2–CNT Nanostructures

The synthesis was based on the sol–gel technique [28] using the previous fCNTs (150.0 mg), titanium isopropoxide as a precursor (0.6 mL), and isopropanol as a solvent (18.2 mL), with acetic acid and deionized water. The fCNTs were suspended into half the volume of isopropanol and sonicated for 30 min. A solution of titanium precursor and quarter the volume of isopropanol was prepared. The solution was dropped over half the volume of the fCNT suspension with constant stirring at 600 rpm. Then, a solution of the remaining isopropanol and deionized water was sonicated for 10 min and dropped into the main solution. The reaction was continued with the same parameters of stirring and temperature for 2 h. The suspension was left to age for 20 days at room temperature. The solvent was evaporated at 80–88 °C and washed three times with deionized water, letting it evaporate. The resultant precipitate was dried under vacuum at 80 °C for 4 h, followed by a thermal treatment at 500 °C in argon atmosphere for 2 h. The final substance was milled to obtain a thin powder.

2.4. Material Characterization

The TEM images were obtained in a JEOL 1220 microscope with an accelerating voltage of 100 kV. The samples were prepared using a wet suspension technique with an ethanol/water (70% v/v) solution. The FTIR spectra were obtained in a Nicolet iS10 FTIR spectrometer (Peabody, MA USA). The samples were prepared in KBr pills. The frequency range was from 4000 to 400 cm−1 with 64 sweeps at 2-cm−1 resolution. X-ray diffraction patterns were obtained in a SIEMENS D5005 diffractometer (Radeberg, Germany) with a 1.54178-Å wavelength in the range of 2θ = 10° to 80° with a rate of 0.02°/0.52 s. Zeta potential was determined for samples of fCNTs and TiO2–fCNTs. The measurements were done in an aqueous suspension of carbon nanotube samples with distilled water as the solvent. The environmental conditions of the analysis were a temperature of 24.1 °C and a humidity of 45.7%. Both samples were submitted to five measurement runs. From these data, we calculated the mean and standard deviation values from the zeta potential and half-width of the peaks.

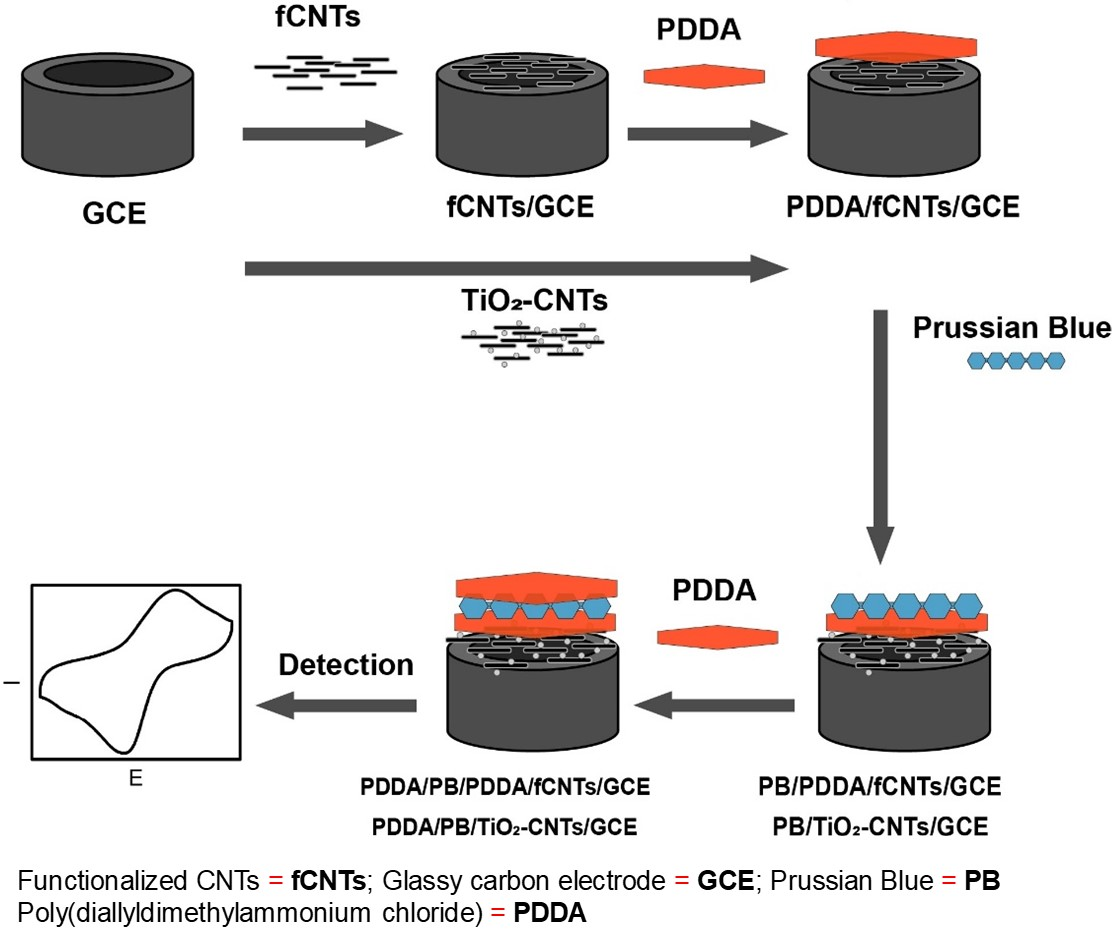
2.5. Electrode Modification

The GC electrode surface is highly reactive, and impurities or different modifications could result in variations in its electrochemical activity [29]. These variations rely on the starting electrode surface. The most common electrode pretreatment to acquire reliable results is polishing. The polishing treatment removes the impurities and residues of the GC surface. The GC electrode of this work went through a polishing treatment each time it was modified. The treatment consisted of two processes: alumina polishing and electrochemical polishing. The GC electrode surface was polished with a polishing cloth in an aqueous slurry of 1 µm, 0.3 µm, and 0.05 µm of alumina powder performing eight-shaped motions for 5 min. After cleaning, the electrode was rinsed with distilled water, and then the GC electrode was assembled in a three-electrode cell containing 25 mL of 0.1 mol∙L−1 HNO3. The electrode was submitted to 50 cyclic voltammetry cycles from −1 V to 1 V at a scan rate of 100 mV∙s−1 with a negative initial polarization.
Functionalized CNTs were dispersed in DMF in a concentration of 5 mg∙mL−1, while TiO2–fCNTs were suspended in SDS at the same concentration as above. Both suspensions were placed in 1.5-mL tubes and sonicated for 10 min. Then, 10 μL of the fCNT and TiO2–fCNT dispersions were dropped onto the bare GC electrode to prepare the fCNT/GC and TiO2–fCNT/GC modified electrodes, respectively. The suspensions droplet must be uniformly dispersed over the electrode surface. The electrodes were dried at 50 °C for 15 min. Then, 10 µL of PDDA solution was dropped onto the fCNT/GC modified electrode surface and dried at 50 °C for 15 min. The suspension droplet was uniformly dispersed over the electrode surface. PDDA was not dropped onto the TiO2–fCNT/GC modified electrode surface. This was due to the different surface charge exhibited by the TiO2–fCNTs.

2.6. Electrodeposition and Activation of Prussian Blue at the Modified Electrode and HRP Immobilization at Modified Electrodes

A Prussian blue layer was deposited via the chronoamperometry technique onto the fCNT/GC and TiO2–fCNT/GC modified electrodes [30]. Electrodeposition was done by applying a constant potential of 0.4 V for 60 s, in a solution containing 2.5 mmol∙L−1 K3[Fe(CN)6] + 2.5 mmol∙L−1 FeCl3. After deposition, the PB film was activated in the 0.1 mol∙L−1 KCl + 0.1 mol∙L−1 HCl supporting electrolyte solution, which was used for film growth, by cycling the applied potential in a range of −0.2 to 0.8 V at a scan rate of 50 mV∙s−1.
A final layer of 10 µL of PDDA was dropped onto the modified electrodes surface and dried at 50 °C for 15 min [31,32]. After the last PDDA layer was placed and the whole modification was complete, the PDDA/PB/PDDA–fCNT/GC electrode was obtained. The final electrode arrangement was rinsed twice with distilled water. The whole modification process of the electrode is summarized in Scheme 1.
Finally, 10 μL of HRP (20 mg∙mL−1 in 0.1 mol∙mL−1 phosphate-buffered saline, pH 6.8) solution was dropped onto the modified electrode surface. The modified electrodes were stored at 4 °C for future use.

2.7. Electrochemical Characterization

Cyclic voltammetry (CV) and chronoamperometry experiments were performed with an electrochemical workstation CH-Instruments (Ch-instruments model 604 A Potentiostat). A conventional three-compartment electrochemical cell was employed with a modified GC electrode as the working electrode, graphite as the auxiliary electrode, and Ag/AgCl (saturated KCl) as the reference electrode from Bioanalytical Systems (BAS). The electrochemical behavior was investigated in PBS (pH 7). The CV was run over 20 cycles to reach stability of the electrode, i.e., where the current response did not change after a cycle.

2.8. Peroxide Detection

The electrocatalytic behavior of H2O2 at the modified electrodes was tested by chronoamperometry. Chronoamperometric measurements were carried out under stirred phosphate-buffered solution (0.1 mol∙L−1 phosphate-buffered solution, pH 7). In chronoamperometry, the current was monitored at a constant potential, while aliquots of H2O2 were injected into the pH 7.0 buffer every 40 s. Chronoamperometry was performed at different constant potentials, such as −0.2, −0.1, and 0 V vs. Ag/AgCl (saturated KCl).

3. Results and Discussion

3.1. Nanomaterial Characterization

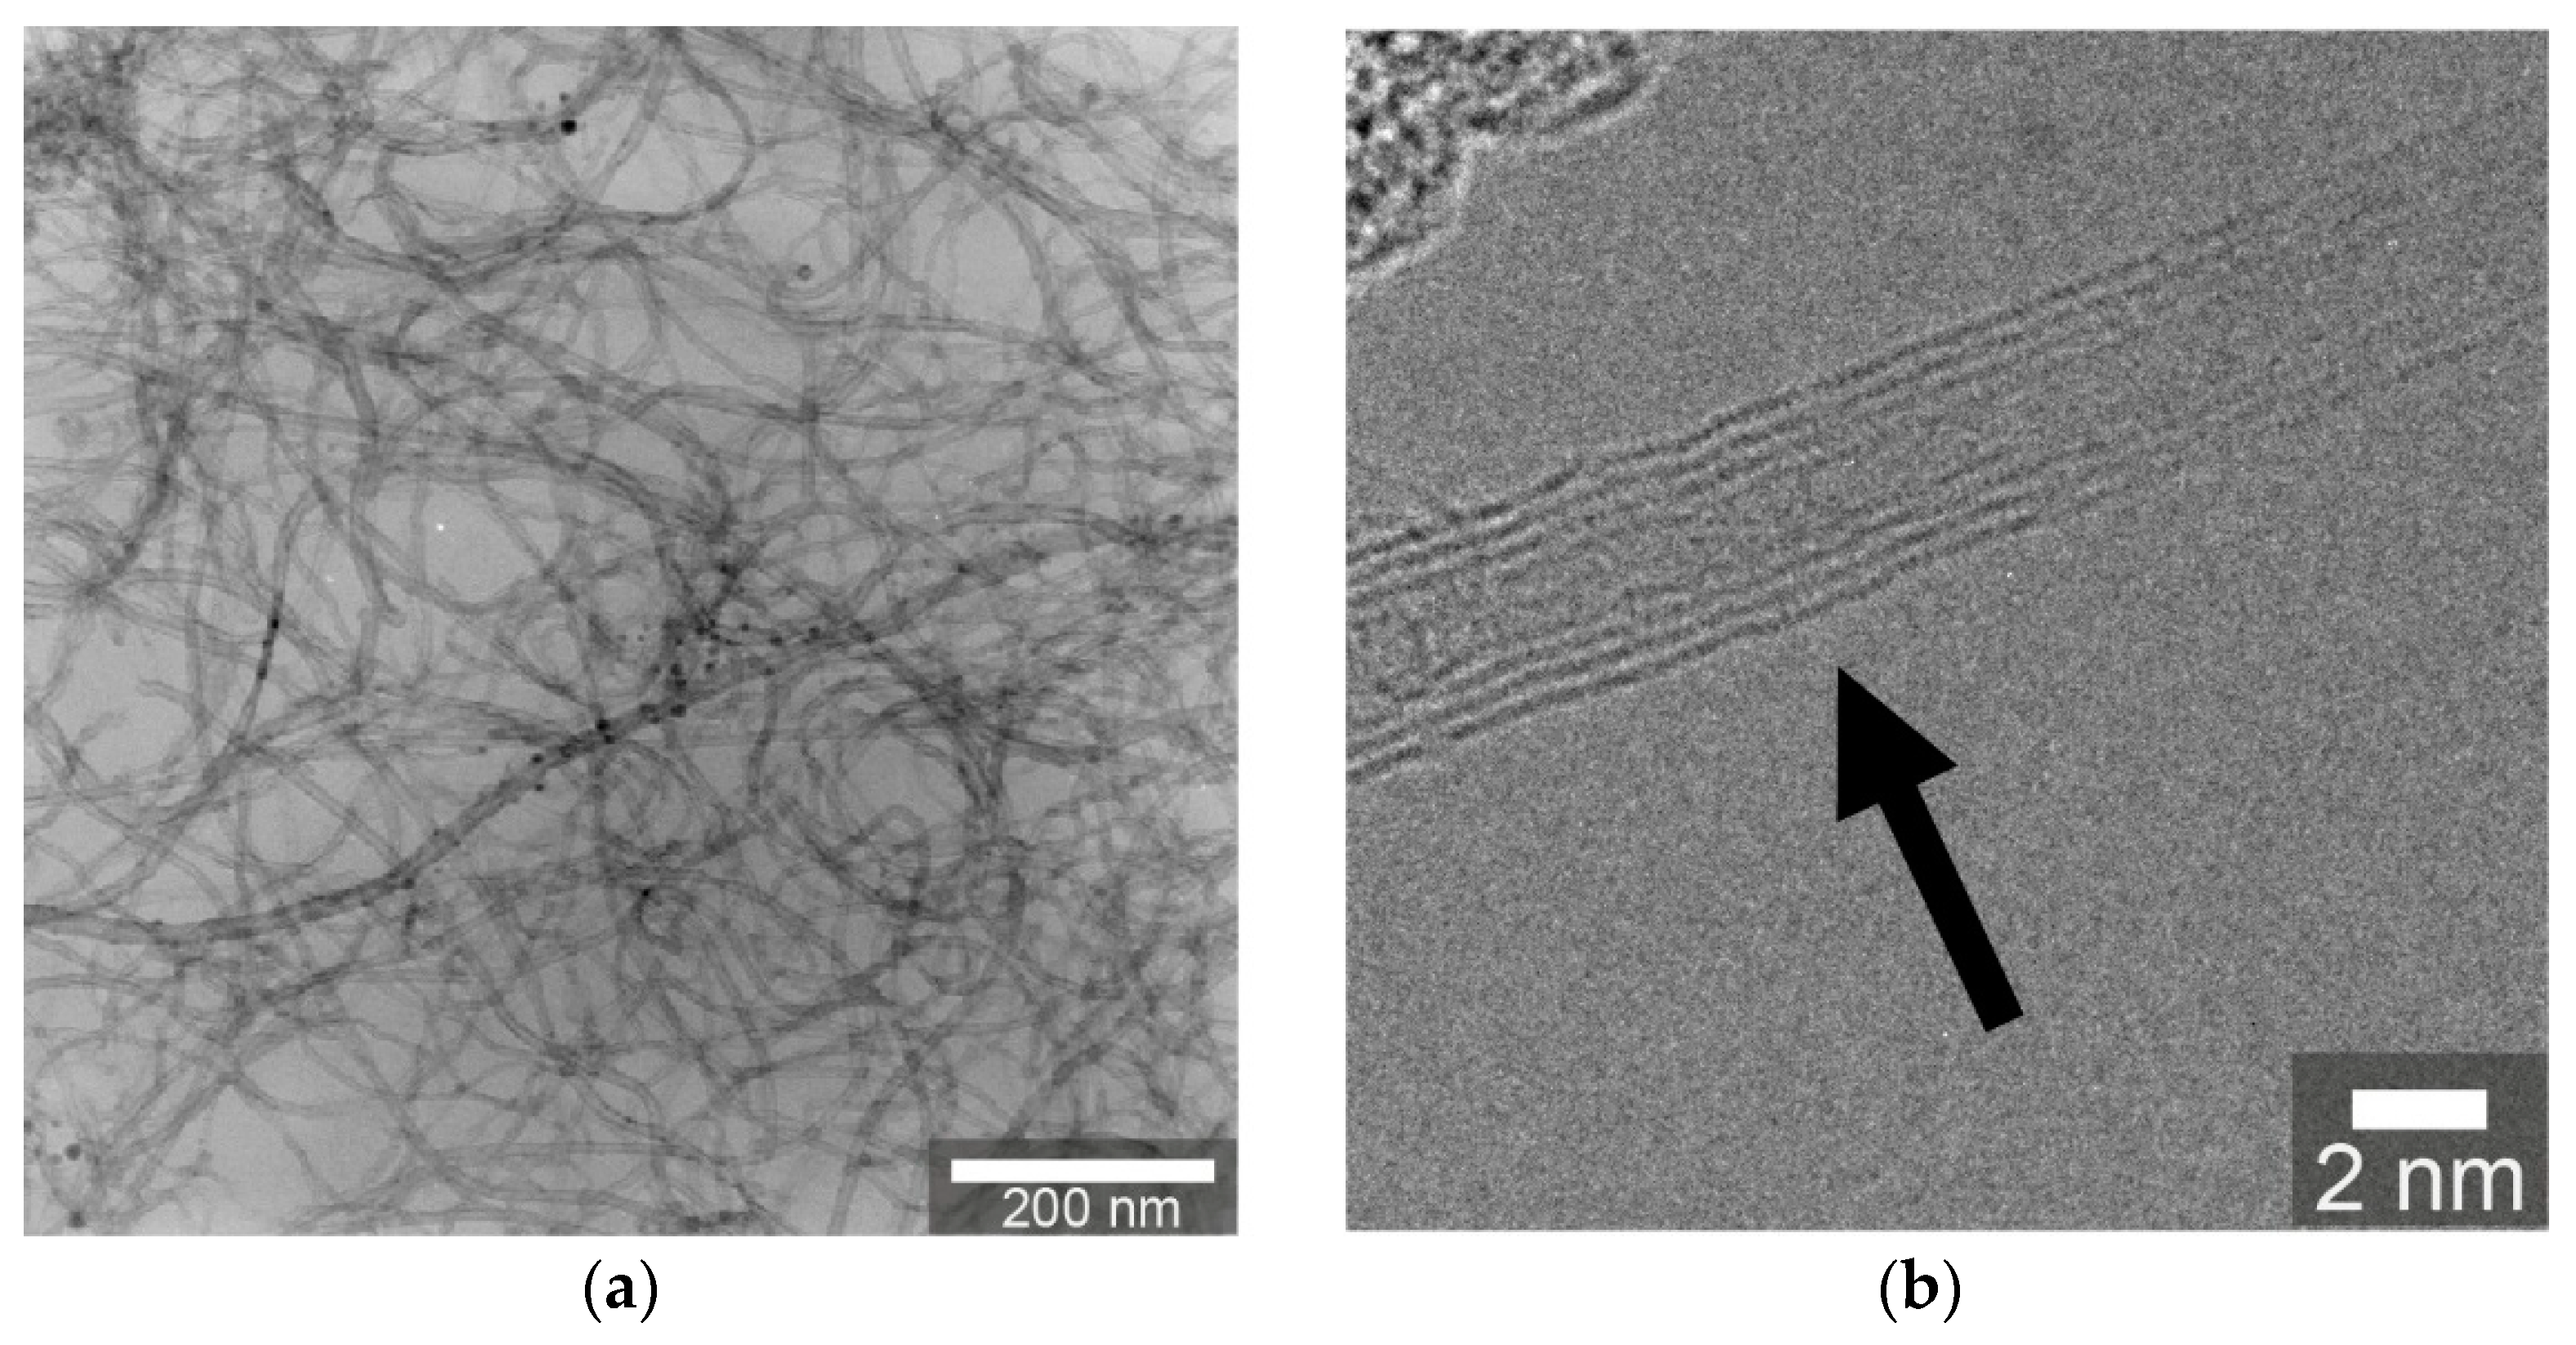
3.1.1. Transmission Electron Microscopy (TEM)

Figure 1a exhibits the TEM images of functionalized CNTs. The shades on different sections of the image and the apparent change in gray tone indicate the bundling of the nanotubes over themselves. The mean diameter value of fCNTs was 5 ± 2 nm. In the literature, the value of wall separation distance of MWCNTs is around 0.34 nm [33]; thus, the nanotubes were around 4–10 layers thick. Figure 1b exhibits a multi-walled carbon nanotube, where approximately four walls can be seen with a diameter of 3 nm, supporting the previous calculation and the wall distance assumption. TiO2–fCNT nanostructure morphologies are displayed in Figure 2. In these images, titanium nanoparticles can be observed to be adhered onto the nanotube wall surface. The adhesion of the NPs is assumed to occur mainly via van der Waals interaction over the available functional groups from the previous functionalization; thus, NPs are not uniformly distributed over the nanotube surface. In some places, nanoparticles agglomerate over surfaces with higher numbers of functional groups and over the crossing of nanotubes, as shown in Figure 2b. The tendency to agglomeration is due to the high surface energy of titania nanoparticles; nevertheless, defined nanoparticles can still be seen. The particle sizes of the nanoparticles were measured from some TEM images, giving a mean value of 6.1 ± 1.3 nm. This value was close to the nanotube diameter.

3.1.2. X-ray Diffraction (XRD)

Figure 3 shows the XRD analysis of TiO2–fCNTs (a) and fCNT (b) nanomaterials. The fCNT spectrum exhibited the characteristic 002 and 100 planes of graphite in nanotubes. These peaks were located at 2θ 26° and 43°, respectively. The 002 plane and its location indicate the interplanar distance of the nanotube layers. With θ002 = 26 and according to Braggs law, the interplanar distance was 3.43 Å. This calculation was done according to the previous assumption of the layer number calculation. The TiO2–fCNT diffractogram (Figure 3) shows the characteristic peaks at 26°, 38°, 48°, 54°, and 63° corresponding to the anatase crystalline phase [34]. Applying Scherrer’s equation [35], the average crystal size of the anatase nanoparticles was about 6.3 nm. This value was consistent with the particle size measured from the TEM images. Qualitatively, the anatase peaks were shown to be broad, which indicates the formation of crystals at the nanometric scale. The main peak of the 002 plane of fCNTs overlapped with the 101 plane of anatase in the TiO2–fCNT material.

3.1.3. Fourier-Transform Infrared (FTIR) Spectroscopy

Figure 4 shows the FTIR spectra of (a) TiO2–fCNTs and (b) fCNTs. The TiO2–fCNT nanomaterial exhibited a band between 900 and 400 cm−1. This band refers to the Ti–O–Ti bond and proves the presence of titania, while this band was absent in the fCNT spectrum. Additional peaks were present along the spectra at 3433 cm−1, 3126 cm−1, 1388 cm−1, and 1061 cm−1. The fCNT spectrum exhibited a broad peak at 3280 cm−1, which is characteristic of the O–H stretching of a hydroxyl group and refers to the oscillation of carboxyl groups [36], equivalent to the 3433 and 3126 cm−1 peaks in the TiO2–fCNT spectrum. The peak at 2910 cm−1 refers to the methylene stretching band assumed to be groups located at defect sites in the CNT sidewalls [37], while the 1388 cm−1 peak could be attributed to rocking and bending of the –CH group due to possible hydrogenation in the functionalization process. C–O bands were observed in both spectra at 1061 cm−1, characteristic of carboxyl functional groups.
Functionalized CNTs and TiO2–fCNTs were characterized in a previous work by Albano [38] via N2 adsorption and Brunauer-Emmett-Teller (BET) area. In both cases, their results showed mesoporous structures with non-uniform pore sizes independent of fCNT quantity. In superficial area analysis, they showed an area of 298.40 ± 2.72 m2/g in the fCNTs, while, for TiO2–fCNTs, the area was 147.02 ± 1.89 m2/g. The presence of nanoparticles reduced the superficial area of the sample with respect to the fCNTs, due to the coverage of the TiO2 NPs on the CNT walls.

3.1.4. Zeta Potential

Zeta potential characterization was done over nanotube samples, in order to analyze the charge over the electrical double layer. A potential difference was applied over the CNT suspensions to vary the mobility of the particles. This mobility provided information on the charge they present. The applied potential controlled the electrostatic interactions of the nanotubes and the solvent and, therefore, their colloidal stability [39]. Figure 5a shows the zeta potential curve of fCNTs in an aqueous solution. The mean value of the zeta potential was −51.84 mV with a standard deviation of 9.66 mV. Figure 5b shows the plot of the zeta potential measured from the TiO2–fCNT sample with a mean value of 9.93 mV and a standard deviation of 0.73 mV. The standard deviation values were calculated from five repeated measurements in the same conditions for both samples. In the functionalized CNTs, the previous acidic treatment over the pristine carbon nanotubes added carboxylic (–COOH) and hydroxyl groups (–OH) to their walls; thus, the negative charge was due to the deprotonation of the functional groups, and the fCNTs could be considered strongly anionic. According to Clogston and Patri [40], nanoparticles with values greater than ±30 mV are considered strongly cationic or anionic, while values within ±10 mV are considered neutral. In the TiO2–fCNT sample, the nanoparticles were attached to the functional groups as evidenced above, neutralizing the charge of the nanotubes and giving the sample a slightly positive charge. According to Patri et al. [40], TiO2–fCNTs can be considered neutral. Knowing the charge of the CNTs is essential for understanding the interaction between the particle and solvent and for predicting colloidal stability. The dispersion of the nanotubes plays a key role in the modification of the electrode surface. The selection of a solvent is quite a delicate issue depending on the charge of the nanotubes. Specific differences in CNT dispersion arise from the geometry and polarity of the solvent molecules or the solubility of the polymer [41]. As we can observe, if the charge of the samples differs, the solvent in which the carbon nanotubes are suspended is also different. DMF is a typical solvent for carbon nanotubes, and it was selected to suspend the fCNTs. The suspension presented stability after a few minutes of sonication due to the CNTs not spontaneously dispersing, as they required an input of energy to achieve dispersion. The interaction of the solvent molecules with the nanotubes involved weak polar forces and van der Waals interactions. The DMF molecule is planar and provides a better engagement through van der Waals interactions with the nanotube surface. The TiO2–fCNT sample presented a different charge than the fCNTs and required a different solvent. Vaisman et al. [42] explained the use of surfactants to disperse nanotubes depending on their charge and the type of surfactant. The selection of the surfactant depends on the charge that the CNTs exhibit. The TiO2–fCNT sample was dispersed in a solution of SDS. SDS is an anionic surfactant with a sulfate group at its head, which gives it the amphiphilic properties. SDS debundles nanotubes through steric and electrostatic interactions. The anionic head of the surfactant molecule tends to attach to the nanotube walls and to be adsorbed over the forming micelles, providing colloidal stabilization.

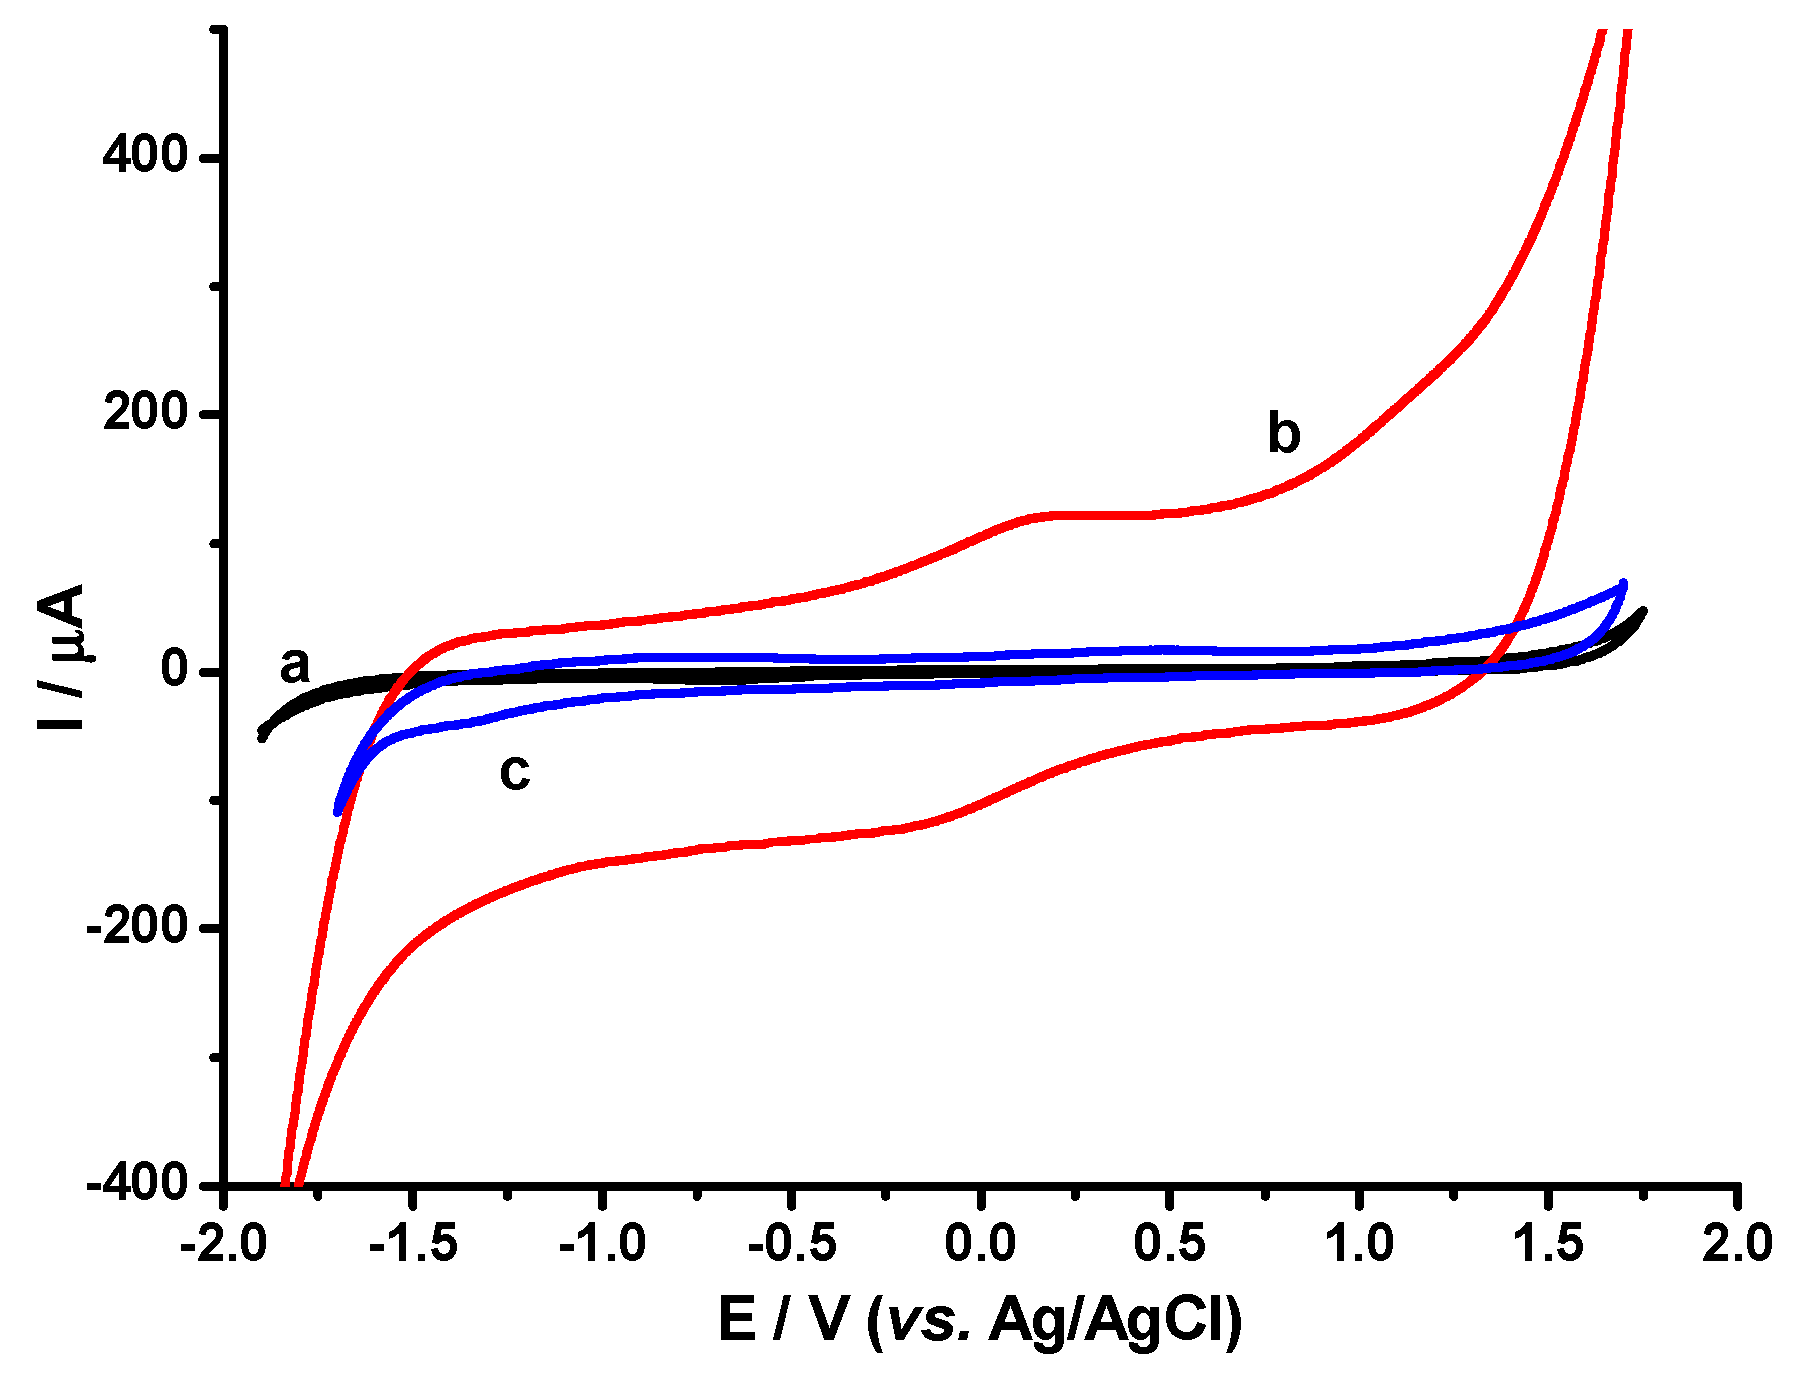
3.1.5. Cyclic Voltammetry (CV)

Figure 6 shows the cyclic voltammograms (CVs) at the GC electrode, fCNT/GC, and TiO2–fCNT/GC modified electrodes in 0.1 mol∙L−1 phosphate-buffered solution at pH 7. At the GC electrode, Figure 6a does not exhibit any oxidation/reduction reaction in the electrolytic medium and very low non-faradaic current is shown in this potential region, exhibiting an almost flat current response. The addition of fCNTs to the GC electrode (Figure 6b) showed a strong increment of the non-faradic current with respect to the bare electrode. The non-faradaic current does not involve any electron transfer; it only causes the accumulation of electric charges as potential is applied [43]. This result shows that functionalized CNTs exhibit a highly capacitive ability. On the other hand, the presence of peaks at 0–0.3 V meant that there was at least a reaction associated with the oxidation and reduction of the –OH and –COOH functional groups, leading to the formation of quinones around the surface of the nanotubes. When the GC electrode was modified with TiO2–fCNTs (Figure 6c), the signal was similar with respect to the bare GE. There were no signals associated with electroactive species, and the non-faradaic current was a little higher with respect to the fCNT/GC modified electrode, suggesting that modified nanotubes do not exhibit capacitive properties as sturdy as functionalized ones. The lack of the pair of peaks around 0 and 0.3 V presented in the fCNT/GC modified electrode confirmed the results obtained by the zeta potential studies, whereby a chemical interaction was present between the TiO2 nanostructures and the –OH and –COOH functional groups previously generated with the acidic treatment over the pristine carbon nanotubes.
The electrochemical behavior of the modified electrodes, i.e., PB–fCNT/GC and PB–TiO2/fCNT/GC, was monitored by cyclic voltammetry experiments (Figure 7). At both electrodes, two pairs of redox waves appeared, and the cyclic voltammetry results were in agreement with the literature [44,45]. The pair of peaks between +0.09 and +0.25 V (when reduced to Prussian white) resulted from the redox reactions of low-spin Fe(CN)63−/4−, and another pair of peaks, appearing between +0.77 and +0.92 V (when oxidized to Prussian yellow) corresponded to electrochemical reactions of high-spin Fe3+/2+ [44,46]. In a reversible reaction, ∆E must be constant and independent of the scan rate, with a value close to 0.059 V, and the Ipa/Ipc peack ratio must be equal to 1. In this way, at the PB–fCNT/GE modified electrode, in the reduction zone, the peak ratio was 0.58, which indicates non-complete reversibility at the electrode, while ∆E was +0.21 V, showing a higher resistance produced by the layers; in the oxidation zone, the peak ratio was +0.38, and ∆E was +0.13 V. The PB–TiO2/fCNT/GC modified electrode, in the reduction zone, displayed an Ipa/Ipc ratio of 0.8, and the ∆E was +0.35 V; in the oxidation zone, the Ipa/Ipc ratio was +1.4, and the ∆E was 0.1 V. The values obtained on the modified electrodes predicted the quasi-reversible reaction processes of the PB at the electrode surfaces. For both modified electrodes, the redox peak potentials were dependent on scan rate (not shown). It was observed that the values of Epa and Epc shifted slightly in the positive and negative directions, respectively, whereas the ΔEp increased with the increase in scan rate, but E1/2 was almost independent of the scan rate. The anodic and cathodic peak currents were linearly proportional to the scan rate up to 350 mV∙s−1 (not shown), suggesting that the electrochemical behavior of PB for both composite films (fCNT and TiO2/fCNT) was not a diffusion-controlled process but a typical surface-controlled one. Based on the Laviron theory [47,48], the electron transfer rate constant (ks) was determined for modified electrodes in the phosphate-buffered solution by measuring the variations of the peak potentials of the anodic and cathodic peaks at different scan rates, when ΔEp was larger than 100/n mV. Assuming n = 4, the calculated values for ks were 0.027 s−1 at the PB–fCNT/GC modified electrode and 4.7 × 10⁻⁴ s−1 at the PB–TiO2/fCNT/GC electrode, suggesting that, on the PB–TiO2/fCNT/GC modified electrode, the electronic transfer was improved. The surface concentration (Гc) of electroactive species at the modified electrodes was evaluated from the slope of Ip/A versus ν , in which A is the surface area, according to following equation [49]:
I p = n 2 F 2 A ν   Г c 4 R T .
The average value of Гc for the redox peaks was 4.98 × 10⁻⁹ mol∙cm−2 and 4.72 × 10⁻⁹ at the PB–fCNT/GC and PB–TiO2/fCNT/GC modified electrodes, respectively (for n = 4 and v < 1000 mV∙s−1). The similarity in the values obtained suggests that TiO2 was responsible for improving the electronic transfer on the electrode.

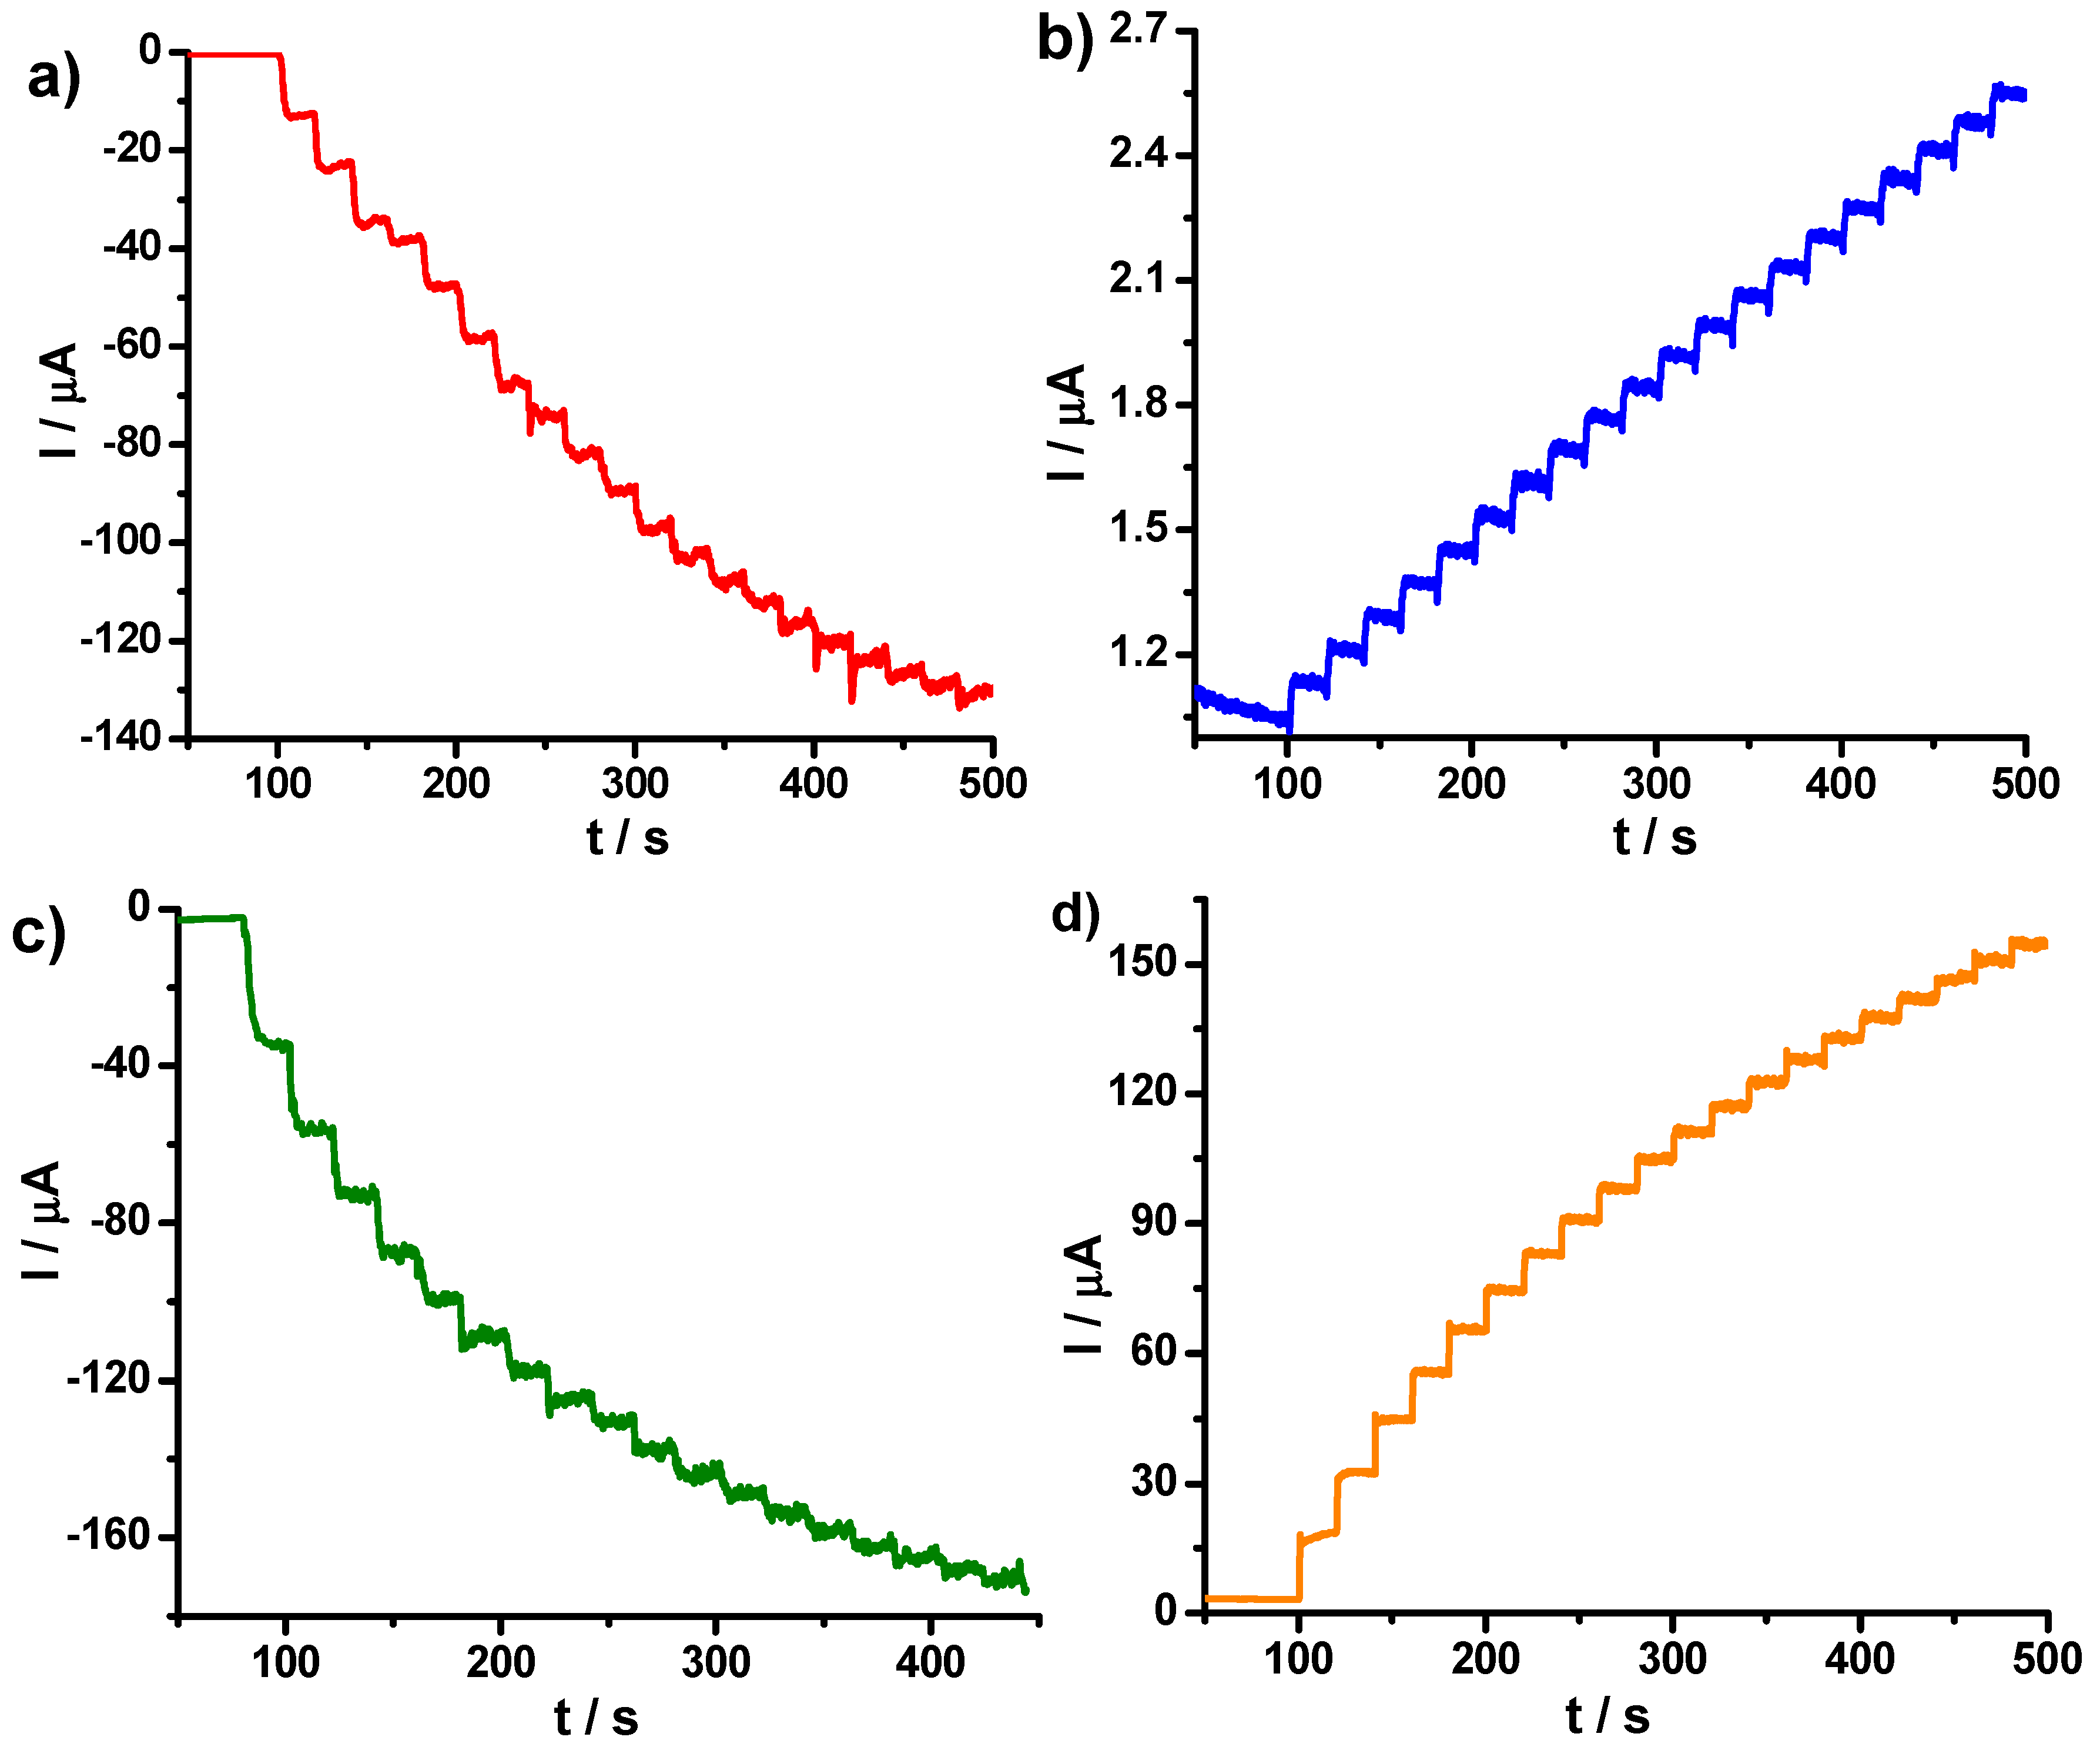
3.2. Electrochemical Performances of the PB–fCNT/GC and PB–TiO2/fCNT/GC Modified Electrodes toward Hydrogen Peroxide

Figure 8 shows the cyclic voltammograms of H2O2 at the PB–TiO2/fCNT/GC electrode, in the zone of PB redox reactions of low-spin Fe(CN)63−/4−, Figure 8a, and the zone of PB redox reactions of high-spin Fe3+/2+, Figure 8b. The literature reports [44] that, at the bare electrode, H2O2 starts to oxidize only above +0.9 V and starts to reduce below −0.1 V, while no redox peaks can be seen within the applied potential. In contrast, at the PB–TiO2/fCNT/GC modified electrode, a cathodic response and an anodic response to H2O2 started to occur at +0.2 V and +0.7 V, respectively. Both zones of the PB film voltammogram showed a marked decrease in the reverse redox currents and a large increase in the forward redox currents, demonstrating that the electrocatalytic reduction of hydrogen H2O2 was effective in both zones. The corresponding cyclic voltammograms indicated that two pairs of redox peaks of the PB film catalyzed independently of the oxidation and reduction of H2O2. The redox peaks at +0.93 V exhibited an electrocatalysis toward the oxidation of H2O2, while the redox peaks at +0.1 V catalyzed the reduction of H2O2. Cyclic voltammograms of H2O2 at the PB–fCNT/GC electrode (not shown) also showed that this modified electrode could catalyze both oxidation and reduction.
The chronoamperometric detection of H2O2 at the PB–TiO2/fCNT/GC electrode was performed at constant potentials of 0 V (Figure 9a) and +1 V (Figure 9b). The current response was linear for H2O2 concentrations in the range of 0.5 to 4.3 mmol∙L−1 (y = −10.428x − 94.82, R2 = 0.997) and 0.04 to 0.9 mmol∙L−1 (y = 0.0002x + 3 × 10⁻⁵, R2 = 0.991). The quantification limit (LQ) was 0.29 mmol∙L−1, and the detection limit (LD) was 0.088 mmol∙L−1 in the oxidation zone, while, in the reduction zone, the LQ was 0.31 mmol∙L−1, and the LD was 0.092 mmol∙L−1. According to these results, the PB–TiO2/fCNT/GC modified electrode can be used to detect peroxide both in the reduction zone and in the oxidation zone. The chronoamperometric detection of H2O2 at the PB-fCNT/GC, at constant potentials of 0.0 V and +1 V, is shown in Figure 9c,d, respectively. The current response was linear for H2O2 concentrations in the range of 0.05 to 0.8 mmol∙L−1 (y = −163.01x − 8.5347, R2 = 0.992) and 0.05 to 0.9 mmol∙L−1 (y = 1.66x − 1.05, R2 = 0.997). An LQ of 0.079 mmol∙L−1 and an LD of 0.024 mmol∙L−1 were obtained in the oxidation zone, while the LQ was 0.051 mmol∙L−1, and the LD was 0.015 mmol∙L−1 in the reduction zone. According to these results, the PB–fCNT/GC electrode showed a better LD and LQ than the PB–TiO2/fCNT/GC electrode. However, at the PB–fCNT/GC electrode, the potential affected the stability of the PB film. The PB film was very unstable at the potentials used. Therefore, the PB–TiO2/fCNT/GC modified electrode was considered best for H2O2 detection in terms of operability.
To investigate the reproducibility of the modified electrodes, 10 electrodes made with independently the same electrode showed acceptable reproducibility with a relative standard deviation average of 3.6% for the current determined at 2 mol∙L−1 H2O2. When the modified electrodes were not in use, they were stored in PBS (pH 7.0) at 4 °C. To examine the long-term storage stabilities, the voltammetric responses of the modified electrodes to 2 mol∙L−1 H2O2 were monitored with respect to the storage time every five days. After a 30-day storage period, the PB–TiO2/fCNT/GC electrode still retained 80% of its initial current response to H2O2 which indicated that the enzyme electrode had good stability, while the PB–fCNT/GC electrode only retained 15% of its initial current response to the analyte.

3.3. Electrochemical Performance of TiO2/fCNT/GC Modified Electrode as an Enzyme-Based Electrochemical Biosensor

The TiO2/fCNT/GC modified electrode was also employed as the basis for designing H2O2 biosensors through further modification with HRP immobilized at the TiO2/fCNT film. The chronoamperometric responses obtained at the HRP–TiO2/fCNT/GC electrode following successive additions of H2O2 are shown in Figure 10a. The HRP biosensor exhibited a very fast response to H2O2, reaching about 90% of the steady-state signal within 10 s. This biosensor was able to detect H2O2, exhibiting a linear range of response (r = 0.9997, n = 5) between 0.5 mmol∙L−1 and 7.5 mmol∙L−1, according to the following equation: y = −9.63x + 17.06 (Figure 10b). The biosensor showed a limit of quantification of 2.69 mmol∙L−1 and a detection limit of 0.81 mmol∙L−1 at a signal-to-noise ratio of 3. The electrocatalytic performance of the HRP–TiO2/fCNT/GC electrode toward the reduction of H2O2 was investigated by cyclic voltammetry. Figure 10c shows the CV behaviors of the HRP–TiO2/fCNT/GC modified electrode before (a) and after (b) the chronoamperometric test (50 cycles), where it can be observed that the voltammetric currents did not change, suggesting the high stability of the enzymatic electrode. In comparison with other HRP–fCNT-based electrochemical biosensors previously described in the literature, it should be noted that the HRP–fCNT/GC modified electrode presented in this paper did not show an electroanalytical response toward H2O2.

3.4. Comparison of Results with Previous Sensors Published in the Literature

Table 1 shows a comparison between PB–fCNT/GC and HRP–TiO2/fCNT/GC electrodes and other electrodes reported in in the literature. It can be seen that our results are in line with other reports, suggesting that this electrode coating can be used to sense H2O2.

4. Conclusions

An electrochemical sensor, PB–TiO2/fCNT/GC, and an electrochemical biosensor, HRP–TiO2/fCNT/GC, for H2O2 detection were efficiently designed with MWNT modified GC electrodes. Calculated values for ks were greater at the PB–fCNT/GC electrode than at the PB–TiO2/fCNT/electrode, suggesting that TiO2 at the fCNT/GC modified electrode improved the electronic transfer due to the characteristics of TiO2. In addition, Γ values were equal for both modified electrodes (PB–fCNT/GC and TiO2/fCNT/GC). The PB–TiO2/fCNT/GC modified electrode was considered the best for H2O2 detection in terms of operability, while HRP–TiO2/fCNT/GC modified GC electrodes showed an electroanalytical response toward H2O2.The results demonstrated that the nanostructured environment of the TiO2-based film was a suitable matrix for the immobilization of HRP to retain its activity. The long-term stability of the HRP–TiO2/fCNT/GC modified electrode was attributed to the excellent biocompatibility of the nanostructured TiO2.

Author Contributions

Conceptualization, P.J.E.-M., L.F., and G.G.; methodology. P.J.E.-M., L.F., G.G., and A.D.B.; validation, L.A.G. and M.M.-J.; formal analysis, G.G. and R.U.; investigation, L.A.G., G.G., L.F., M.M.-J., and P.J.E.-M.; resources, P.J.E.-M., G.G., A.D.B., and R.U.; data curation, L.A.G. and M.M.-J.; writing—original draft preparation, L.A.G., L.F., G.G., and P.J.E.-M.; writing—review and editing, L.F. and P.J.E.-M.; visualization, G.G. and P.E.-M.; supervision, L.F., G.G., and P.J.E.-M.; project administration, P.J.E.-M.; funding acquisition, G.G. and P.J.E.-M. All authors have read and agreed to the published version of the manuscript.

Funding

This research was funded by CEDIA (Corporación Ecuatoriana para el Desarrollo de la Investigación y la Academia) through the project “Biosensores basados en Nanotubos de carbono modificados” code CEPRA XII-2018-14, Biosensores and Pontificia Universidad Católica del Ecuador, Quito-Ecuador; Elemento PEP: QINV0126.

Acknowledgments

The authors would like to thank CEDIA (Corporación Ecuatoriana para el Desarrollo de la Investigación y la Academia), Universidad Yachay Tech, Escuela Politécnica Nacional, and Pontificia Universidad Católica del Ecuador.

Conflicts of Interest

The authors declare no conflict of interest.

References

  1. Bhat, S.; Kumar, A. Biomaterials and Bioengineering Tomorrow’s Healthcare. Biomatter 2013, 3, e24717. [Google Scholar] [CrossRef] [PubMed] [Green Version]
  2. Wang, J. Carbon-Nanotube Based Electrochemical Biosensors: A Review. Electroanal. 2005, 17, 7–14. [Google Scholar] [CrossRef]
  3. Eatemadi, A.; Daraee, H.; Karimkhanloo, H.; Kouhi, M.; Zarghami, N.; Akbarzadeh, A.; Abasi, M.; Hanifehpour, Y.; Joo, S.W. Carbon Nanotubes: Properties, Synthesis, Purification, and Medical Applications. Nanoscale Res. Lett. 2014, 9, 393. [Google Scholar] [CrossRef] [PubMed] [Green Version]
  4. Stobbe, S.; Lindelof, P.E.; Nygård, J. Integration of Carbon Nanotubes with Semiconductor Technology: Fabrication of Hybrid Devices by III-V Molecular Beam Epitaxy. Semicond. Sci. Technol. 2006, 21, S10–S16. [Google Scholar] [CrossRef] [Green Version]
  5. Maehashi, K.; Katsura, T.; Kerman, K.; Takamura, Y.; Matsumoto, K.; Tamiya, E. Label-Free Protein Biosensor Based on Aptamer-Modified Carbon Nanotube Field-Effect Transistors. Anal. Chem. 2007, 79, 782–787. [Google Scholar] [CrossRef]
  6. Kauffman, D.R.; Kuzmych, O.; Star, A. Interactions between Single-Walled Carbon Nanotubes and Tetraphenyl Metalloporphyrins:  Correlation between Spectroscopic and FET Measurements. J. Phys. Chem. C 2007, 111, 3539–3543. [Google Scholar] [CrossRef]
  7. Bottini, M.; Cerignoli, F.; Dawson, M.I.; Magrini, A.; Rosato, N.; Mustelin, T. Full-Length Single-Walled Carbon Nanotubes Decorated with Streptavidin-Conjugated Quantum Dots as Multivalent Intracellular Fluorescent Nanoprobes. Biomacromolecules 2006, 7, 2259–2263. [Google Scholar] [CrossRef]
  8. Du, D.; Huang, X.; Cai, J.; Zhang, A.; Ding, J.; Chen, S. An Amperometric Acetylthiocholine Sensor Based on Immobilization of Acetylcholinesterase on a Multiwall Carbon Nanotube—Cross-Linked Chitosan Composite. Anal. Bioanal. Chem. 2007, 387, 1059–1065. [Google Scholar] [CrossRef]
  9. Wang, J.; Lin, Y. Functionalized Carbon Nanotubes and Nanofibers for Biosensing Applications. Trends Analyt. Chem. 2008, 27, 619–626. [Google Scholar] [CrossRef] [Green Version]
  10. Montes, R.; Céspedes, F.; Baeza, M. Highly Sensitive Electrochemical Immunosensor for IgG Detection Based on Optimized Rigid Biocomposites. Biosens. Bioelectron. 2016, 78, 505–512. [Google Scholar] [CrossRef]
  11. Montes, R.; Bartrolí, J.; Baeza, M.; Céspedes, F. Improvement of the Detection Limit for Biosensors: Advances on the Optimization of Biocomposite Composition. Microchem. J. 2015, 119, 66–74. [Google Scholar] [CrossRef]
  12. Gong, K.; Yan, Y.; Zhang, M.; Su, L.; Xiong, S.; Mao, L. Electrochemistry and Electroanalytical Applications of Carbon Nanotubes: A Review. Anal. Sci. 2005, 21, 1383–1393. [Google Scholar] [CrossRef] [PubMed] [Green Version]
  13. Wang, Z.; Liu, J.; Liang, Q.; Wang, Y.; Luo, G. Carbon Nanotube-Modified Electrodes for the Simultaneous Determination of Dopamine and Ascorbic Acid. Analyst 2002, 127, 653–658. [Google Scholar] [CrossRef] [PubMed]
  14. Huang, M.; Jiang, H.; Zhai, J.; Liu, B.; Dong, S. A Simple Route to Incorporate Redox Mediator into Carbon nanotubes/Nafion Composite Film and Its Application to Determine NADH at Low Potential. Talanta 2007, 74, 132–139. [Google Scholar] [CrossRef]
  15. Liu, H.; Wang, G.; Chen, D.; Zhang, W.; Li, C.; Fang, B. Fabrication of polythionine/NPAu/MWNTs Modified Electrode for Simultaneous Determination of Adenine and Guanine in DNA. Sensors Actuators B Chem. 2008, 128, 414–421. [Google Scholar] [CrossRef]
  16. Li, J.; Qiu, J.D.; Xu, J.J.; Chen, H.Y.; Xia, X.H. The Synergistic Effect of Prussian-Blue-Grafted Carbon Nanotube/Poly(4-Vinylpyridine) Composites for Amperometric Sensing. Adv. Funct. Mater. 2007, 17, 1574–1580. [Google Scholar] [CrossRef]
  17. Rhee, S.G.; Chang, T.S.; Jeong, W.; Kang, D. Methods for Detection and Measurement of Hydrogen Peroxide Inside and Outside of Cells. Mol. Cells 2010, 29, 539–549. [Google Scholar] [CrossRef]
  18. Grisham, M.B. Methods to Detect Hydrogen Peroxide in Living Cells: Possibilities and Pitfalls. Comp. Biochem. Physiol. A Mol. Integr. Physiol. 2013, 165, 429–438. [Google Scholar] [CrossRef]
  19. Karyakin, A.A.; Gitelmacher, O.V.; Karyakina, E.E. A High-Sensitive Glucose Amperometric Biosensor Based on Prussian Blue Modified Electrodes. Anal. Lett. 1994, 27, 2861–2869. [Google Scholar] [CrossRef]
  20. Sajjadi, S.; Keihan, A.H.; Norouzi, P.; Habibi, M.M.; Eskandari, K.; Hadizadeh Shirazi, N. Fabrication of an Amperometric Glucose Biosensor Based on a Prussian Blue/Carbon Nanotube/Ionic Liquid Modified Glassy Carbon Electrode. J. Appl. Biotechnol. Rep. 2017, 4, 603–608. [Google Scholar]
  21. Evans, S.A.G.; Elliott, J.M.; Andrews, L.M.; Bartlett, P.N.; Doyle, P.J.; Denuault, G. Detection of Hydrogen Peroxide at Mesoporous Platinum Microelectrodes. Anal. Chem. 2002, 74, 1322–1326. [Google Scholar] [CrossRef] [PubMed]
  22. Sun, Y.P.; Fu, K.; Lin, Y.; Huang, W. Functionalized Carbon Nanotubes:  Properties and Applications. Acc. Chem. Res. 2002, 35, 1096–1104. [Google Scholar] [CrossRef] [PubMed]
  23. Kang, Y.K.; Lee, O.S.; Deria, P.; Kim, S.H.; Park, T.H.; Bonnell, D.A.; Saven, J.G.; Therien, M.J. Helical Wrapping of Single-Walled Carbon Nanotubes by Water Soluble Poly(p-Phenyleneethynylene). Nano Lett. 2009, 9, 1414–1418. [Google Scholar] [CrossRef] [PubMed]
  24. Xia, H.; Wang, Q.; Qiu, G. Polymer-Encapsulated Carbon Nanotubes Prepared through Ultrasonically Initiated In Situ Emulsion Polymerization. Chem. Mater. 2003, 15, 3879–3886. [Google Scholar] [CrossRef]
  25. Solanki, P.R.; Kaushik, A.; Agrawal, V.V.; Malhotra, B.D. Nanostructured Metal Oxide-Based Biosensors. NPG Asia Mater. 2011, 3, 17. [Google Scholar] [CrossRef]
  26. Han, F.; Kambala, V.S.R.; Srinivasan, M.; Rajarathnam, D.; Naidu, R. Tailored Titanium Dioxide Photocatalysts for the Degradation of Organic Dyes in Wastewater Treatment: A Review. Appl. Catal. A Gen. 2009, 359, 25–40. [Google Scholar] [CrossRef]
  27. Bai, J.; Zhou, B. Titanium Dioxide Nanomaterials for Sensor Applications. Chem. Rev. 2014, 114, 10131–10176. [Google Scholar] [CrossRef]
  28. Gonzalez, G.; Albano, C.; Herman, V.; Boyer, I.; Monsalve, A.; Brito, J.A. Nanocomposite Building Blocks of TiO2-MWCNTf and ZrO2-MWCNTf. Mater. Charact. 2012, 64, 96–106. [Google Scholar] [CrossRef]
  29. Kiema, G.K.; Aktay, M.; McDermott, M.T. Preparation of Reproducible Glassy Carbon Electrodes by Removal of Polishing Impurities. J. Electroanal. Chem. 2003, 540, 7–15. [Google Scholar] [CrossRef]
  30. Karyakin, A.A.; Karyakina, E.E.; Gorton, L. On the Mechanism of H2O2 Reduction at Prussian Blue Modified Electrodes. Electrochem. Commun. 1999, 1, 78–82. [Google Scholar] [CrossRef]
  31. Zhang, M.; Yuan, R.; Chai, Y.; Li, W.; Zhong, H.; Wang, C. Glucose Biosensor Based on Titanium Dioxide-Multiwall Carbon Nanotubes-Chitosan Composite and Functionalized Gold Nanoparticles. Bioprocess Biosyst. Eng. 2011, 34, 1143–1150. [Google Scholar] [CrossRef] [PubMed]
  32. Hobbs, J.M.; Patel, N.N.; Kim, D.W.; Rugutt, J.K.; Wanekaya, A.K. Glucose Determination in Beverages Using Carbon Nanotube Modified Biosensor: An Experiment for the Undergraduate Laboratory. J. Chem. Educ. 2013, 90, 1222–1226. [Google Scholar] [CrossRef]
  33. Kharissova, O.V.; Kharisov, B.I. Variations of Interlayer Spacing in Carbon Nanotubes. RSC Adv. 2014, 4, 30807–30815. [Google Scholar] [CrossRef]
  34. Sharon, M.; Modi, F.; Sharon, M. Titania Based Nanocomposites as a Photocatalyst: A Review. Mater. Sci. 2016, 3, 1236–1254. [Google Scholar] [CrossRef]
  35. Patterson, A.L. The Scherrer Formula for X-Ray Particle Size Determination. Phys. Rev. 1939, 56, 978–982. [Google Scholar] [CrossRef]
  36. Atieh, M.A.; Bakather, O.; Al-Tawbini, B.; Bukhari, A.; Abuilaiwi, F.; Fettouhi, M. Effect of Carboxylic Group Functionalized on Carbon Nanotubes Surface on the Removal of Lead From Water. Bioinorg. Chem. Appl. 2010, 2010, 603978. [Google Scholar] [CrossRef]
  37. do Amaral Montanheiro, T.L.; Cristóvan, F.H.; Machado, J.P.B.; Tada, D.B.; Durán, N.; Lemes, A.P. Effect of MWCNT Functionalization on Thermal and Electrical Properties of PHBV/MWCNT Nanocomposites. J. Mater. Res. 2015, 30, 55–65. [Google Scholar] [CrossRef]
  38. Albano, C.; Sarmiento, Y.; Gonzalez, G. Synthesis and Characterization of Nanostructures: MWCNTf/TiO2 and MWCNTf/TiO2/HAp. Macromol. Symp. 2012, 321–322, 76–79. [Google Scholar] [CrossRef]
  39. Kaszuba, M.; Corbett, J.; Watson, F.M.; Jones, A. High-Concentration Zeta Potential Measurements Using Light-Scattering Techniques. Philos. Trans. A. Math. Phys. Eng. Sci. 2010, 368, 4439–4451. [Google Scholar] [CrossRef] [Green Version]
  40. Clogston, J.D.; Patri, A.K. Zeta Potential Measurement BT—Characterization of Nanoparticles Intended for Drug Delivery; McNeil, S.E., Ed.; Humana Press: Totowa, NJ, USA, 2011; pp. 63–70. [Google Scholar] [CrossRef]
  41. Pramanik, C.; Gissinger, J.R.; Kumar, S.; Heinz, H. Carbon Nanotube Dispersion in Solvents and Polymer Solutions: Mechanisms, Assembly, and Preferences. ACS Nano 2017, 11, 12805–12816. [Google Scholar] [CrossRef]
  42. Vaisman, L.; Wagner, H.D.; Marom, G. The Role of Surfactants in Dispersion of Carbon Nanotubes. Adv. Colloid Interface Sci. 2006, 128–130, 37–46. [Google Scholar] [CrossRef] [PubMed]
  43. Biesheuvel, P.M.; Dykstra, J.E. The Difference between Faradaic and Nonfaradaic Processes in Electrochemistry. arXiv 2018, arXiv:1809.02930. [Google Scholar]
  44. Chi, Q.; Dong, S. Amperometric Biosensors Based on the Immobilization of Oxidases in a Prussian Blue Film by Electrochemical Codeposition. Anal. Chim. Acta 1995, 310, 429–436. [Google Scholar] [CrossRef]
  45. Pan, D.; Chen, J.; Nie, L.; Tao, W.; Yao, S. Amperometric Glucose Biosensor Based on Immobilization of Glucose Oxidase in Electropolymerized O-Aminophenol Film at Prussian Blue-Modified Platinum Electrode. Electrochim. Acta 2004, 49, 795–801. [Google Scholar] [CrossRef]
  46. Itaya, K.; Ataka, T.; Toshima, S.; Shinohara, T. Electrochemistry of Prussian Blue. An in Situ Moessbauer Effect Measurement. J. Phys. Chem. 1982, 86, 2415–2418. [Google Scholar] [CrossRef]
  47. Tang, H.; Prasad, K.; Sanjinès, R.; Schmid, P.E.; Lévy, F. Electrical and Optical Properties of TiO2 Anatase Thin Films. J. Appl. Phys. 1994, 75, 2042–2047. [Google Scholar] [CrossRef]
  48. Haghighi, B.; Hamidi, H.; Gorton, L. Electrochemical Behavior and Application of Prussian Blue Nanoparticle Modified Graphite Electrode. Sensors Actuators B Chem. 2010, 147, 270–276. [Google Scholar] [CrossRef]
  49. Wang, J.; Zhang, Z. Analytical Chemistry; Trans. Tech. Publ.; VCH: New York, NY, USA, 1994. [Google Scholar]
  50. Centeno, D.A.; Solano, X.H.; Castillo, J.J. A New Peroxidase from Leaves of Guinea Grass (Panicum Maximum): A Potential Biocatalyst to Build Amperometric Biosensors. Bioelectrochemistry 2017, 116, 33–38. [Google Scholar] [CrossRef]
  51. Wang, S.; Zhu, Y.; Yang, X.; Li, C. Photoelectrochemical Detection of H2O2 Based on Flower-Like CuInS2-Graphene Hybrid. Electroanalysis 2014, 26, 573–580. [Google Scholar] [CrossRef]
  52. Cao, L.; Liu, Y.; Zhang, B.; Lu, L. In Situ Controllable Growth of Prussian Blue Nanocubes on Reduced Graphene Oxide: Facile Synthesis and Their Application as Enhanced Nanoelectrocatalyst for H2O2 Reduction. ACS Appl. Mater. Interfaces 2010, 2, 2339–2346. [Google Scholar] [CrossRef]
  53. Teepoo, S.; Dawan, P.; Barnthip, N. Electrospun Chitosan-Gelatin Biopolymer Composite Nanofibers for Horseradish Peroxidase Immobilization in a Hydrogen Peroxide Biosensor. Biosensors 2017, 7, 47. [Google Scholar] [CrossRef] [PubMed] [Green Version]
  54. Wan, J.; Wang, W.; Yin, G.; Ma, X. Nonenzymatic H2O2 Sensor Based on Pt Nanoflower Electrode. J. Clust. Sci. 2012, 23, 1061–1068. [Google Scholar] [CrossRef]
Scheme 1. Modification process of the PB–fCNT/GC and PB–TiO2/fCNT/GC electrodes.
Nanomaterials 10 00064 sch001
Figure 1. TEM images of fCNT: (a) general view; (b) image showing that the fCNT is formed by four walls.
Nanomaterials 10 00064 g001
Figure 2. TEM images of TiO2–fCNT at different magnifications showing the distribution and attachment of TiO2 nanoparticles on the pCNT walls: scale bar (a) 200 nm, (b) 40 nm, and (c) 10 nm.
Nanomaterials 10 00064 g002
Figure 3. XRD diffractograms of (a) TiO2–fCNT and (b) fCNTs.
Nanomaterials 10 00064 g003
Figure 4. FTIR specta of (a) TiO2–fCNTs and (b) fCNTs.
Nanomaterials 10 00064 g004
Figure 5. (a)Zeta potential result for fCNTs, showing a peak at −35.31 mV in the fifth run with a mean of −51.84 mV and a standard deviation of 9.66 mV; (b) zeta potential result for TiO2–fCNTs, showing a peak at 7.94 mV in the fifth run with a mean of −9.93 mV and a standard deviation of 0.74 mV.
Nanomaterials 10 00064 g005
Figure 6. Voltammograms of the GC electrode (a), fCNT/GC (b), and TiO2–fCNTs/GC (c) modified electrodes in 0.1 mol∙L−1 phosphate-buffered solution at pH 7 with a scan rate of 100 mV∙s−1.
Nanomaterials 10 00064 g006
Figure 7. Cyclic voltammetry of the modified electrodes in 0.1 mol∙L−1 phosphate-buffered solution at pH 7 at a scan rate of 100 mV/s: (a) PB–fCNT/GC; (b) PB–TiO2/fCNT/GC reduction zone; (c) PB–TiO2/fCNT/GC oxidation zone.
Nanomaterials 10 00064 g007
Figure 8. Cyclic voltammograms of H2O2 at PB–TiO2/fCNT/GC electrode, in the PB redox reactions of low-spin Fe(CN)63−/4− (a) and the PB redox reactions of high-spin Fe3+/2+ (b) with a scan rate of 50 mV∙s−1 in PB buffer; without H2O2 (black line), 1 mol∙L−1 H2O2 (red line), and 2 mol∙L−1 H2O2 (blue line).
Nanomaterials 10 00064 g008
Figure 9. Chronoamperometric detection of H2O2 at the PB–TiO2/fCNT/GC electrode: (a) PB reduction zone and (b) PB oxidation zone. Chronoamperometric detection of H2O2 at the PB–fCNT/GC electrode: (c) PB reduction zone and (d) PB oxidation zone.
Nanomaterials 10 00064 g009
Figure 10. (a) Chronoamperometric detection of H2O2 at HRP–TiO2/fCNT/GC modified electrode, at −1.5 V, in 0.1 mol∙L−1 phosphate-buffered solution at pH 7. (b) Calibration curve of H2O2 and (c) cyclic voltammetry before and after detection.
Nanomaterials 10 00064 g010
Table 1. Comparison of performance of the modified electrodes with other electrodes reported in the literature.
Modified ElectrodeSensitivity
(μA∙mM−1)
Detection Limit (mM)Detection Potential
(V)
References
PB–fCNT/GC163.010.0150.00This work
HRP–TiO2/fCNT/GC9630.81−1.50This work
HRP from leaves of Guinea grass/graphene39.930.15.−0.65[50]
CuInS2–graphene/HRP11.20.047−0.2[51]
Prussian blue nanocubes on reduced graphene oxideNot reported0.040.2[52]
HRP/chitosan–gelatin composite biopolymer nanofiber/graphite electrode440.05−0.30[53]
Pt/Au200.06−0.20[54]

