Insights into the Microstructure of Hydrothermal Synthesized Nanoscale K2O-Al2O3-SiO2-H2O Particles

Abstract
1. Introduction
2. Experimental Procedure
2.1. Materials
2.2. Synthesis of K-A-S-H
2.3. Characterization of Samples
3. Results and Discussion
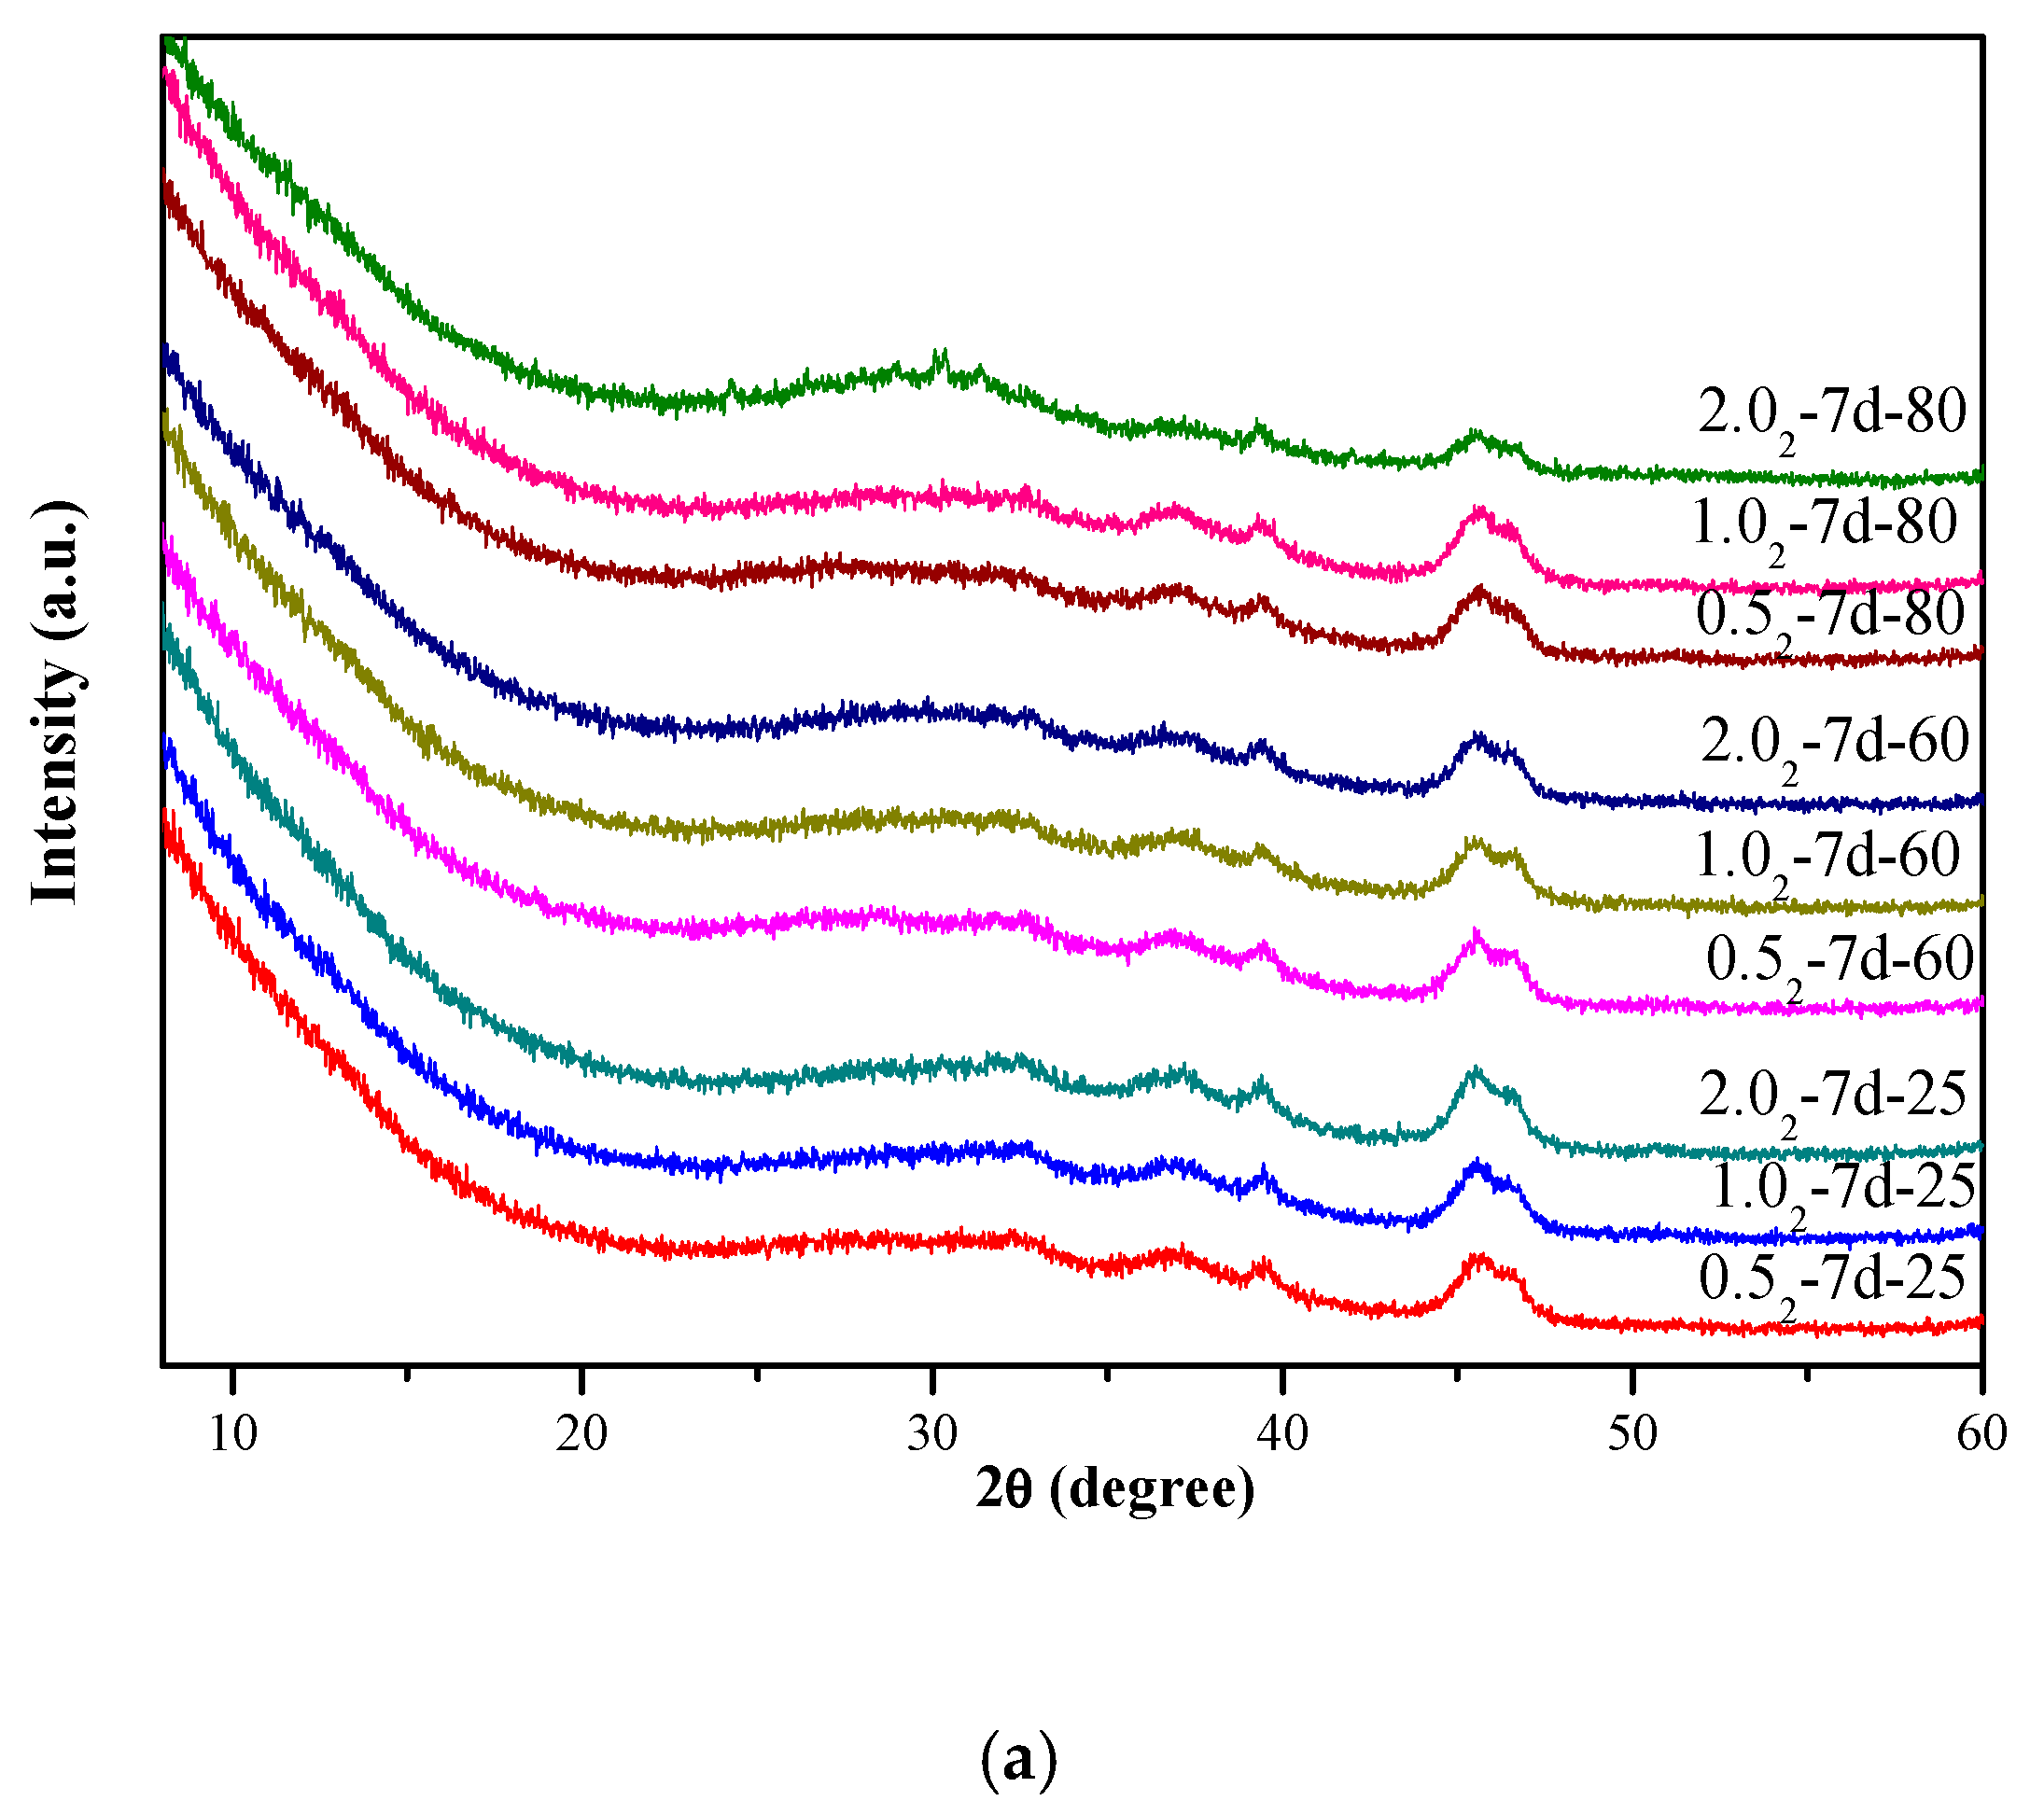
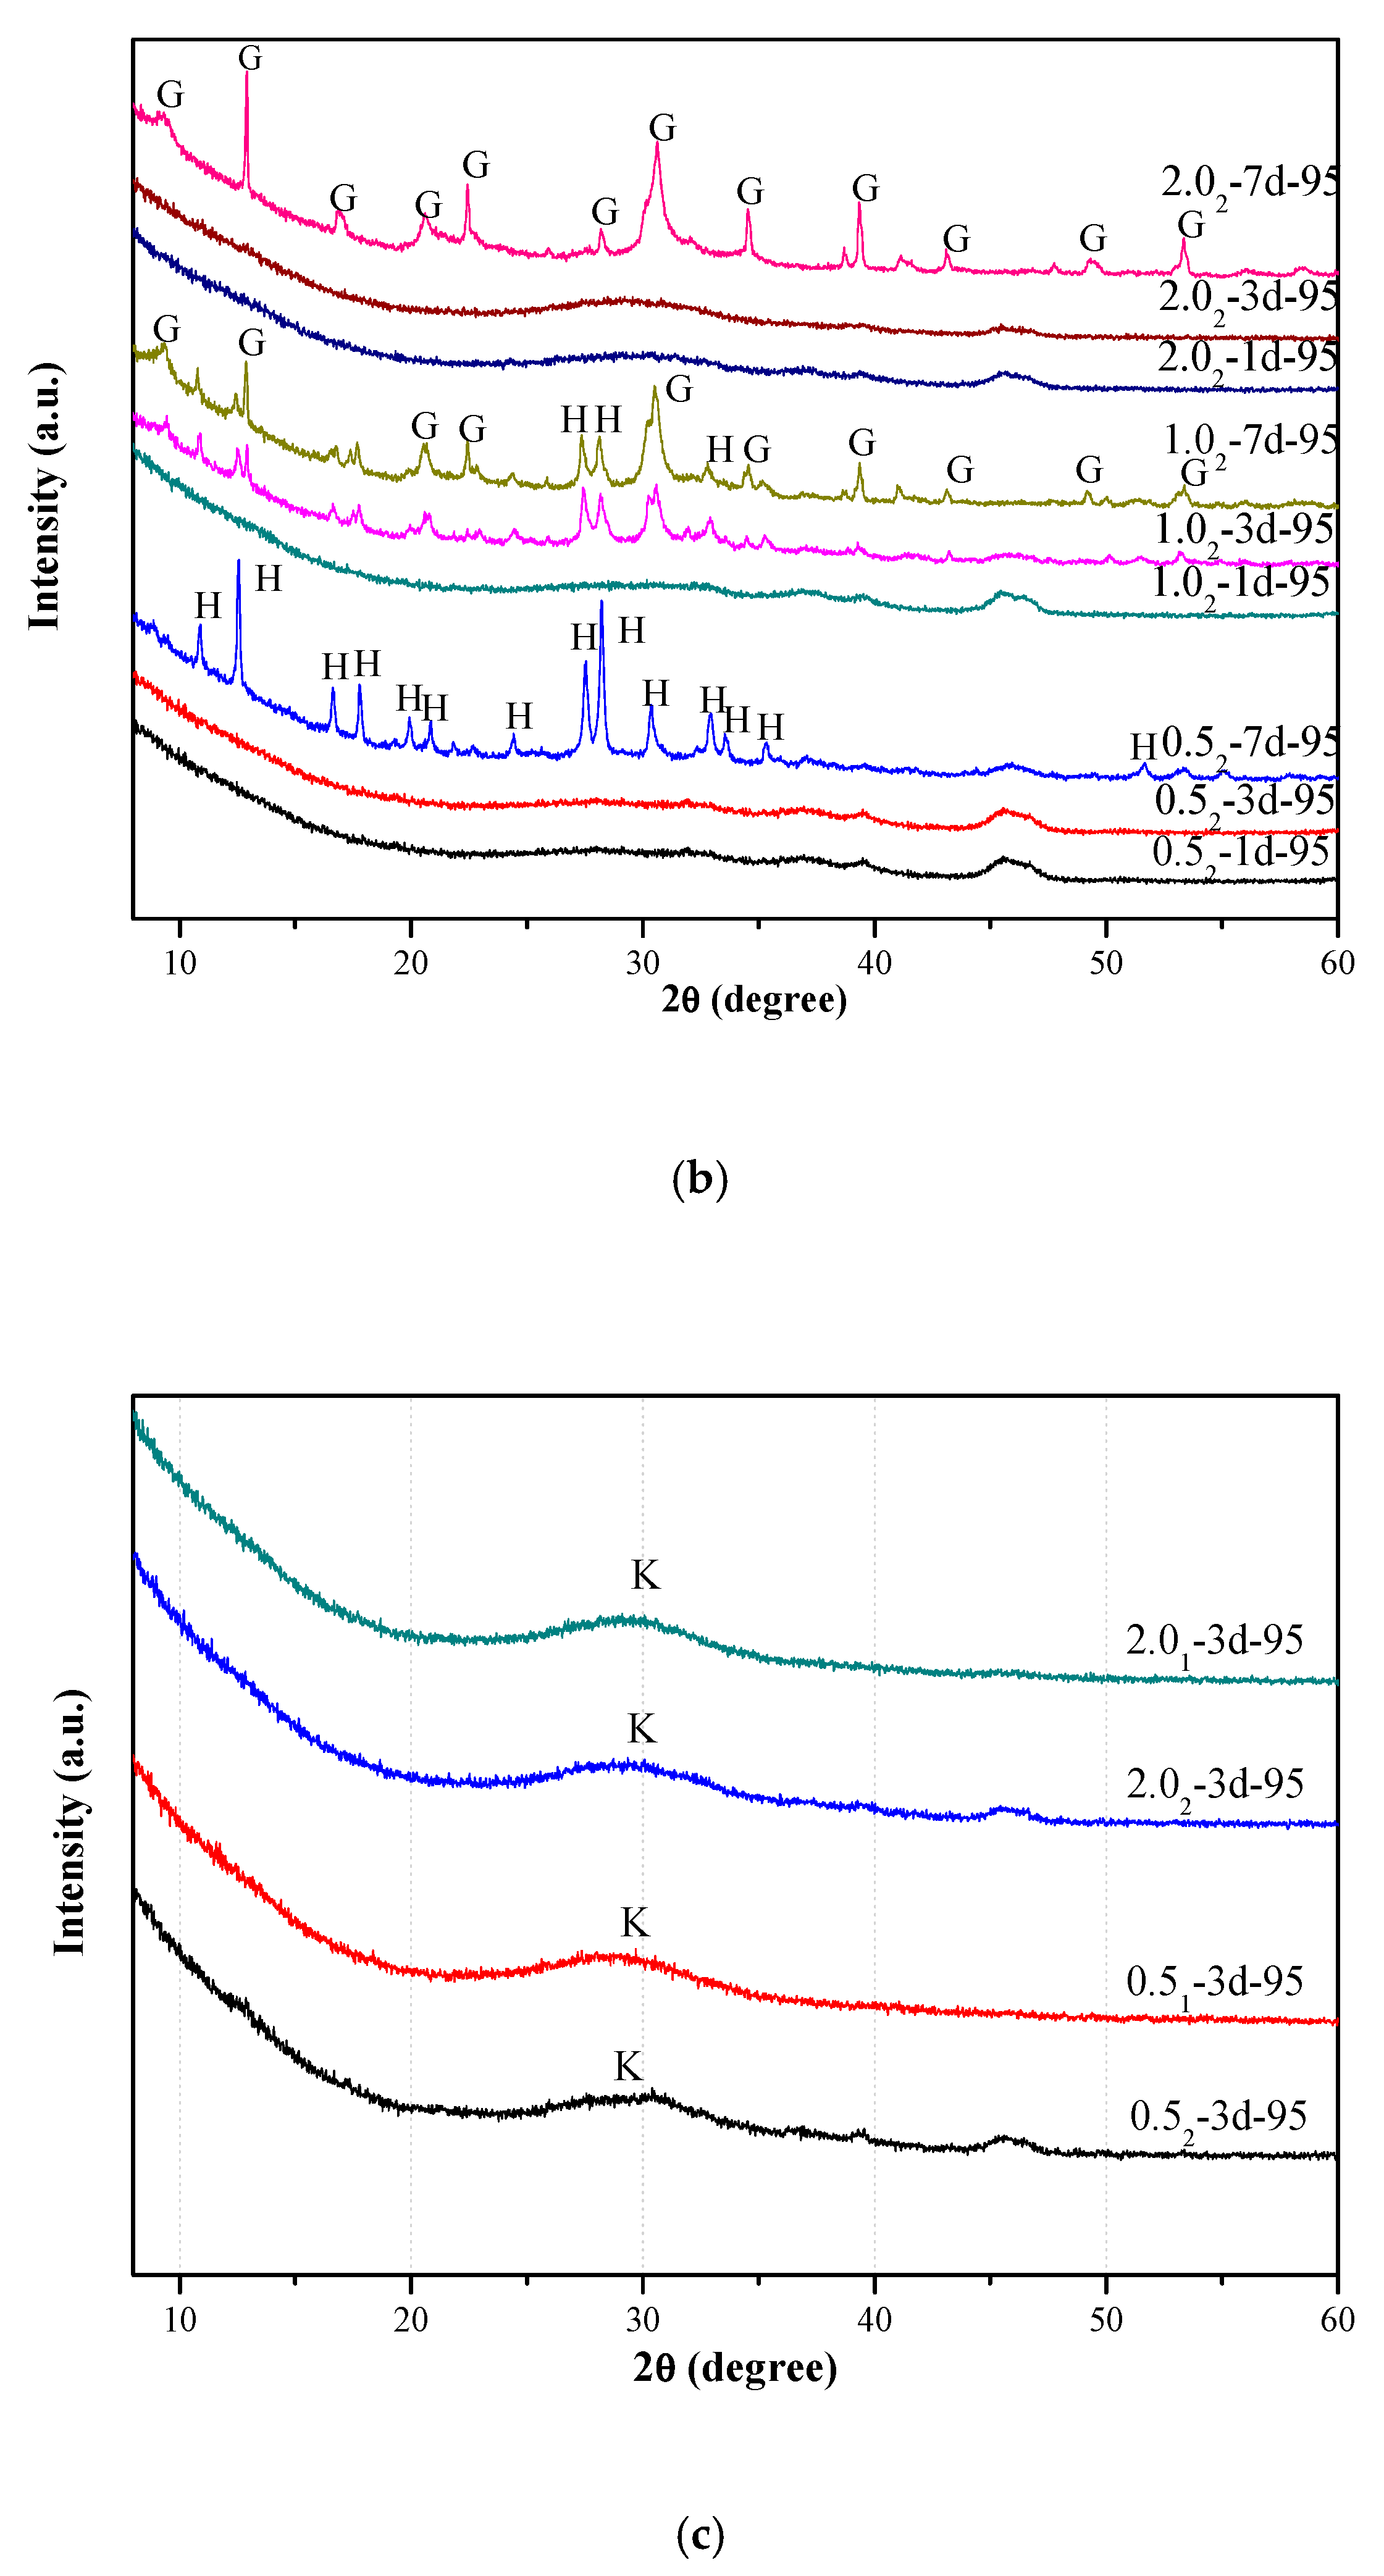
3.1. X-Ray Diffraction Analysis
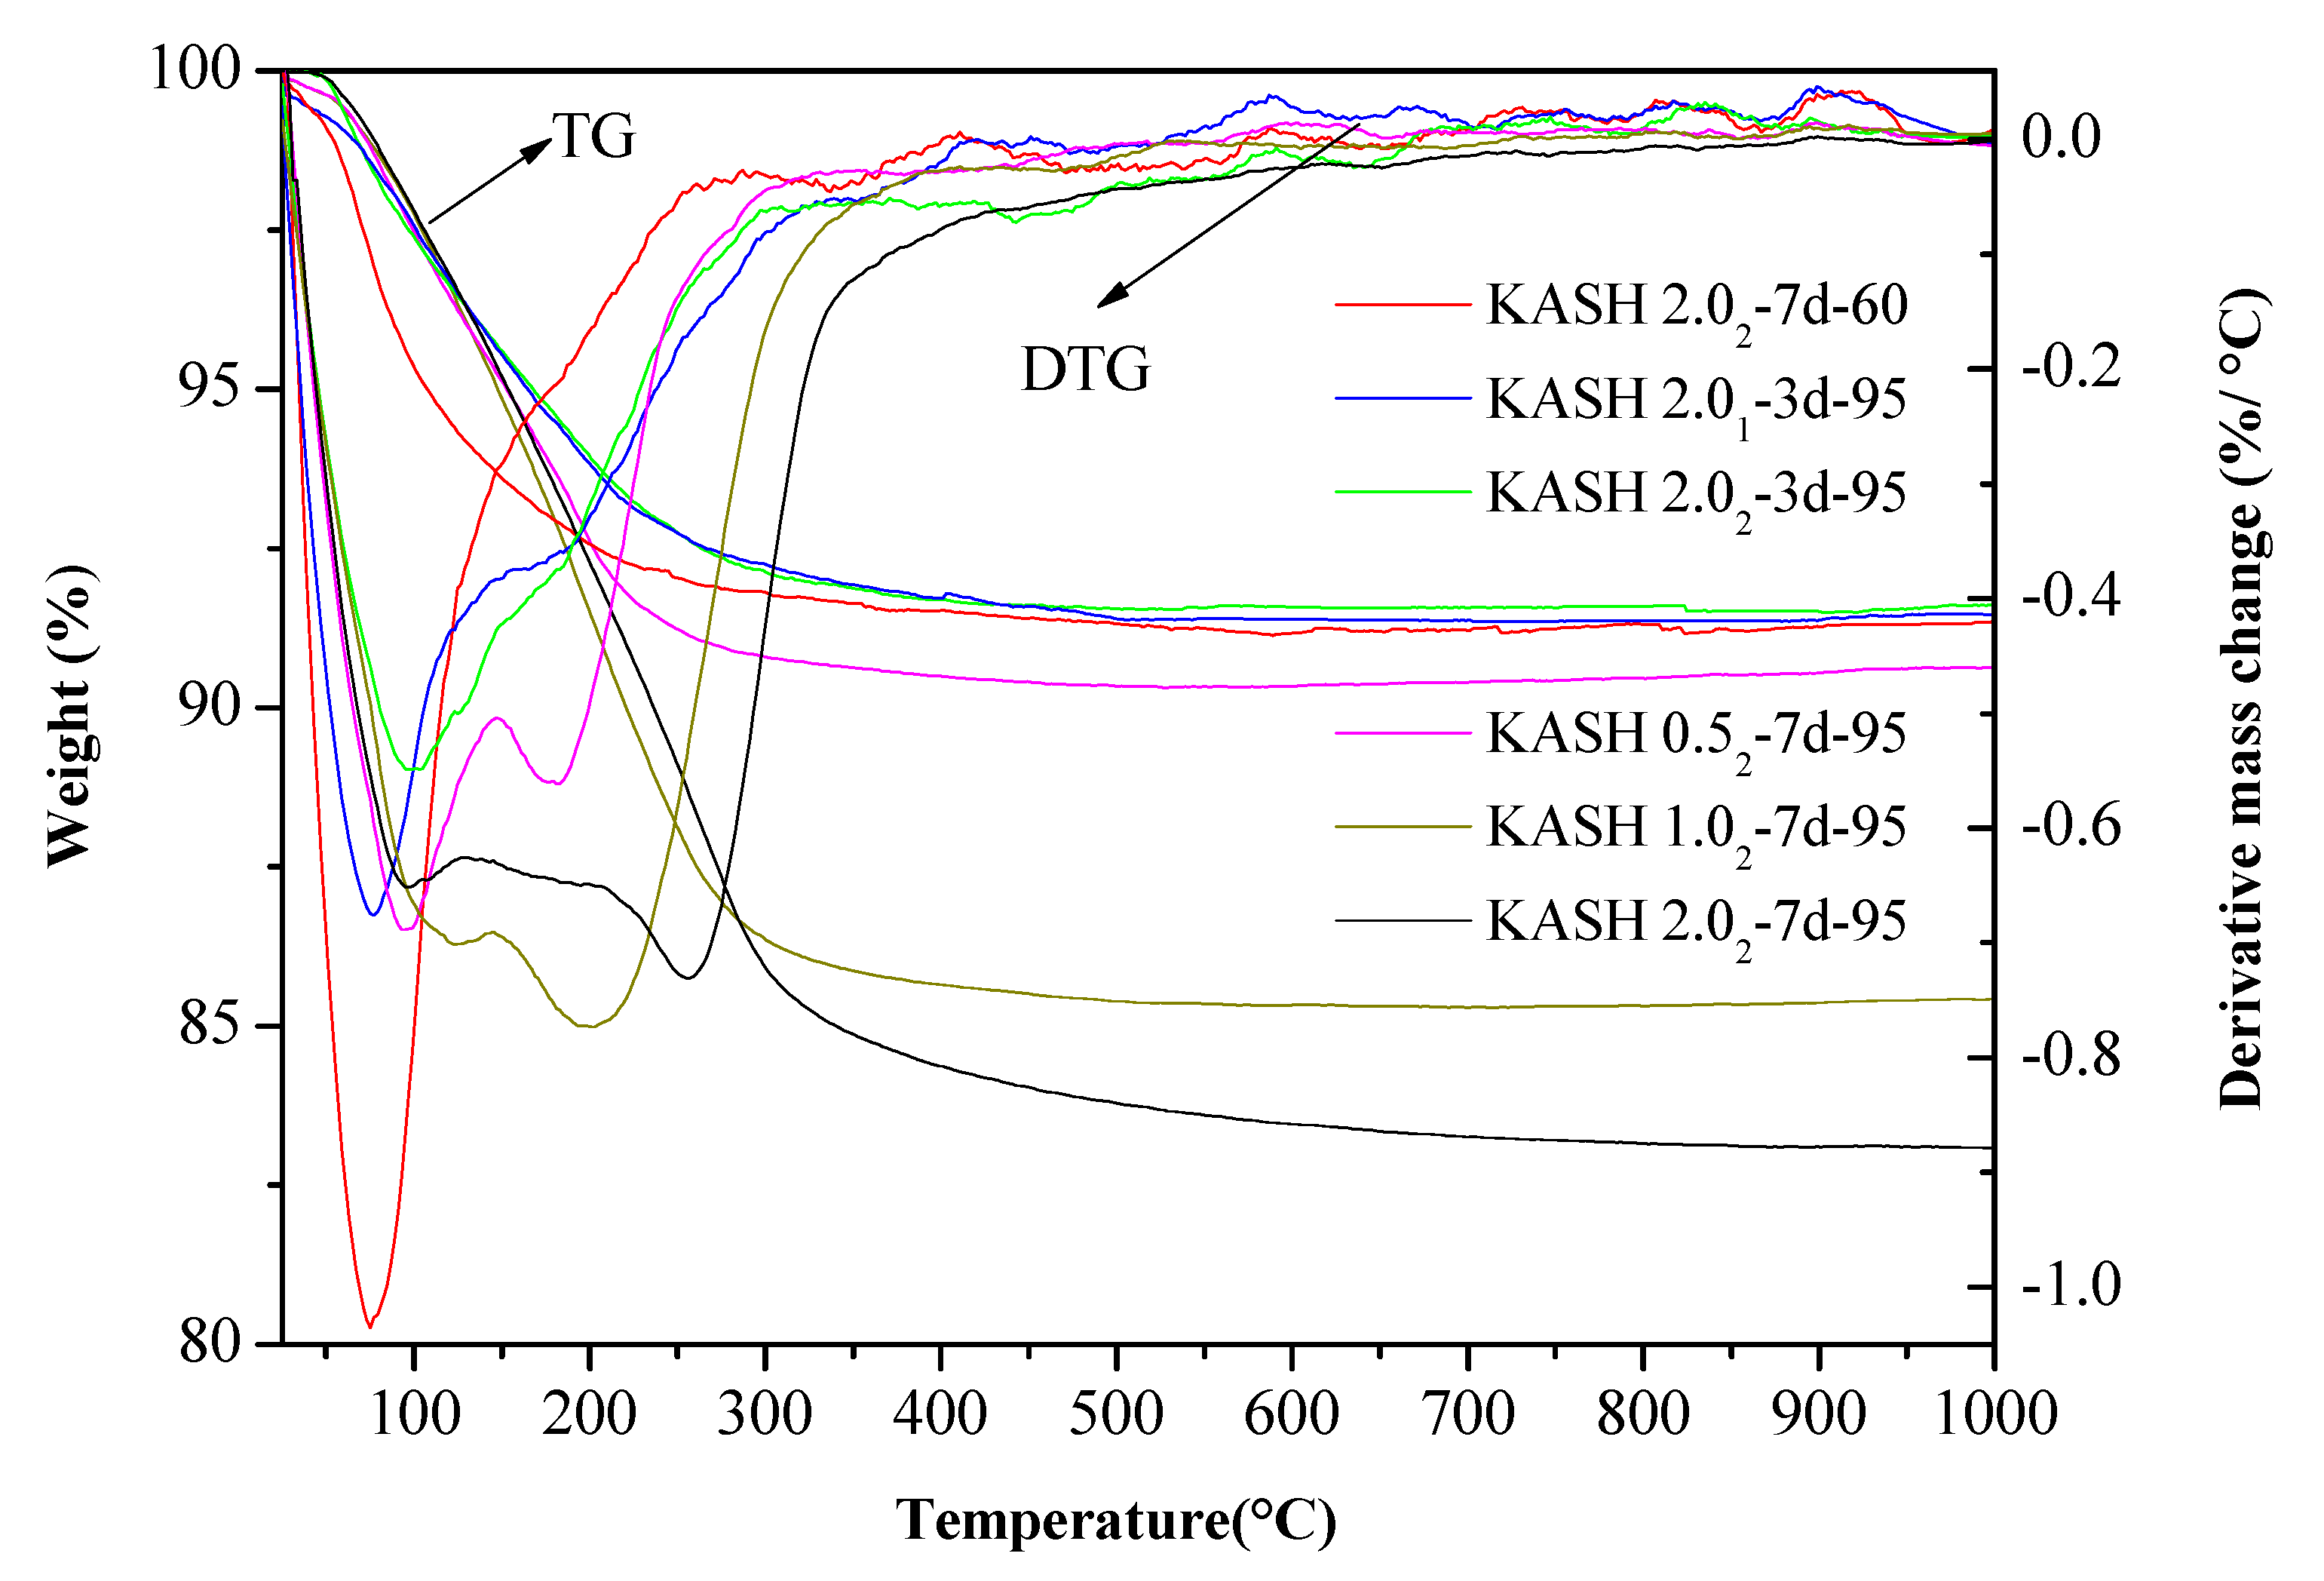
3.2. Thermogravimetric Analysis
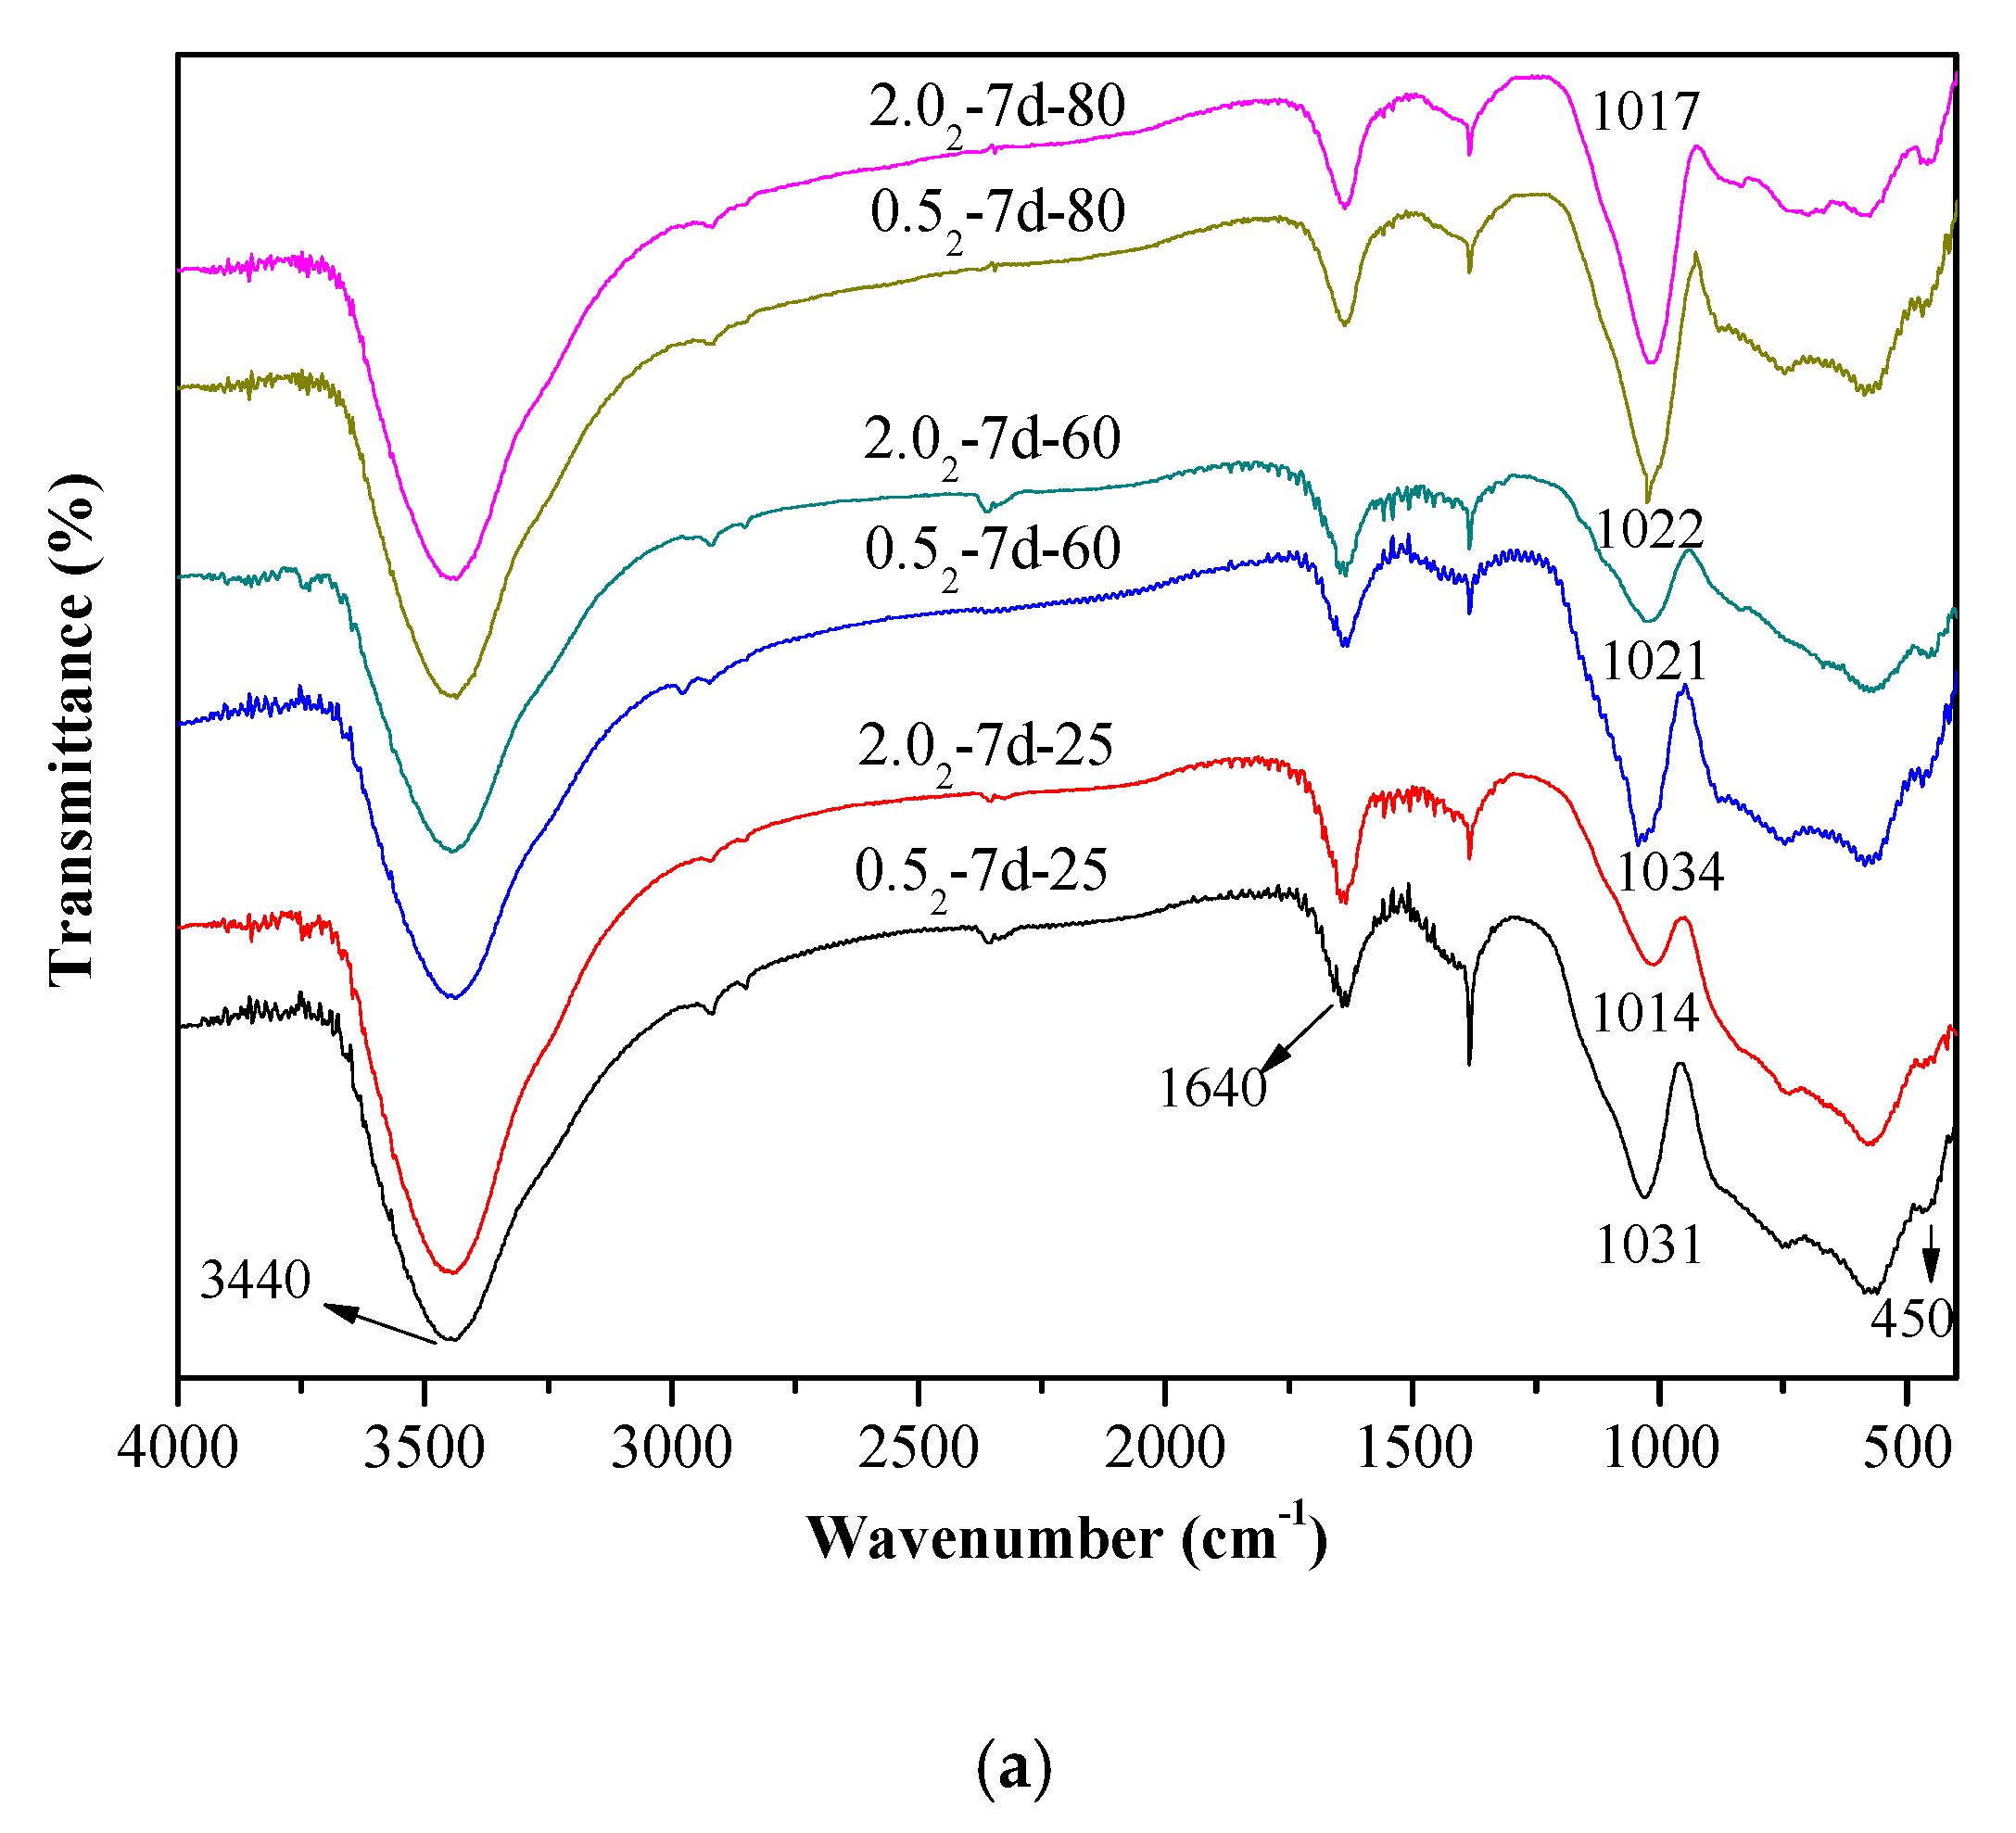
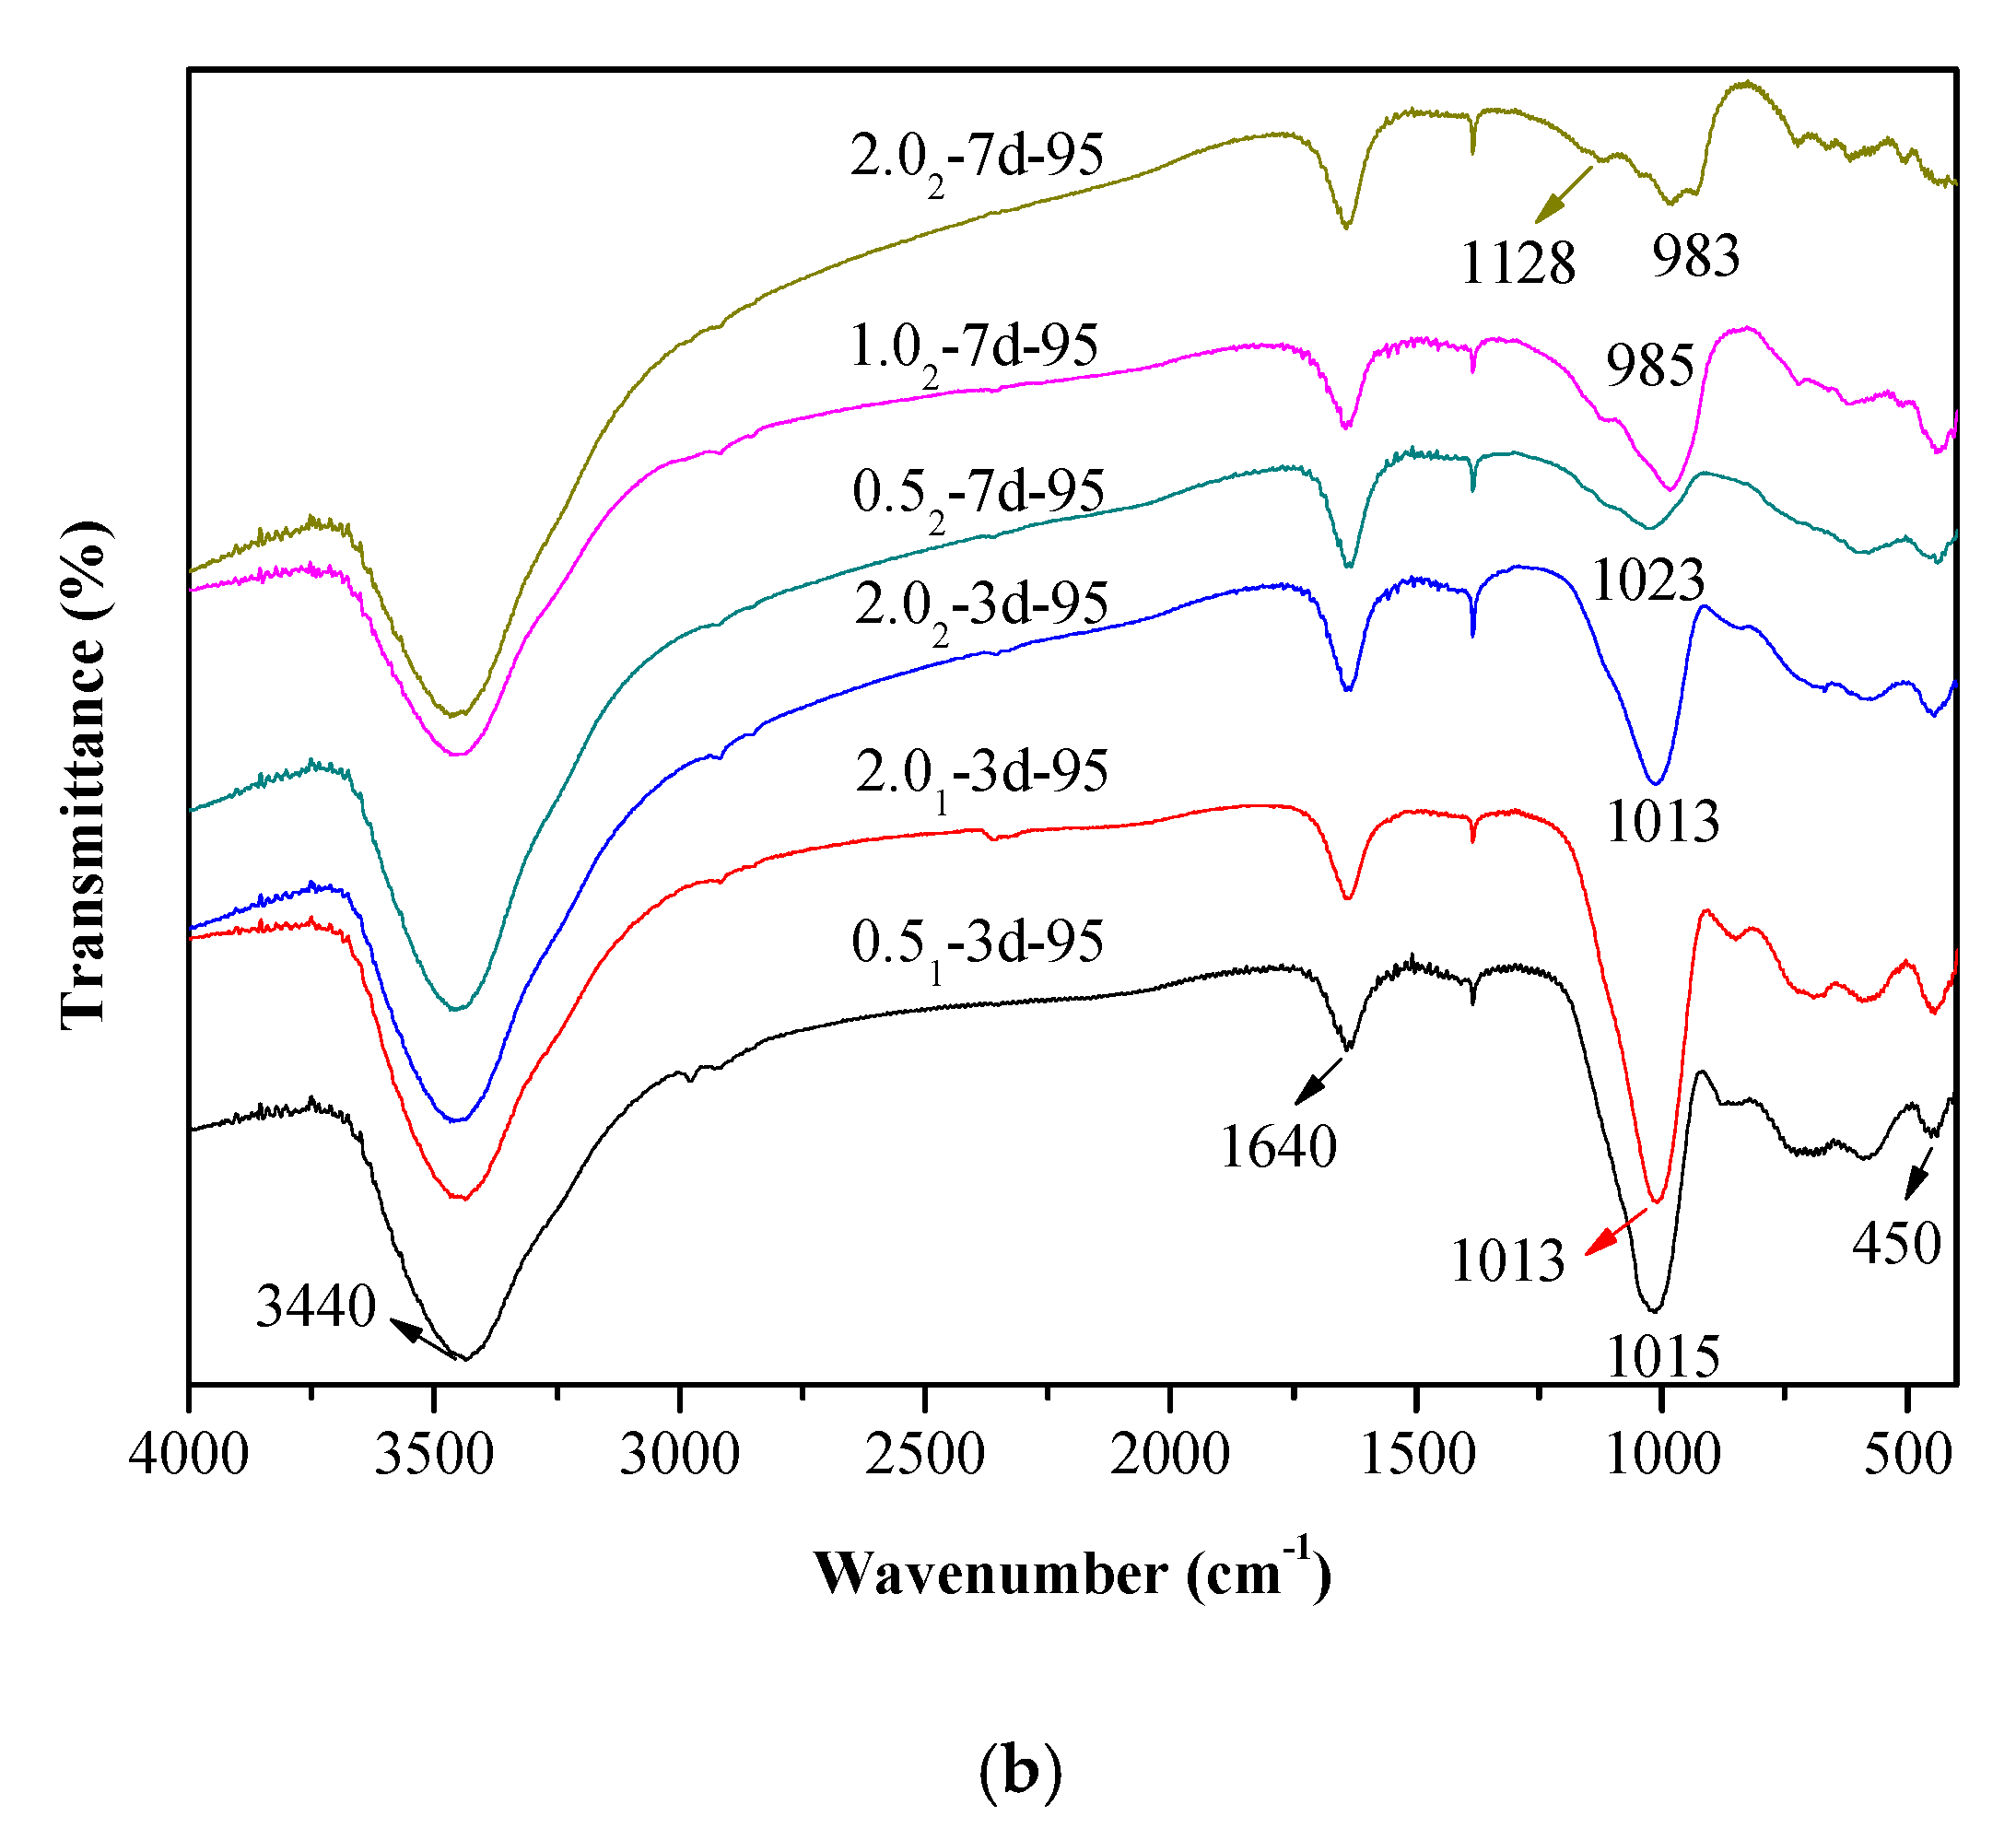
3.3. Infrared Analysis
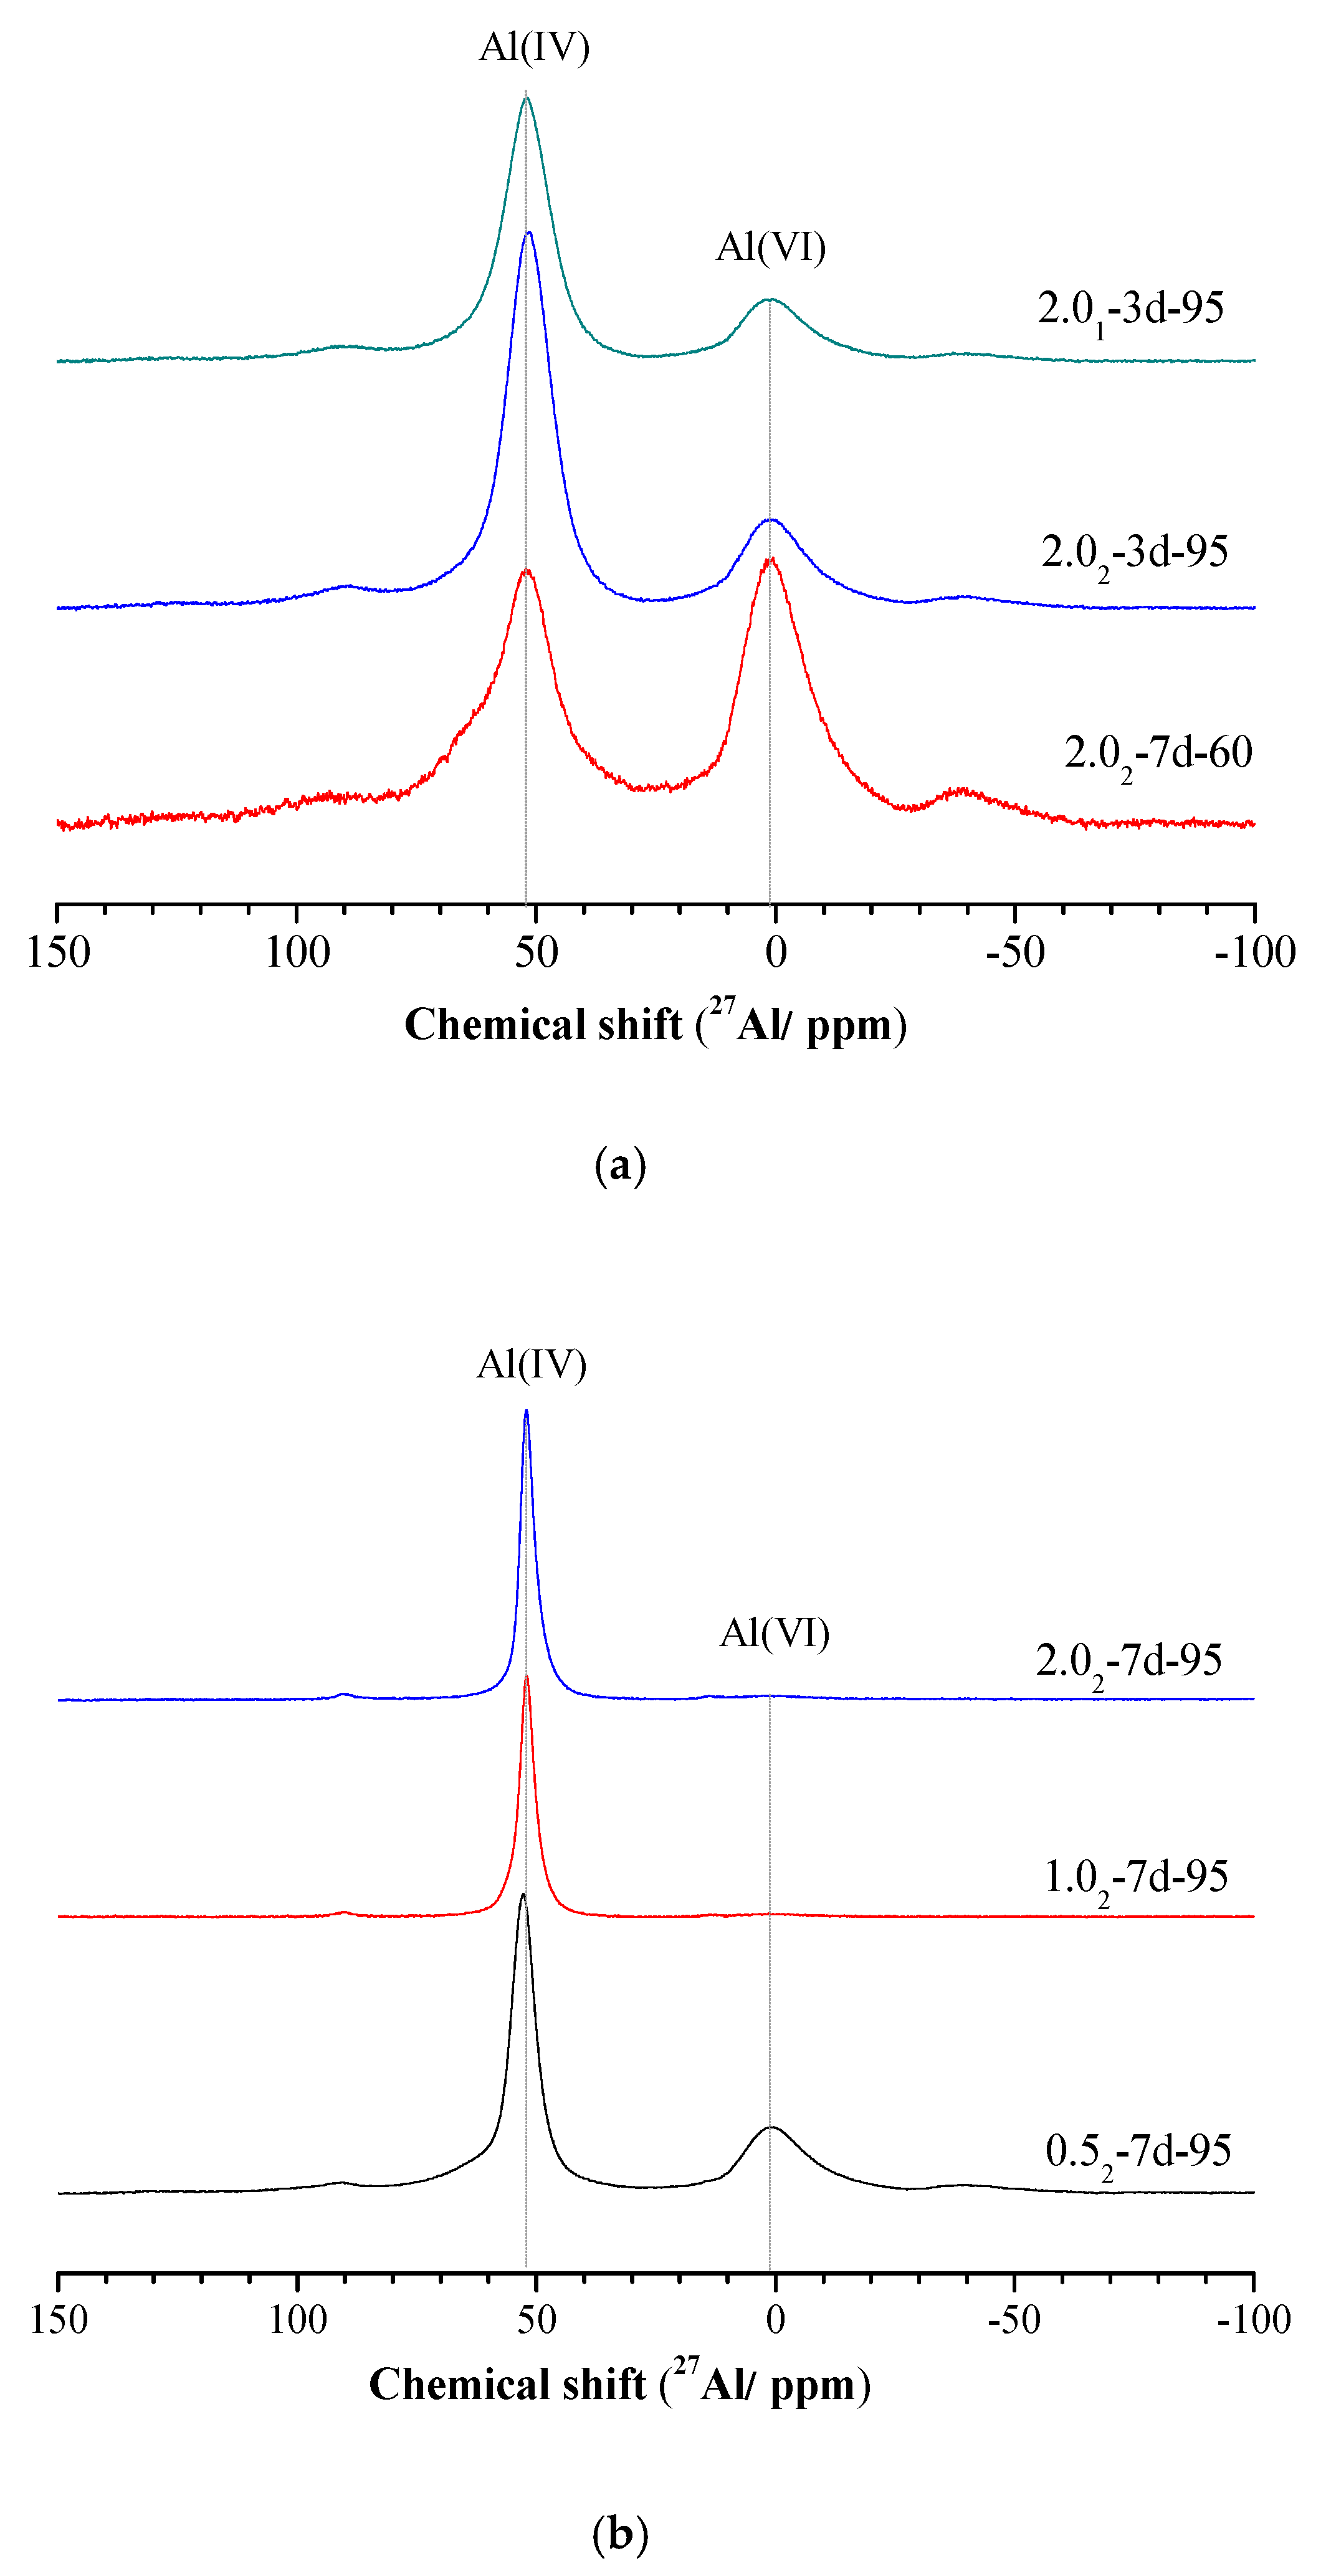
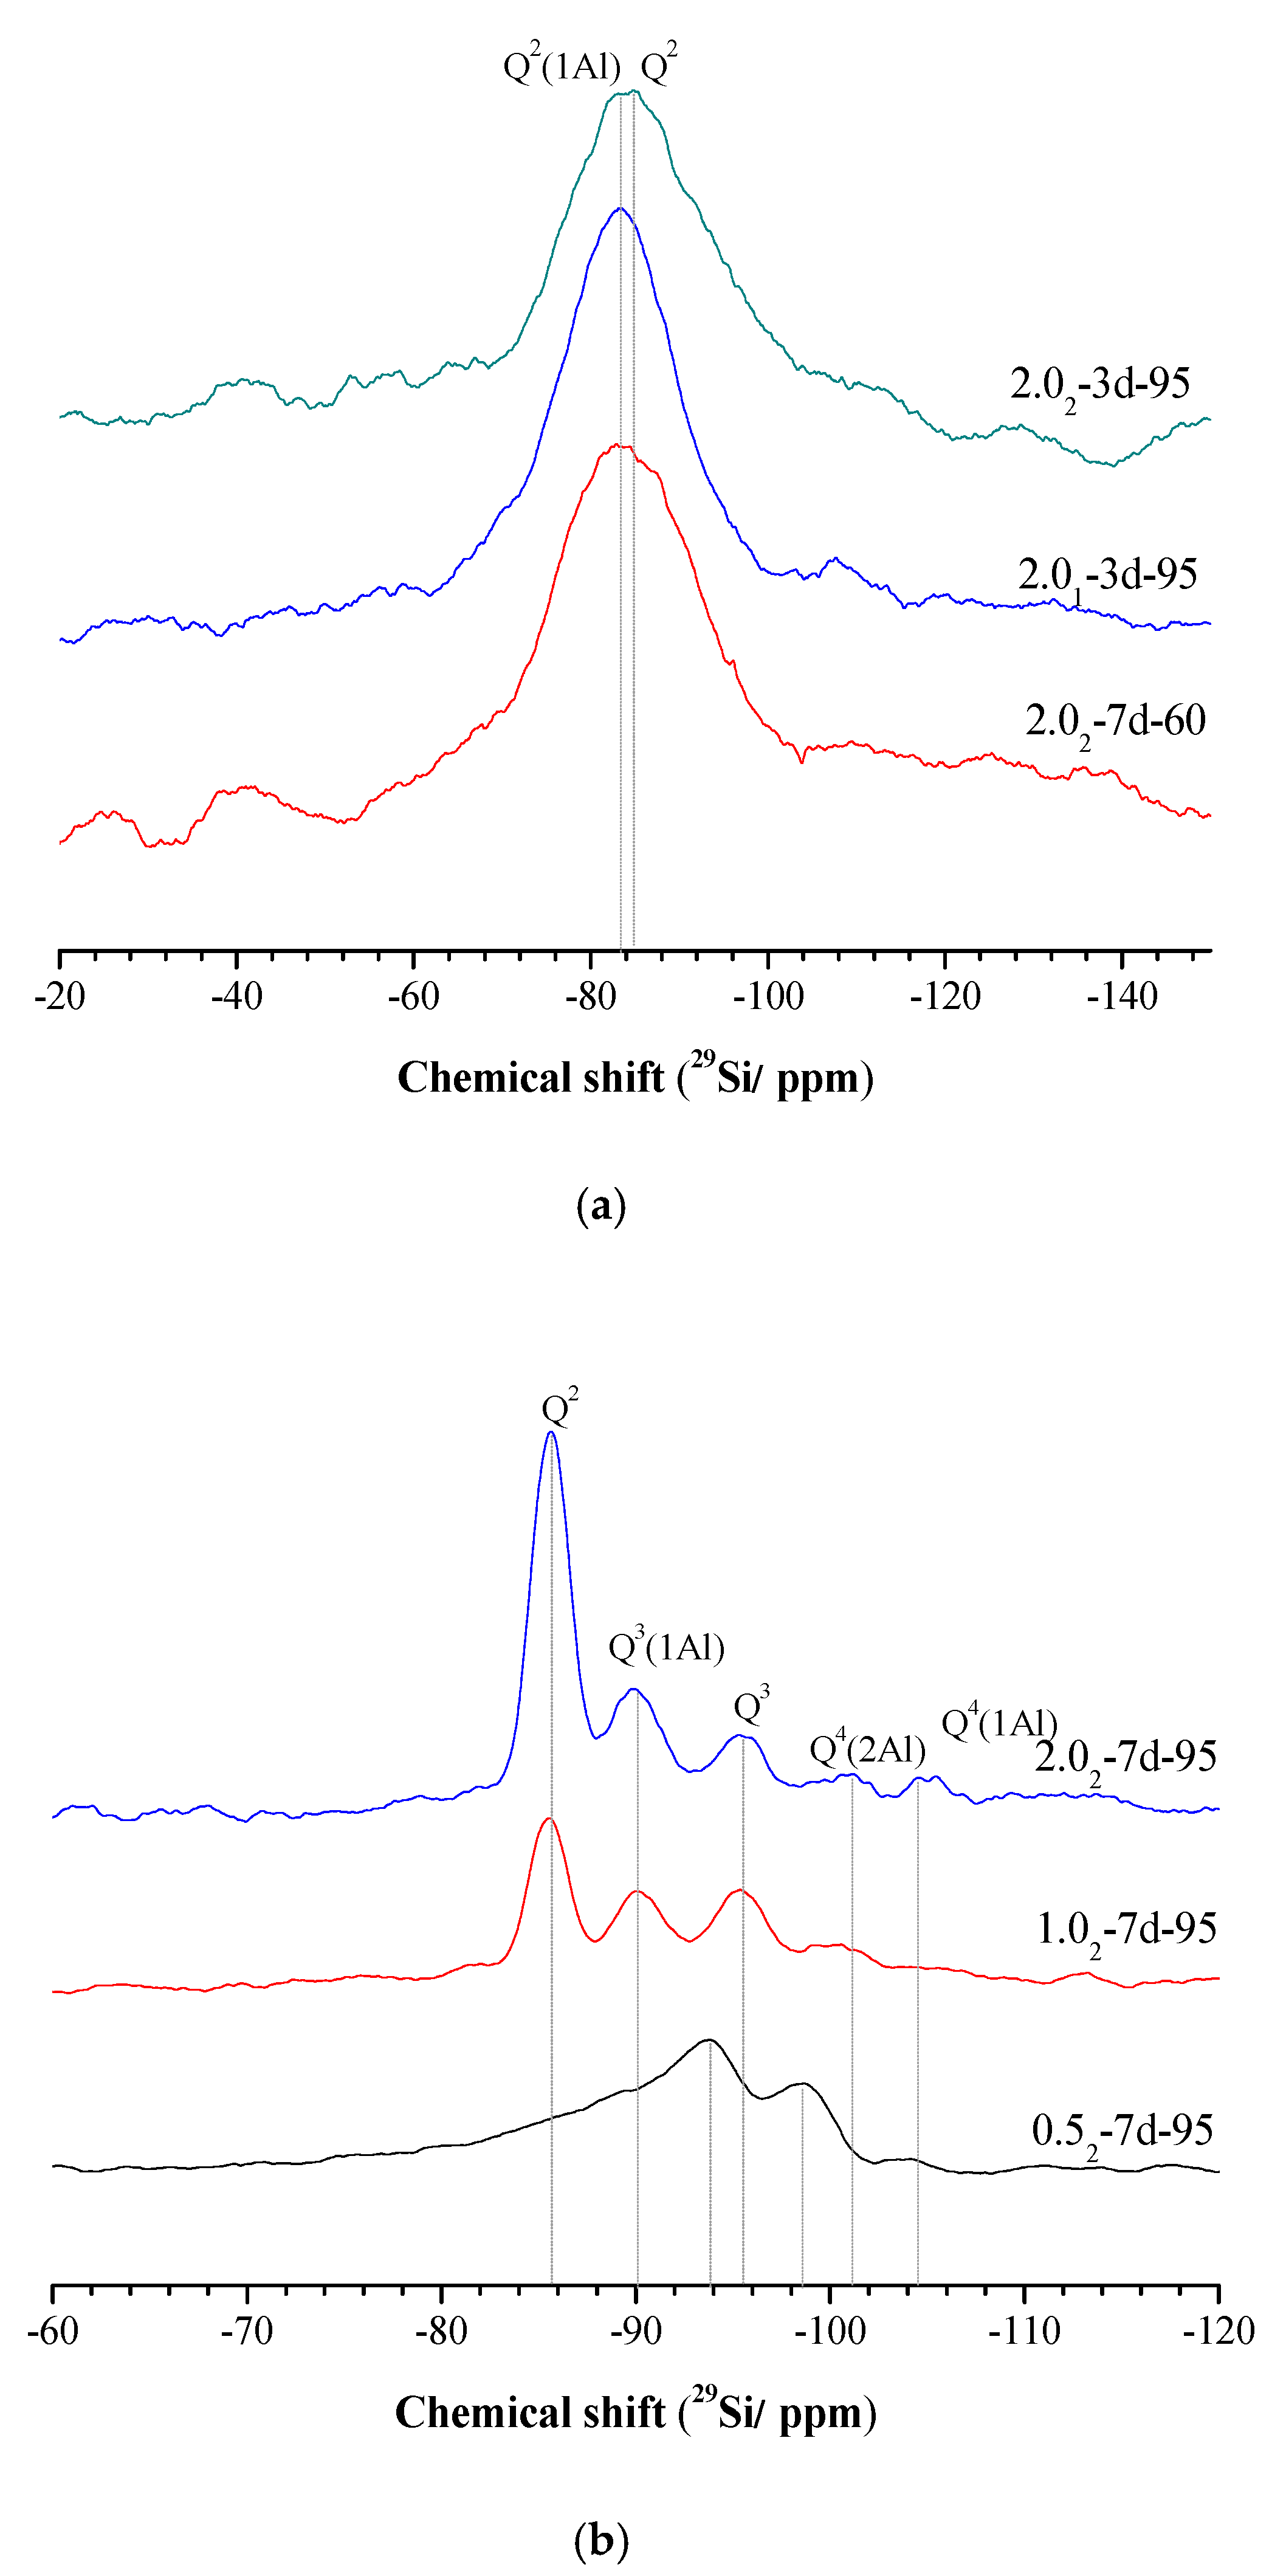
3.4. 29Si and 27Al MAS-NMR Analysis
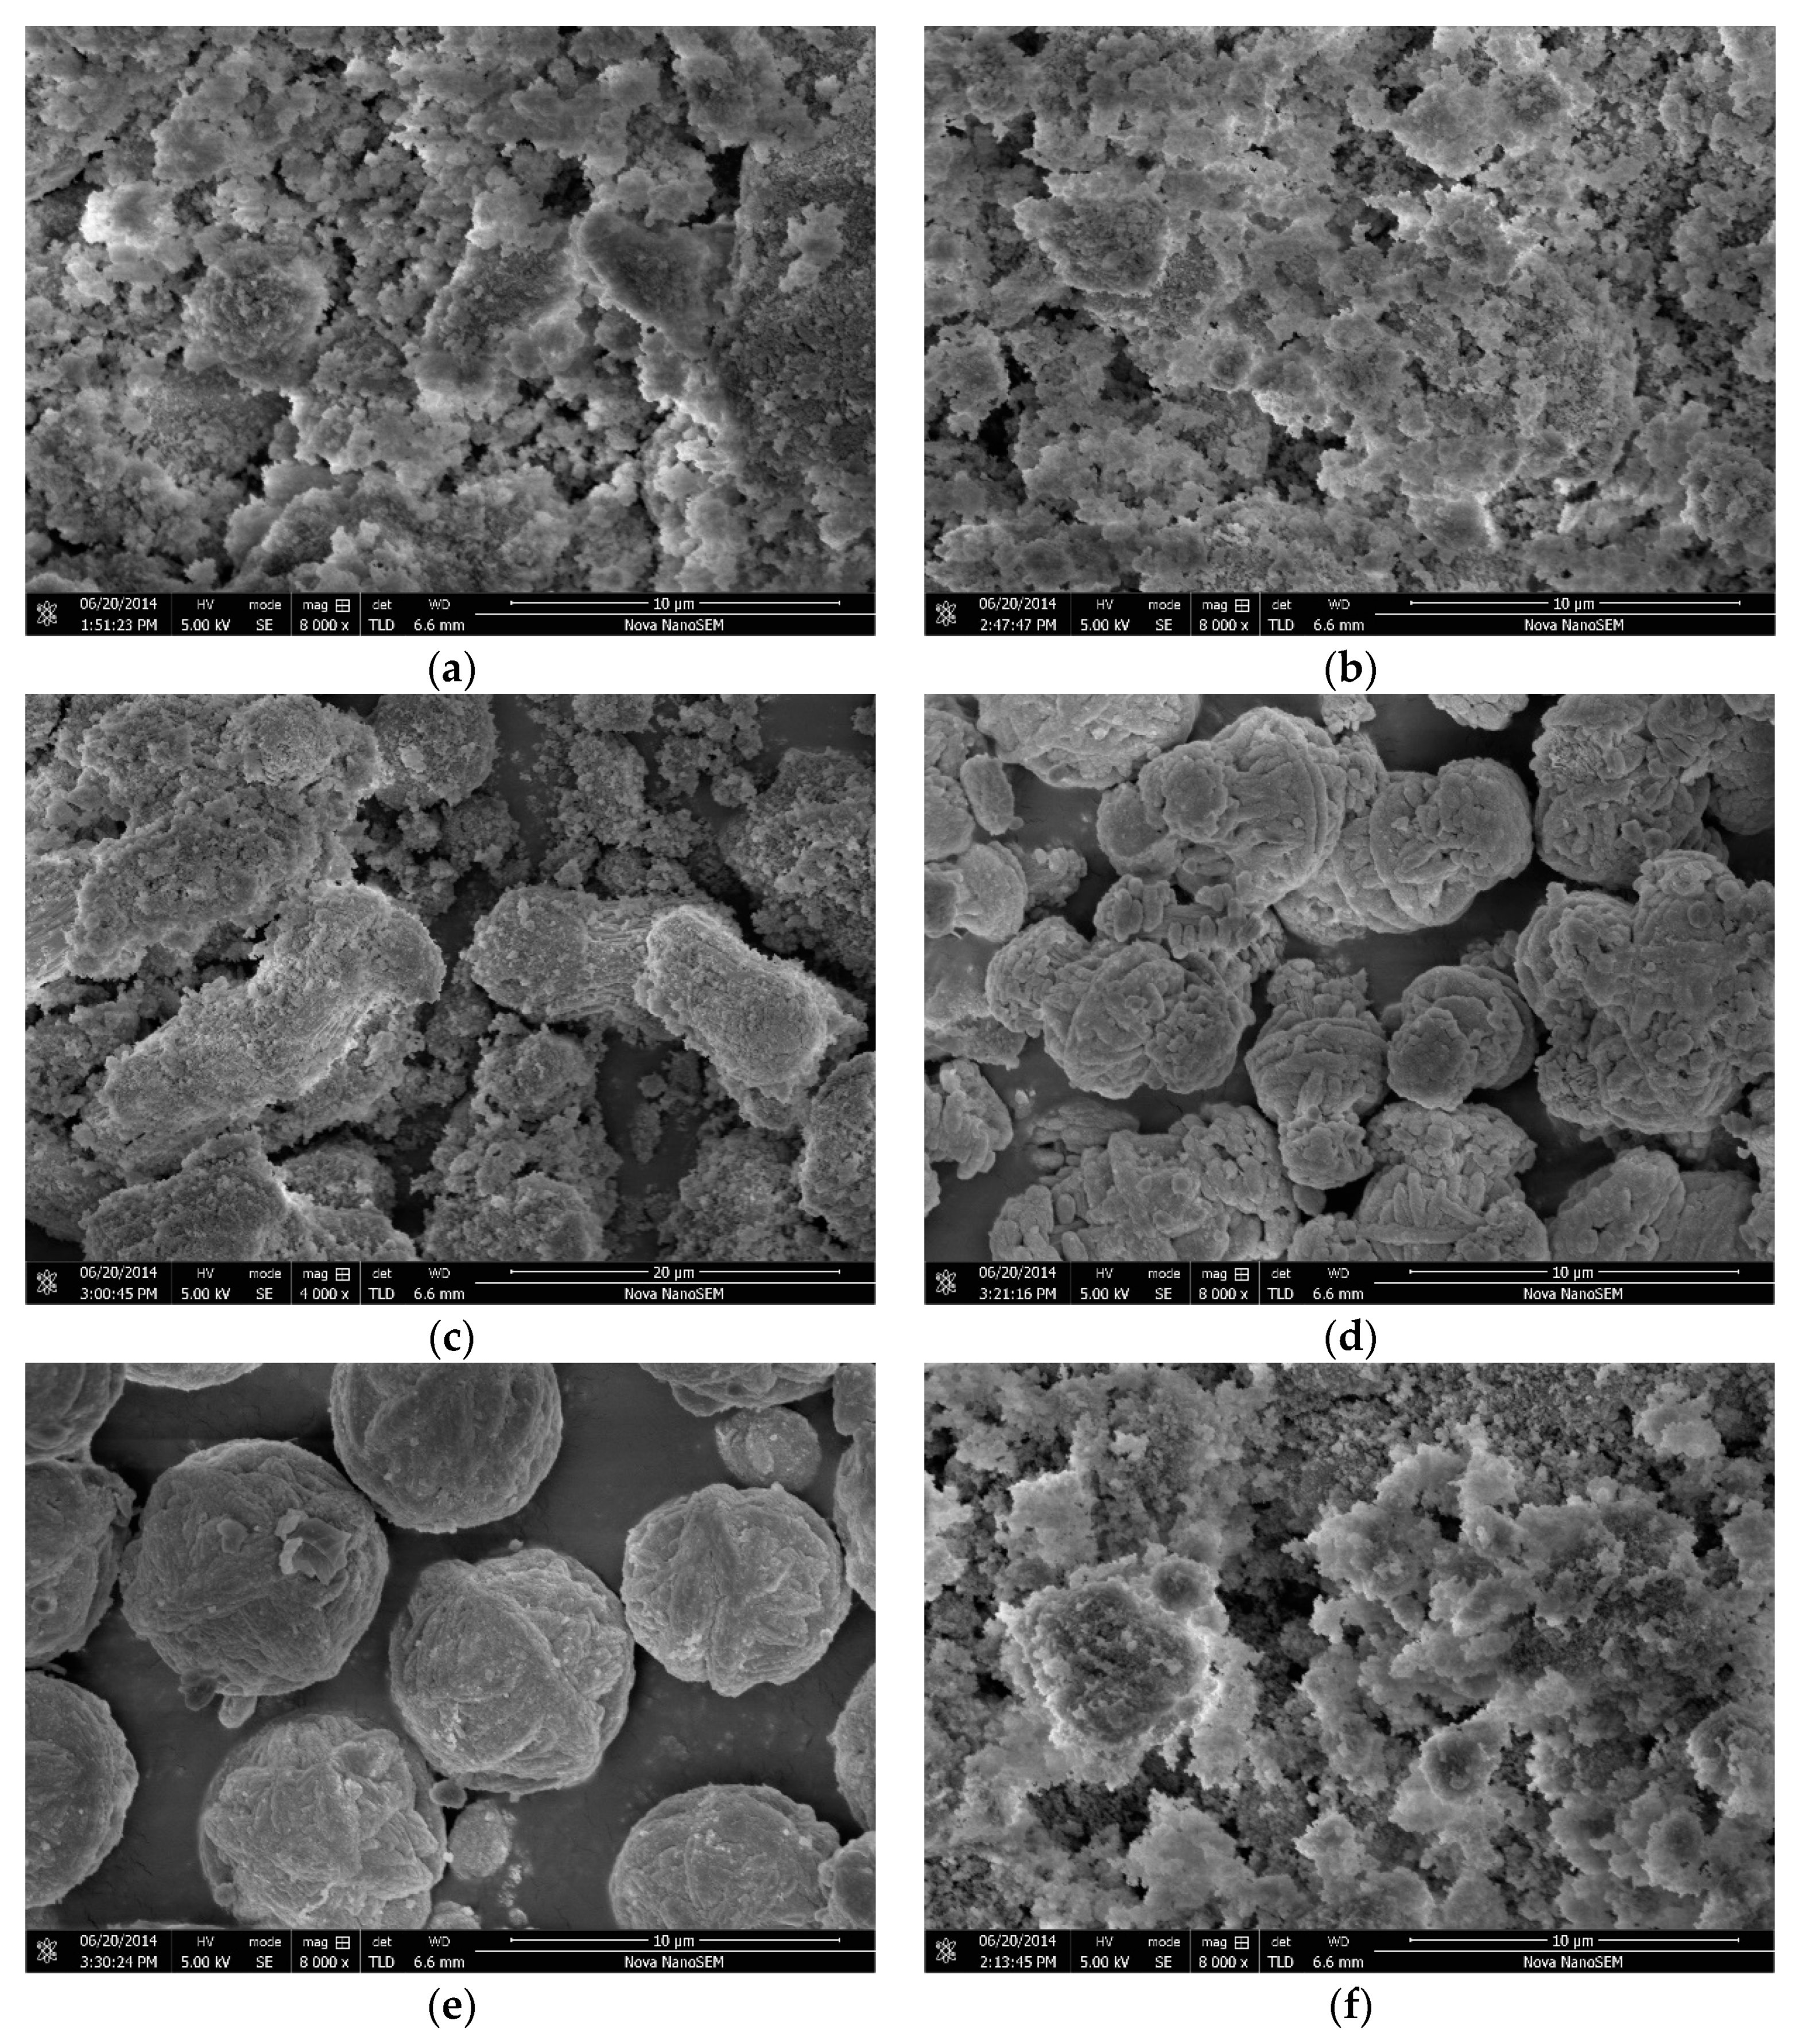
3.5. SEM Analysis
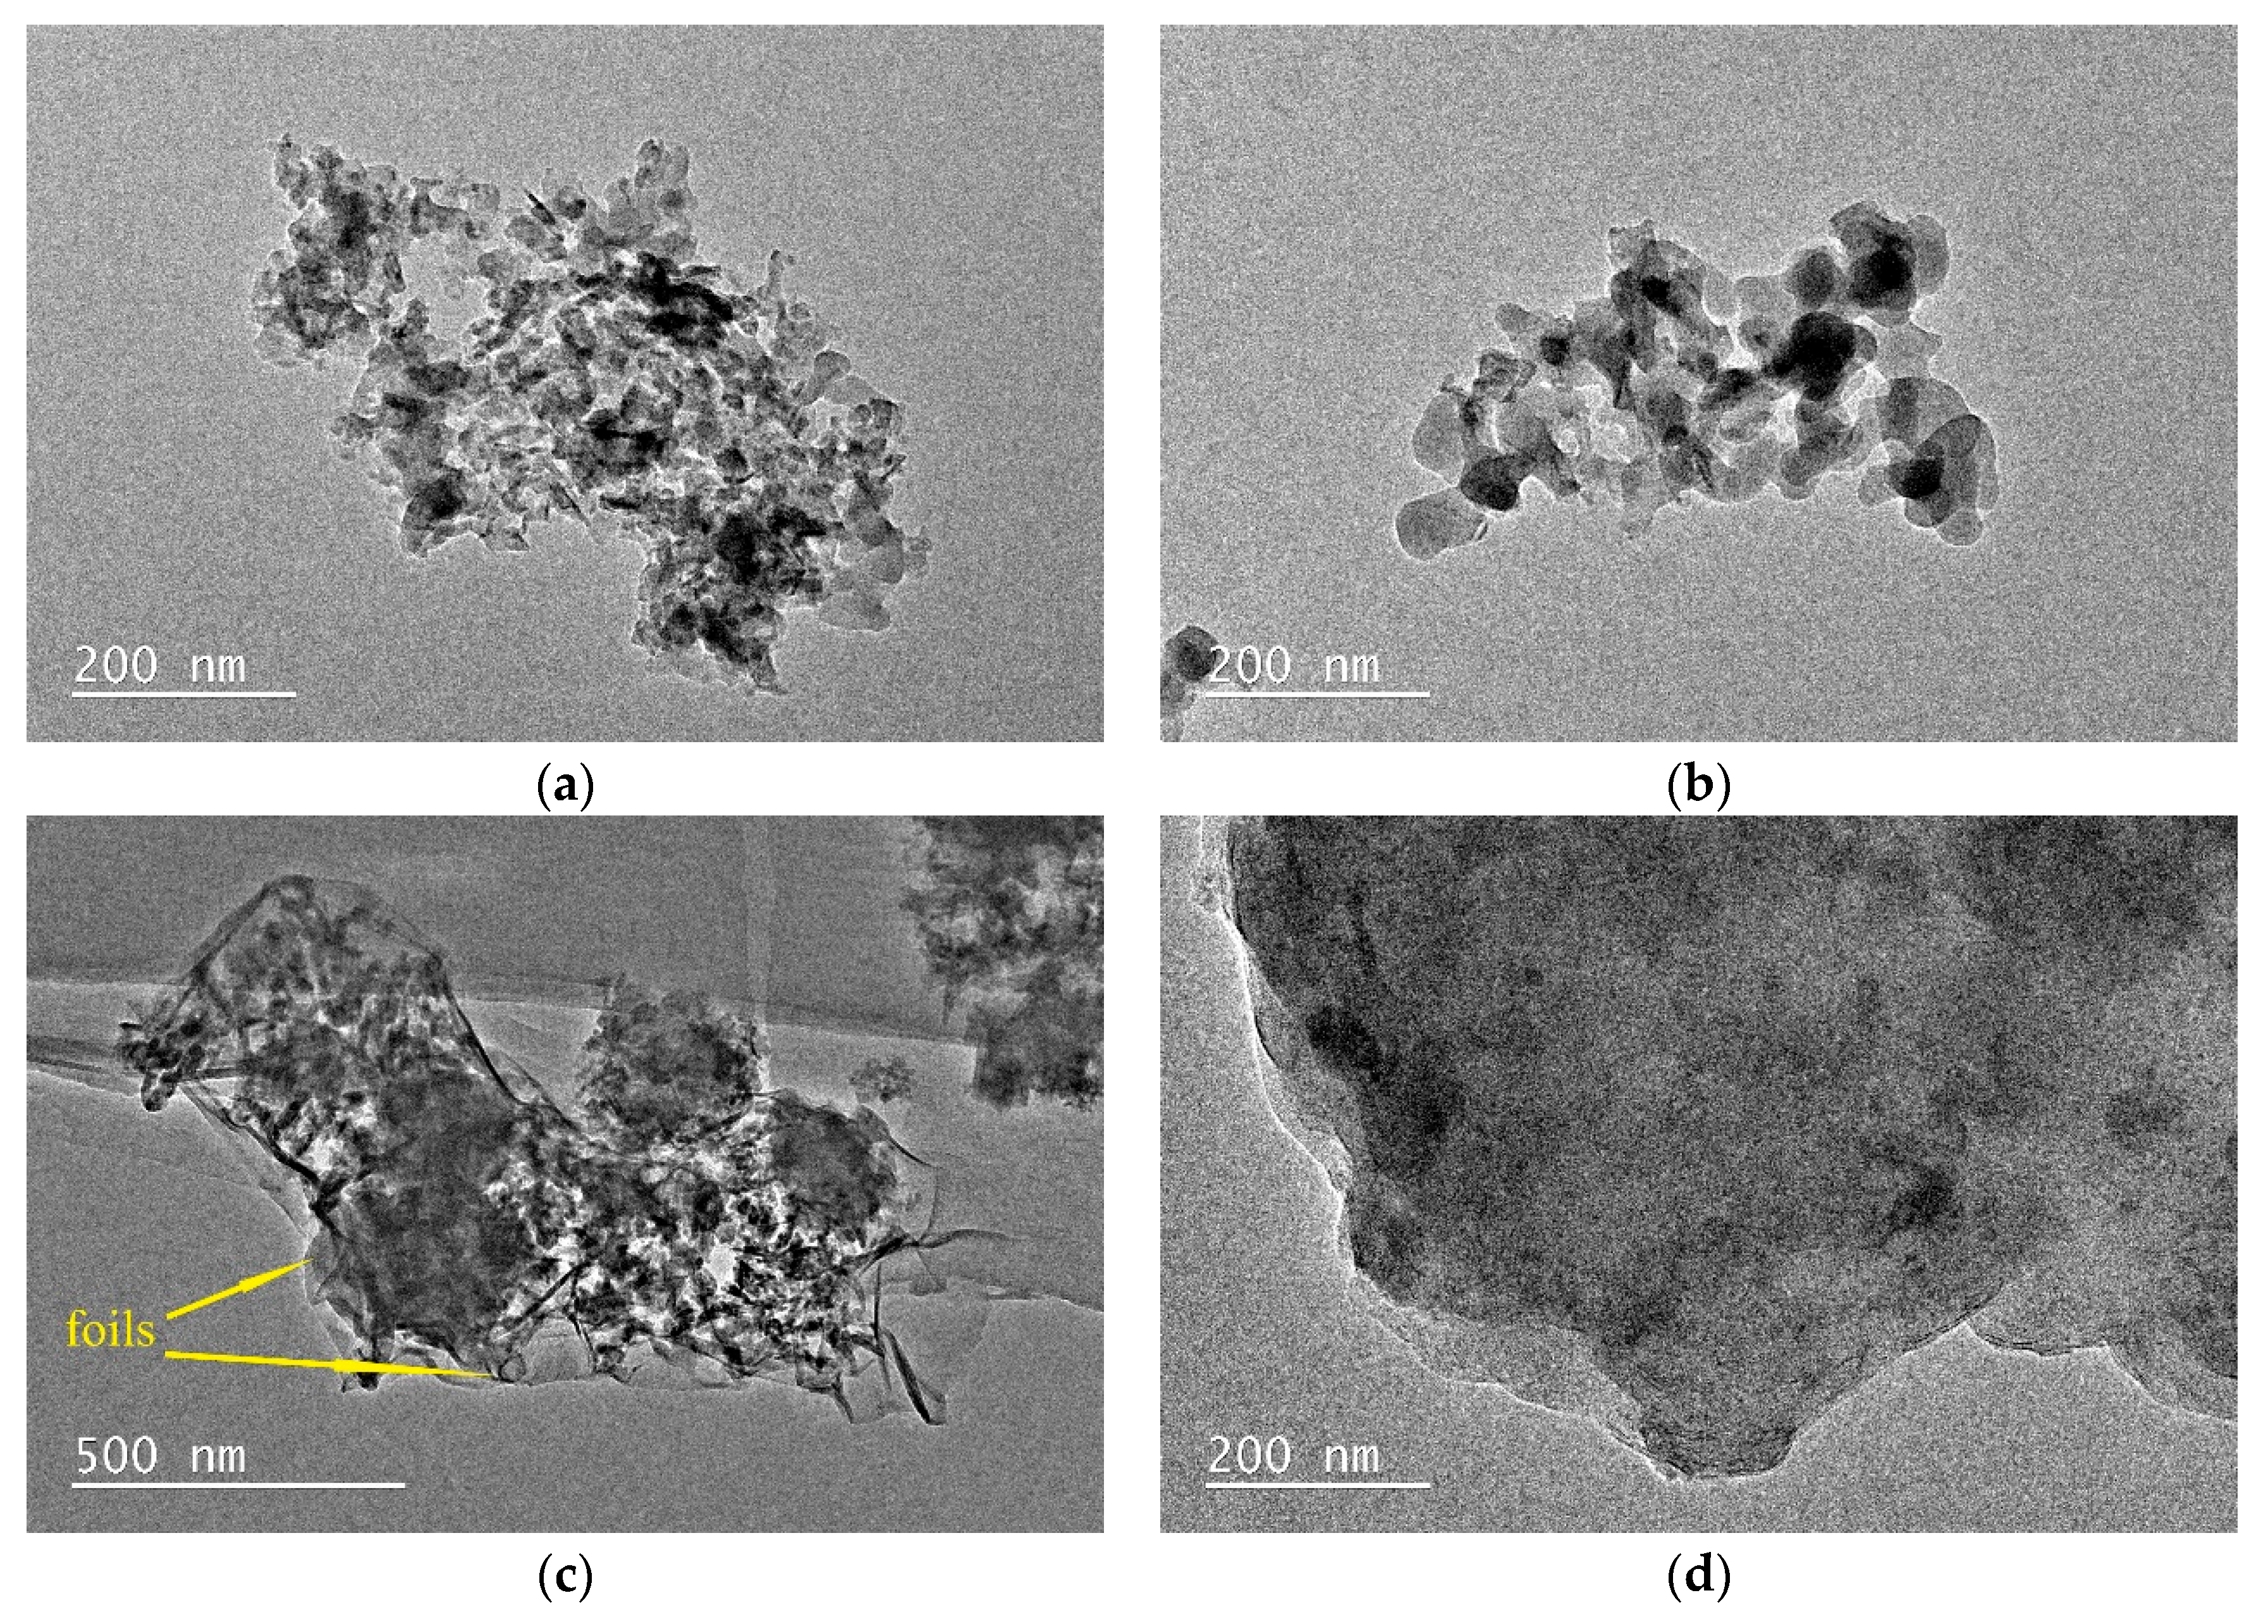
3.6. TEM Analysis
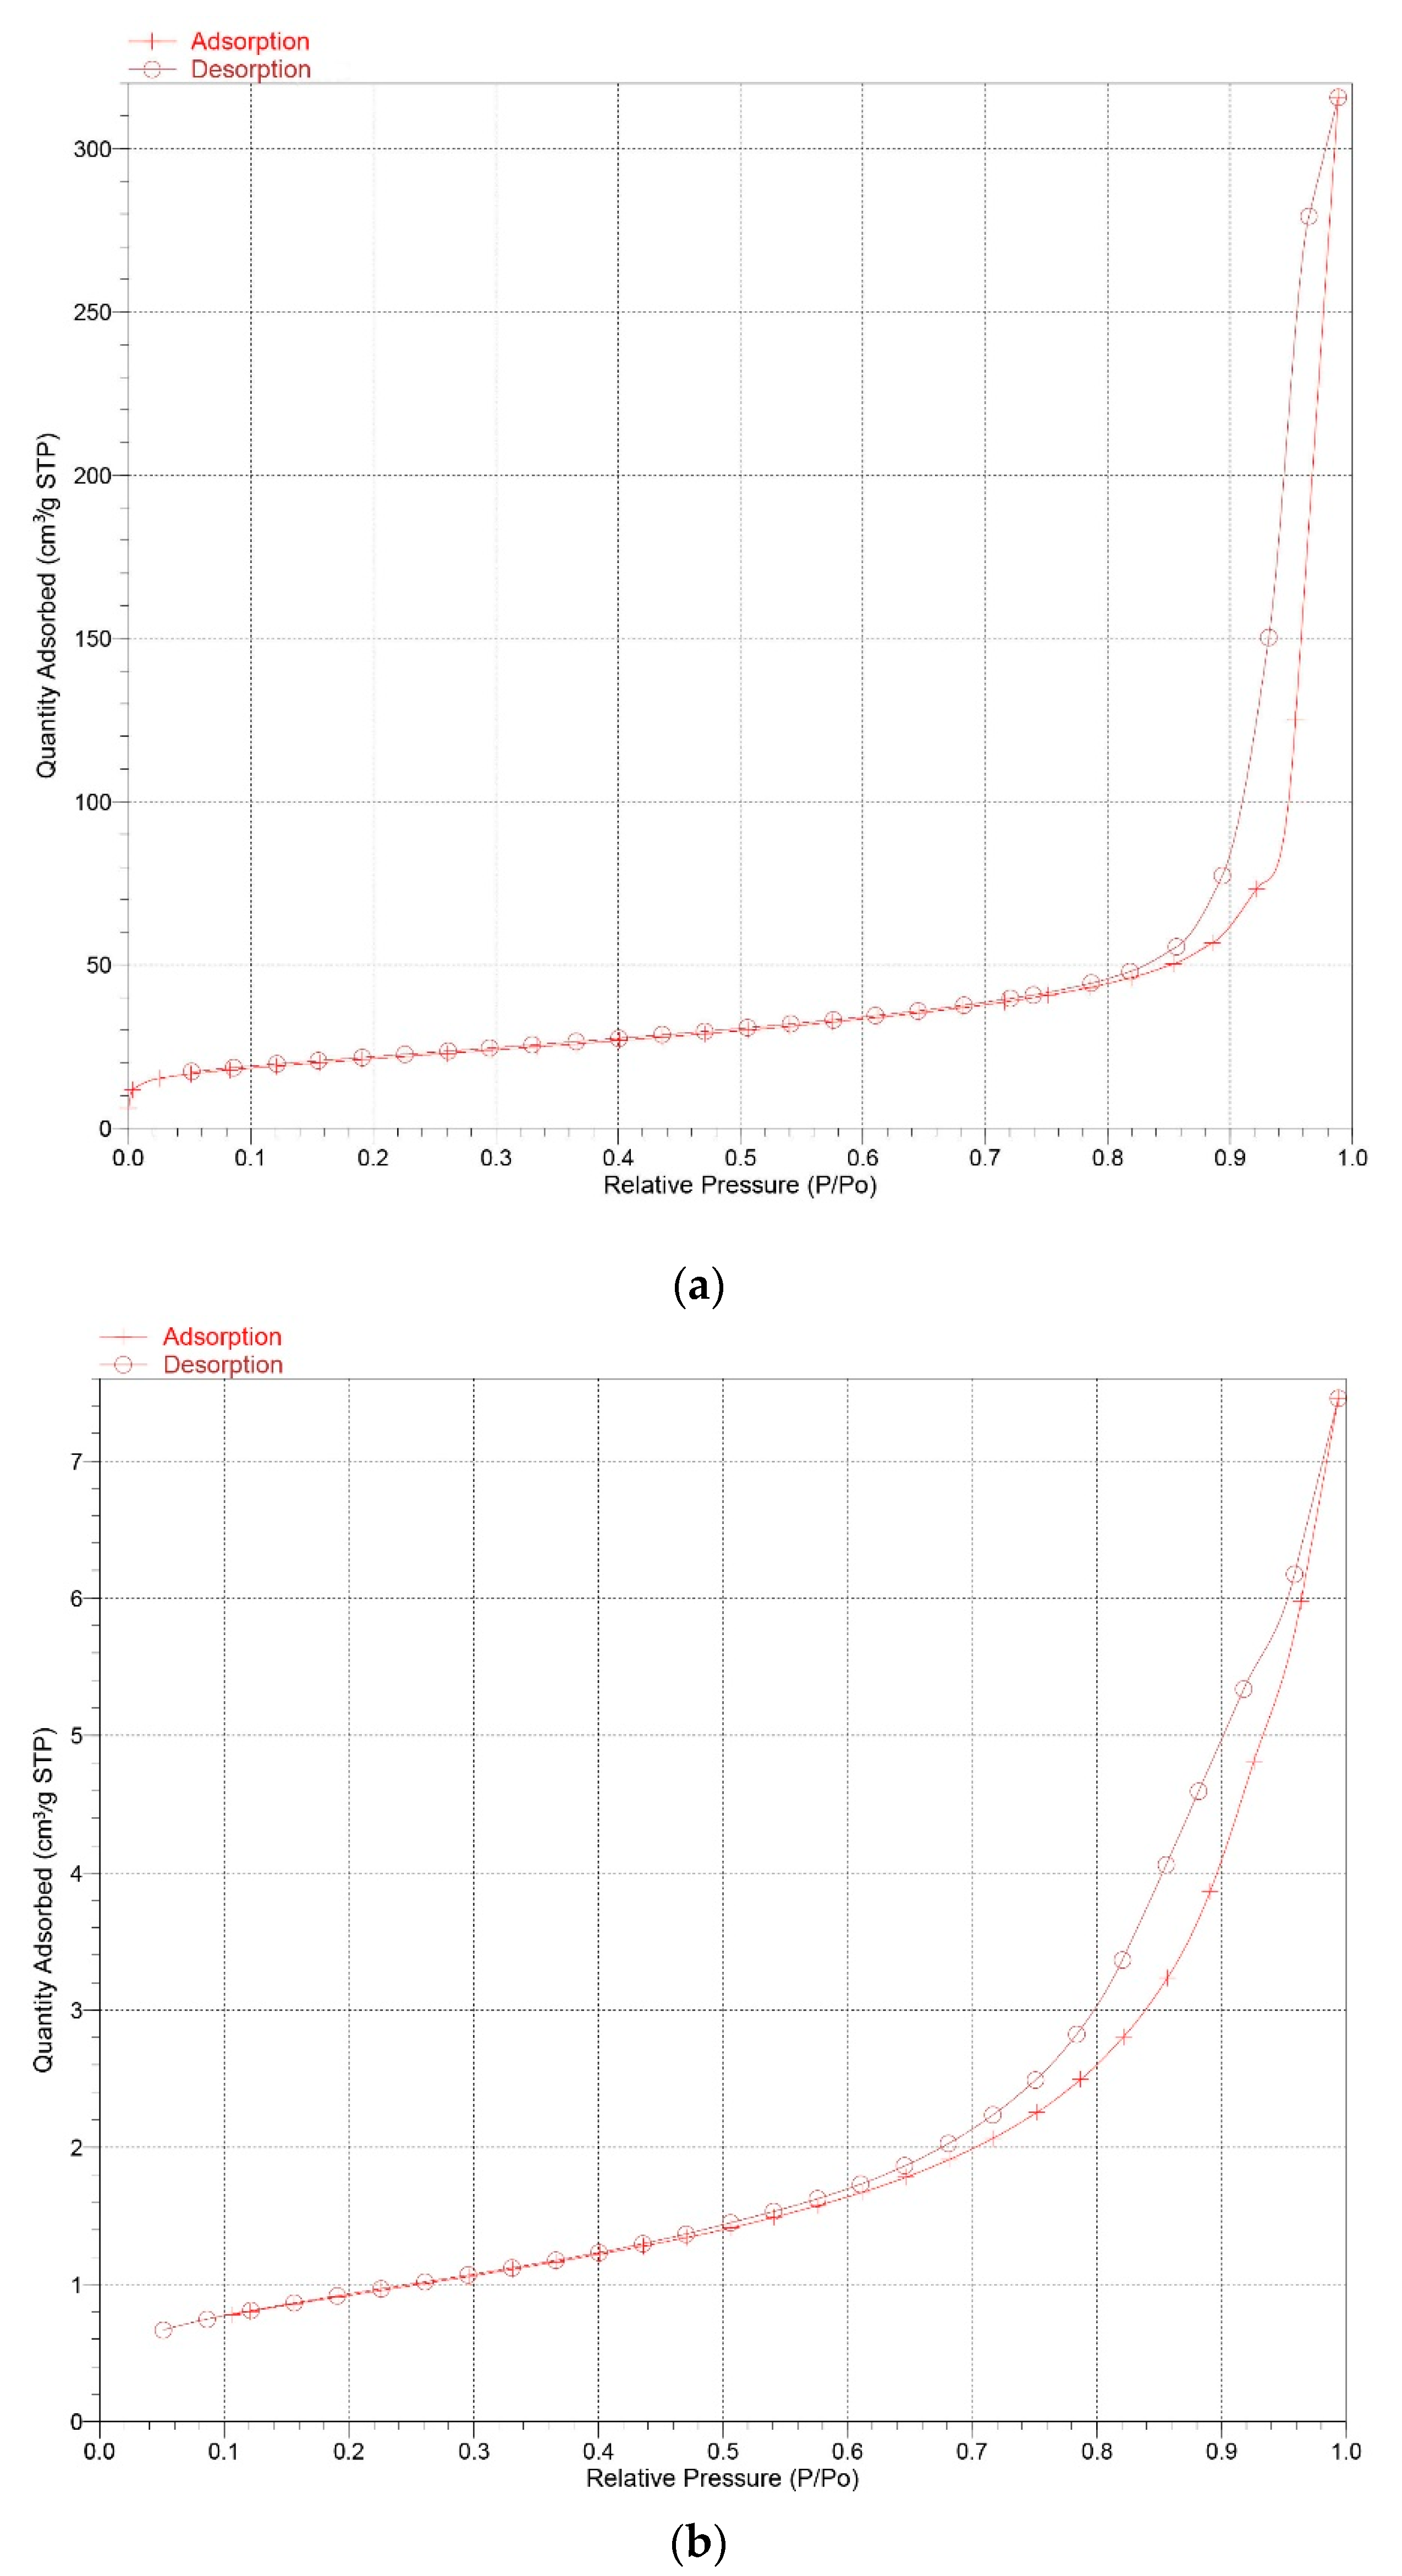
3.7. Particle Size Analysis
4. Conclusions
Author Contributions
Funding
Conflicts of Interest
References
- Gartner, E.M.; Macphee, D.E. A physico-chemical basis for novel cementitious binders. Cem. Concr. Res. 2011, 41, 736–749. [Google Scholar] [CrossRef]
- Walkley, B.; San, N.R.; Sani, M.A.; Gehman, J.D.; van Deventer, J.S.; Provis, J.L. Phase evolution of Na2O-Al2O3-SiO2-H2O gels in synthetic aluminosilicate binders. Dalton Trans. 2016, 45, 5521–5535. [Google Scholar] [CrossRef] [PubMed]
- Liu, B.; Yang, J.; Li, D.; Xing, F.; Fang, Y. Effect of a Synthetic Nano-CaO-Al2O3-SiO2-H2O Gel on the Early-Stage Shrinkage Performance of Alkali-Activated Slag Mortars. Materials 2018, 11, 1128. [Google Scholar] [CrossRef] [PubMed]
- Yang, J.; Li, D.; Fang, Y. Synthesis of Nanoscale CaO-Al2O3-SiO2-H2O and Na2O-Al2O3-SiO2-H2O Using the Hydrothermal Method and Their Characterization. Materials 2017, 10, 695. [Google Scholar] [CrossRef] [PubMed]
- Provis, J.L. Alkali-activated materials. Cem. Concr. Res. 2018, 114, 40–48. [Google Scholar] [CrossRef]
- Škvára, F.; Šmilauer, V.; Hiaváek, P.; Kopecky, L.; Cílová, Z. A weak alkali bond in (N, K)-A-S-H gels: Evidence from leaching and modeling. Ceramics-Silikáty 2012, 56, 374–382. [Google Scholar]
- Yang, J.; Li, D.; Fang, Y. Effect of synthetic CaO-Al2O3-SiO2-H2O on the early-stage performance of alkali-activated slag. Constr. Build. Mater. 2018, 167, 65–72. [Google Scholar] [CrossRef]
- Krivenko, P.V.; Kovalchuk, G.Y. Directed synthesis of alkaline aluminosilicate minerals in a geocement matrix. J. Mater. Sci. 2007, 42, 2944–2952. [Google Scholar] [CrossRef]
- Krivenko, P.V. Status and Prospects of Research and Application of Alkali-Activated Materials. Adv. Sci. Technol. 2010, 69, 1–10. [Google Scholar] [CrossRef]
- Bell, J.L.; Sarin, P.; Provis, J.L.; Haggerty, R.P.; Driemeyer, P.E.; Chupas, P.J.; van Deventer, J.S.J.; Kriven, W.M. Atomic Structure of a Cesium Aluminosilicate Geopolymer: A Pair Distribution Function Study. Chem. Mater. 2010, 20, 4768–4776. [Google Scholar] [CrossRef]
- White, C.E.; Provis, J.L.; Proffen, T.; Van Deventer, J.S.J. The Effects of Temperature on the Local Structure of Metakaolin-Based Geopolymer Binder: A Neutron Pair Distribution Function Investigation. J. Am. Ceram. Soc. 2010, 93, 3486–3492. [Google Scholar] [CrossRef]
- Fernández-Jiménez, A.; Vallepu, R.; Terai, T.; Palomo, A.; Ikeda, K. Synthesis and thermal behavior of different aluminosilicate gels. J. Non-Cryst. Solids 2006, 352, 2061–2066. [Google Scholar] [CrossRef]
- Rovnaník, P. Effect of curing temperature on the development of hard structure of metakaolin-based geopolymer. Constr. Build. Mater. 2010, 24, 1176–1183. [Google Scholar] [CrossRef]
- Lecomte, I.; Henrist, C.; Liégeois, M.; Maseri, F.; Rulmont, A.; Cloots, R. (Micro)-structural comparison between geopolymers, alkali-activated slag cement and Portland cement. J. Eur. Ceram. Soc. 2006, 26, 3789–3797. [Google Scholar] [CrossRef]
- Bach, T.T.H.; Chabas, E.; Pochard, I.; Coumes, C.C.D.; Haas, J.; Frizon, F.; Nonat, A. Retention of alkali ions by hydrated low-pH cements: Mechanism and Na+/K.+ selectivity. Cem. Concr. Res. 2013, 51, 14–21. [Google Scholar] [CrossRef]
- Bach, T.T.H.; Coumes, C.C.D.; Pochard, I.; Mercier, C.; Revel, B.; Nonat, A. Influence of temperature on the hydration products of low pH cements. Cem. Concr. Res. 2012, 42, 805–817. [Google Scholar] [CrossRef]
- SchmelZ, E.C.; Stizbbins, J.F. Glass: gel synthesis of an albite (NaAlSi3O8) glass:An NMR analysis. Geohim. Cosmochim. Acta 1993, 57, 3949–3960. [Google Scholar] [CrossRef]
- Sathupunya, M.; Gulari, E.; Jamieson, A.; Wongkasemjit, S. Microwave-assisted preparation of zeolite K–H from alumatrane and silatrane. Microporous Mesoporous Mater. 2004, 69, 157–164. [Google Scholar] [CrossRef]
- Liu, D.; Yuan, W.; Deng, L.; Yu, W.; Sun, H.; Yuan, P. Preparation of porous diatomite-templated carbons with large adsorption capacity and mesoporous zeolite K-H as a byproduct. J. Colloid Interface Sci. 2014, 424, 22–26. [Google Scholar] [CrossRef]
- Yuan, J.; Yang, J.; Ma, H.; Chang, Q. Preparation of Zeolite F as Slow Release Fertilizers from K-Feldspar Powder. Chemistryselect 2017, 2, 10722–10726. [Google Scholar] [CrossRef]
- Provis, J.L.; Duxson, P.; Lukey, G.C.; van Deventer, J.S.J. Statistical Thermodynamic Model for Si/Al Ordering in Amorphous Aluminosilicates. Chem. Mater. 2005, 17, 2976–2986. [Google Scholar] [CrossRef]
- Sun, G.K.; Young, J.F.; Kirkpatrick, R.J. The role of Al in C-S-H: NMR, XRD, and compositional results for precipitated samples. Cem. Concr. Res. 2006, 36, 18–29. [Google Scholar] [CrossRef]
- Garcia-Lodeiro, I.; Palomo, A.; Fernández-Jiménez, A.; Macphee, D.E. Compatibility studies between N-A-S-H and C-A-S-H gels. Study in the ternary diagram Na2O-CaO-Al2O3-SiO2-H2O. Cem. Concr. Res. 2011, 41, 923–931. [Google Scholar] [CrossRef]
- Kapeluszna, E.; Kotwica, Ł.; Różycka, A.; Gołek, Ł. Incorporation of Al in C-A-S-H gels with various Ca/Si and Al/Si ratio: Microstructural and structural characteristics with DTA/TG, XRD, FTIR and TEM analysis. Constr. Build. Mater. 2017, 155, 643–653. [Google Scholar] [CrossRef]
- Thomas, J.J.; FitzGerald, S.A.; Neumann, D.A.; Livingston, R.A. State of Water in Hydrating Tricalcium Silicate and Portland Cement Pastes as Measured by Quasi-Elastic Neutron Scattering. J. Am. Ceram. Soc. 2001, 84, 1811–1816. [Google Scholar] [CrossRef]
- Kupwade-Patil, K.; Tyagi, M.; Brown, C.M.; Büyüköztürk, O. Water dynamics in cement paste at early age prepared with pozzolanic volcanic ash and Ordinary Portland Cement using quasielastic neutron scattering. Cem. Concr. Res. 2016, 86, 55–62. [Google Scholar] [CrossRef]
- García-Lodeiro, I.; Fernández-Jiménez, A.; Palomo, A.; Macphee, D.E. Effect of Calcium Additions on N-A-S-H Cementitious Gels. J. Am. Ceram. Soc. 2010, 93, 1934–1940. [Google Scholar] [CrossRef]
- García-Lodeiro, I.; Fernández-Jiménez, A.; Blanco, M.T.; Palomo, A. FTIR study of the sol-gel synthesis of cementitious gels: C-S-H and N-A-S-H. J. Sol-Gel Sci. Technol. 2008, 45, 63–72. [Google Scholar] [CrossRef]
- García Lodeiro, I.; Macphee, D.E.; Palomo, A.; Fernández-Jiménez, A. Effect of alkalis on fresh C-S-H gels, FTIR analysis. Cem. Concr. Res. 2009, 39, 147–153. [Google Scholar] [CrossRef]
- Mostafa, N.Y.; Shaltout, A.A.; Omar, H.; Abo-El-Enein, S.A. Hydrothermal synthesis and characterization of aluminium and sulfate substituted 1.1nm tobermorites. J. Alloys Compd. 2009, 467, 332–337. [Google Scholar] [CrossRef]
- Walkley, B.; San Nicolas, R.; Sani, M.; Rees, G.J.; Hanna, J.V.; van Deventer, J.S.J.; Provis, J.L. Phase evolution of C-(N)-A-S-H/N-A-S-H gel blends investigated via alkali-activation of synthetic calcium aluminosilicate precursors. Cem. Concr. Res. 2016, 89, 120–135. [Google Scholar] [CrossRef]
- García Lodeiro, I.; Fernández-Jimenez, A.; Palomo, A.; Macphee, D.E. Effect on fresh C-S-H gels of the simultaneous addition of alkali and aluminium. Cem. Concr. Res. 2010, 40, 27–32. [Google Scholar] [CrossRef]
- Škvára, F.; Kopecký, L.; Šmilauer, V.; Bittnar, Z. Material and structural characterization of alkali activated low-calcium brown coal fly ash. J. Hazard. Mater. 2009, 168, 711–720. [Google Scholar] [CrossRef] [PubMed]
- Lee, W.K.W.; van Deventer, J.S.J. Use of Infrared Spectroscopy to Study Geopolymerization of Heterogeneous Amorphous Aluminosilicates. Langmuir 2003, 19, 8726–8734. [Google Scholar] [CrossRef]
- Rowles, M.R.; Hanna, J.V.; Pike, K.J.; Smith, M.E. O’Connor BH, 29Si, 27Al, 1H and 23Na MAS NMR Study of the Bonding Character in Aluminosilicate Inorganic Polymers. Appl. Magn. Reson. 2007, 32, 663–689. [Google Scholar] [CrossRef]
- Oudadesse, H.; Derrien, A.C.; Lefloch, M.; Davidovits, J. MAS-NMR studies of geopolymers heat-treated for applications in biomaterials field. J. Mater. Sci. 2010, 42, 3092–3098. [Google Scholar] [CrossRef]
- Guo, X.; Meng, F.; Shi, H. Microstructure and characterization of hydrothermal synthesis of Al-substituted tobermorite. Constr. Build. Mater. 2017, 133, 253–260. [Google Scholar] [CrossRef]
- Knight, C.T.G.; Balec, R.J.; Kinrade, S.D. The Structure of Silicate Anions in Aqueous Alkaline Solutions. Angew. Chem. Int. Ed. 2007, 46, 8148–8152. [Google Scholar] [CrossRef]
- Duxson, P.; Provis, J.L.; Lukey, G.C.; Mallicoat, S.W.; Kriven, W.M.; van Deventer, J.S.J. Understanding the relationship between geopolymer composition, microstructure and mechanical properties. Colloids Surf. A Physicochem. Eng. Asp. 2005, 269, 47–58. [Google Scholar] [CrossRef]
- Duxson, P.; Provis, J.L.; Lukey, G.C.; Separovic, F.; van Deventer, J.S.J. 29Si NMR Study of Structural Ordering in Aluminosilicate Geopolymer Gels. Langmuir 2005, 21, 3028–3036. [Google Scholar] [CrossRef]
- Marakatti, V.S.; Rao, P.V.C.; Choudary, N.V.; Ganesh, G.S.; Shah, G.; Maradur, S.P.; Halgeri, A.B.; Shanbhag, G.V.; Ravishankar, R. Influence of Alkaline Earth Cation Exchanged X-Zeolites Towards Ortho-Selectivity in Alkylation of Aromatics: Hard-Soft-Acid-Base Concept. Adv. Porous Mater. 2014, 2, 221–229. [Google Scholar] [CrossRef]
- Pena, P.; Rivas Mercury, J.M.; de Aza, A.H.; Turrillas, X.; Sobrados, I.; Sanz, J. Solid-state 27Al and 29Si NMR characterization of hydrates formed in calcium aluminate-silica fume mixtures. J. Solid State Chem. 2008, 181, 1744–1752. [Google Scholar] [CrossRef]


| Sample | K2O/SiO2 | SiO2/Al2O3 | Water/Solid Ratio |
|---|---|---|---|
| K-A-S-H1.01 | 1.0 | 1.0 | 5.0 |
| K-A-S-H2.01 | 2.0 | 1.0 | 5.0 |
| K-A-S-H0.52 | 0.5 | 2.0 | 5.0 |
| K-A-S-H1.02 | 1.0 | 2.0 | 5.0 |
| K-A-S-H2.02 | 2.0 | 2.0 | 5.0 |
| 2.02-7d-60 | 2.01-3d-95 | 2.02-3d-95 | 0.52-7d-95 | 1.02-7d-95 | 2.02-7d-95 |
|---|---|---|---|---|---|
| 74.23 | 50.07 | 34.17 | 32.32 | 11.96 | 3.34 |
© 2019 by the authors. Licensee MDPI, Basel, Switzerland. This article is an open access article distributed under the terms and conditions of the Creative Commons Attribution (CC BY) license (http://creativecommons.org/licenses/by/4.0/).
Share and Cite
Liu, B.; Zhu, C.; Zhuang, K.; Shuai, L.; Li, D.; Long, W.; Xing, F.; Fang, Y. Insights into the Microstructure of Hydrothermal Synthesized Nanoscale K2O-Al2O3-SiO2-H2O Particles. Nanomaterials 2020, 10, 63. https://doi.org/10.3390/nano10010063
Liu B, Zhu C, Zhuang K, Shuai L, Li D, Long W, Xing F, Fang Y. Insights into the Microstructure of Hydrothermal Synthesized Nanoscale K2O-Al2O3-SiO2-H2O Particles. Nanomaterials. 2020; 10(1):63. https://doi.org/10.3390/nano10010063
Chicago/Turabian StyleLiu, Bao, Chunyan Zhu, Kunde Zhuang, Le Shuai, Dongxu Li, Wujian Long, Feng Xing, and Yuan Fang. 2020. "Insights into the Microstructure of Hydrothermal Synthesized Nanoscale K2O-Al2O3-SiO2-H2O Particles" Nanomaterials 10, no. 1: 63. https://doi.org/10.3390/nano10010063
APA StyleLiu, B., Zhu, C., Zhuang, K., Shuai, L., Li, D., Long, W., Xing, F., & Fang, Y. (2020). Insights into the Microstructure of Hydrothermal Synthesized Nanoscale K2O-Al2O3-SiO2-H2O Particles. Nanomaterials, 10(1), 63. https://doi.org/10.3390/nano10010063