Spectroscopic and Microscopic Analyses of Fe3O4/Au Nanoparticles Obtained by Laser Ablation in Water
Abstract
1. Introduction
2. Materials and Methods
2.1. Laser Ablation
2.2. UV–Visible Extinction Spectroscopy
2.3. Microscopic Techniques
2.4. Raman Spectroscopy
2.5. X-ray Photoelectron Spectroscopy
2.6. Density Functional Theory Calculations
3. Results and Discussion
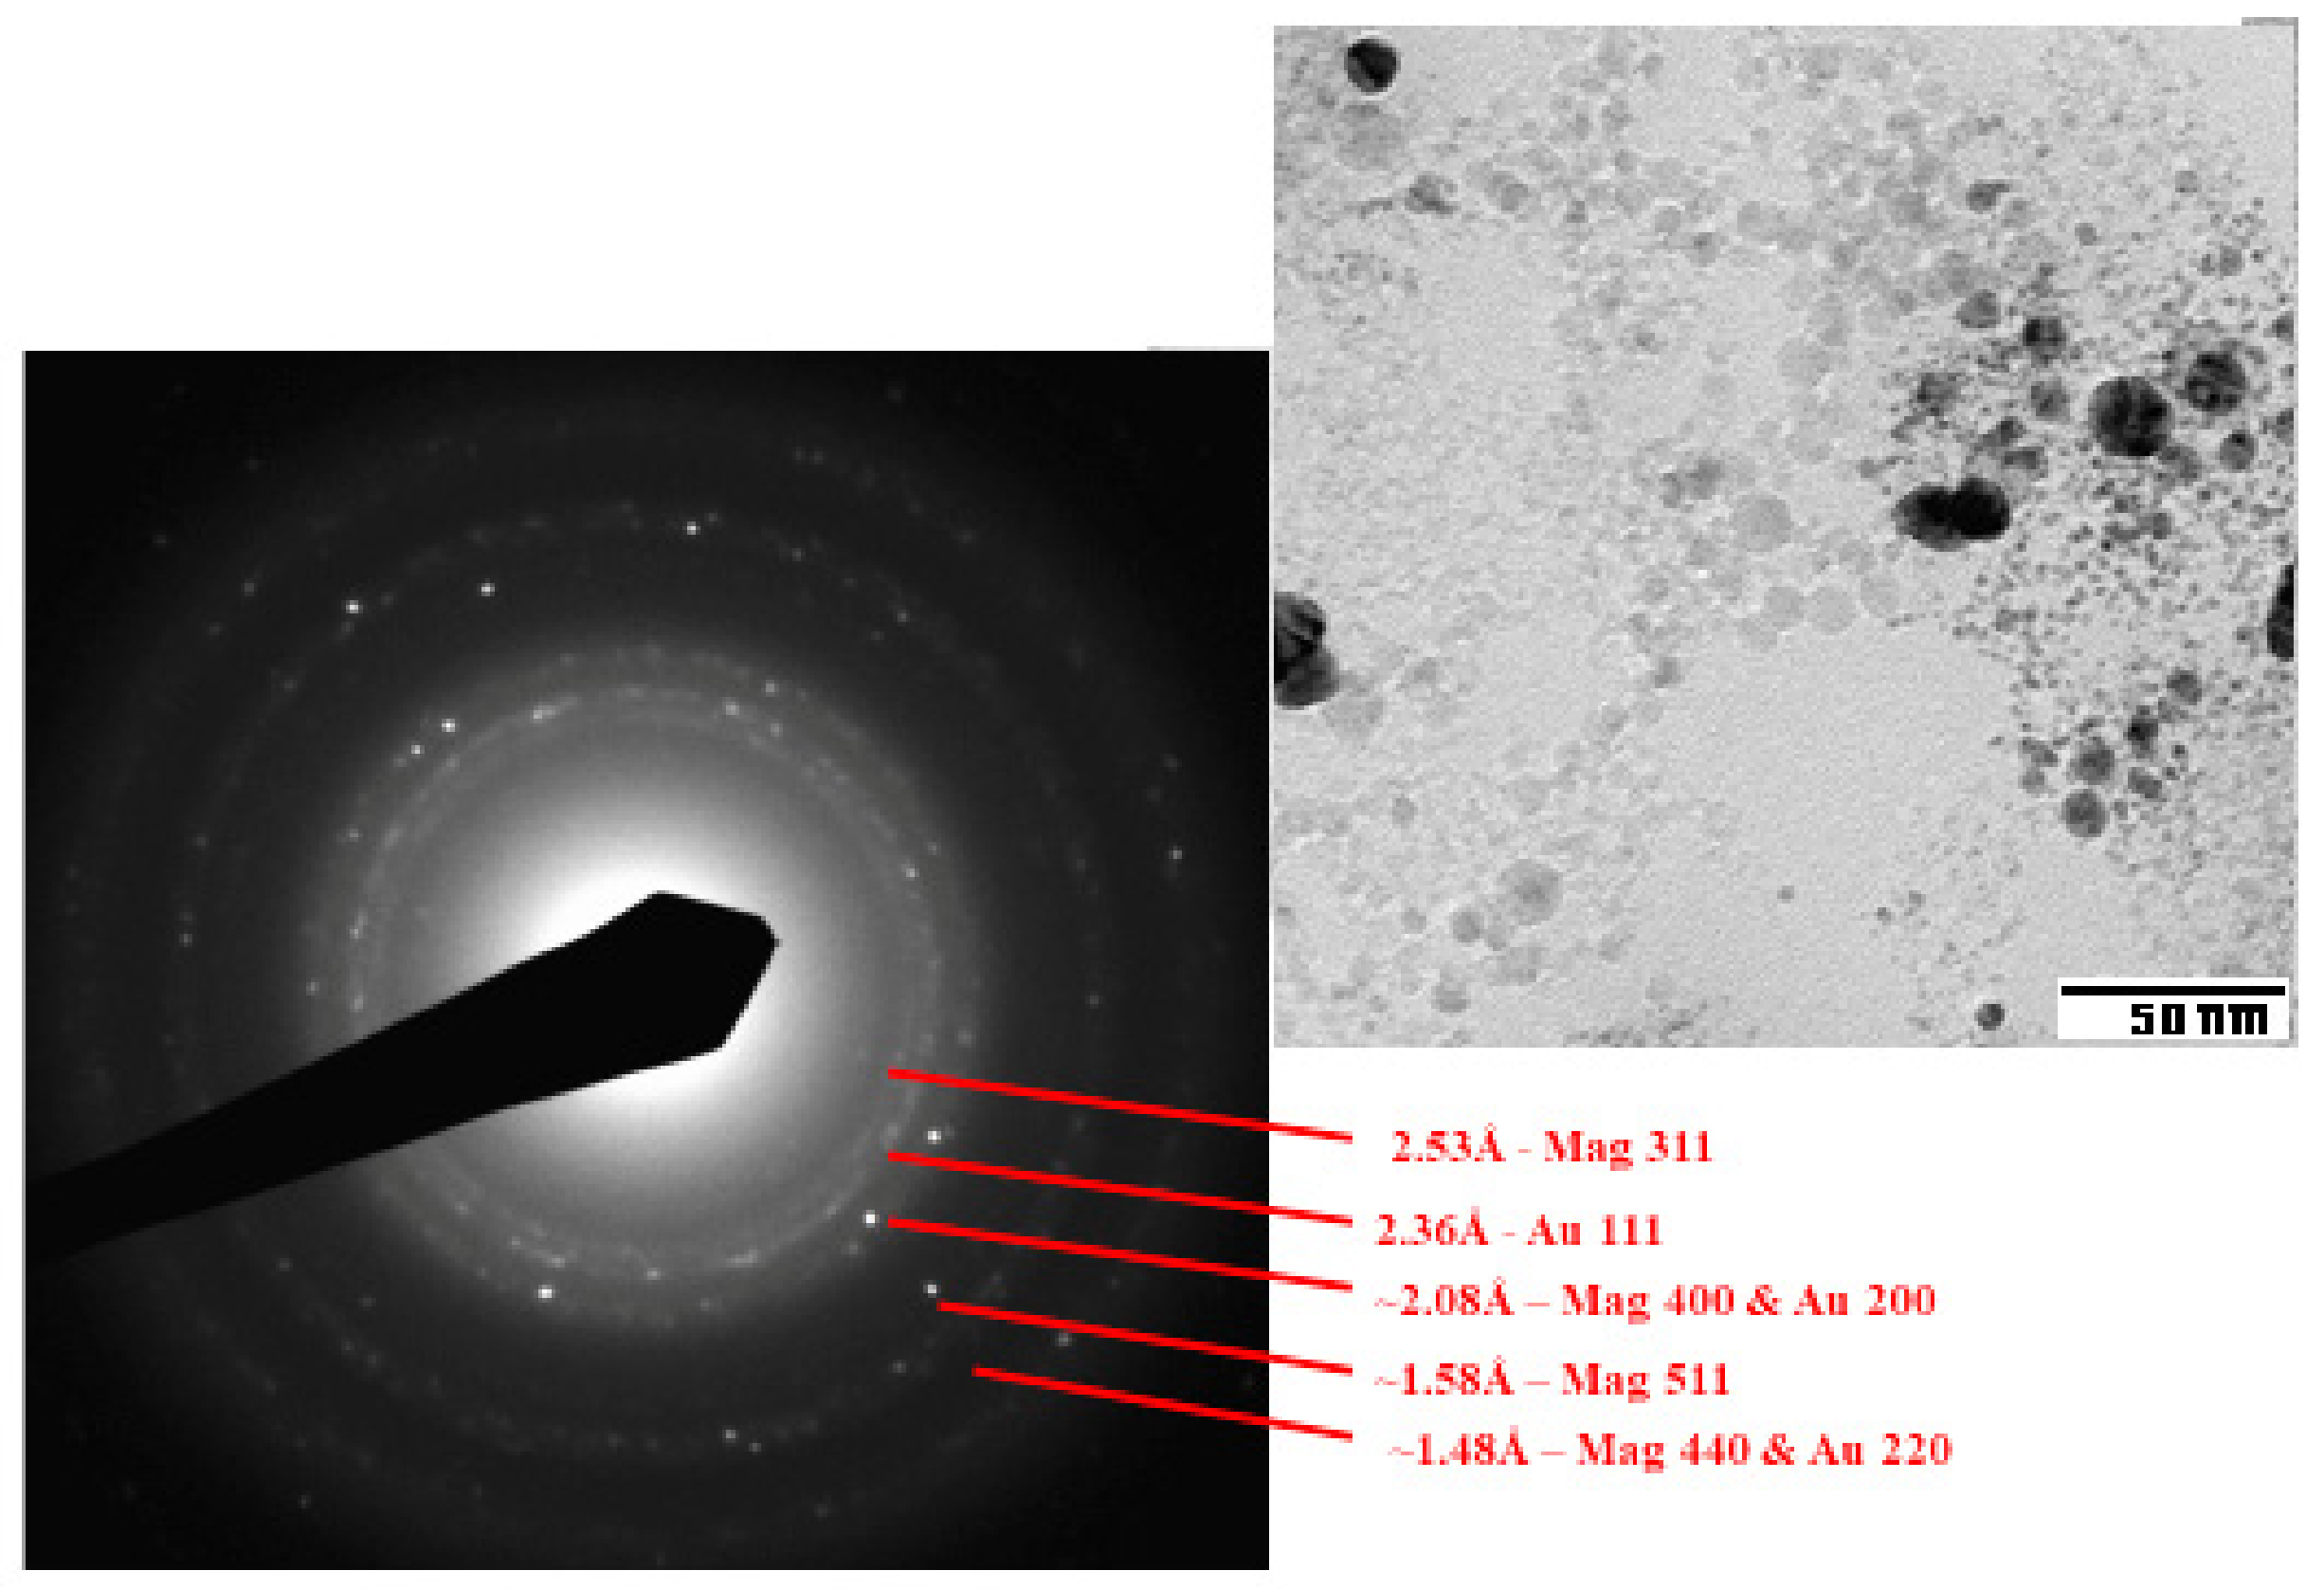
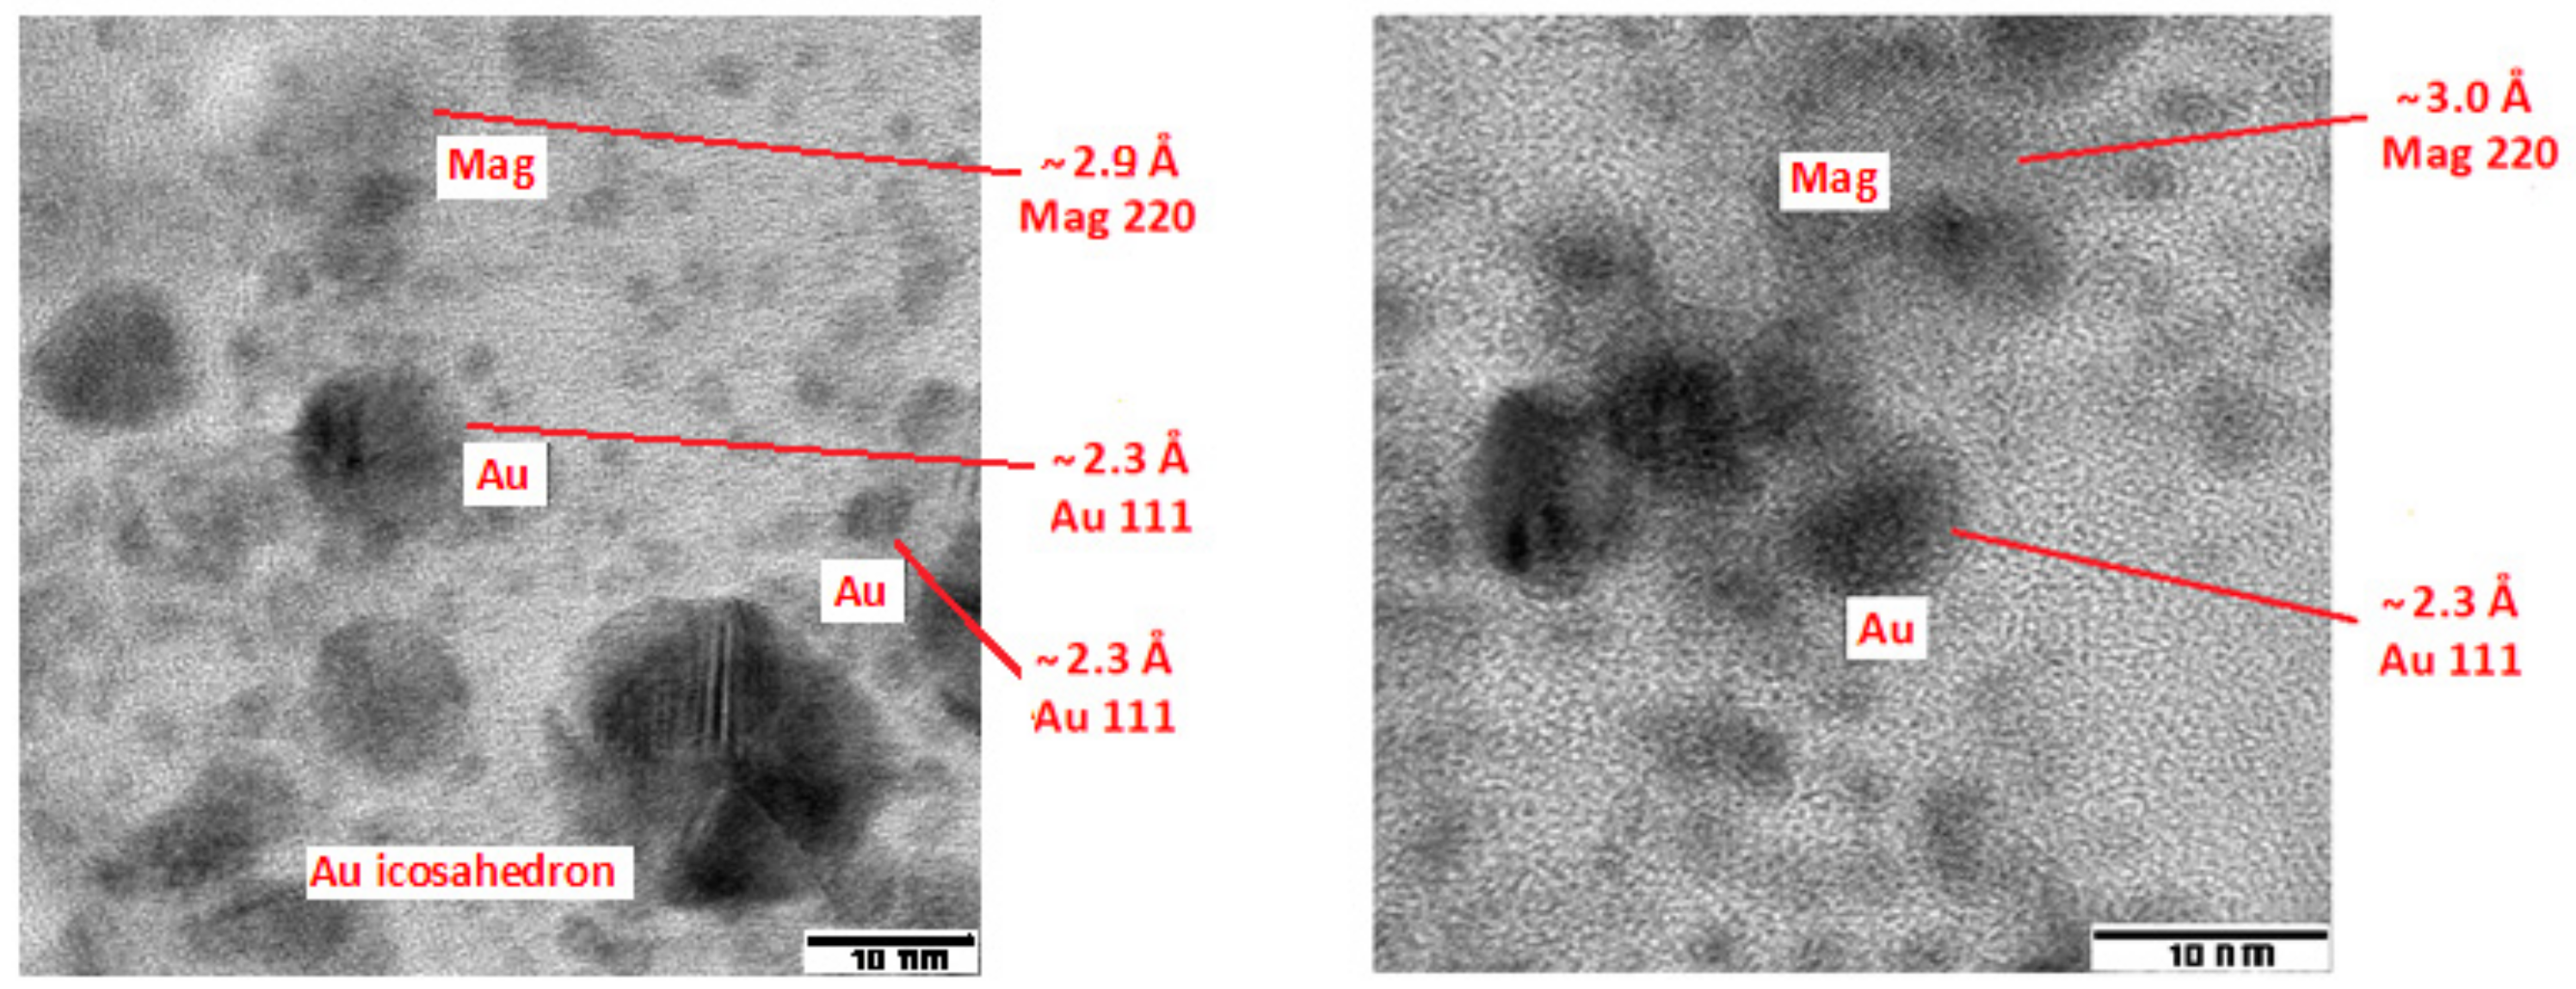
3.1. Microscopic Investigation
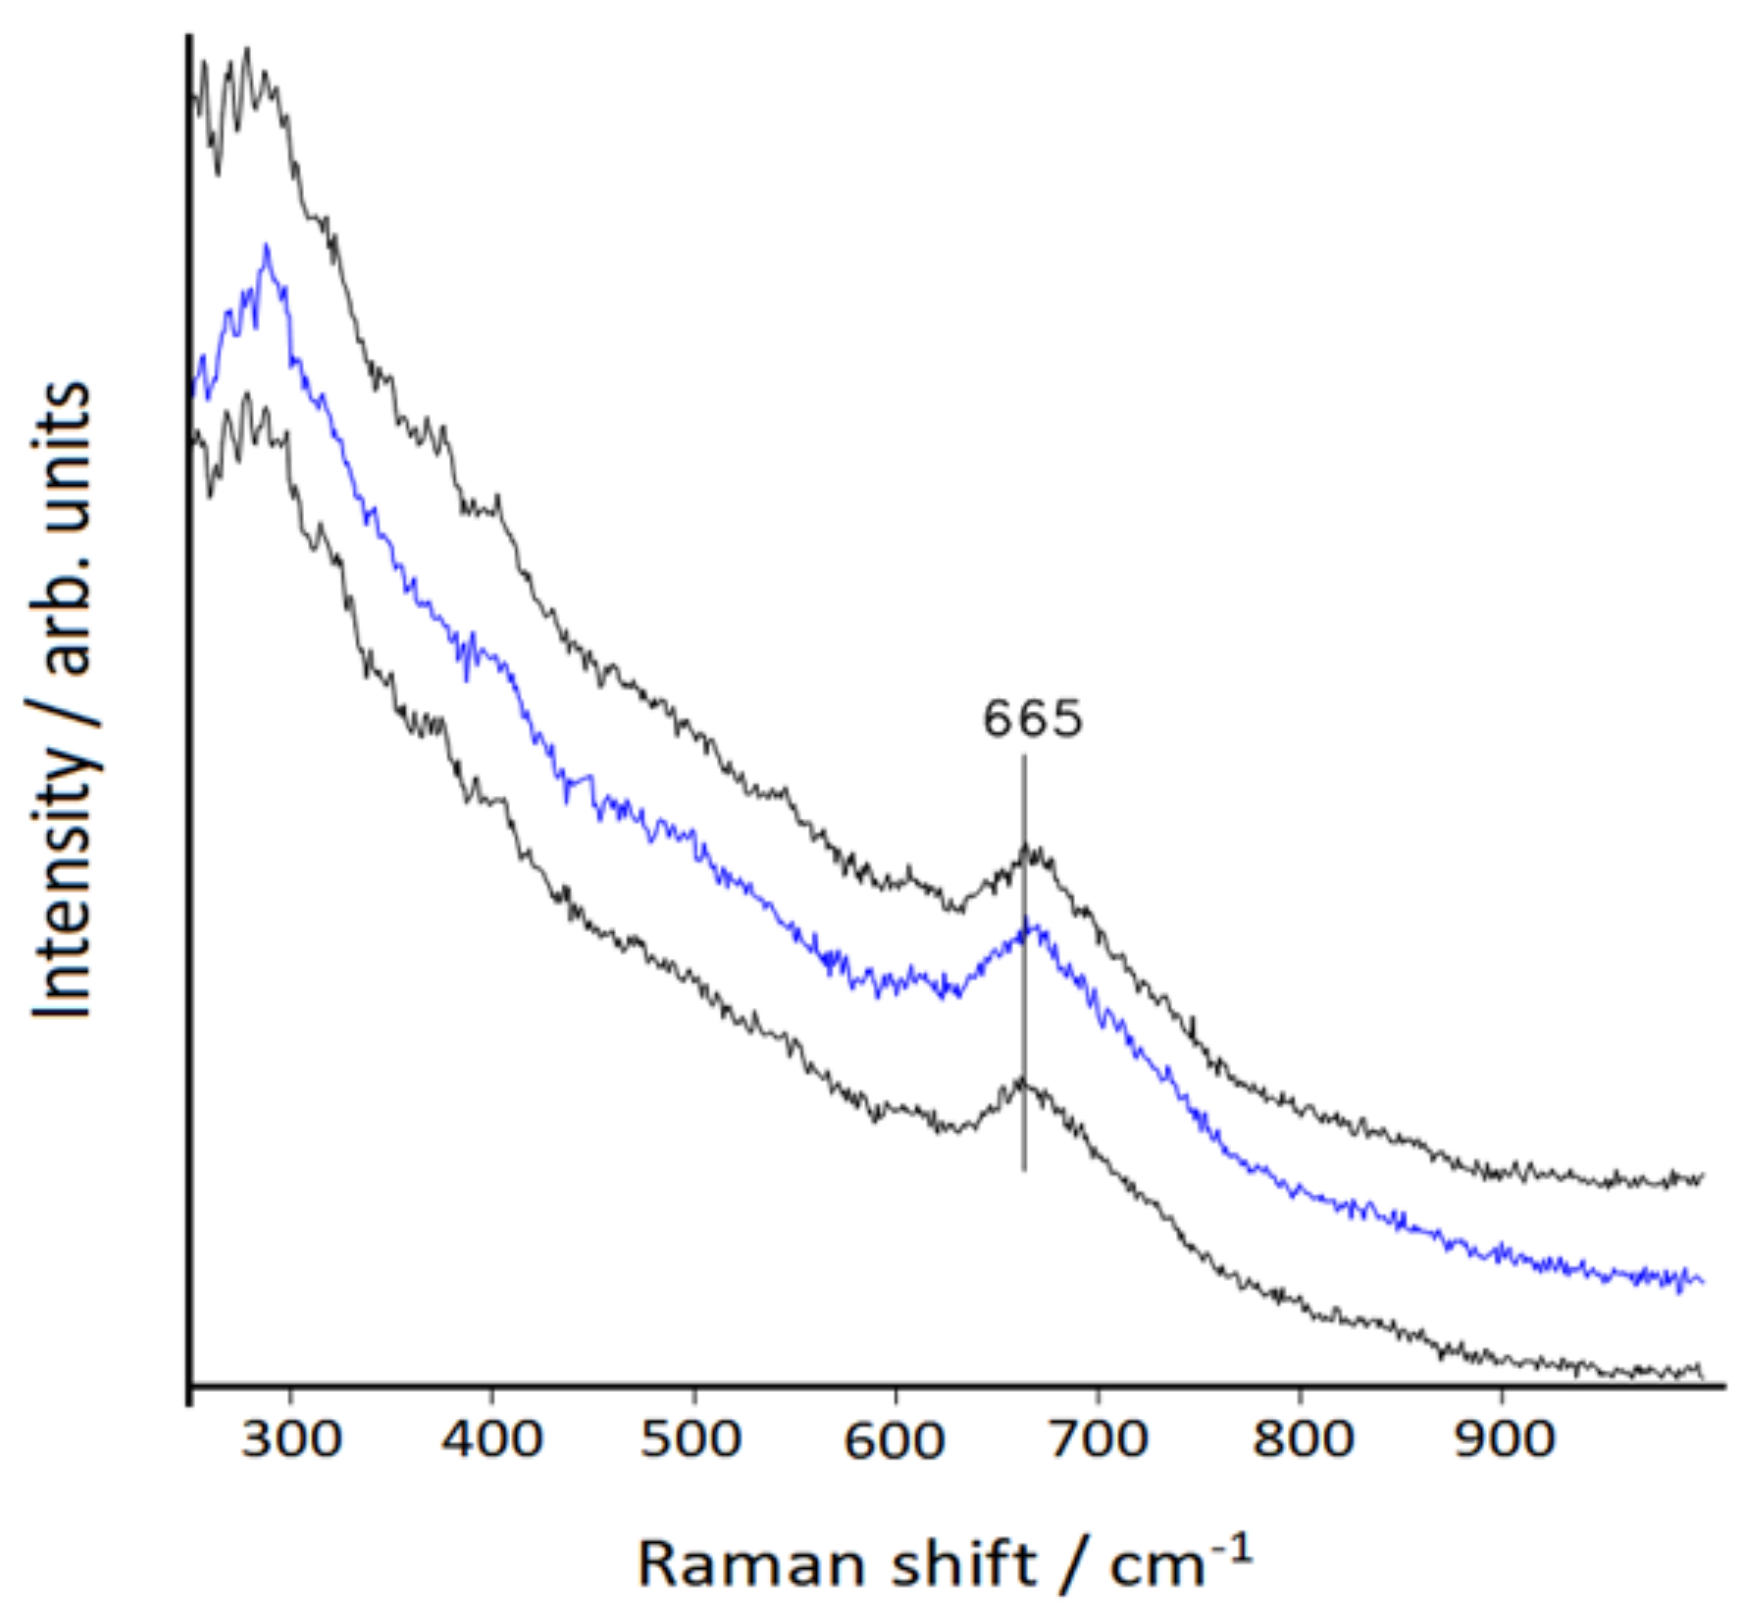
3.2. Raman Spectra
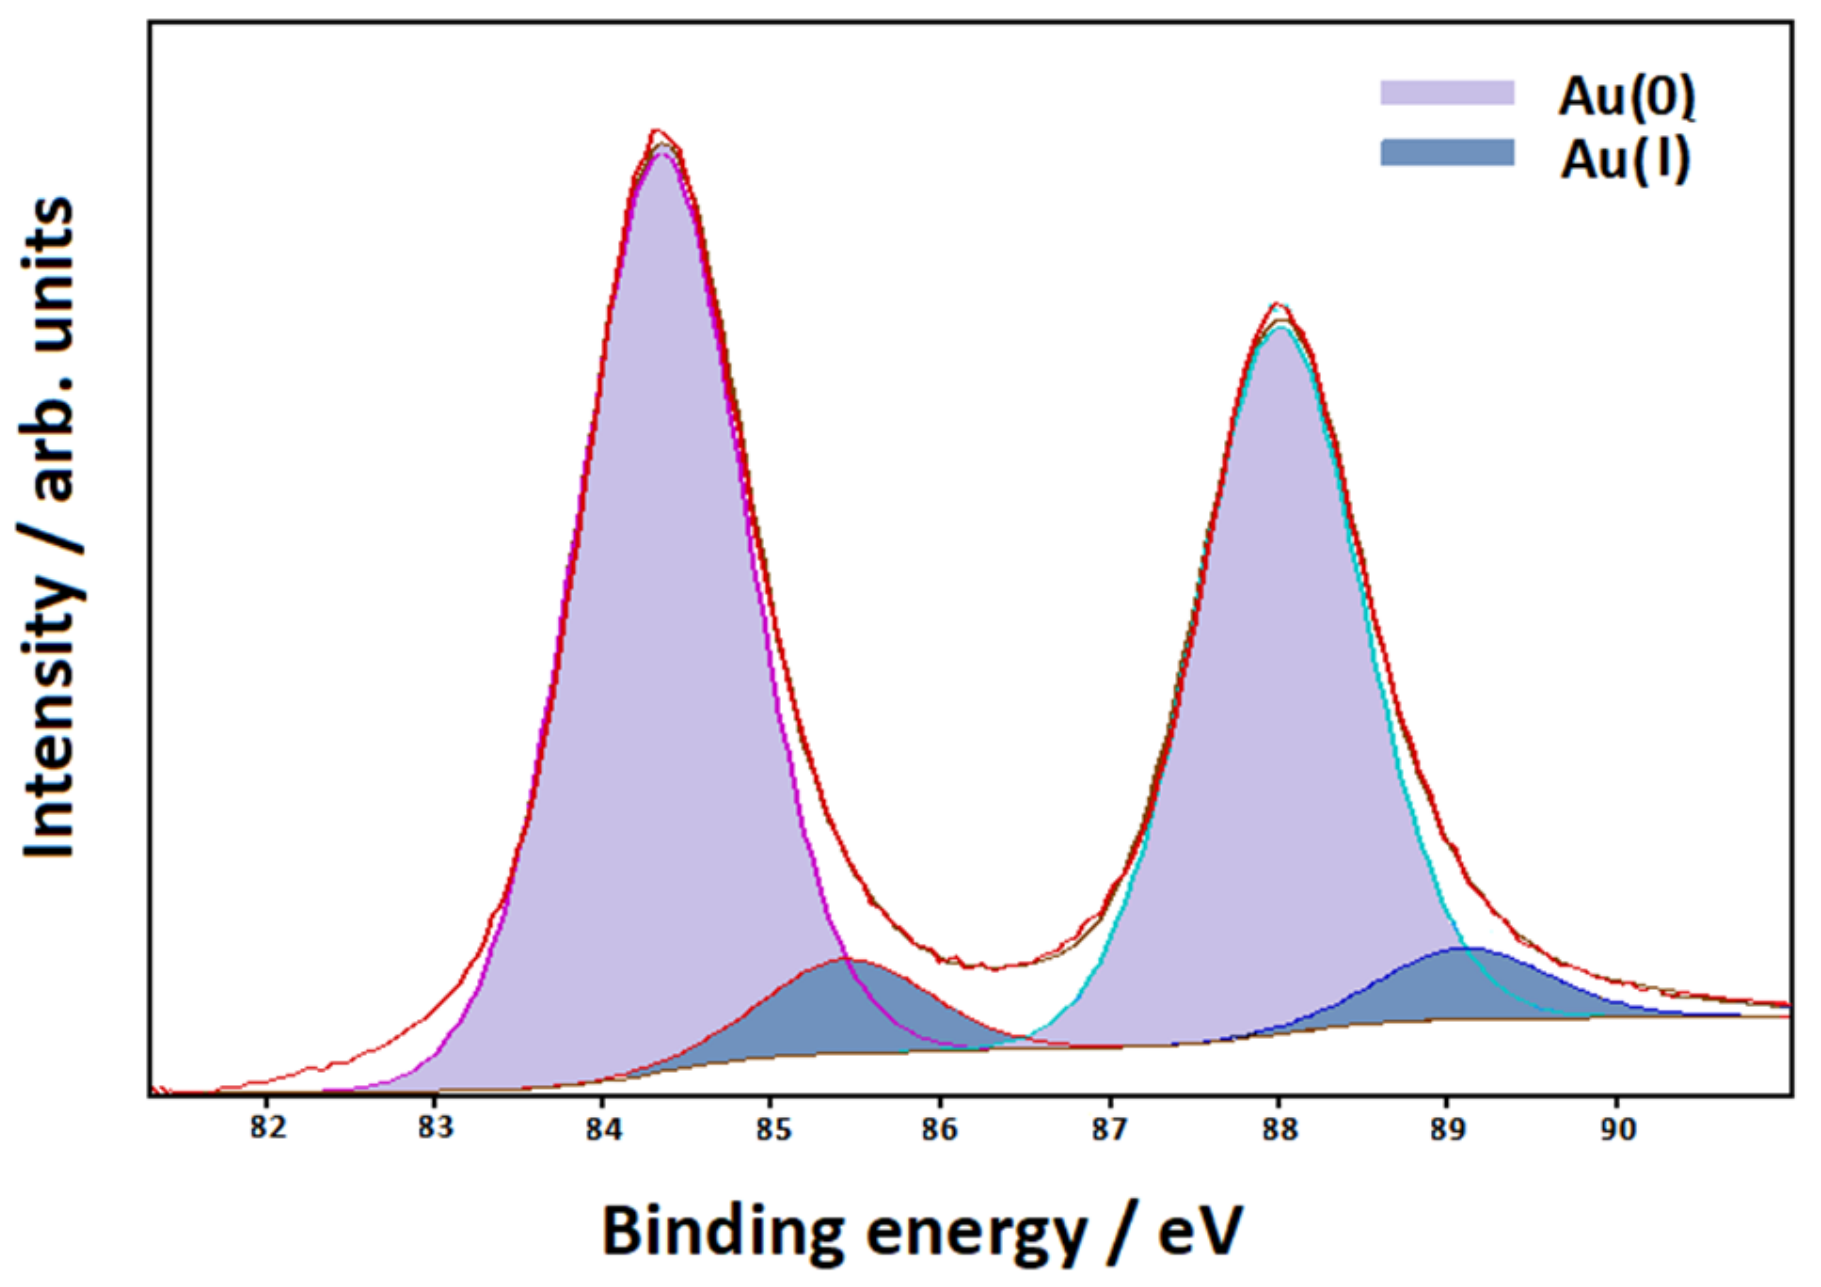
3.3. XPS Measurements
3.4. UV–Visible Extinction Spectra
3.5. Surface-Enhanced Raman Scattering
3.6. DFT Calculations
- (a).
- (b).
- Core electrons can be treated in an approximate way via effective core potentials (ECPs). This treatment includes scalar relativistic effects, which are important for the proper description of the geometric, electronic, and spectroscopic properties of heavy atoms. The LanL2DZ basis set is the best known basis set for molecular systems containing these atoms and for the efficient simulation of the Raman spectra of complexes with transition metals and the SERS spectra of molecules adsorbed on silver or gold nanoparticles, as demonstrated by many recent papers (for example, [38,50,52,53,54,55]).
4. Conclusions
Supplementary Materials
Author Contributions
Funding
Acknowledgments
Conflicts of Interest
References
- Schlücker, S. Surface Enhanced Raman Spectroscopy: Analytical, Biophysical and Life Science Applications; Wiley-VCH: Weinheim, Germany, 2011. [Google Scholar]
- Procházka, M. Surface-Enhanced Raman Spectroscopy, Bioanalytical, Biomolecular and Medical Applications; Springer: Basel, Switzerland, 2016. [Google Scholar]
- Wang, Y.-X.J. Super paramagnetic iron oxide based MRI contrast agents: Current status of clinical applications. Quant. Imaging Med. Surg. 2001, 1, 35–40. [Google Scholar]
- Cervadoro, A.; Giverso, C.; Pande, R.; Sarangi, S.; Preziosi, L.; Wosik, J.; Brazdeikis, A.; Decuzzi, P. Design maps for the hyperthermic treatment of tumors with superparamagnetic nanoparticles. PLoS ONE 2013, 8, e57332. [Google Scholar] [CrossRef] [PubMed]
- Zhang, Y.; Qian, J.; Wang, D.; Wang, Y.; He, S. Multifunctional gold nanorods with ultrahigh, stability and tunability for in vivo fluorescence imaging, SERS detection, and photodynamic therapy. Angew. Chem. Int. Ed. 2013, 52, 1148–1151. [Google Scholar] [CrossRef] [PubMed]
- Park, Y.I.; Kim, H.M.; Kim, J.H.; Moon, K.C.; Yoo, B.; Lee, K.T.; Lee, N.; Choi, Y.; Park, W.; Ling, D.; et al. Theranostic probe based on lanthanide-doped nanoparticles for simultaneous in vivo dual-modal imaging and photodynamic therapy. Adv. Mater. 2012, 24, 5755–5761. [Google Scholar] [CrossRef]
- Yathindranath, V.; Rebbouh, L.; Moore, D.F.; Miller, D.W.; van Lierop, J.; Hegmann, T. A versatile method for the reductive, one-pot synthesis of bare, hydrophilic and hydrophobic magnetite nanoparticles. Adv. Funct. Mater. 2011, 21, 1457–1464. [Google Scholar] [CrossRef]
- Li, Z.; Wei, L.; Gao, M.Y.; Lei, H. One-pot reaction to synthesize magnetite biocompatible magnetite nanoparticles. Adv. Mater. 2005, 17, 1001–1005. [Google Scholar] [CrossRef]
- Zhang, Y.; Kohler, N.; Zhang, M. Surface modification of superparamagnetic magnetite nanoparticles and their intracellular uptake. Biomaterials 2002, 23, 1553–1561. [Google Scholar] [CrossRef]
- Qu, H.; Lai, Y.; Niu, D.; Sun, S. Surface-enhanced Raman scattering from magneto-metal nanoparticle assemblies. Anal. Chim. Acta 2013, 763, 38–42. [Google Scholar] [CrossRef]
- Sun, L.; He, J.; An, S.; Zhang, J.; Ren, D. Facile one-step synthesis of Ag@Fe3O4 core–shell nanospheres for reproducible SERS substrates. J. Mol. Struct. 2013, 1046, 74–81. [Google Scholar] [CrossRef]
- Bao, Z.Y.; Dai, J.; Lei, D.Y.; Wu, Y. Maximizing surface-enhanced Raman scattering sensitivity of surfactant-free Ag-Fe3O4 nanocomposites through optimization of silver nanoparticle density and magnetic self-assembly. J. Appl. Phys. 2013, 114, 124305. [Google Scholar] [CrossRef]
- Sharma, G.; Jeevanandam, P. A facile synthesis of multifunctional iron Oxide@Ag core-shell nanoparticles and their catalytic application. Eur. J. Inorg. Chem. 2013, 36, 6126–6136. [Google Scholar] [CrossRef]
- Prucek, R.; Tuček, J.; Kilianová, M.; Panáček, A.; Kvítek, L.; Filip, J.; Kolář, M.; Tománková, K.; Zbořil, R. The targeted antibacterial and antifungal properties of magnetic nanocomposite of iron oxide and silver nanoparticles. Biomaterials 2011, 32, 4704–4713. [Google Scholar] [CrossRef] [PubMed]
- Wang, L.; Wang, L.; Luo, J.; Fan, Q.; Suzuki, M.; Suzuki, I.S.; Engelhard, M.H.; Lin, Y.; Kim, N.; Wang, J.Q.; et al. Monodispersed Core-Shell Fe3O4@Au Nanoparticles. J. Phys. Chem. B 2005, 109, 21593–21601. [Google Scholar] [CrossRef] [PubMed]
- Reguera, J.; Jimenez de Aberasturi, D.; Henriksen-Lacey, M.; Langer, J.; Espinosa, A.; Szczupak, B.; Wilhelm, C.; Liz-Marzan, L.M. Janus plasmonic-magnetic gold-iron oxide nanoparticles as contrast agents for multimodal imaging. Nanoscale 2017, 9, 9467–9480. [Google Scholar] [CrossRef] [PubMed]
- Ovejero, J.G.; Morales, I.; de la Presa, P.; Mille, N.; Carrey, J.; Garcia, M.A.; Hernando, A.; Herrasti, P. Hybrid nanoparticles for magnetic and plasmonic hyperthermia. Phys. Chem. Chem. Phys. 2018, 20, 24065–24073. [Google Scholar] [CrossRef]
- Tymoczko, A.; Kamp, M.; Rehbock, C.; Kienle, L.; Cattaruzza, E.; Barcikowski, S.; Amendola, V. One-step synthesis of Fe-Au core-shell magnetic-plasmonic nanoparticles driven by interface energy minimization. Nanoscale Horiz. 2019, 4, 1326–1332. [Google Scholar] [CrossRef]
- Bertorelle, F.; Pinto, M.; Zappon, R.; Pilot, R.; Litti, L.; Fiameni, S.; Conti, G.; Gobbo, M.; Toffoli, G.; Colombatti, M.; et al. Safe core-satellite magneto-plasmonic nanostructures for efficient targeting and photothermal treatment of tumor cells. Nanoscale 2018, 10, 976–984. [Google Scholar] [CrossRef]
- Pan, S.; Liu, Z.; Lu, W. Synthesis of naked plasmonic/magetic Au/Fe3O4 nanostructures by plasmon-driven anti-replacement reaction. Nanotechnology 2019, 30, 65605. [Google Scholar] [CrossRef]
- Muniz-Miranda, M.; Caporali, S.; Marsili, P.; Giorgetti, E. Fabrication and characterization of Ag/Pd colloidal nanoparticles as stable platforms for SERS and catalytic applications. Mater. Chem. Phys. 2015, 167, 188–193. [Google Scholar] [CrossRef]
- Giorgetti, E.; Marsili, P.; Canton, P.; Muniz-Miranda, M.; Caporali, S.; Giammanco, F. Cu/Ag-based bifunctional nanoparticles obtained by one-pot laser-assisted galvanic replacement. J. Nanopart. Res. 2013, 15, 1360. [Google Scholar] [CrossRef]
- Muniz-Miranda, M.; Gellini, C.; Giorgetti, E.; Margheri, G. Bifunctional Fe3O4/Ag nanoparticles obtained by two-step laser ablation in pure water. J. Colloid Interface Sci. 2017, 489, 100–105. [Google Scholar] [CrossRef] [PubMed]
- Gellini, C.; Deepak, F.L.; Muniz-Miranda, M.; Caporali, S.; Muniz-Miranda, F.; Pedone, A.; Innocenti, C.; Sangregorio, C. Magneto-plasmonic colloidal nanoparticles obtained by laser ablation of nickel and silver targets in water. J. Phys. Chem. C 2017, 121, 3597–3606. [Google Scholar] [CrossRef]
- Gao, F. An Overview of Surface-Functionalized Magnetic Nanoparticles: Preparation and Application for Wastewater Treatment. ChemistrySelect 2019, 4, 6805–6811. [Google Scholar] [CrossRef]
- Fato, F.P.; Li, D.-W.; Zhao, L.-J.; Qiu, K.; Long, Y.-T. Simultaneous Removal of Multiple Heavy Metal Ions from River Water Using Ultrafine Mesoporous Magnetite Nanoparticles. ACS Omega 2019, 4, 7543–7549. [Google Scholar] [CrossRef]
- Frisch, M.J.; Trucks, G.W.; Schlegel, H.B.; Scuseria, G.E.; Robb, M.A.; Cheeseman, J.R.; Scalmani, G.; Barone, V.; Petersson, G.A.; Nakatsuji, H.; et al. Gaussian 09; Revision D.01; Gaussian, Inc.: Wallingford, CT, USA, 2009. [Google Scholar]
- Lee, C.; Yang, W.; Parr, R.G. Development of the Colle-Salvetti correlation-energy formula into a functional of the electron density. Phys. Rev. B 1988, 37, 785–789. [Google Scholar] [CrossRef]
- Becke, A.D. Density-functional thermochemistry. III. The role of exact exchange. J. Chem. Phys. 1993, 98, 5648–5652. [Google Scholar] [CrossRef]
- Hay, P.J.; Wadt, W.R. Ab initio effective core potentials for molecular calculations. Potentials for the transition metal atoms Sc to Hg. J. Chem. Phys. 1985, 82, 270–283. [Google Scholar]
- Wadt, W.R.; Hay, P.J. Ab initio effective core potentials for molecular calculations. Potentials for main group elements Na to Bi. J. Chem. Phys. 1985, 82, 284–298. [Google Scholar] [CrossRef]
- Hay, P.J.; Wadt, W.R. Ab initio effective core potentials for molecular calculations. Potentials for K to Au including the outermost core orbitals. J. Chem. Phys. 1985, 82, 299–310. [Google Scholar] [CrossRef]
- Grimme, S.; Ehrlich, S.; Goerigk, L. Effect of the damping function in dispersion corrected density functional theory. J. Comp. Chem. 2011, 32, 1456–1465. [Google Scholar] [CrossRef]
- Muniz-Miranda, M.; Pagliai, M.; Muniz-Miranda, F.; Schettino, V. Raman and computational study of solvation and chemisorption of thiazole in silver hydrosol. Chem. Commun. 2011, 47, 3138–3140. [Google Scholar] [CrossRef] [PubMed]
- Pagliai, M.; Muniz-Miranda, F.; Schettino, V.; Muniz-Miranda, M. Competitive Solvation and Chemisorption in Silver Colloidal Suspensions. Prog. Colloid Polym. Sci. 2012, 139, 39–44. [Google Scholar]
- Muniz-Miranda, M.; Muniz-Miranda, F.; Caporali, S. SERS and DFT study of copper surfaces coated with corrosion inhibitor. Beilstein J. Nanotechnol. 2014, 5, 2489–2497. [Google Scholar] [CrossRef] [PubMed]
- Muniz-Miranda, F.; Pedone, A.; Muniz-Miranda, M. Spectroscopic and DFT investigation on the photo-chemical properties of a push-pull chromophore: 4-Dimethylamino-4′-nitrostilbene. Spectrochim. Acta A 2018, 190, 33–39. [Google Scholar] [CrossRef] [PubMed]
- Gellini, C.; Muniz-Miranda, F.; Pedone, A.; Muniz-Miranda, M. SERS active Ag-SiO2 nanoparticles obtained by laser ablation of silver in colloidal silica. Beilstein J. Nanotechnol. 2018, 9, 2396–2404. [Google Scholar] [CrossRef] [PubMed]
- Gracia Pinilla, M.Á.; Villanueva, M.; Ramos-Delgado, N.A.; Melendrez, M.F.; Menchaca, J.L. Au and Cu nanoparticles and clusters synthesized by pulsed laser ablation: Effects of polyethylenimine (PEI) coating. Dig. J. Nanomater. Biostruct. 2014, 9, 1389–1397. [Google Scholar]
- Nedkov, I.; Merodiiska, T.; Kolev, S.; Krezhov, K.; Niarchos, D.; Moraitakis, E.; Kusano, Y.; Takada, J. Microstructure and Magnetic Behaviour of Nanosized Fe3O4 Powders and Poly crystalline Films. Monatsh. Chem. 2002, 133, 823–828. [Google Scholar] [CrossRef]
- Shebanova, O.N.; Lazor, P. Raman spectroscopic study of magnetite (FeFe2O4): A new assignment for the vibrational spectrum. J. Solid State Chem. 2003, 174, 424–430. [Google Scholar] [CrossRef]
- Li, H.; Qin, L.; Feng, Y.; Hu, L.; Zhou, C. Preparation and characterization of highly water-soluble magnetic Fe3O4 nanoparticles via surface double-layered self-assembly method of sodium alpha-olefin sulfonate. J. Magn. Magn. Mater. 2015, 384, 213–218. [Google Scholar] [CrossRef]
- Sylvestre, J.-P.; Poulin, S.; Kabashin, A.V.; Sacher, E.; Meunier, M.; Luong, J.H.T. Surface Chemistry of Gold Nanoparticles Produced by Laser Ablation in Aqueous Media. J. Phys. Chem. B 2004, 108, 16864–16869. [Google Scholar] [CrossRef]
- Joo, S.-W. Adsorption of Bipyridine Compounds on Gold Nanoparticle Surfaces Investigated by UV-Vis Absorbance Spectroscopy and Surface Enhanced Raman Scattering. Spectrosc. Lett. 2006, 39, 85–96. [Google Scholar] [CrossRef]
- Ould-Moussa, L.; Castella-Ventura, M.; Kassab, E.; Poizat, O.; Strommen, D.P.; Kincaid, J.R. Ab initio and density functional study of the geometrical, electronic and vibrational properties of 2,2′-bipyridine. J. Raman Spectrosc. 2000, 31, 377–390. [Google Scholar] [CrossRef]
- Sanchez-Cortes, S.; Garcia-Ramos, J.V.; Morcillo, G.; Tinti, A. Morphological Study of Silver Colloids Employed in Surface Enhanced Raman Spectroscopy: Activation when Exciting in Visible and Near-Infrared Regions. J. Colloid Interface Sci. 1995, 175, 358–368. [Google Scholar] [CrossRef]
- Giorgetti, E.; Marsili, P.; Giammanco, F.; Trigari, S.; Gellini, C.; Muniz-Miranda, M. Ag nanoparticles obtained by pulsed laser ablation in water: Surface properties and SERS activity. J. Raman Spectrosc. 2015, 46, 462–469. [Google Scholar] [CrossRef]
- Lopez-Tocón, I.; Valdivia, S.; Soto, J.; Otero, J.C.; Muniz-Miranda, F.; Menziani, M.C.; Muniz-Miranda, M. A DFT Approach to the Surface-Enhanced Raman Scattering of 4-Cyanopyridine Adsorbed on Silver Nanoparticles. Nanomaterials 2019, 9, 1211. [Google Scholar] [CrossRef]
- Basha, M.T.; Alghanmi, R.M.; Shehata, M.R.; Abdel-Rahman, L.H. Synthesis, structural characterization, DFT calculations, biological investigation, molecular docking and DNA binding of Co(II), Ni(II) and Cu(II) nanosized Schiff base complexes bearing pyrimidine moiety. J. Mol. Struct. 2019, 1183, 298–312. [Google Scholar] [CrossRef]
- Fiori-Duarte, A.T.; Bergamini, F.R.G.; de Paiva, R.E.F.; Manzano, C.M.; Lustri, W.R.; Corbi, P.P. A new palladium(II) complex with ibuprofen: Spectroscopic characterization, DFT studies, antibacterial activities and interaction with biomolecules. J. Mol. Struct. 2019, 1186, 144–154. [Google Scholar] [CrossRef]
- Khodashenas, B.; Ardjmand, M.; Baei, M.S.; Rad, A.S.; Khiyavi, A.A. Gelatin–Gold Nanoparticles as an Ideal Candidate for Curcumin Drug Delivery: Experimental and DFT Studies. J. Inorg. Organomet. Polym. 2019, 29, 2186–2196. [Google Scholar] [CrossRef]
- Sahan, F.; Kose, M.; Hepokur, C.; Karakas, D.; Kurtoglu, M. New azo-azomethine-based transition metal complexes: Synthesis, spectroscopy, solid-state structure, density functional theory calculations and anticancer studies. Appl. Organomet. Chem. 2019, 33, e4954. [Google Scholar] [CrossRef]
- Hmida, W.B.; Jellali, A.; Abid, H.; Hamdi, B.; Naili, H.; Zouari, R. Synthesis, crystal structure, vibrational studies, optical properties and DFT calculation of a new luminescent material based Cu (II). J. Mol. Struct. 2019, 1184, 604–614. [Google Scholar] [CrossRef]
- Maiti, N.; Malkar, V.V.; Mukherjee, T.; Kapoor, S. Investigating the interaction of aminopolycarboxylic acid (APCA) ligands with silver nanoparticles: A Raman, surface-enhanced Raman and density functional theoretical study. J. Mol. Struct. 2018, 1156, 592–601. [Google Scholar] [CrossRef]
- Ricci, M.; Lofrumento, C.; Becucci, M.; Castellucci, E.M. The Raman and SERS spectra of indigo and indigo-Ag2 complex: DFT calculation and comparison with experiment. Spectrochim. Acta A 2018, 188, 141–148. [Google Scholar] [CrossRef] [PubMed]
- Jacquemin, D.; Le Bahers, T.; Adamo, C.; Ciofini, I. What is the “best” atomic charge model to describe through-space charge-transfer excitations? Phys. Chem. Chem. Phys. 2012, 14, 5383–5388. [Google Scholar] [CrossRef] [PubMed]
- Ciofini, I.; Le Bahers, T.; Adamo, C.; Odobel, F.; Jacquemin, D. Through-Space Charge Transfer in Rod-Like Molecules: Lessons from Theory. J. Phys. Chem. C 2012, 116, 11946–11955. [Google Scholar] [CrossRef]
- Shukla, R.; Bansal, V.; Chaudhary, M.; Basu, A.; Bhonde, R.R.; Sastry, M. Biocompatibility of gold nanoparticles and their endocytotic fate inside the cellular compartment: A microscopic overview. Langmuir 2005, 21, 10644–10654. [Google Scholar] [CrossRef]
- Souza, D.M.; Andrade, A.L.; Fabris, J.D.; Valério, P.; Góes, A.M.; Leite, M.F.; Domingues, R.Z. Synthesis and in vitro evaluation of toxicity of silica-coated magnetite nanoparticles. J. Non-Cryst. Solids 2008, 354, 4894–4897. [Google Scholar] [CrossRef]
- Auffan, M.; Rose, J.; Wiesner, M.R.; Bottero, J.-Y. Chemical stability of metallic nanoparticles: A parameter controlling their potential cellular toxicity in vitro. Environ. Pollut. 2009, 157, 1127–1133. [Google Scholar] [CrossRef]
- Mahmoudi, M.; Simchi, A.; Milani, A.S.; Stroeve, P. Cell toxicity of superparamagnetic iron oxide nanoparticles. J. Colloid Interface Sci. 2009, 336, 510–518. [Google Scholar] [CrossRef]
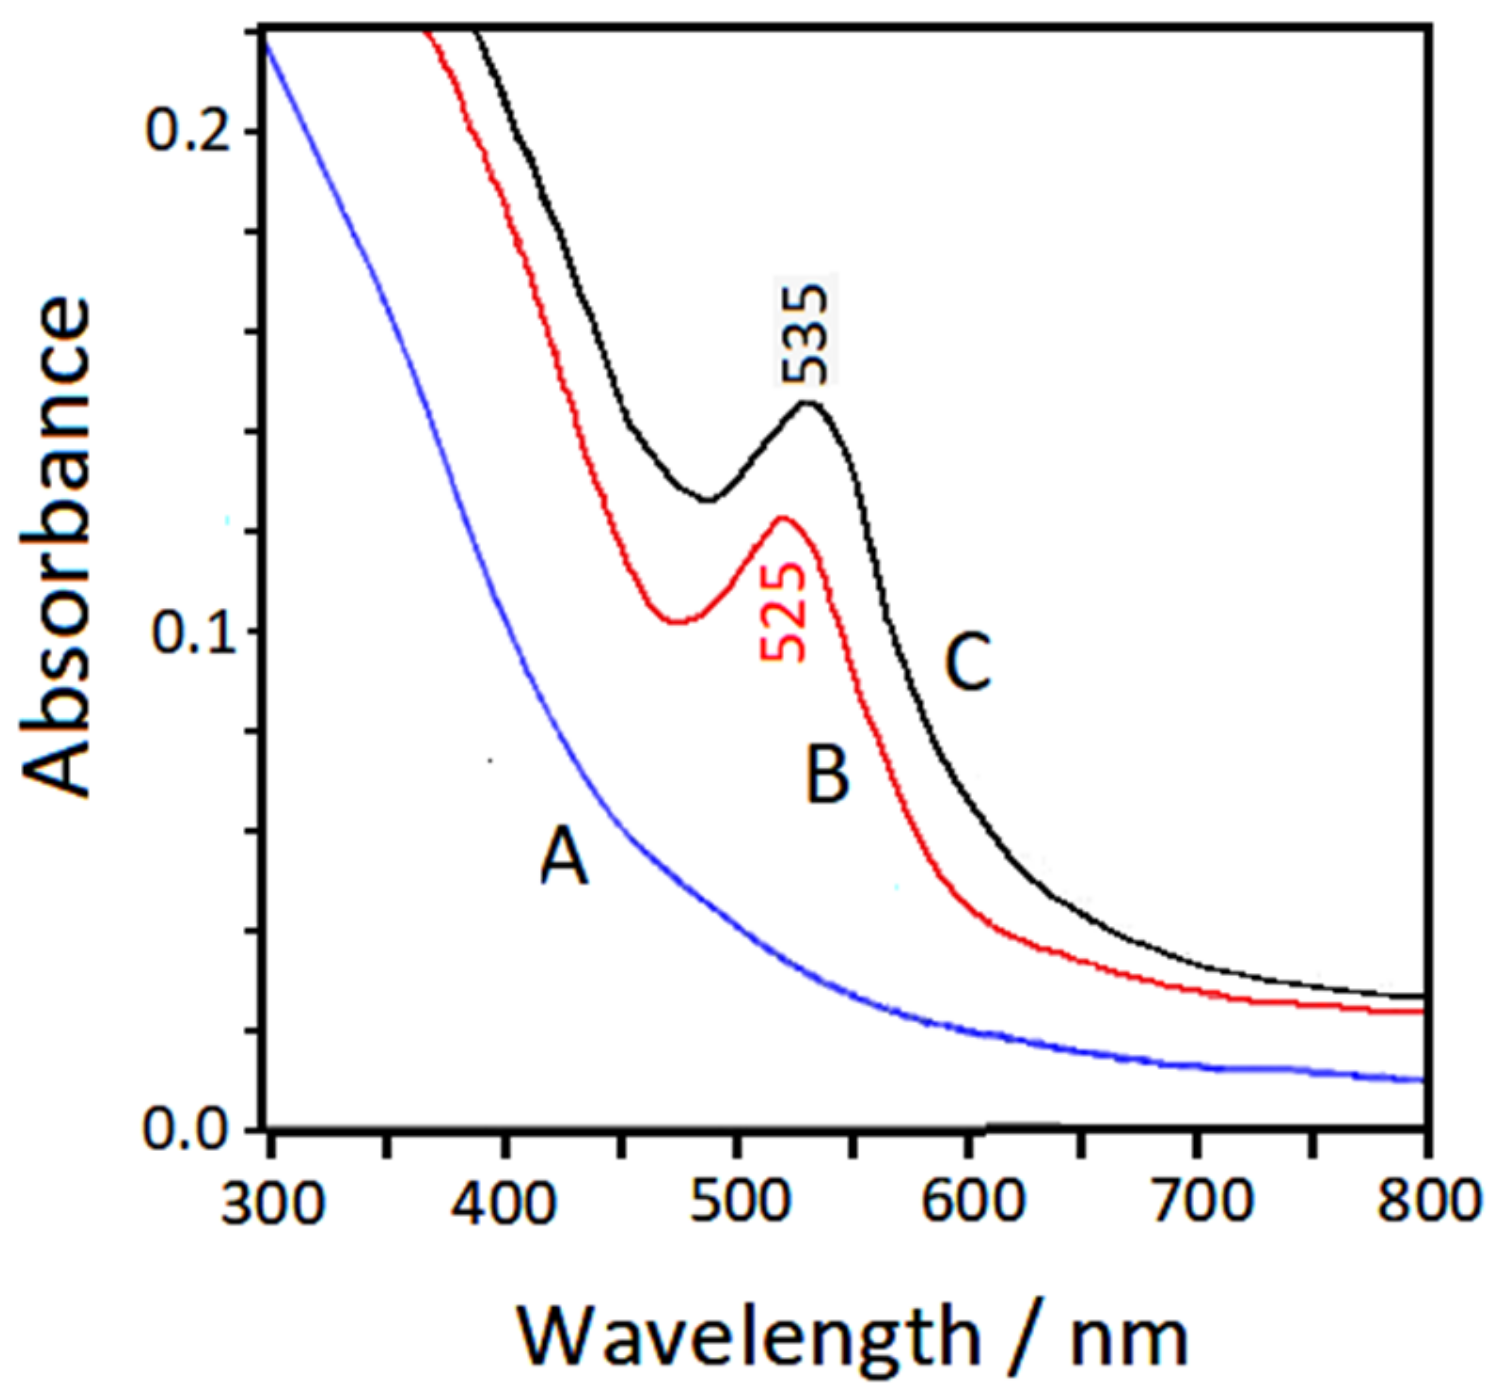
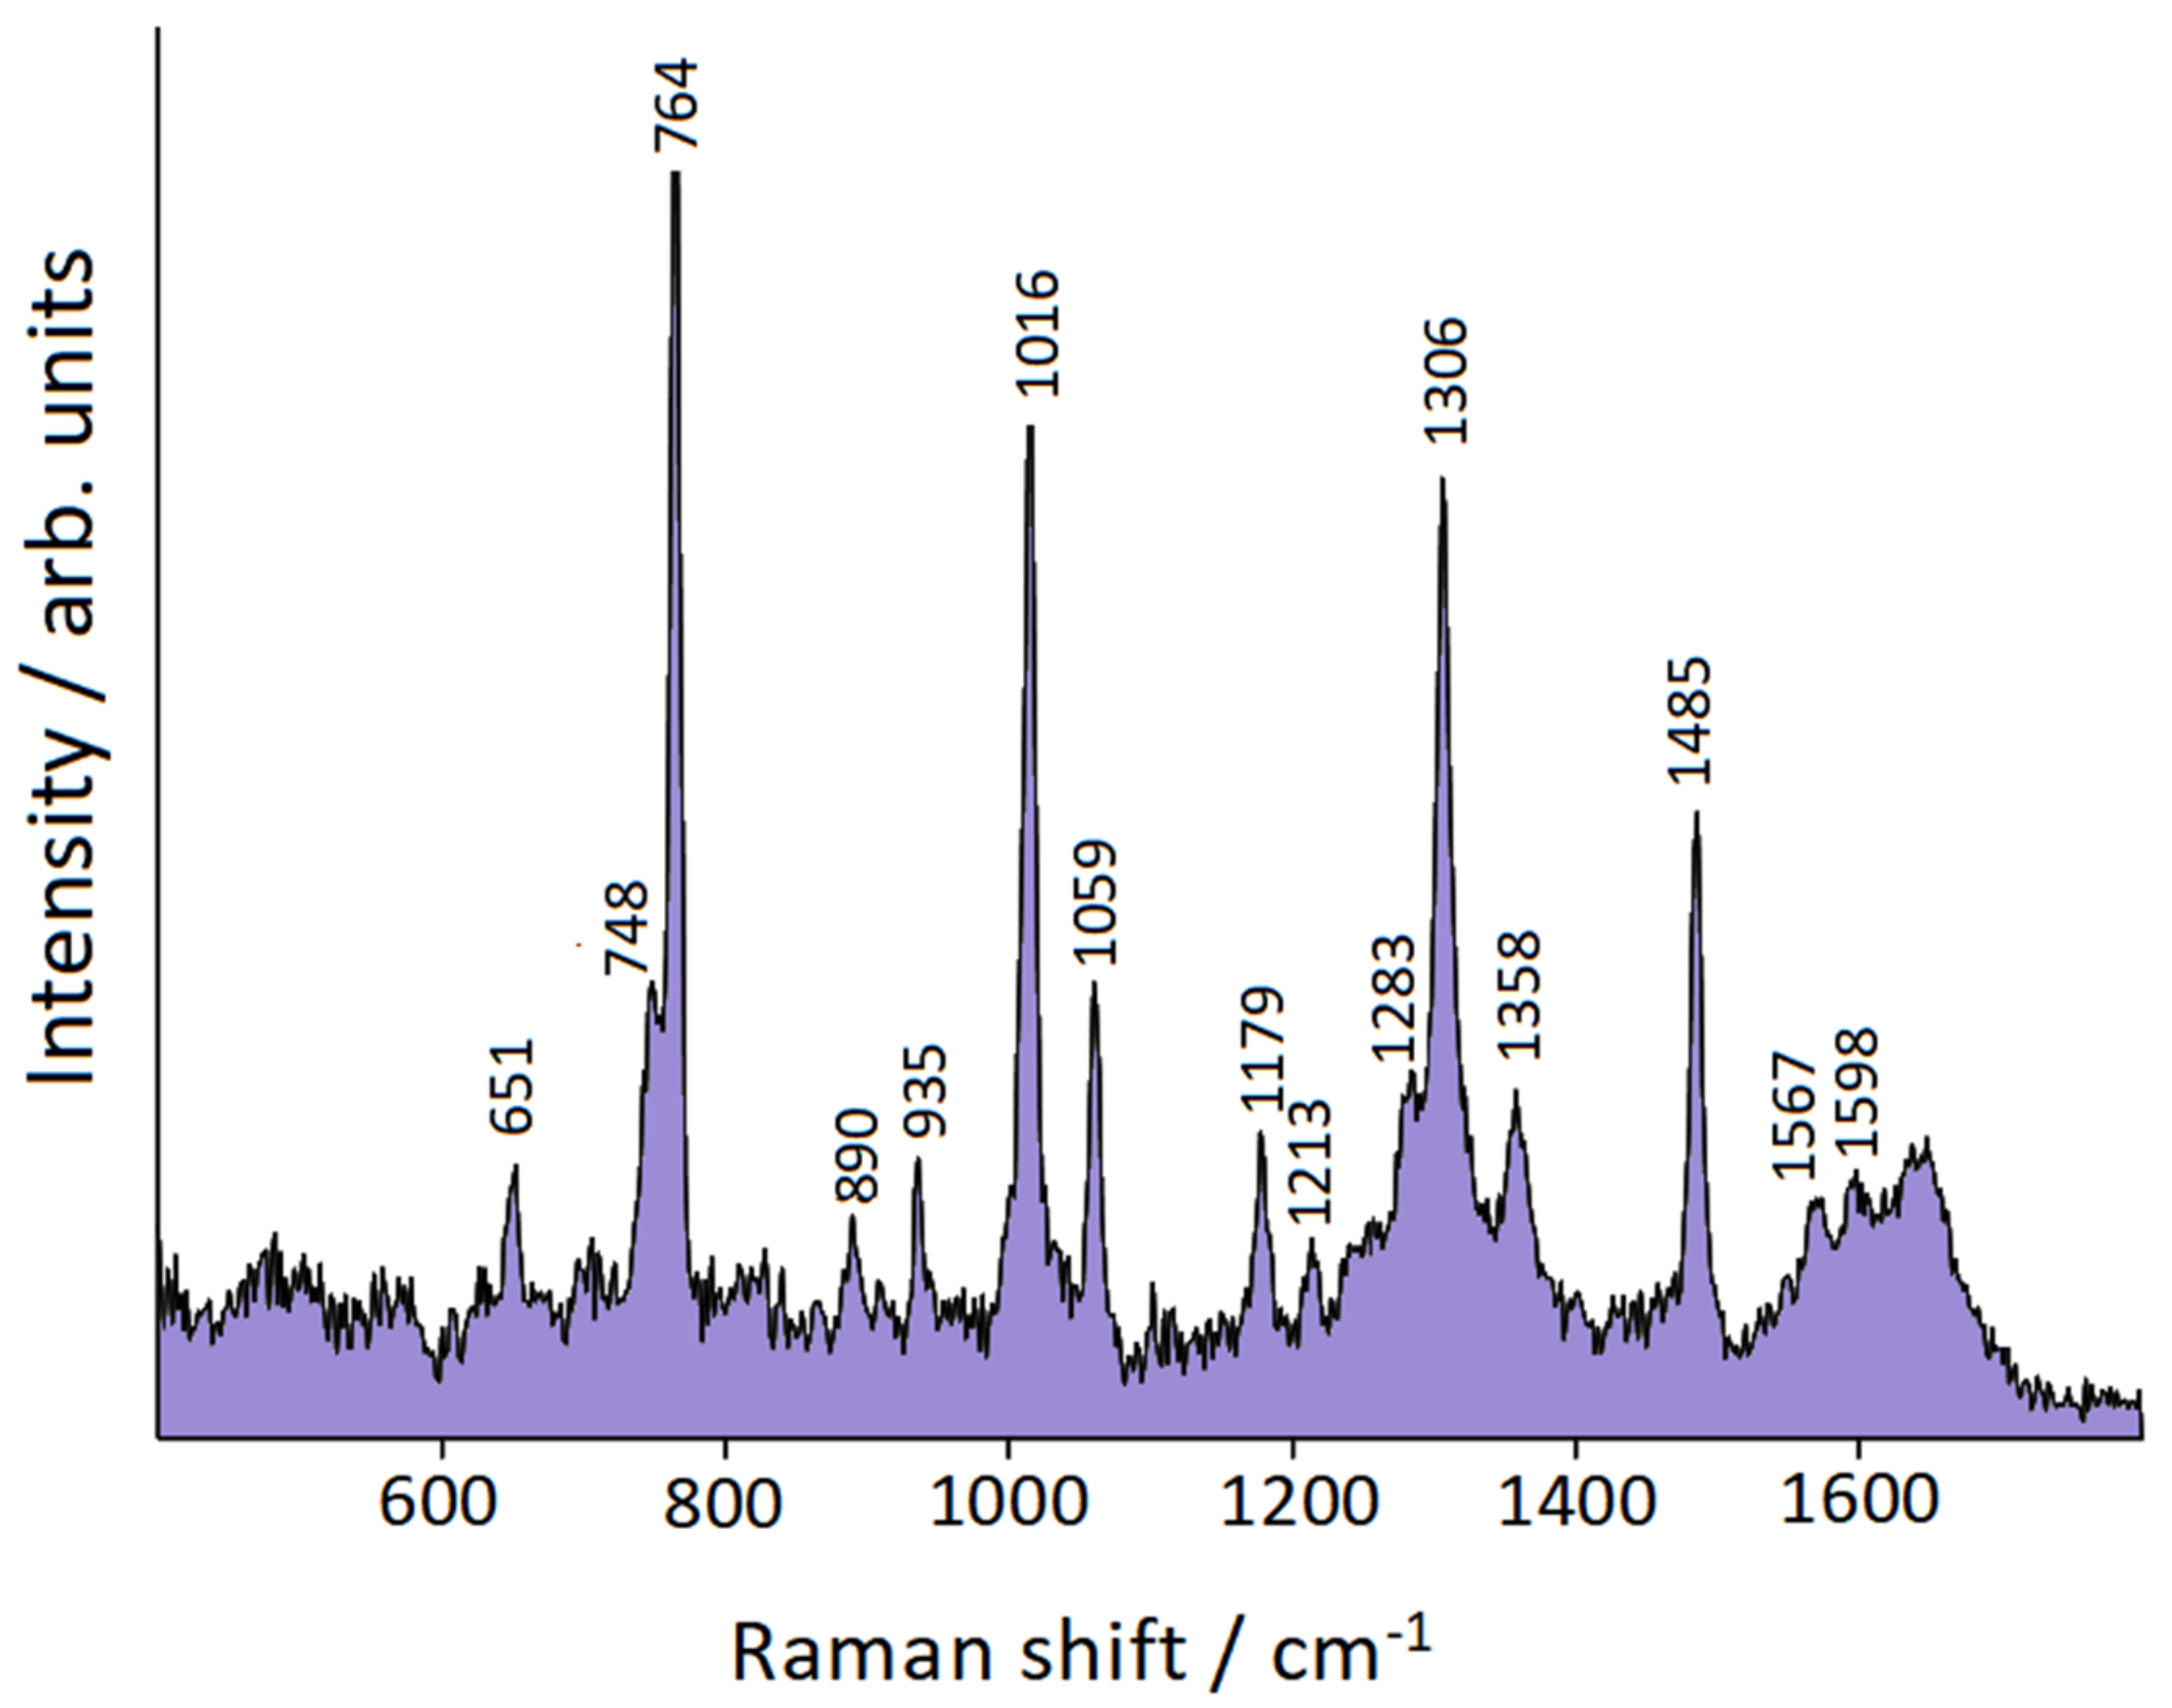
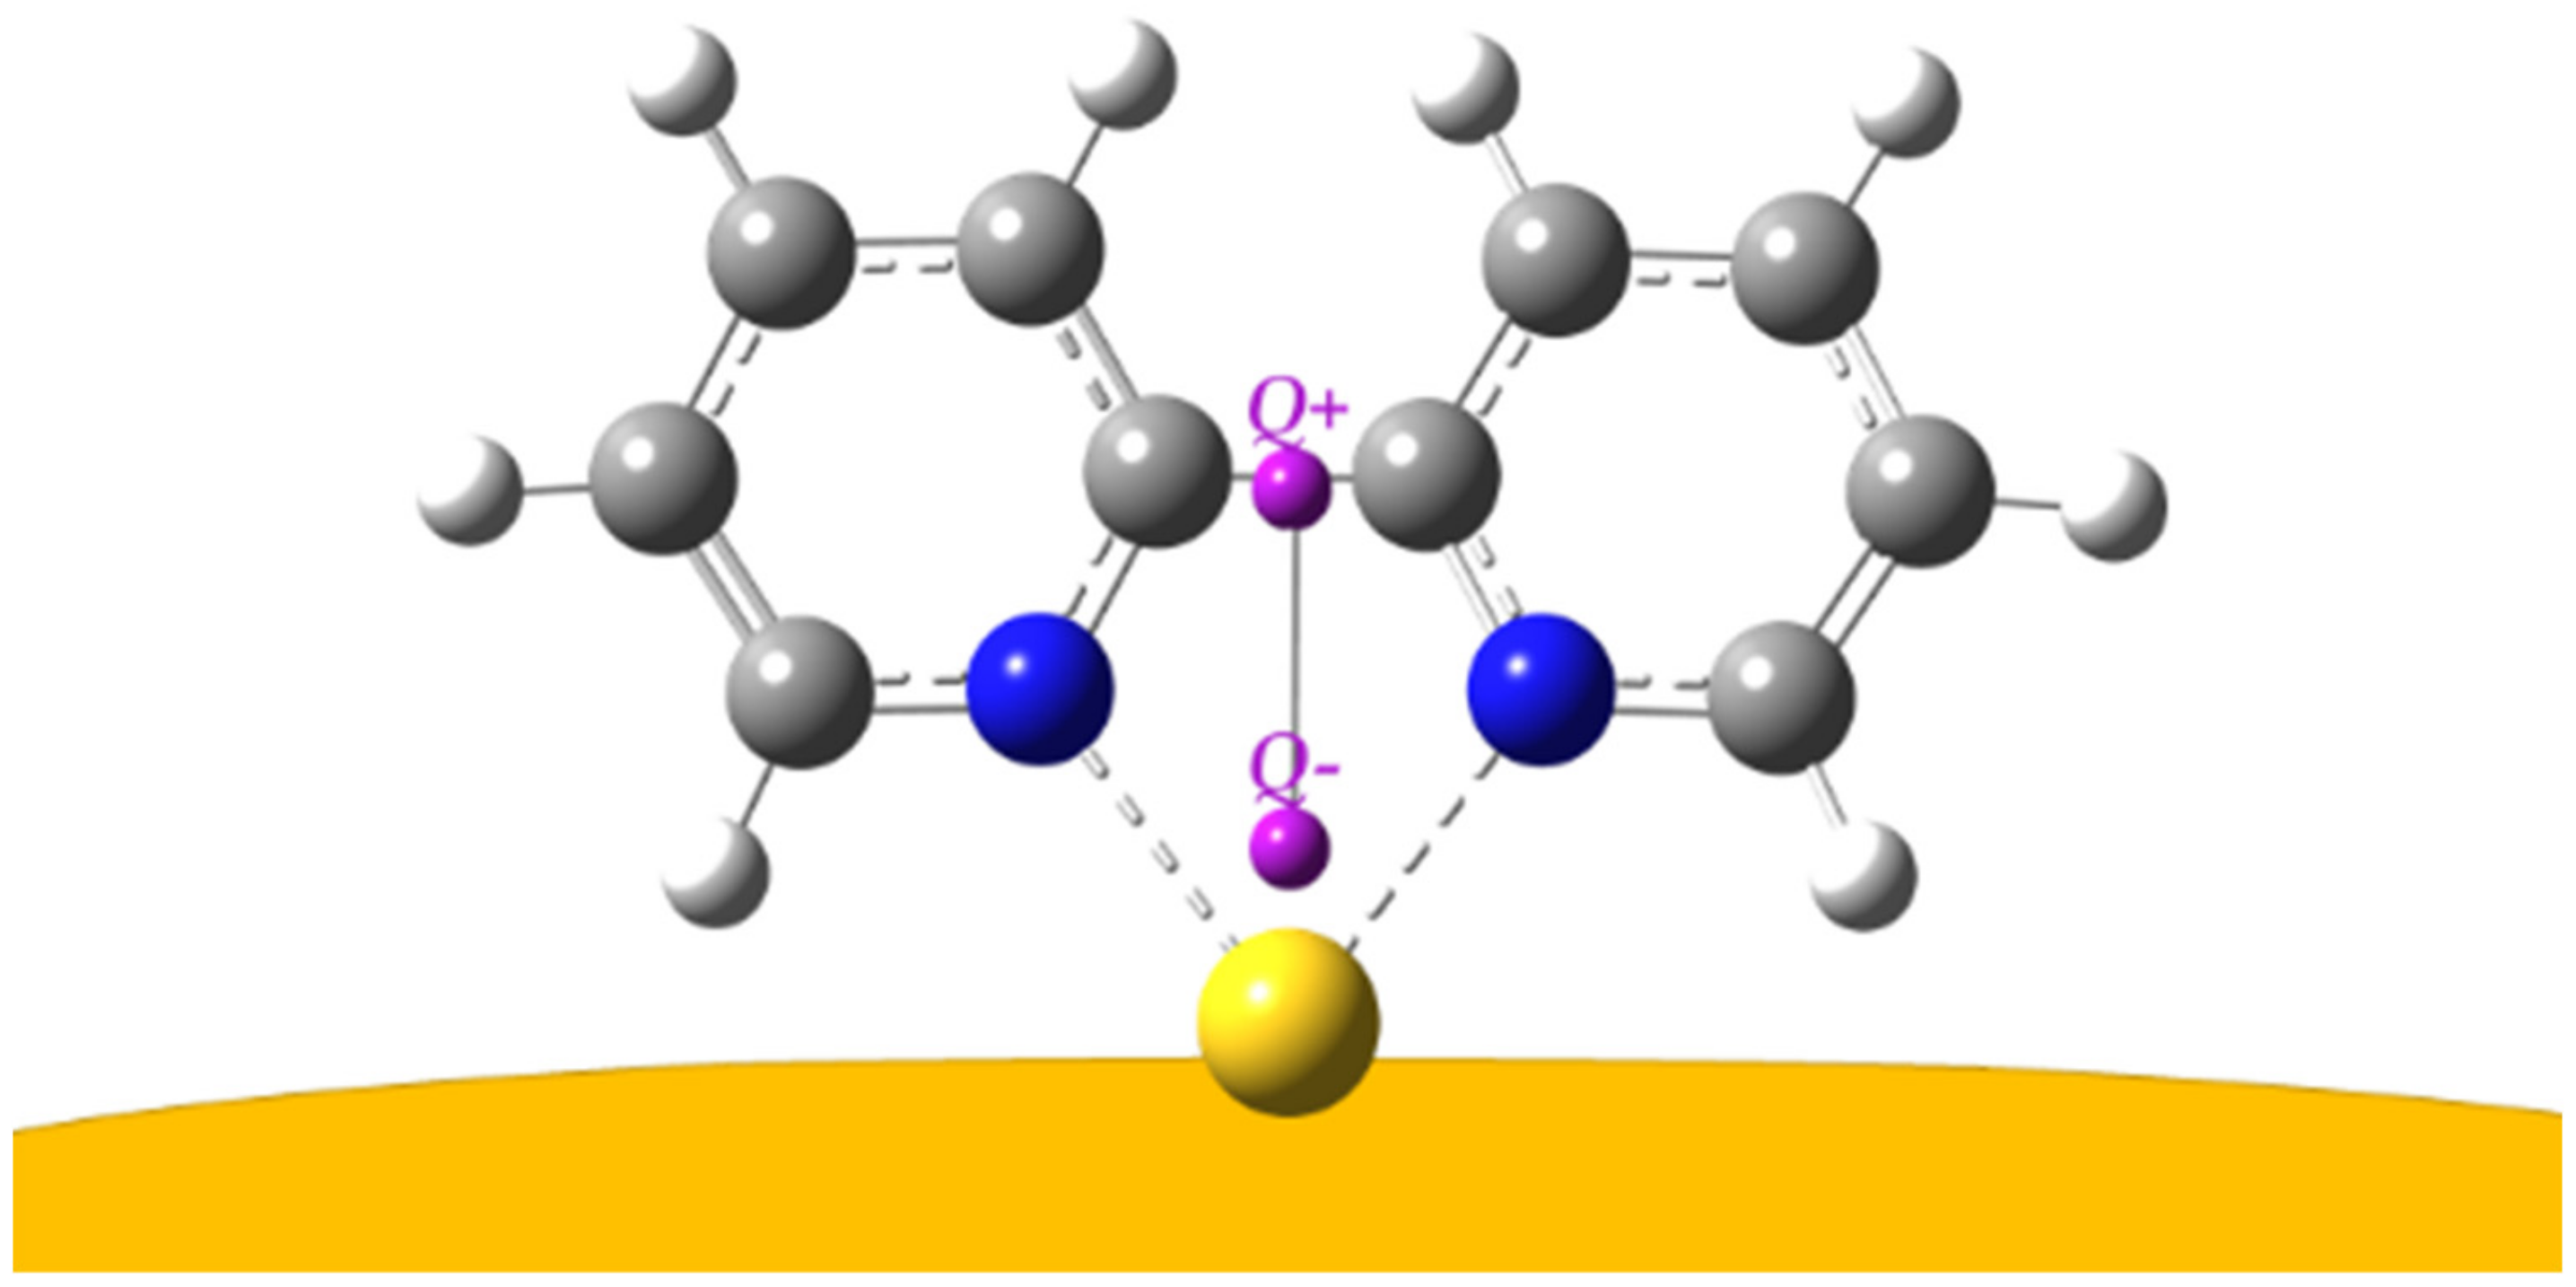
| Symmetry | bpy | bpy/Au | bpy/Au+ | bpy/Au° | bpy/Au |
|---|---|---|---|---|---|
| Species [45] | IR/Raman [45] | SERS | Calc. | Calc. | SERS [44] |
| Bu | 1575 | 1603 | 1592 | ||
| Ag | 1589 | 1598 | 1598 | 1594 | 1586 |
| Bu | 1550 | 1590 | 1581 | ||
| Ag | 1572 | 1567 | 1575 | 1570 | 1562 |
| Ag | 1482 | 1485 | 1491 | 1483 | 1479 |
| Ag | 1446 | 1469 | 1460 | ||
| Bu | 1450 | 1445 | 1433 | ||
| Bu | 1410 | 1429 | 1419 | ||
| Bu | 1265 | 1358 | 1324 | 1323 | |
| Bu | 1250 | 1331 | 1298 | ||
| Ag | 1309 | 1306 | 1306 | 1313 | 1301 |
| Ag | 1301 | 1283 | 1289 | 1286 | |
| Ag | 1236 | 1294 | 1274 | ||
| Bu | 1140 | 1213 | 1206 | 1184 | |
| Ag | 1146 | 1179 | 1190 | 1176 | 1173 |
| Bu | 1085 | 1128 | 1113 | ||
| Ag | 1094 | 1114 | 1096 | ||
| Bu | 1065 | 1078 | 1077 | ||
| Ag | 1044 | 1059 | 1062 | 1049 | 1057 |
| Bg | ------ | 1039 | 1032 | ||
| Bu | 1040 | 1038 | 1023 | ||
| Au | ------ | 1033 | 979 | ||
| Ag | 994 | 1016 | 1007 | 1022 | 1010 |
| Bu | 995 | 993 | 985 | ||
| Au | 975 | 993 | 983 | ||
| Bg | ------ | 991 | 976 | ||
| Bg | 909 | 935 | 923 | 913 | |
| Bu | 890 | 825 | 827 | ||
| Bg | 815 | 890 | 908 | 913 | |
| Au | 755 | 786 | 774 | ||
| Ag | 764 | 764 | 760 | 767 | 761 |
| Bg | 742 | 748 | 746 | 754 | |
| Au | 740 | 747 | 756 | ||
| Bu | 655 | 658 | 656 | ||
| Ag | 614 | 651 | 653 | 636 | 646 |
| Bu | 620 | 632 | 617 | ||
| Bg | 550 | 555 | 561 | ||
| Au | ------ | 447 | 479 | ||
| Ag | 440 | 441 | 415 | ||
| Bg | 409 | 422 | 415 | 403 | |
| Au | ------ | 405 | 380 | ||
| Ag | 332 | 356 | 353 | 327 | 353 |
| Bg | 224 | 226 | 241 |
| Model Complex | Bpy→Gold Charge Transfer | N–Gold Bond Distance |
|---|---|---|
| bpy/Au° | −0.232 |e| | 2.62 Å |
| bpy/Au+ | −0.502 |e| | 2.23 Å |
© 2020 by the authors. Licensee MDPI, Basel, Switzerland. This article is an open access article distributed under the terms and conditions of the Creative Commons Attribution (CC BY) license (http://creativecommons.org/licenses/by/4.0/).
Share and Cite
Muniz-Miranda, M.; Muniz-Miranda, F.; Giorgetti, E. Spectroscopic and Microscopic Analyses of Fe3O4/Au Nanoparticles Obtained by Laser Ablation in Water. Nanomaterials 2020, 10, 132. https://doi.org/10.3390/nano10010132
Muniz-Miranda M, Muniz-Miranda F, Giorgetti E. Spectroscopic and Microscopic Analyses of Fe3O4/Au Nanoparticles Obtained by Laser Ablation in Water. Nanomaterials. 2020; 10(1):132. https://doi.org/10.3390/nano10010132
Chicago/Turabian StyleMuniz-Miranda, Maurizio, Francesco Muniz-Miranda, and Emilia Giorgetti. 2020. "Spectroscopic and Microscopic Analyses of Fe3O4/Au Nanoparticles Obtained by Laser Ablation in Water" Nanomaterials 10, no. 1: 132. https://doi.org/10.3390/nano10010132
APA StyleMuniz-Miranda, M., Muniz-Miranda, F., & Giorgetti, E. (2020). Spectroscopic and Microscopic Analyses of Fe3O4/Au Nanoparticles Obtained by Laser Ablation in Water. Nanomaterials, 10(1), 132. https://doi.org/10.3390/nano10010132


