
Synthesis of ε-Fe2–3N Particles for Magnetic Hyperthermia

 , , and
Abstract

1. Introduction
2. Materials and Methods
2.1. Synthesis of Samples
2.2. Characterization of Samples
2.3. Evaluation of Magnetic Properties of Samples
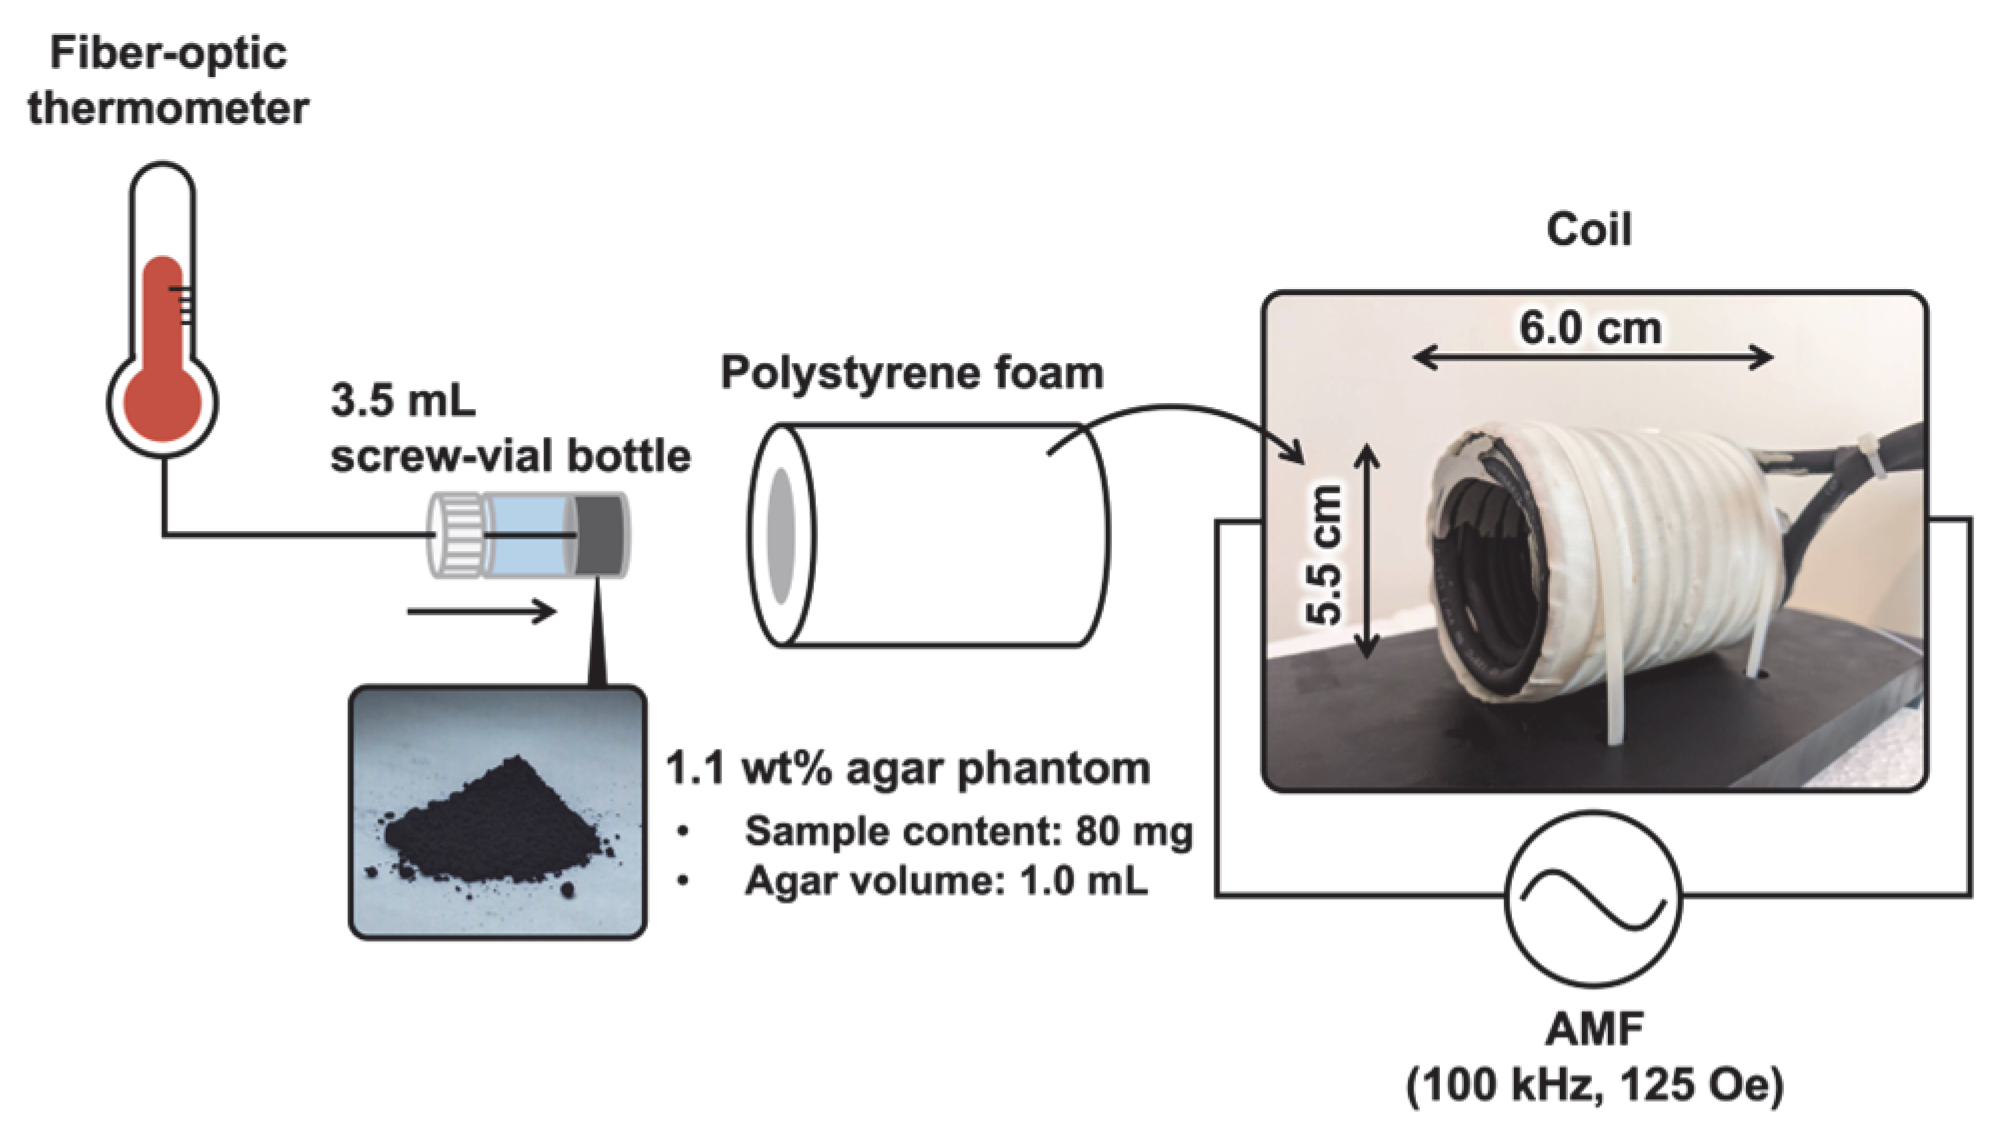
2.4. Measurement of the Heat-Generation Properties of Samples
2.5. Statistics
3. Results
4. Discussion
5. Conclusions
Supplementary Materials
Author Contributions
Funding
Institutional Review Board Statement
Informed Consent Statement
Data Availability Statement
Acknowledgments
Conflicts of Interest
References
- Kumar, C.S.S.R.; Mohammad, F. Magnetic Nanomaterials for Hyperthermia-Based Therapy and Controlled Drug Delivery. Adv. Drug Delivery Rev. 2011, 63, 789–808. [Google Scholar] [CrossRef] [PubMed]
- Etemadi, H.; Plieger, P.G. Magnetic Fluid Hyperthermia Based on Magnetic Nanoparticles: Physical Characteristics, Historical Perspective, Clinical Trials, Technological Challenges, and Recent Advances. Adv. Therap. 2020, 3, 2000061. [Google Scholar] [CrossRef]
- van Landeghem, F.K.H.; Maier-Hauff, K.; Jordan, A.; Hoffmann, K.-T.; Gneveckow, U.; Scholz, R.; Thiesen, B.; Brück, W.; von Deimling, A. Post-Mortem Studies in Glioblastoma Patients Treated with Thermotherapy Using Magnetic Nanoparticles. Biomaterials 2009, 30, 52–57. [Google Scholar] [CrossRef]
- Johannsen, M.; Gneveckow, U.; Thiesen, B.; Taymoorian, K.; Cho, C.H.; Waldöfner, N.; Scholz, R.; Jordan, A.; Loening, S.A.; Wust, P. Thermotherapy of Prostate Cancer Using Magnetic Nanoparticles: Feasibility, Imaging, and Three-Dimensional Temperature Distribution. Eur. Urol. 2007, 52, 1653–1662. [Google Scholar] [CrossRef]
- Maier-Hauff, K.; Ulrich, F.; Nestler, D.; Niehoff, H.; Wust, P.; Thiesen, B.; Orawa, H.; Budach, V.; Jordan, A. Efficacy and Safety of Intratumoral Thermotherapy Using Magnetic Iron-Oxide Nanoparticles Combined with External Beam Radiotherapy on Patients with Recurrent Glioblastoma Multiforme. J. Neurooncol. 2011, 103, 317–324. [Google Scholar] [CrossRef]
- Grauer, O.; Jaber, M.; Hess, K.; Weckesser, M.; Schwindt, W.; Maring, S.; Wölfer, J.; Stummer, W. Combined Intracavitary Thermotherapy with Iron Oxide Nanoparticles and Radiotherapy as Local Treatment Modality in Recurrent Glioblastoma Patients. J. Neurooncol. 2019, 141, 83–94. [Google Scholar] [CrossRef]
- Dutz, S.; Hergt, R. Magnetic Nanoparticle Heating and Heat Transfer on a Microscale: Basic Principles, Realities and Physical Limitations of Hyperthermia for Tumour Therapy. Int. J. Hyperthermia 2013, 29, 790–800. [Google Scholar] [CrossRef]
- Chang, D.; Lim, M.; Goos, J.A.C.M.; Qiao, R.; Ng, Y.Y.; Mansfeld, F.M.; Jackson, M.; Davis, T.P.; Kavallaris, M. Biologically Targeted Magnetic Hyperthermia: Potential and Limitations. Front. Pharmacol. 2018, 9, 831. [Google Scholar] [CrossRef] [PubMed]
- van der Zee, J.; González, D.; van Rhoon, G.C.; van Dijk, J.D.; van Putten, W.L.; Hart, A.A. Comparison of Radiotherapy Alone with Radiotherapy plus Hyperthermia in Locally Advanced Pelvic Tumours: A Prospective, Randomised, Multicentre Trial. Lancet 2000, 355, 1119–1125. [Google Scholar] [CrossRef]
- Issels, R.D.; Lindner, L.H.; Verweij, J.; Wust, P.; Reichardt, P.; Schem, B.-C.; Abdel-Rahman, S.; Daugaard, S.; Salat, C.; Wendtner, C.-M.; et al. Neo-Adjuvant Chemotherapy Alone or with Regional Hyperthermia for Localised High-Risk Soft-Tissue Sarcoma: A Randomised Phase 3 Multicentre Study. Lancet Oncol. 2010, 11, 561–570. [Google Scholar] [CrossRef]
- Issels, R.D.; Lindner, L.H.; Verweij, J.; Wessalowski, R.; Reichardt, P.; Wust, P.; Ghadjar, P.; Hohenberger, P.; Angele, M.; Salat, C.; et al. Effect of Neoadjuvant Chemotherapy plus Regional Hyperthermia on Long-Term Outcomes among Patients with Localized High-Risk Soft Tissue Sarcoma: The EORTC 62961-ESHO 95 Randomized Clinical Trial. JAMA Oncol. 2018, 4, 483–492. [Google Scholar] [CrossRef] [PubMed]
- Kleef, R.; Nagy, R.; Baierl, A.; Bacher, V.; Bojar, H.; McKee, D.L.; Moss, R.; Thoennissen, N.H.; Szász, M.; Bakacs, T. Low-Dose Ipilimumab plus Nivolumab Combined with IL-2 and Hyperthermia in Cancer Patients with Advanced Disease: Exploratory Findings of a Case Series of 131 Stage IV Cancers—A Retrospective Study of a Single Institution. Cancer Immunol. Immunother. 2021, 70, 1393–1403. [Google Scholar] [CrossRef] [PubMed]
- Ogawa, T.; Ogata, Y.; Gallage, R.; Kobayashi, N.; Hayashi, N.; Kusano, Y.; Yamamoto, S.; Kohara, K.; Doi, M.; Takano, M.; et al. Challenge to the Synthesis of α″-Fe16N2 Compound Nanoparticle with High Saturation Magnetization for Rare Earth Free New Permanent Magnetic Material. Appl. Phys. Express 2013, 6, 073007. [Google Scholar] [CrossRef]
- Dirba, I.; Komissinskiy, P.; Gutfleisch, O.; Alff, L. Increased Magnetic Moment Induced by Lattice Expansion from α-Fe to A′-Fe8N. J. Appl. Phys. 2015, 117, 173911. [Google Scholar] [CrossRef]
- Yamaguchi, T.; Sakita, M.; Nakamura, M.; Kobira, T. Synthesis and Characteristics of Fe4N Powders and Thin Films. J. Magn. Magn. Mater. 2000, 215–216, 529–531. [Google Scholar] [CrossRef]
- Han, Y.; Wang, H.; Zhang, M.; Su, M.; Li, W.; Tao, K. Low-Temperature Approach to Synthesize Iron Nitride from Amorphous Iron. Inorg. Chem. 2008, 47, 1261–1263. [Google Scholar] [CrossRef]
- Ma, Z.; Li, Z.; Zeng, Y.; Li, P.; Zhang, H. High Electrochemical Performance of Γ″-FeN Thin Film Electrode for Lithium Ion Batteries. J. Power Sources 2019, 423, 159–165. [Google Scholar] [CrossRef]
- Zieschang, A.-M.; Bocarsly, J.D.; Dürrschnabel, M.; Molina-Luna, L.; Kleebe, H.-J.; Seshadri, R.; Albert, B. Nanoscale Iron Nitride, ε-Fe3N: Preparation from Liquid Ammonia and Magnetic Properties. Chem. Mater. 2017, 29, 621–628. [Google Scholar] [CrossRef]
- Mukasyan, A.S.; Roslyakov, S.; Pauls, J.M.; Gallington, L.C.; Orlova, T.; Liu, X.; Dobrowolska, M.; Furdyna, J.K.; Manukyan, K.V. Nanoscale Metastable ε-Fe3N Ferromagnetic Materials by Self-Sustained Reactions. Inorg. Chem. 2019, 58, 5583–5592. [Google Scholar] [CrossRef]
- Ma, T.; Yin, Y.; Hong, F.; Zhu, P.; Yu, X. Magnetic, Electronic, and Mechanical Properties of Bulk ε-Fe2N Synthesized at High Pressures. ACS Omega 2021, 6, 12591–12597. [Google Scholar] [CrossRef]
- Brumovský, M.; Oborná, J.; Micić, V.; Malina, O.; Kašlík, J.; Tunega, D.; Kolos, M.; Hofmann, T.; Karlický, F.; Filip, J. Iron Nitride Nanoparticles for Enhanced Reductive Dechlorination of Trichloroethylene. Environ. Sci. Technol. 2022, 56, 4425–4436. [Google Scholar] [CrossRef]
- Bouanis, F.Z.; Bentiss, F.; Traisnel, M.; Jama, C. Enhanced Corrosion Resistance Properties of Radiofrequency Cold Plasma Nitrided Carbon Steel: Gravimetric and Electrochemical Results. Electrochim. Acta 2009, 54, 2371–2378. [Google Scholar] [CrossRef]
- Weber, T.; de Wit, L.; Saris, F.W.; Königer, A.; Rauschenbach, B.; Wolf, G.K.; Krauss, S. Hardness and Corrosion Resistance of Single-Phase Nitride and Carbide on Iron. Mater. Sci. Eng. A 1995, 199, 205–210. [Google Scholar] [CrossRef]
- Kramm, U.I.; Herranz, J.; Larouche, N.; Arruda, T.M.; Lefèvre, M.; Jaouen, F.; Bogdanoff, P.; Fiechter, S.; Abs-Wurmbach, I.; Mukerjee, S.; et al. Structure of the Catalytic Sites in Fe/N/C-Catalysts for O2-Reduction in PEM Fuel Cells. Phys. Chem. Chem. Phys. 2012, 14, 11673–11688. [Google Scholar] [CrossRef]
- Xie, D.; Xu, Y.; Wang, Y.; Pan, X.; Härk, E.; Kochovski, Z.; Eljarrat, A.; Müller, J.; Koch, C.T.; Yuan, J.; et al. Poly (Ionic Liquid) Nanovesicle-Templated Carbon Nanocapsules Functionalized with Uniform Iron Nitride Nanoparticles as Catalytic Sulfur Host for Li–S Batteries. ACS Nano 2022, 16, 10554–10565. [Google Scholar] [CrossRef] [PubMed]
- Sun, W.; Liu, C.; Li, Y.; Luo, S.; Liu, S.; Hong, X.; Xie, K.; Liu, Y.; Tan, X.; Zheng, C. Rational Construction of Fe2N@C Yolk–Shell Nanoboxes as Multifunctional Hosts for Ultralong Lithium–Sulfur Batteries. ACS Nano 2019, 13, 12137–12147. [Google Scholar] [CrossRef] [PubMed]
- Lehmann, T.S.; Niewa, R. Electrochemical Synthesis of Highly Nitrogen Containing γ-FeN0.13 and ε-Fe3N1.51 in a Molten Salt System. Eur. J. Inorg. Chem. 2019, 2019, 730–734. [Google Scholar] [CrossRef]
- Yamada, M.; Kouzaki, Y.; Yasui, T.; Fukumoto, M. Fabrication of Iron Nitride Coatings by Reactive RF Plasma Spraying. Surf. Coat. Technol. 2006, 201, 1745–1751. [Google Scholar] [CrossRef]
- Haye, E.; Soon Chang, C.; Dudek, G.; Hauet, T.; Ghanbaja, J.; Busby, Y.; Job, N.; Houssiau, L.; Pireaux, J.-J. Tuning the Magnetism of Plasma-Synthesized Iron Nitride Nanoparticles: Application in Pervaporative Membranes. ACS Appl. Nano Mater. 2019, 2, 2484–2493. [Google Scholar] [CrossRef]
- Miura, A.; Takei, T.; Kumada, N. Low-Temperature Nitridation of Manganese and Iron Oxides Using NaNH2 Molten Salt. Inorg. Chem. 2013, 52, 11787–11791. [Google Scholar] [CrossRef]
- O’Sullivan, S.E.; Sun, S.-K.; Lawson, S.M.; Stennett, M.C.; Chen, F.; Masubuchi, Y.; Corkhill, C.L.; Hyatt, N.C. Low-Temperature Nitridation of Fe3O4 by Reaction with NaNH2. Inorg. Chem. 2021, 60, 2553–2562. [Google Scholar] [CrossRef] [PubMed]
- Yamaguchi, K.; Yui, T.; Yamaki, K.; Kakeya, I.; Kadowaki, K.; Suemasu, T. Epitaxial Growth of Ferromagnetic Fe3N Films on Si(111) Substrates by Molecular Beam Epitaxy. J. Cryst. Growth 2007, 301–302, 597–601. [Google Scholar] [CrossRef]
- Robbins, M.; White, J.G. Magnetic Properties of Epsilon-Iron Nitride. J. Phys. Chem. Solids 1964, 25, 717–720. [Google Scholar] [CrossRef]
- Wang, J.; Sun, J.; Sun, Q.; Chen, Q. One-Step Hydrothermal Process to Prepare Highly Crystalline Fe3O4 Nanoparticles with Improved Magnetic Properties. Mater. Res. Bull. 2003, 38, 1113–1118. [Google Scholar] [CrossRef]
- Gangwar, A.; Varghese, S.S.; Sharma, A.; Meena, S.S.; Prajapat, C.L.; Viswanadh, M.K.; Neogi, K.; Muthu, M.S.; Prasad, N.K. Physical and in-Vitro Evaluation of ε-Fe3N@Fe3O4 Nanoparticles for Bioapplications. Ceram. Int. 2020, 46, 10952–10962. [Google Scholar] [CrossRef]
- Mi, Y.; Ma, C.; Zheng, W.; Li, Z.; Zhang, M. Magnetic Losses in Single-Domain Magnetic Particles. Eur. Phys. J. Spec. Top. 2023, 232, 1353–1368. [Google Scholar] [CrossRef]
- Mohapatra, J.; Zeng, F.; Elkins, K.; Xing, M.; Ghimire, M.; Yoon, S.; Mishra, S.R.; Liu, J.P. Size-Dependent Magnetic and Inductive Heating Properties of Fe3O4 Nanoparticles: Scaling Laws across the Superparamagnetic Size. Phys. Chem. Chem. Phys. 2018, 20, 12879–12887. [Google Scholar] [CrossRef]
- Gajbhiye, N.S.; Panda, R.N.; Ningthoujam, R.S.; Bhattacharyya, S. Magnetism of nanostructured iron nitride (Fe–N) systems. Phys. Status Solidi C 2004, 1, 3252–3259. [Google Scholar] [CrossRef]
- Sung Lee, J.; Myung Cha, J.; Young Yoon, H.; Lee, J.-K.; Keun Kim, Y. Magnetic Multi-Granule Nanoclusters: A Model System That Exhibits Universal Size Effect of Magnetic Coercivity. Sci. Rep. 2015, 5, 12135. [Google Scholar] [CrossRef]
- Li, Q.; Kartikowati, C.W.; Horie, S.; Ogi, T.; Iwaki, T.; Okuyama, K. Correlation between Particle Size/Domain Structure and Magnetic Properties of Highly Crystalline Fe3O4 Nanoparticles. Sci. Rep. 2017, 7, 9894. [Google Scholar] [CrossRef]
- Mohapatra, J.; Xing, M.; Elkins, J.; Beatty, J.; Liu, J.P. Size-Dependent Magnetic Hardening in CoFe2O4 Nanoparticles: Effects of Surface Spin Canting. J. Phys. D Appl. Phys. 2020, 53, 504004. [Google Scholar] [CrossRef]
- Gavilán, H.; Simeonidis, K.; Myrovali, E.; Mazarío, E.; Chubykalo-Fesenko, O.; Chantrell, R.; Balcells, L.; Angelakeris, M.; Morales, M.P.; Serantes, D. How Size, Shape and Assembly of Magnetic Nanoparticles Give Rise to Different Hyperthermia Scenarios. Nanoscale 2021, 13, 15631–15646. [Google Scholar] [CrossRef]
- Yan, Y.; Li, Y.; You, J.; Shen, K.; Chen, W.; Li, L. Morphology-Dependent Magnetic Hyperthermia Characteristics of Fe3O4 Nanoparticles. Mater. Chem. Phys. 2025, 329, 130045. [Google Scholar] [CrossRef]
- Yadav, R.S.; Kuřitka, I.; Vilcakova, J.; Havlica, J.; Masilko, J.; Kalina, L.; Tkacz, J.; Hajdúchová, M.; Enev, V. Structural, Dielectric, Electrical and Magnetic Properties of CuFe2O4 Nanoparticles Synthesized by Honey Mediated Sol–Gel Combustion Method and Annealing Effect. J. Mater. Sci. Mater. Electron. 2017, 28, 6245–6261. [Google Scholar] [CrossRef]
- Phong, L.T.H.; Manh, D.H.; Nam, P.H.; Lam, V.D.; Khuyen, B.X.; Tung, B.S.; Bach, T.N.; Tung, D.K.; Phuc, N.X.; Hung, T.V.; et al. Structural, Magnetic and Hyperthermia Properties and Their Correlation in Cobalt-Doped Magnetite Nanoparticles. RSC Adv. 2021, 12, 698–707. [Google Scholar] [CrossRef] [PubMed]
- Shibata, M.; Ogawa, T.; Kawashita, M. Synthesis of Iron Nitride Nanoparticles from Magnetite Nanoparticles of Different Sizes for Application to Magnetic Hyperthermia. Ceram. Int. 2019, 45, 23707–23714. [Google Scholar] [CrossRef]
- Shibata, M.; Kanetaka, H.; Furuya, M.; Yokota, K.; Ogawa, T.; Kawashita, M. Cytotoxicity Evaluation of Iron Nitride Nanoparticles for Biomedical Applications. J. Biomed. Mater. Res. Part A 2021, 109, 1784–1791. [Google Scholar] [CrossRef] [PubMed]
- Li, Z.; Kawashita, M.; Araki, N.; Mitsumori, M.; Hiraoka, M.; Doi, M. Magnetite Nanoparticles with High Heating Efficiencies for Application in the Hyperthermia of Cancer. Mater. Sci. Eng. C 2010, 30, 990–996. [Google Scholar] [CrossRef]
- Myrovali, E.; Papadopoulos, K.; Charalampous, G.; Kesapidou, P.; Vourlias, G.; Kehagias, T.; Angelakeris, M.; Wiedwald, U. Toward the Separation of Different Heating Mechanisms in Magnetic Particle Hyperthermia. ACS Omega 2023, 8, 12955–12967. [Google Scholar] [CrossRef]
- Shaterabadi, Z.; Nabiyouni, G.; Soleymani, M. Correlation between Effects of the Particle Size and Magnetic Field Strength on the Magnetic Hyperthermia Efficiency of Dextran-Coated Magnetite Nanoparticles. Mater. Sci. Eng. C 2020, 117, 111274. [Google Scholar] [CrossRef]
- Hergt, R.; Dutz, S. Magnetic Particle Hyperthermia—Biophysical Limitations of a Visionary Tumour Therapy. J. Magn. Magn. Mater. 2007, 311, 187–192. [Google Scholar] [CrossRef]
- Kallumadil, M.; Tada, M.; Nakagawa, T.; Abe, M.; Southern, P.; Pankhurst, Q.A. Suitability of Commercial Colloids for Magnetic Hyperthermia. J. Magn. Magn. Mater. 2009, 321, 1509–1513. [Google Scholar] [CrossRef]
- Ota, S.; Trisnanto, S.B.; Takeuchi, S.; Wu, J.; Cheng, Y.; Takemura, Y. Quantitation Method of Loss Powers Using Commercial Magnetic Nanoparticles Based on Superparamagnetic Behavior Influenced by Anisotropy for Hyperthermia. J. Magn. Magn. Mater. 2021, 538, 168313. [Google Scholar] [CrossRef]
- Shaw, S.K.; Sharma, A.; Kailashiya, J.; Gupta, S.K.; Meena, S.S.; Dash, D.; Maiti, P.; Prasad, N.K. Mesoporous Fe3O4 Nanoparticle: A Prospective Nano Heat Generator for Thermo-Therapeutic Cancer Treatment Modality. J. Magn. Magn. Mater. 2023, 578, 170817. [Google Scholar] [CrossRef]
- Ota, S.; Takemura, Y. Characterization of Néel and Brownian Relaxations Isolated from Complex Dynamics Influenced by Dipole Interactions in Magnetic Nanoparticles. J. Phys. Chem. C 2019, 123, 28859–28866. [Google Scholar] [CrossRef]
- Mamiya, H.; Jeyadevan, B. Hyperthermic Effects of Dissipative Structures of Magnetic Nanoparticles in Large Alternating Magnetic Fields. Sci. Rep. 2011, 1, 157. [Google Scholar] [CrossRef]
- Kurian, S.; Gajbhiye, N.S. Low Temperature and In-Field Mössbauer Spectroscopic Studies of ε-Fe3N Particles Synthesized from Iron–Citrate Complex. Chem. Phys. Lett. 2010, 493, 299–303. [Google Scholar] [CrossRef]
- Yamaminami, T.; Ota, S.; Trisnanto, S.B.; Ishikawa, M.; Yamada, T.; Yoshida, T.; Enpuku, K.; Takemura, Y. Power Dissipation in Magnetic Nanoparticles Evaluated Using the AC Susceptibility of Their Linear and Nonlinear Responses. J. Magn. Magn. Mater. 2021, 517, 167401. [Google Scholar] [CrossRef]
- Onodera, R.; Kita, E.; Kuroiwa, T.; Yanagihara, H. Effect of Static Magnetic Field Bias on Dynamic Hysteresis Loops of a Magnetic Nanoparticle Suspension. Jpn. J. Appl. Phys. 2022, 61, 065003. [Google Scholar] [CrossRef]
- Wang, J.; Kim, J.-W.; Kang, K.W.; Paek, S.H.; Takemura, Y.; Bae, S. AC and DC Magnetic Softness Enhanced Dual-Doped γ-Fe2O3 Nanoparticles for Highly Efficient Cancer Theranostics. Appl. Mater. Today 2022, 28, 101533. [Google Scholar] [CrossRef]
- Sugumaran, P.J.; Yang, Y.; Wang, Y.; Liu, X.; Ding, J. Influence of the Aspect Ratio of Iron Oxide Nanorods on Hysteresis-Loss-Mediated Magnetic Hyperthermia. ACS Appl. Bio. Mater. 2021, 4, 4809–4820. [Google Scholar] [CrossRef] [PubMed]
- Kim, H.; Im, P.W.; Piao, Y. A Facile Route for the Preparation of Monodisperse Iron Nitride at Silica Core/Shell Nanostructures. Front. Bioeng. Biotechnol. 2021, 9, 735727. [Google Scholar] [CrossRef]
- Guo, X.; Wu, Z.; Li, W.; Wang, Z.; Li, Q.; Kong, F.; Zhang, H.; Zhu, X.; Du, Y.P.; Jin, Y.; et al. Appropriate Size of Magnetic Nanoparticles for Various Bioapplications in Cancer Diagnostics and Therapy. ACS Appl. Mater. Interfaces 2016, 8, 3092–3106. [Google Scholar] [CrossRef] [PubMed]
- Perrault, S.D.; Walkey, C.; Jennings, T.; Fischer, H.C.; Chan, W.C.W. Mediating Tumor Targeting Efficiency of Nanoparticles through Design. Nano Lett. 2009, 9, 1909–1915. [Google Scholar] [CrossRef]
- Tian, X.; Ruan, L.; Zhou, S.; Wu, L.; Cao, J.; Qi, X.; Zhang, X.; Shen, S. Appropriate Size of Fe3O4 Nanoparticles for Cancer Therapy by Ferroptosis. ACS Appl. Bio. Mater. 2022, 5, 1692–1699. [Google Scholar] [CrossRef] [PubMed]
- Wu, L.; Wen, W.; Wang, X.; Huang, D.; Cao, J.; Qi, X.; Shen, S. Ultrasmall Iron Oxide Nanoparticles Cause Significant Toxicity by Specifically Inducing Acute Oxidative Stress to Multiple Organs. Part. Fibre. Toxicol. 2022, 19, 24. [Google Scholar] [CrossRef]
- Siddiqui, M.A.; Wahab, R.; Saquib, Q.; Ahmad, J.; Farshori, N.N.; Al-Sheddi, E.S.; Al-Oqail, M.M.; Al-Massarani, S.M.; Al-Khedhairy, A.A. Iron Oxide Nanoparticles Induced Cytotoxicity, Oxidative Stress, Cell Cycle Arrest, and DNA Damage in Human Umbilical Vein Endothelial Cells. J. Trace Elem. Med. Biol. 2023, 80, 127302. [Google Scholar] [CrossRef]


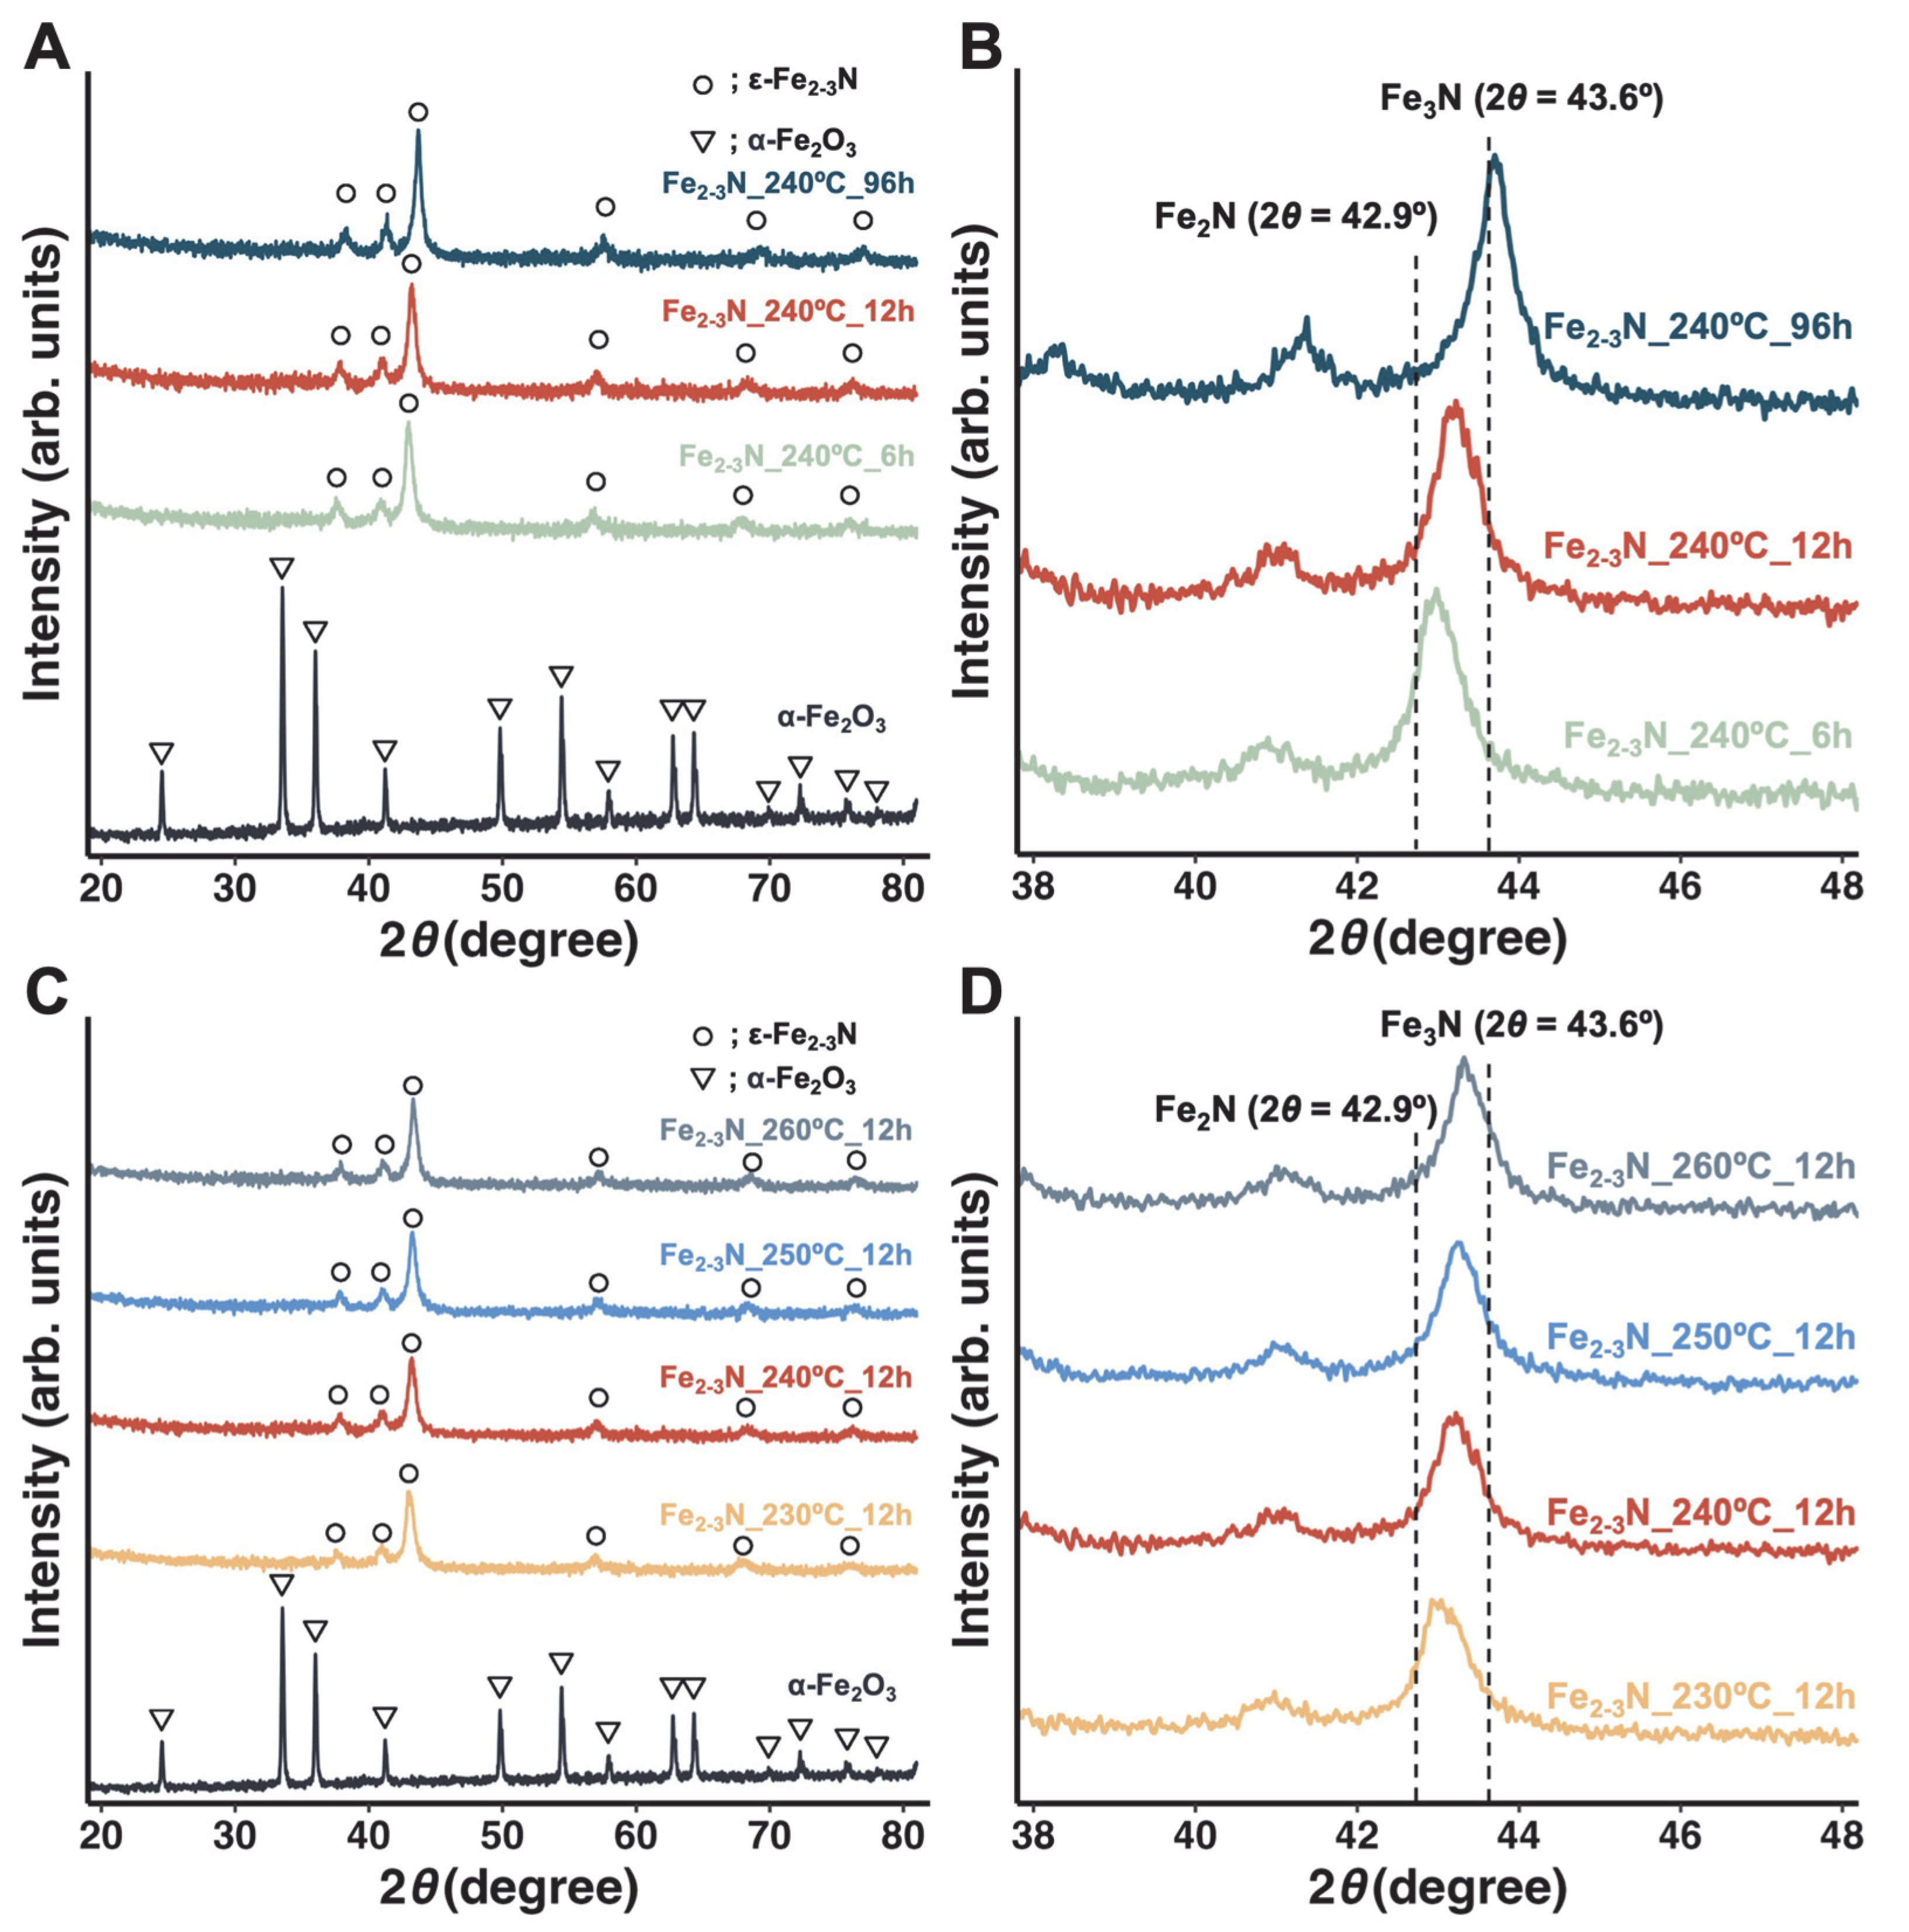
| Sample | a (Å) | c (Å) | Volume (Å3) | x in Fe2+xN | Estimated Composition |
|---|---|---|---|---|---|
| Fe2–3N_240°C_6h | 4.79 | 4.41 | 87.9 | 0.0241 | Fe2.02N |
| Fe2–3N_240°C_12h | 4.76 | 4.40 | 86.5 | 0.334 | Fe2.33N |
| Fe2–3N_240°C_96h | 4.70 | 4.36 | 83.5 | 0.999 | Fe3.00N |
| Fe2–3N_230°C_12h | 4.78 | 4.41 | 87.2 | 0.177 | Fe2.18N |
| Fe2–3N_250°C_12h | 4.76 | 4.40 | 86.2 | 0.385 | Fe2.39N |
| Fe2–3N_260°C_12h | 4.75 | 4.39 | 85.6 | 0.514 | Fe2.51N |
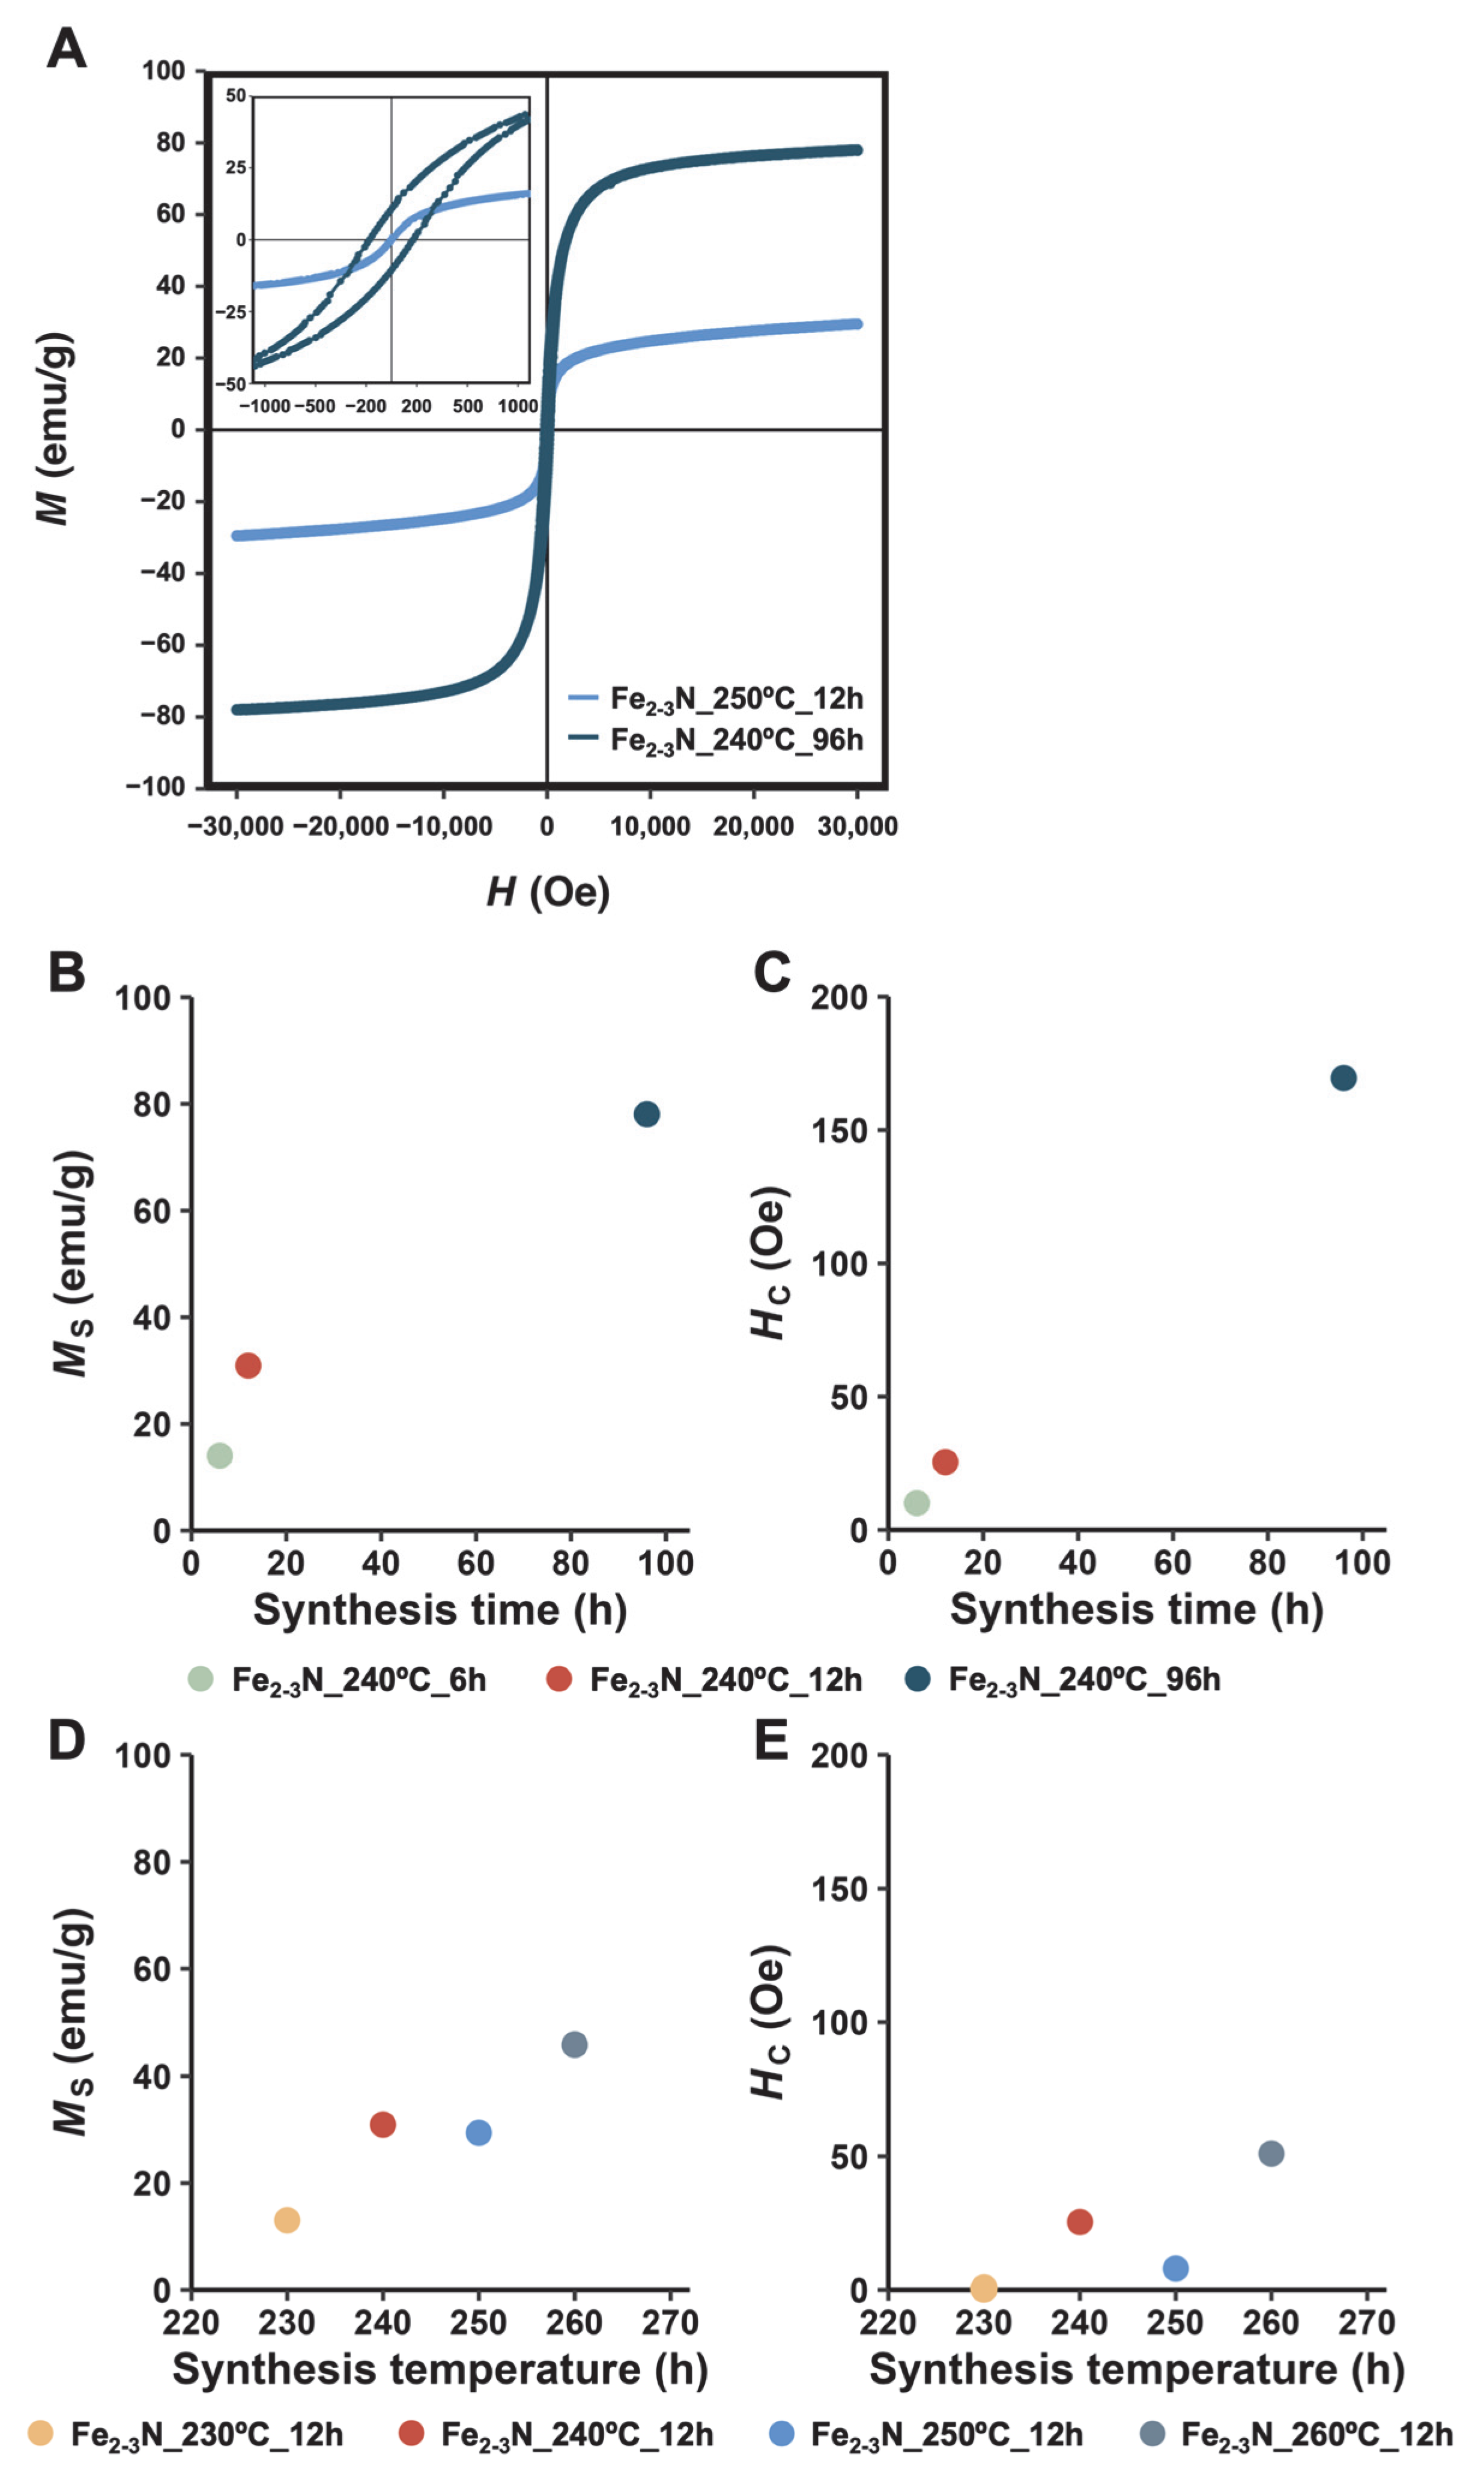
| Sample | Ms (emu/g) | Mr (emu/g) | Hc (Oe) |
|---|---|---|---|
| Fe3O4 | 91.6 | 5.5 | 71.6 |
| Fe2–3N_240°C_6h | 14.0 | 0.1 | 10.0 |
| Fe2–3N_240°C_12h | 30.9 | 1.2 | 25.4 |
| Fe2–3N_240°C_96h | 78.1 | 10.7 | 170 |
| Fe2–3N_230°C_12h | 13.0 | ||
| Fe2–3N_250°C_12h | 29.4 | 0.5 | 8.8 |
| Fe2–3N_260°C_12h | 45.9 | 3.6 | 51.0 |
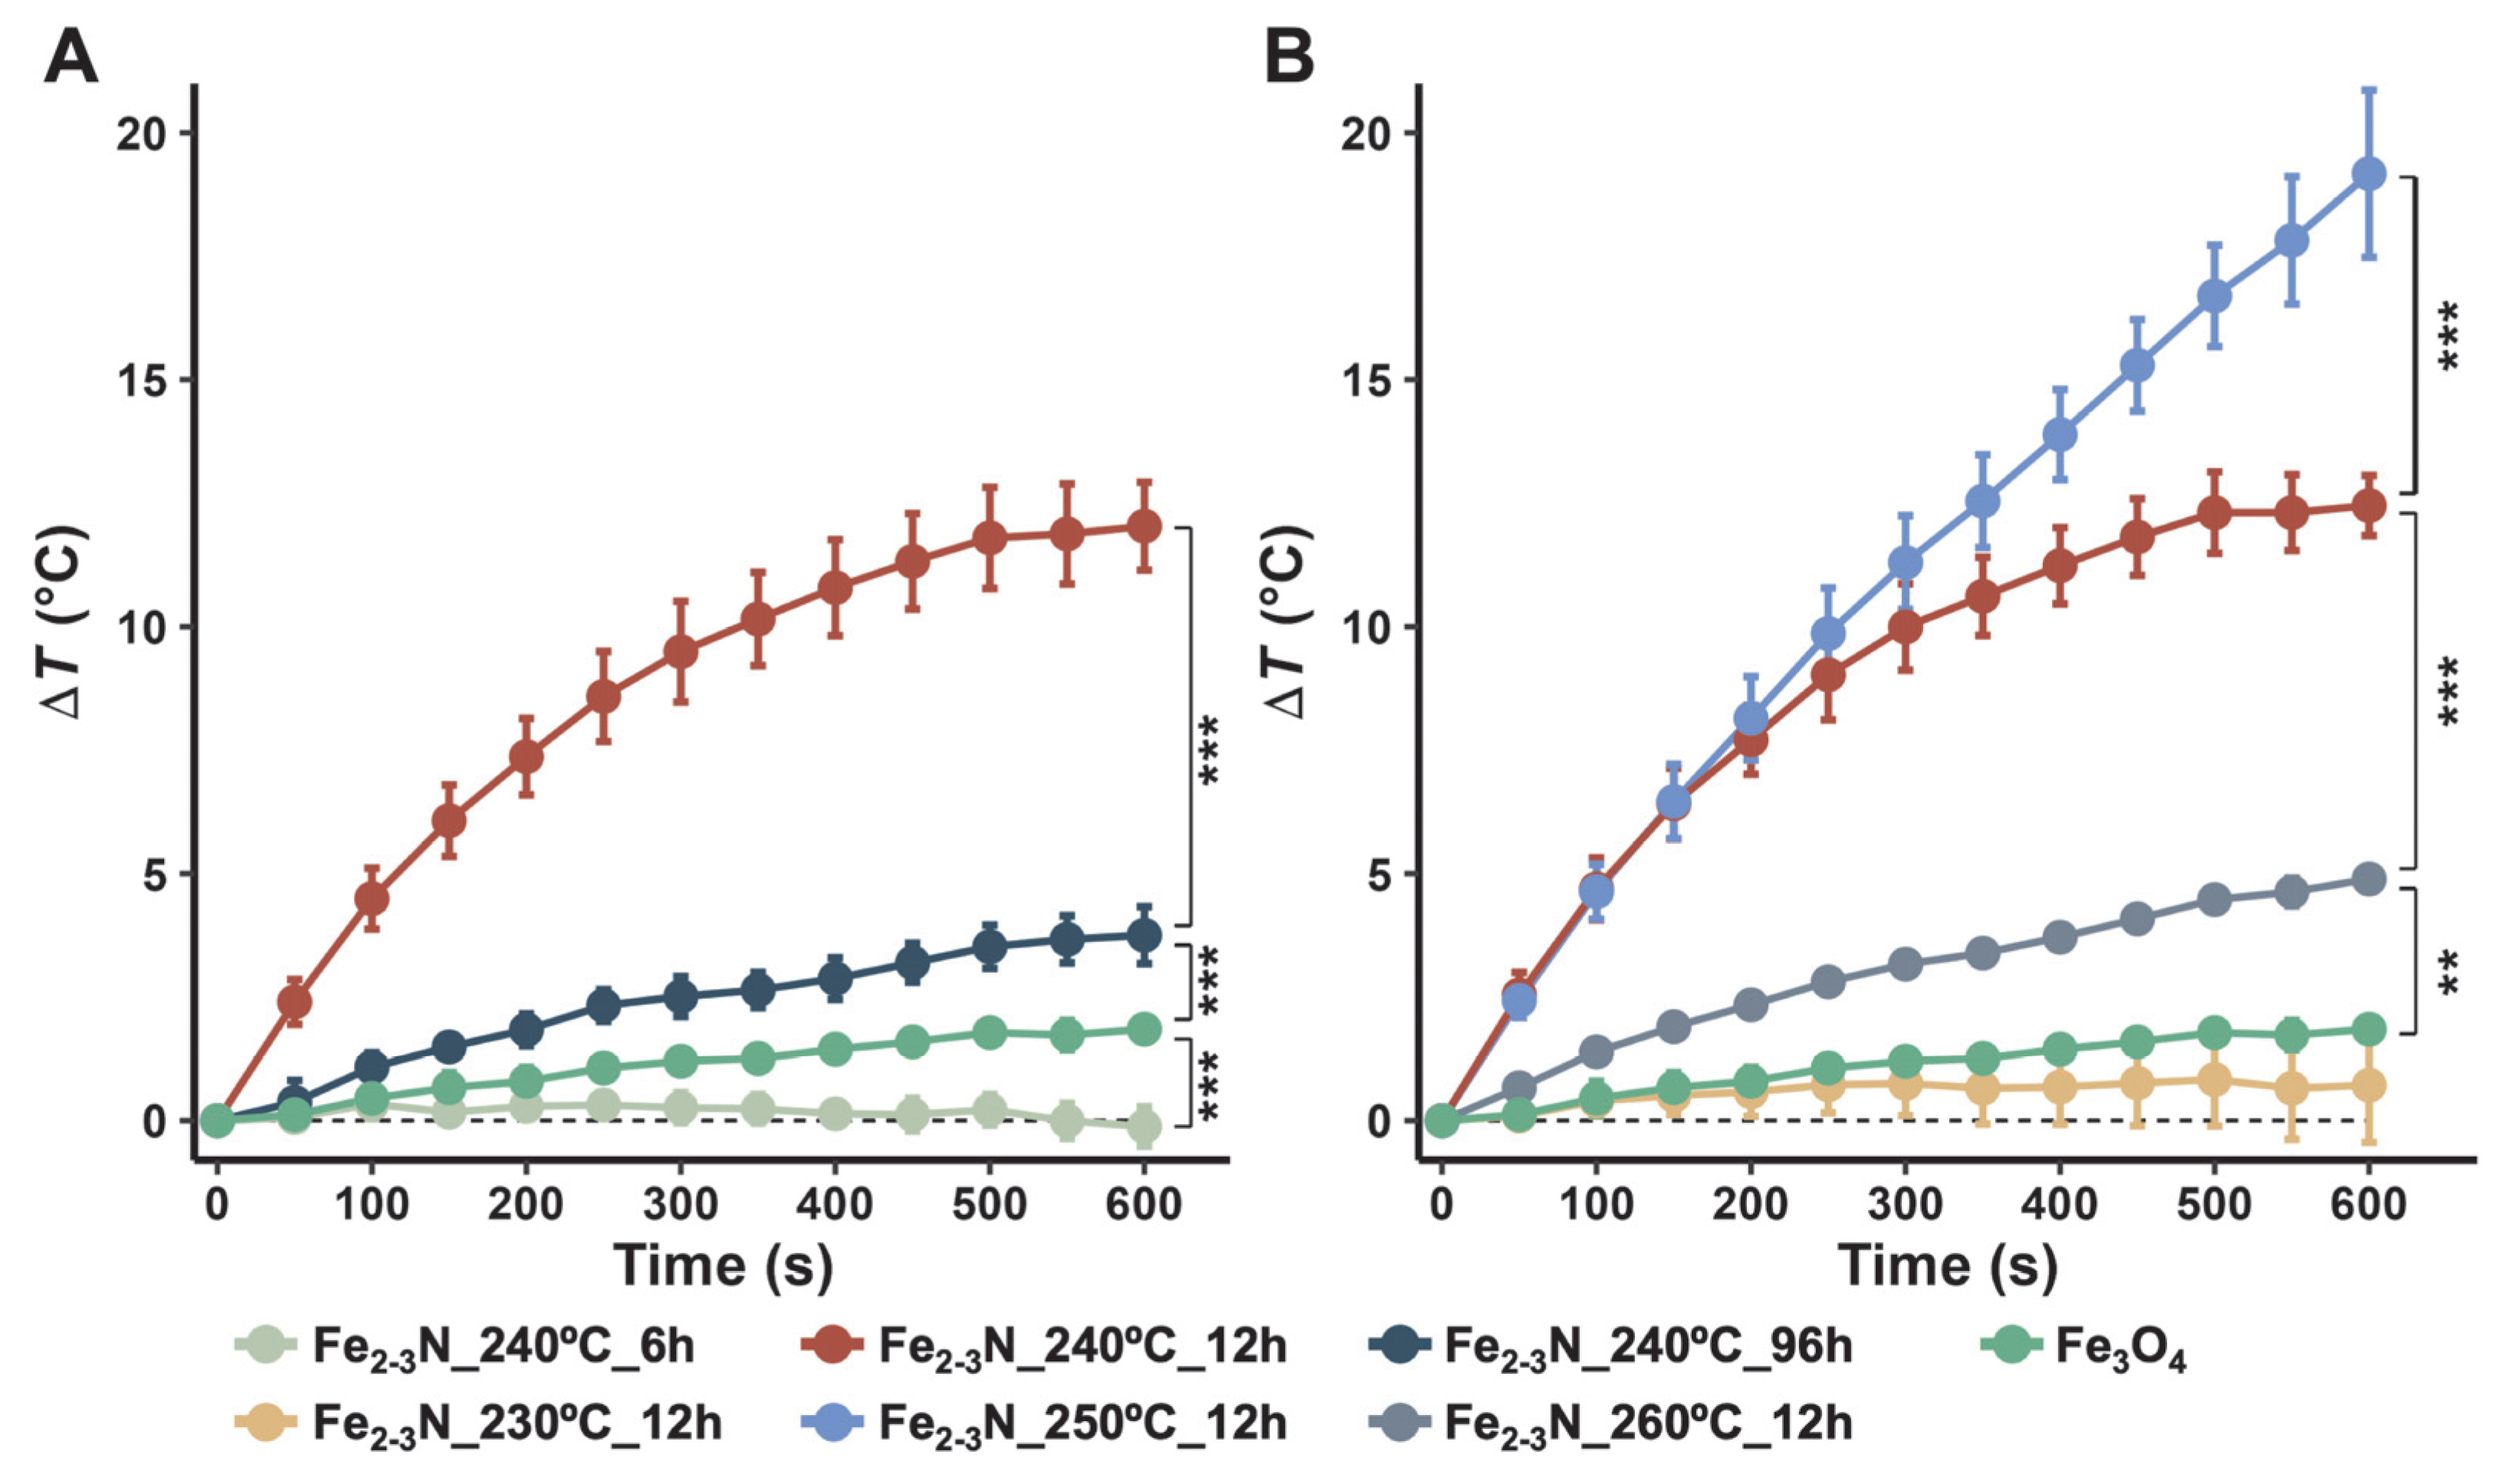
| Sample | SAR (W/g) | ILP (nH m2/kg) |
|---|---|---|
| Fe2–3N_250°C_12h | 2.54 | 0.257 |
| Fe3O4 | 0.126 | 0.0127 |
Disclaimer/Publisher’s Note: The statements, opinions and data contained in all publications are solely those of the individual author(s) and contributor(s) and not of MDPI and/or the editor(s). MDPI and/or the editor(s) disclaim responsibility for any injury to people or property resulting from any ideas, methods, instructions or products referred to in the content. |
© 2025 by the authors. Licensee MDPI, Basel, Switzerland. This article is an open access article distributed under the terms and conditions of the Creative Commons Attribution (CC BY) license (https://creativecommons.org/licenses/by/4.0/).
Share and Cite
Usuki, S.; Ogawa, T.; Shimabukuro, M.; Yokoi, T.; Kawashita, M. Synthesis of ε-Fe2–3N Particles for Magnetic Hyperthermia. J. Funct. Biomater. 2025, 16, 203. https://doi.org/10.3390/jfb16060203
Usuki S, Ogawa T, Shimabukuro M, Yokoi T, Kawashita M. Synthesis of ε-Fe2–3N Particles for Magnetic Hyperthermia. Journal of Functional Biomaterials. 2025; 16(6):203. https://doi.org/10.3390/jfb16060203
Chicago/Turabian StyleUsuki, Soichiro, Tomoyuki Ogawa, Masaya Shimabukuro, Taishi Yokoi, and Masakazu Kawashita. 2025. "Synthesis of ε-Fe2–3N Particles for Magnetic Hyperthermia" Journal of Functional Biomaterials 16, no. 6: 203. https://doi.org/10.3390/jfb16060203
APA StyleUsuki, S., Ogawa, T., Shimabukuro, M., Yokoi, T., & Kawashita, M. (2025). Synthesis of ε-Fe2–3N Particles for Magnetic Hyperthermia. Journal of Functional Biomaterials, 16(6), 203. https://doi.org/10.3390/jfb16060203