Abstract
Centrifugal compressors are widely used in many industrial fields such as automotive, aviation, aerospace. However, these turbomachines suffer instability phenomenon when the flow rate is too high or too low, called rotating stall and surge. These phenomena cause the operation failure, pressure fluctuations and vibrations of the thorough system. Numerous mechanical solutions have been presented to minimize these instabilities and expand the operating range towards low-flow rates like active control of the flow path, variable inlet guide vane and casing treatment. Currently, our team has developed a novel compressor composed of a twin-impeller powered by autonomous systems. We notice the performance improvement and instabilities suppression of this compressor experimentally. In this paper, an active control method is introduced by controlling the speed and rotation direction of the impellers to expand the operating range. A CFD study is then conducted to analysis flow morphology and thermodynamic characteristics based on the experimental observations at three special points. Numerical results and experimental measurements of compressor maps are consistent.
1. Introduction
Two instability states of a centrifugal compressor are called surge and choke. The stability operating area of the compressor is limited by these two states. In fact, the engineers want to expand this area to improve the compressor performance, preventing the damage caused by these undesired states. Choke occurs when the discharge pressure is low, and the flow rate is large. The flow velocity between blade passage increases rapidly and achieves the speed of sound. Consequently, a high-frequency vibration with small amplitudes in blades and stator vanes are generated, the flow channels suffer a blockage effect. In this state, the compressor presents a low performance and blade failure due to the material’s fatigue effect over a long time. Choke is likely to occur in axial compressor than centrifugal compressor because of the more considerable distance between the surge and choke limits of centrifugal compressors on the performance map. Therefore, a choking phenomenon in centrifugal compressors is frequently overlooked, and it does not cause deep concern for researchers.
In contrast, Surge happens if the mass flow rate becomes too low and the discharge pressure is too high. The generated pressure does not overcome the downstream pressure gradient, the pressure drops rapidly, and a dynamic back-flow is formed inside the compressor. The discharge pressure and the mass flow through the compressor decreases sharply. Due to the continuity of the fluid, the equilibrium of the compressor is then re-established. The discharge pressure and the mass flow increase gradually until the limited point. These processes are periodically replicated and generated a pressure oscillation cycle in the system. This oscillation constitutes the strong impact pulses. If the compressor works for a long time in the instability state, the internal components can be damaged. Surge is easier to detect thanks to the pressure pulse signals in the system Compared to the choke phenomenon. Therefore, researchers focus on improving the surge limit to extend the compressor operating range towards low flow rates.
Many publications illustrate the solutions to limit the occurrence of this phenomenon. The most common method being developed today is active control. Active control represents a method of using control commands to limit the occurrence of surge, thereby extending the operating range of the compressor. For this method, the working parameters of the compressor like differential pressure (ΔP), flow rate (Q), temperature (T) are measured directly during the operation of the machine. The measured data is then analyzed, processed, and control commands are sent to the actuator. These control commands are used to open/close the recycle valve [1,2] creating a safe margin—a new limit line about 10% from the actual surge line, ensuring the machine always operates in a safe zone; air injection control thorough a plenum bleed valve to minimize flow turbulence to improve surge margin from 4% to 18% [3,4,5]. The other methods such as using the casing treatment method by adding grooves, slots, or holes in the casing inducer [6,7,8] are developed to suspend the surge phenomenon. Recently, a new method for detecting the instability phenomenon in a vaned diffuser compressor [9] and a vaneless diffuser compressor [10] was introduced. In this method, some criteria have been developed to predict the instability operating range such as the tip leakage vortex at low velocity or the counter pressure of the volute at high speed by using full annulus model or simplified model (single passage). These models are accurate, and they can be used for the optimization strategy in an initial design phase.
A novel generation of centrifugal compressors that use twin-impeller to improve surge margin based on the active control method. This compressor consists of two successive impellers as shown in Figure 1. The speed of each impeller can controlled independently. Especially, the speed and the rotation direction of the upstream impeller can be changed if the surge phenomenon is detected. Consequently, this compressor can operate in two modes: contra-rotating mode (the two impellers rotate in the opposite direction) and co-rotating mode (the two impellers rotate in the same direction). The geometry parameters of the upstream-impeller and downstream-impeller are summarized respectively in Table 1 and Table 2. The first experimental results have been reported in refs [11,12]. The present paper is dedicated to the surge margin improvement is introduced by using the active control method. The speed and rotational direction of the upstream impeller are controlled when the surge phenomenon is detected. We first present experimental results, thena numerical study is then conducted to analysis the fluid flow characteristics inside the compressor in both counter-rotating and co-rotating modes [13]. Three special points have been selected for analysis: Best Efficiency Point (BEP), Near Surge Point (NSP) in contra-rotating mode and Extended Surge Point (ESP) in co-rotating mode. This research result provides a primary basis for the development of this compressor type in the near future.
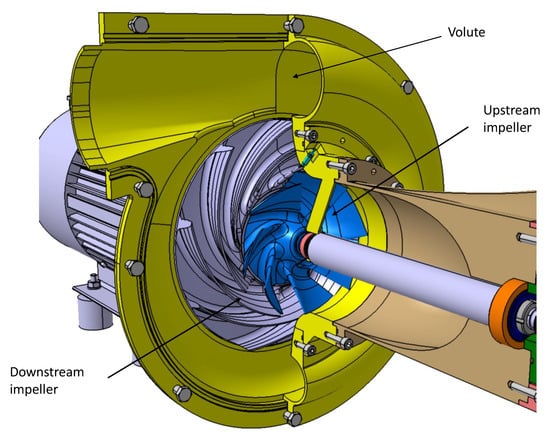
Figure 1.
Structure of the twin-impeller centrifugal compressor (TICC).

Table 1.
Upstream-impeller geometric parameters.

Table 2.
Downstream-impeller geometric parameters.
2. Experiment Study
2.1. Experiment Facilities
The Twin-Impellers Centrifugal Compressor (TICC) has been realized in the laboratory of Fluid Engineering and Energy system (LIFSE) [11,12]. Figure 2 illustrates the test bench used to characterize the performance. This test bench is designed in a suction application; the compressor aspirates the air at the room temperature and blows to the atmosphere. The air is aspirated into the system through a tank, on which there is a flat plate with 120 holes drilled with a diameter of 8 mm, these holes are used to regulate the air flow into the system. Then the air passes through a long pipe with a diameter of D = 158.5 mm connects the tank to the compressor. A flow meter, a thermo-couple and four pressure taps are equipped on this pipe to measure the compressor inlet parameters. The Pt100 thermo-couple is located at 20D to measure the inlet temperature. The flow-meter includes a Pitot tube connected to an FC66 manometer with an accuracy , at 12D, is used to measure the inlet flow rate. Four pressure taps are arranged on the circumferential inlet pipe, at the distance of 3D, and connected to an FC322 manometer with an accuracy 0.5%. This manometer measures the differential pressure between the inlet and the atmospheric pressure. Two Kistler dynamic pressure sensors are located on the pipeline at the inlet and between the impeller’s region with sensitivity , natural frequency > 100 kHz. These sensors are used to analysis the pressure signal to detect the pressure fluctuation in the system, one of the indications of the surge phenomenon. Three Pt100 thermo-couples are installed on the circumferential outlet pipe, at the distance of 4D from the downstream compressor, to measure the outlet temperature. These thermo-couples have a range of uncertainty of 0.02 °C ÷ 0.04 °C in the range of temperature considered in this experimental study. In the case of measurements, the TICC is driven by two independent electric motors. The speed of the impellers can be changed in order to improve the surge region. Especially, the rotation direction of the first impeller can be changed in the opposite direction.
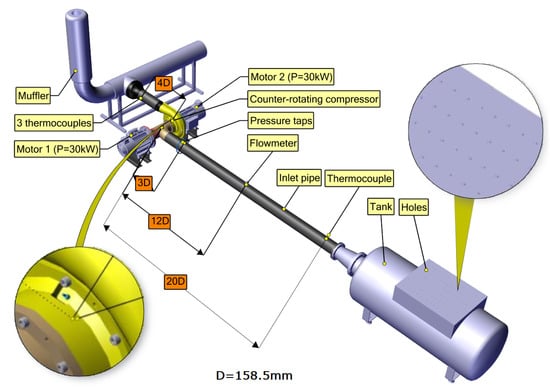
Figure 2.
Twin-impeller centrifugal compressor test bench.
2.2. Active Control Method to Extend the Operating Range
The active control method is used in this paper to improve the surge area of the compressor thereby extending the operating range. This method is based on the pressure signal analysis data of two dynamic pressure sensors to give a signal to control the rotational speed of each impeller accordingly. The speed of each impeller will be increased or decreased depending on the desired pressure ratio and flow rate. In the surge region of the reference single-impeller compressor, for example, the twin-impellers compressor needs to reduce the upstream impeller speed and increase the downstream impeller speed to maintain the same pressure ratio. As the flow rate decreases, the differential incidence angle in the upstream impeller increases, the flow separation starts in the blade passage, hence the eddies are formed. The reducing upstream impeller speed minimizes the increase in the incidence angle, thereby eliminating the formation of vortex regions, which cause surges phenomenon at low flow rate.
For clearly demonstrating the improved surge region of the novel twin-impellers compressor, a Single-Impeller Centrifugal Compressor (SICC) which has the identical size was selected as the reference compressor. Based on the experimental curve of the reference compressor at the speed selected of 11k rpm, this curve is reconstructed on the novel compressor by controlling its impellers speed. The speed of each impeller is adjusted corresponding to the desired pressure ratio, based on the characteristic curve of the reference compressor. Figure 3 shows a comparison between the two experimental performance curves, the blue line depicts the single-impeller compressor curve at 11k rpm, the red line represents the reconstructed twin impeller compressor based on the reference compressor one.
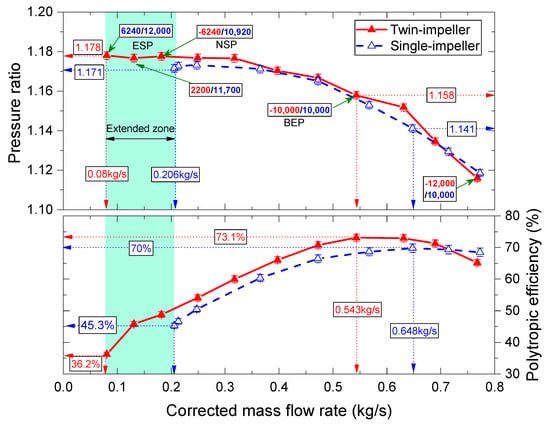
Figure 3.
Comparison of performance between TICC and SICC in case of simultaneous impeller speed changes: red solid line represents the TICC performance and blue dashed line depicts the SICC one at 11k rpm.
The TICC performance curve is constructed with almost the same pressure ratio of SICC one by fixing the downstream impeller speed at 10k rpm, and then the speed of upstream impeller is controlled to obtain the identical pressure ratio. The first point starts with the speeds of the upstream and downstream impeller respectively equal to −12k rpm and 10k rpm in counter-rotating mode. When the mass flow rate diminishes, the first impeller speed is reduced to archive the same pressure ratio of SICC. The Best Efficiency Point (BEP) attains when the speed of each impeller is 10k rpm at the mass flow rate of 0.543 kg/s. This point is shifted slightly to the left than the best performance point of SICC at 0.648 kg/s. The next points at lower mass flow rate, the speed of the upstream impeller is reduced gradually to meet the same performance of the reference compressor. When the performance curve approaches the near surge point of SICC (, kg/s), the speed of the two impellers is controlled simultaneously to maintain the pressure ratio constant.
The Near Surge Point (NSP) is the limit point in counter-rotating mode, where the speed of the upstream and downstream impeller are respectively −6240 rpm and 10,920 rpm. This point is moved slightly to the left compared to the limit point of SICC. When the mass flow rate is further diminished, the upstream impeller speed decreases rapidly to eliminate the instability phenomenon. This speed drops even to zero and then reverses rotation to further eliminate surge phenomenon at lower flows. The compressor works in co-rotating mode with two impellers rotate in the same direction. The basic principle of this method is controlling the incidence angle at the inlet of the impellers by varying the speed of the upstream-impeller. Indeed, the incidence angle increases when the mass flow rate decreases. If it reaches a limit value, the flow separation will take place inside the impeller and create vortex cells causing instability. Figure 4 depicts the velocity triangles of TICC in the two modes of operating: counter-rotating-rotating mode (Figure 4a) and co-rotating mode (Figure 4b). It is clear that the velocity components are also change if the upstream-impeller speed is varied. The relative velocity components in co-rotating mode diminish considerably lead to the change in the and compared to the counter-rotating mode. Of course, the enthalpy of the compressor in the co-rotating mode reduce so that the speed of the downstream-impeller needs to increase to compensate the energy loss of the upstream-impeller used to settle the instability phenomenon. In the co-rotating mode, the compressor can operate at the lower flow rate, and the surge limit of the compressor is shifted significantly to the left compared to the reference compressor.
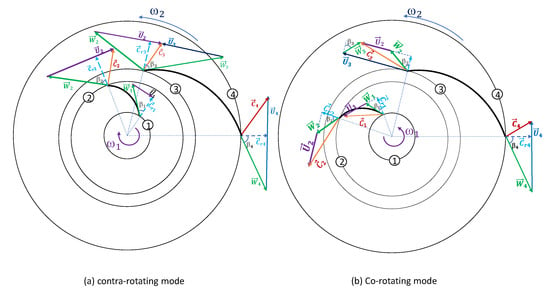
Figure 4.
Velocity triangles of TICC in two operating mode: counter-rotating (a) and co-rotating (b). 1—Upstream-impeller inlet, 2—Upstream-impeller outlet, 3—Downstream-impeller inlet and 4—Downstream-impeller outlet.
The Extended Surge Point (ESP) is the new limit point where the compressor works at a low mass flow rate of 0.08 kg/s. This means that the surge margin of the compressor has been extended by about 22% toward the lower flow rate. The upstream and downstream impeller speeds are 6240 rpm and 12k rpm, respectively. In order to achieve the maximum extension of operating range, the upstream and downstream impeller speeds are 6240 rpm and 12k rpm respectively, in other words, the upstream impeller speed reaches of 50% downstream impeller speed. Furthermore, the polytropic efficiency of TICC is always higher that SICC, the peak efficiency of TICC reaches while that of SICC is . Besides, the TICC efficiency at the extended region drops rapidly because the temperature rises quickly.
Experimental results demonstrate the remarkable effect of using double impeller in expanding the operating range of centrifugal compressors. However, in order to better understand the flow structure inside the compressor in both counter-rotating and co-rotating modes, numerical simulation studies are conducted and presented in the following section.
3. Numerical Study
Computational fluid dynamics (CFD) is a powerful tool in the design and performance evaluation of the turbomachinery. In present paper, the twin-impeller centrifugal compressor has been studied by using the commercial CFD software Star CCM+ 13.06. First, the geometrical and the physic models are presented. Then, the simulation results at the impeller speed of 11k rpm are compared to the experimental data to qualify the CFD method. Finally, the three selected points are reported to disclose the flow pattern inside the compressor in the steady and unsteady state simulations.
CFD model: TICC compressor is modeled into seven domains: inlet pipe, inlet elbow, upstream-impeller, downstream-impeller, cavity, volute, and outlet pipe. The inlet and outlet pipe domains are extended to 5-diameter-long to reduce the effect of boundary conditions [14]. Polyhedral grid is used to discrete because of higher accuracy when the second flow is relevant [15]. Furthermore, a prism layer is applied to increase the near-wall region in order to obtain the y+ value close to the unity on the blade surface as shown in Figure 5. Centrifugal compressor operation is inherently an unstable process, i.e., the flow present inside the centrifugal compressor is unsteady. The main reason is the complex geometry of the impeller and the aerodynamic interaction between the rotation and stationary parts. So, the flow model involves the problem of handling the rotating effects and the interaction between rotating parts and stationary parts. In spite of the unsteady flow, the compressor can be modeled as a steady-state problem using the multiple frames of reference approach. This technique consists in using a moving frame and accounting for additional terms for the Coriolis and centrifugal forces. The flow in the rotating component is modeled in rotating frame while the stationary parts can be solved with equations in the stationary frame.
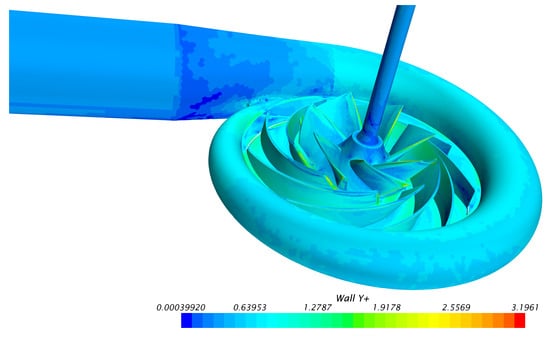
Figure 5.
Distribution of Y+ value at BEP ( = 0.584 kg/s, N1 = −11k rpm, N2 = 11k rpm).
The commonly used turbulence models in simulation of a compressor can be expected to cope with high Reynolds number flows as well as complex flow dynamic inside the compressor. The qualification of turbulence model can be validated with sufficient various experimental data. In turbomachinery simulation, there are four popular turbulence models were tested, the k- was considered the best model because it does the best overall job in predicting the complex flows involving separation [16]. Concerning to the influence of blade rows, unsteady-state simulations are then conducted to evaluate the effect of the relative position between two blade rows on the performance and the separation flows and the formation of eddy zone inside the blade passage. In the unsteady-state simulation, a time step T = 2.143 × was selected. The chosen value corresponds to 1.29 deg turning of the impeller per time step. For each time step, all maximal residuals are converged to 1 × after 20 internal iteration loops.
Boundary conditions: The outlet pressure is imposed as the atmospheric pressure of 101,325 Pa. The mass flow rate and the total temperature are used as the inlet boundary condition. The frozen interfaces are used between fluid domains. Table 3 summaries the boundary condition used for CFD simulation.

Table 3.
Boundary condition of the CFD model.
Mesh dependency: the mesh model for the computation plays an important role in saving computational resources as well as ensuring accuracy. Selection of the appropriate mesh model is done through mesh independence test by constructing various mesh models. Three mesh models to investigate the influence of mesh resolution on the performance of the compressor has been conducted. More details of these mesh sets are summarized in Table 4 and Figure 6. The simulation is performed at the speed = −11k rpm, = 11k rpm and is compared to the experimental results [11,12]. Figure 7 show the comparison between three performance curves corresponding to three mesh sets and the experimental data. It can be seen that all models give nearly the same results, however, mesh 2 and 3 predicts results with smaller deviation than mesh 1. The divergence between simulation results and experimental measurements is below 5%, which is entirely acceptable. Mesh 2 and 3 show nearly the same results in BEP and low flow regions, consequently, mesh 2 is selected to the further simulation.

Table 4.
Details of three mesh sets used for mesh sensitivity study.
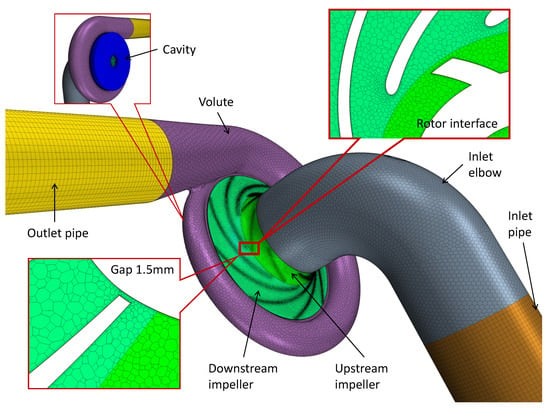
Figure 6.
More details of mesh used for CFD simulation.
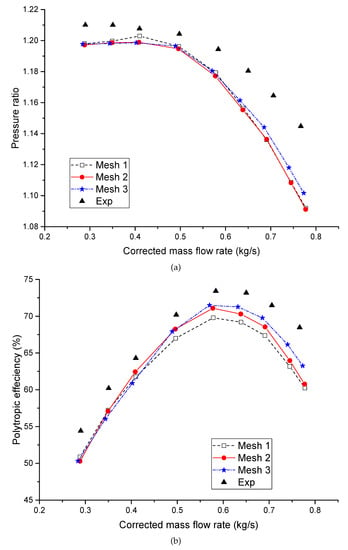
Figure 7.
Comparison between the simulation results with different mesh sizes and experimental measurements at the speed of = −11k rpm, = 11k rpm: Pressure ratio (a) and polytropic efficiency (b).
4. Results and Discussion
4.1. Steady-State Simulation
In the steady-state method, the moving reference frame technique is applied on impeller regions while the grid is not moving. The Coriolis and centrifugal forces are added to the momentum equations so even though the mesh does not rotate, the impeller motion is still modeled. This simulation used the mean values are computed and does not change in time. So, this method saves the time and the resources. For the first step, the steady-state simulation is performed to analyze the flow structure inside of the twin-impeller compressor. To analyze the difference in fluid flow structure affected by the active control method, three special points: BEP, NSP, ESP have been simulated with the working parameters based on experimental results and summarized in Table 5.

Table 5.
Operating parameters of BEP, NSP, ESP.
4.1.1. Flow Analysis
The pressure distribution at three different points on 0.5 span surface are shown in Figure 8. It is clear that the pressure increases gradually from the leading edge to the trailing edge of each impeller and from the volute tongue to the exit cone region at BEP. However, there is some different distribution at two other points. At NSP, the larger differential pressure between the exit cone region and the inlet volute tongue. Especially, some local high-pressure regions can be seen at the pressure surface of the downstream impeller. The cause of this phenomenon is that these blades face the backward pressure gradient from the exit cone. It is being developed inside the volute due to the decrease in compressor flow. If the mass flow of the compressor continues to decrease, a back and strong flow is generated. Consequently, the compressor falls into the surge phenomenon. In order to help the compressor to operate at a lower flow rate than NSP with the same pressure ratio, the speeds of the two impellers need controlling independently. The speed of the up-stream impeller should be decreased to diminish the incidence angle at the leading edge, and the speed of the downstream impeller is controlled to increase simultaneously to compensate the drop of pressure due to the velocity decrease of the upstream impeller. Nonetheless, this method permits the compressor work stable up to the upstream impeller does not rotate any more. If the flow rate diminishes continuously, the rotational direction of the upstream impeller needs to change in the opposite direction, called “co-rotating mode” of TICC. The limit point where the compressor work stable is ESP at the flow rate of 0.066 kg/s. In this way, the compressor can operate stably at very low flow rates while keeping the compression ratio unchanged. It can be noted that the pressure distribution at ESP is virtually identical to NSP. However, the local pressure regions on the downstream-impeller pressure surface are higher due to the impact of the fluid flowing out from the adjacent blade passage.
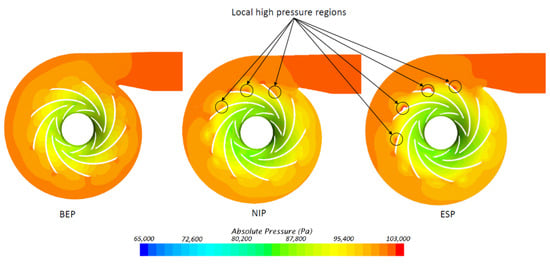
Figure 8.
Pressure distribution on 0.5 span surface.
The relative velocity distribution on 0.5 span surface illustrated in Figure 9. The velocity distribution is quite uniform within the impellers as well as inside the volute at BEP. Furthermore, jet/wake patterns can be clearly observed at the downstream impeller exit. Two different velocity regions can be seen at the downstream-impeller blade exit. The high velocity pattern appears on the pressure side and a lower velocity pattern is shown on the suction side of the impeller. The variation of discharge flow velocity at the impeller exit has been tested and demonstrates the existence of a jet/wake flow pattern by Eckardt [17]. However, NSP illustrates the turbulence within the blade passage close to the volute tongue. It develops in the opposite direction of the impeller rotation. Because of the pressure gradient from the exit cone, the fluid flow is restricted at the exit blade. The vortices formed within the blade passage create localized high-pressure zones on the pressure surface of the blade as described in the pressure distribution section. These eddies completely blocked four blade passages of downstream impeller while the flow can circulate normally in the remaining blade passages. That means the compressor is still operating in a steady state but close to the surge. Almost like the NSP, eddies have appeared in both impellers at ESP. Although the eddies appear in most blade passages and obstruct the fluid flow there, the fluid flow still passes through some other blade passages thanks to the co-rotating effect of the upstream impeller. This effect helps to change the working conditions at the impeller inlet thereby reducing the incidence angle, which causes eddies within the blade passage. So, the compressor still keeps a stable working state.
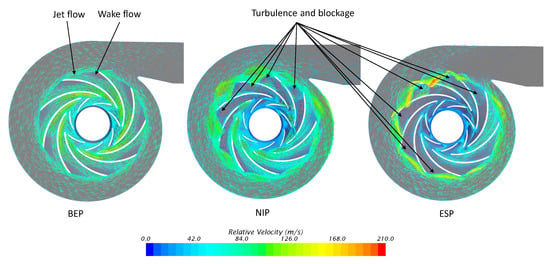
Figure 9.
Relative velocity vector distribution on 0.5 span surface.
The presence of turbulence regions within the blade passages of NSP and ESP rapidly reduces the compressor performance due to increased losses. The eddy regions increase entropy within the impellers. This increase can be seen clearly at ESP as shown in Figure 10. At BEP, the entropy distribution is uniform, which shows that the compressor operates at the highest efficiency and least loss. The uneven distribution of entropy within the downstream impeller of NSP and ESP due to eddies increases entropy rapidly inside the blade passage. The most increase of entropy can be observed inside the blade passage near the volute tongue of ESP, where the entropy value is tripled compared to the BEP. This shows that the compressor operating at this point suffers many losses, so its performance is low. This is completely consistent with the performance curve shown in Figure 3.
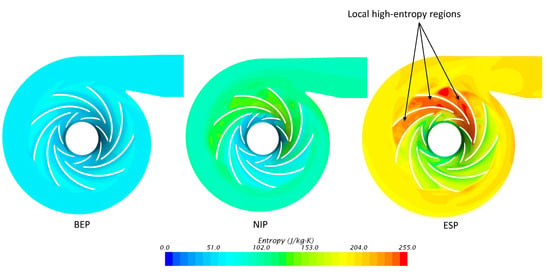
Figure 10.
Entropy distribution on 0.5 span surface.
4.1.2. Asymmetry Effect
Due to the unique structure of twin-impeller compressors, the inducer must use an inlet elbow so that the inlet becomes asymmetric. The compressor performance and the surge limit point are also affected. Figure 11 compares the flow structure on the inlet elbow cross-section of the three selected operating points. The inducer asymmetry does not seem to have a significant effect on the inlet flow structure at BEP. However, the effect of asymmetry at NSP and ESP is clearly visible because of the decrease in mass flow. At these points, the downstream pressure gradient increase leads to make a reserved flow at the impeller tip. In addition, the change in pressure from the small to the large radius sides due to the asymmetry of the elbow combined with the reserved flow creates vortex regions with different sizes on both sides of the inducer. The size of the vortex increases as the flow decreases. It can develop about 50% of the area of a large radius at ESP. The asymmetry inlet causes the surge to appear earlier by increasing the incidence angle.
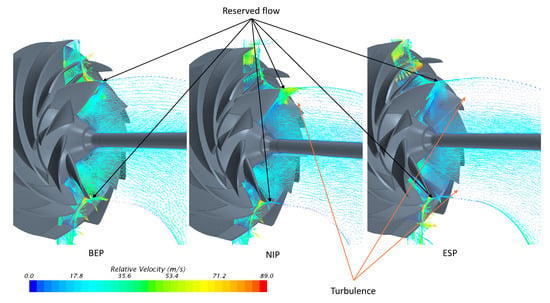
Figure 11.
Inlet flow structure of three operating points.
4.2. Unsteady State Simulation
One of the disadvantages of steady-state simulation is that the flow field does not take into account the relative position of two impellers. This disadvantage can be partially overcome by performing the sliding mesh unsteady state simulation. This method allows the adjacent cells to slide relative to another one. The sliding interface is updated every time step and the cells do not have a correspondent on the other side of the interface, but the connectivity changes every time. In this section, the unsteady-state simulation is per-formed to study the change in fluid flow structure inside the compressor when the relative position of blade rows changes. This allows to observe the simulation results more closely than reality.
Figure 12, Figure 13 and Figure 14 show the velocity streamlines snapshots of the compressor over 80-time steps. An interval of 10-time steps has been used for these snapshots. The homogeneous flow pattern can be observed within two impellers at BEP. In addition, the blade row positions change seem does not affect the flow structure. These reasons explain the compressor work with the highest performance (Figure 12). However, it notably influences the simulation results at NSP and ESP. The two impellers rotate in opposite directions at the speed of = −6420 rpm and = 10,920 rpm at NSP. The flow structure within the blade passage is clearly visible due to the change of blade rows. The vortex size decrease over each time steps. The marked vortex, for example, appears in the blade passage as shown in Figure 13 and Figure 14. These vortex size shrink gradually over time steps and disappears after 60-time steps. The simulation results over one second show the repetition of the vortex regions over time. This phenomenon represents the limit of the compressor stability at these speeds.
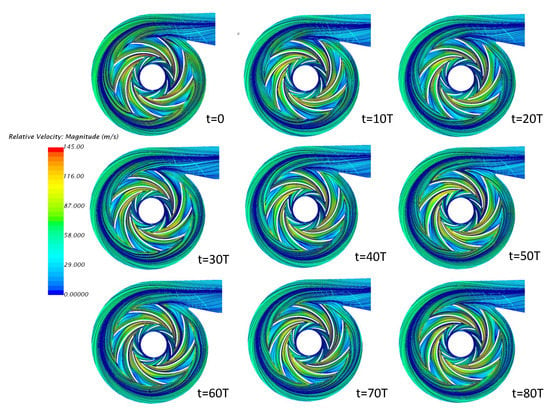
Figure 12.
Streamline patterns of different time-step at BEP.
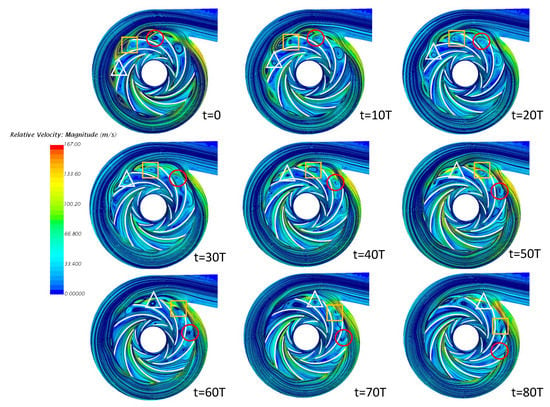
Figure 13.
Streamline patterns of different time-step at NSP.
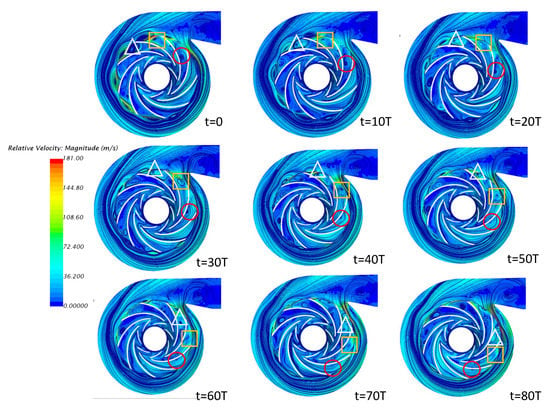
Figure 14.
Streamline patterns of different time-step at ESP.
It can be noted that twin-impeller compressors can operate at a very lower flow rate in co-rotating mode but still maintain a good compression ratio. The streamline structure inside the compressor at ESP has been shown in Figure 14. The rotational speed of the two impellers respectively = 6240 rpm and = 12,000 rpm. The change in the size of the vortex can be clearly observed with relative position as the blade rows change. These vortexes eternally exist within the blade passages because the flow rate is very low. However, some blade passages present a flow pattern quite uniform. This shows that the fluid flow still circulates normally through these blade passages to maintain compressor stability.
Beside that, the difference of blade number as well as the change of rotation speed of each impeller leads to a variation in blade pitch between adjacent blade rows. The pressure signal is taken by a pressure probe located between the trailing edge of the upstream impeller and the leading edge of the downstream impeller. The Fast Fourier Transform (FFT) is applied to pressure signals to observe Blade Passing Frequency (BPF). The pressure signal and FFT transform of the CFD simulation in one rotation are shown in Figure 15. It can be clearly seen that there are seven pressure positions drop on the pressure signal due to the passing of seven trailing edges of the upstream impeller. The first strong peak frequency shows exactly the frequency value of Hz, which is generated by the periodicity of subsequent passing of the leading edge of the downstream impeller. Besides that, the frequency value Hz is also observed. In addition, the second harmonic frequency of the upstream impeller BPF is also monitored. The peak frequency fd in the figure is an accumulated frequency of both impeller frequencies Hz is found in this analysis.
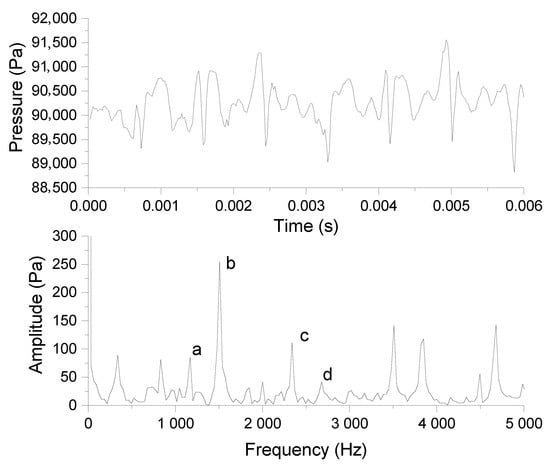
Figure 15.
The pressure signal and its FFT to observe the BPF.
5. Conclusions
Experimental results of Twin-Impeller Centrifugal Compressor show the interesting results in instability region when varying the speed of each impeller independently. The surge phenomenon of this compressor can be greatly improved by active control method. This method allows to improve surge margin by about 22% compared to conventional compressors. The CFD simulation has been conducted to further explain the fluid flow characteristics inside compressor. Three special points have been chosen to analysis the flow structure inside the compressor: BEP, NSP and ESP. The results indicate that:
- The steady simulation shows the compressor works with the highest performance because the flow pattern, the pressure distribution within the impellers as well as in the volute are homogeneous at BEP. Nevertheless, the vortex regions can be observed near the volute tongue of the downstream blade passages at NSP. It decreases in size in the adjacent blade passage towards the opposite rotational direction of the impeller. The blade passages are partly or completely blocked by these vortexes, and the local high-pressure regions are generated on the blade surface. The same phenomenon can be seen at ESP, but the number of vortex regions increased significantly in the blade passages. The blade passages are almost blocked by these vortexes except for some passages where the flow pattern is quite uniform. This allows the compressor avoiding the surge state. The increase of the local entropy causing an increase in blade passage losses due to these vortex decrease significantly the compressor efficiency.
- The unsteady simulation illustrates that the blade row position does not affect the flow pattern at BEP but it greatly influences at NSP and ESP. The decrease in size of the vortexes depends on the relative position of the blade row can be observed at NSP. In addition, these vortexes always exist in the blade passages at ESP. This point is the extended surge point whereas the compressor stably operates thanks to the co-rotating effect.
Author Contributions
Conceptualization, V.T.N. and F.B.; methodology, V.T.N., F.B., S.K.; software, M.S., M.D.; validation, V.T.N., F.R. and A.D.; formal analysis, V.T.N.; writing—original draft preparation, V.T.N., A.D. and F.B.; writing—review and editing, V.T.N., M.D. and F.B.; visualization, V.T.N. and M.S.; supervision, F.B. and S.K. All authors have read and agreed to the published version of the manuscript.
Funding
This research received no external funding.
Data Availability Statement
Data sharing is not applicable to this article.
Acknowledgments
The authors would like to thank LIFSE laboratory, the Vietnam governments with all support for this study. Special thanks to Sebastien PORCHERON, lab’s engineer, for helping us assemble the test bench.
Conflicts of Interest
The authors declare no conflict of interest.
Abbreviations
The following abbreviations are used in this manuscript:
| TICC | Twin Impeller Centrifugal Compressor |
| SICC | Single Impeller Centrifugal Compressor |
| BEP | Best Efficiency Point |
| NSP | Near Surge Point |
| ESP | Extended Surge Point |
| BPF | Blade Passing Frequency |
References
- Botros, K.K.; Henderson, J.F. Developments in centrifugal compressor surge Control-A technology assess-ment. J. Turbomach. 1994, 116, 240–249. [Google Scholar] [CrossRef]
- Dukle, N.; Narayanan, K. Validating anti-surge control systems. PTQ Mag. 2003, 8, 87, 89–92, 94. [Google Scholar]
- Willems, F.P.T. Modelling and Bounded Feedback Stabilization of Centrifugal Compressor Surge. Ph.D. Thesis, Technische Universiteit Eindhoven, Eindhoven, The Netherlands, 2000. [Google Scholar] [CrossRef]
- Day, I.J. Active suppression of rotating stall and surge in axial compressors. J. Turbomach. 1993, 115, 40–47. [Google Scholar] [CrossRef]
- Stein, A.; Niazi, S.; Sankar, L.N. Computational Analysis of Stall and Separation Control in Centrifugal Compres-sors. J. Propuls. Power 2000, 16, 65–71. [Google Scholar] [CrossRef]
- Koyyalamudi, V.V.N.K.; Nagpurwala, Q.H. Stall margin improvement in a centrifugal compressor through inducer casing treatment. Int. J. Rotating Mach. 2016. [Google Scholar] [CrossRef] [Green Version]
- Eynon, P.A.; Whitfield, J.L.; Firth, M.R.; Perkes, A.J.; Sexton, R. A study of the flow characteristics in the inducer bleed slot of a centrifugal compressor. In Proceedings of the ASME 1996 International Gas Turbine and Aeroengine Congress and Exhibition, Birmingham, UK, 10–13 June 1996. [Google Scholar] [CrossRef] [Green Version]
- Nikpour, B. Turbocharger compressor flow range improvement for future heavy duty diesel engines. In Proceedings of the Conference on Thermo and Fluid Dynamics Processes in Diesel Engines, Valencia, Spain, 7–10 September 2004; pp. 125–143. [Google Scholar]
- Cravero, C.; Marsano, D. Criteria for the stability limit prediction of high-speed centrifugal compressors with vaneless diffuser. Part I: Flow structure analysis. In Proceedings of the ASME Turbo Expo 2020: Turbomachinery Technical Conference and Exposition, Virtual Conference. 21–25 September 2020. ASME Paper GT2020-14579. [Google Scholar]
- Cravero, C.; Marsano, D. Criteria for the stability limit prediction of high-speed centrifugal compressors with vaneless diffuser. Part II: The development of prediction criteria. In Proceedings of the ASME Turbo Expo 2020: Turbomachinery Technical Conference and Exposition, Virtual Conference. 21–25 September 2020. ASME Paper GT2020-14589. [Google Scholar]
- Nguyen, V.T.; Danlos, A.; Paridaens, R.; Ravelet, F.; Deligant, M.; Khelladi, S.; Bakir, F. Experimental study of a centrifugal compressor with two successive and counter-rotating impellers. J. Phys. Conf. Ser. 2021, 1909, 012023. [Google Scholar] [CrossRef]
- Nguyen, V.; Abed, C.B.; Danlos, A.; Ravelet, F.; Paridaens, R.; Deligant, M.; Khelladi, S.; Bakir, F. Experimental Study of a Novel Centrifugal Compressor with Two Successive and Independent Rotors. ASME J. Eng. Gas Turbines Power 2021, 144, 011005. [Google Scholar] [CrossRef]
- Nguyen, V.T.; Danlos, A.; Ravelet, F.; Deligant, M.; Solis, M.; Khelladi, S.; Bakir, F. CFD Analysis to explain the Operating range extension observed during Operation in Co-rotating Mode of a Twin-impeller Centrifugal Compressor. In Proceedings of the XIII International Conference on Computational Heat, Mass and Momentum Transfer (ICCHMT 2021), Virtual Conference. 18–19 May 2021; Volume 321. [Google Scholar] [CrossRef]
- Broatch, A.; Galindo, J.; Navarro, R.; García-Tíscar, J.; Daglish, A.; Sharma, R.K. Simulations and measurements of automotive turbocharger compressor whoosh noise. Eng. Appl. Comput. Fluid Mech. 2015, 9, 12–20. [Google Scholar] [CrossRef] [Green Version]
- Galindo, J.; Hoyas, S.; Fajardo, P.; Navarro, R. Set-up analysis and optimization of CFD simulation for radial tur-bines. Eng. Appl. Comput. Fluid Mech. 2013, 7, 441–460. [Google Scholar]
- Bardina, J.E.; Huang, P.G.; Coakley, T.J. Turbulence Modeling Validation, Testing, and Development; NASA Technical Memorandum 110446; Ames Research Center: Moffett Field, CA, USA, 1997; pp. 8–20. [Google Scholar] [CrossRef]
- Eckardt, D. Instantaneous Measurements in the Jet-Wake Discharge Flow of a Centrifugal Compressor Impeller. J. Eng. Power 1975, 97, 337–345. [Google Scholar] [CrossRef]
Publisher’s Note: MDPI stays neutral with regard to jurisdictional claims in published maps and institutional affiliations. |
© 2021 by the authors. Licensee MDPI, Basel, Switzerland. This article is an open access article distributed under the terms and conditions of the Creative Commons Attribution (CC BY) license (https://creativecommons.org/licenses/by/4.0/).