
Numerical Study on the Thermal Field and Heat Transfer Characteristics of a Hexagonal-Close-Packed Pebble Bed

Abstract
:1. Introduction
2. Numerical Methods
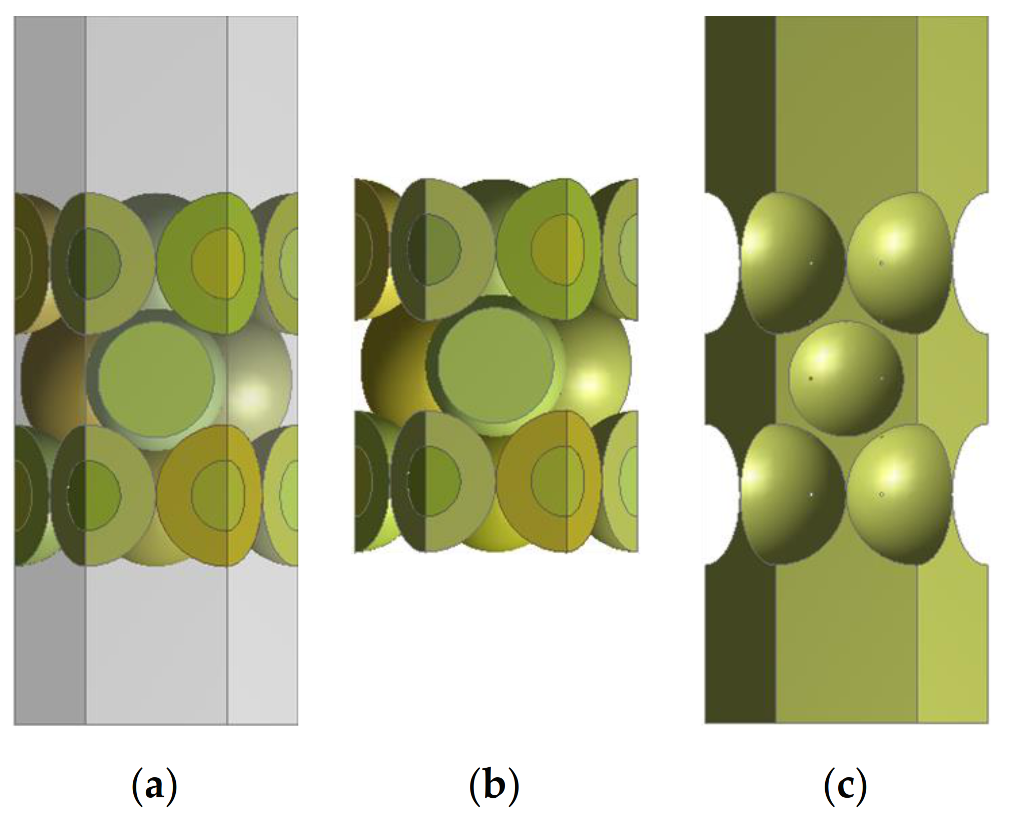
2.1. Geometry
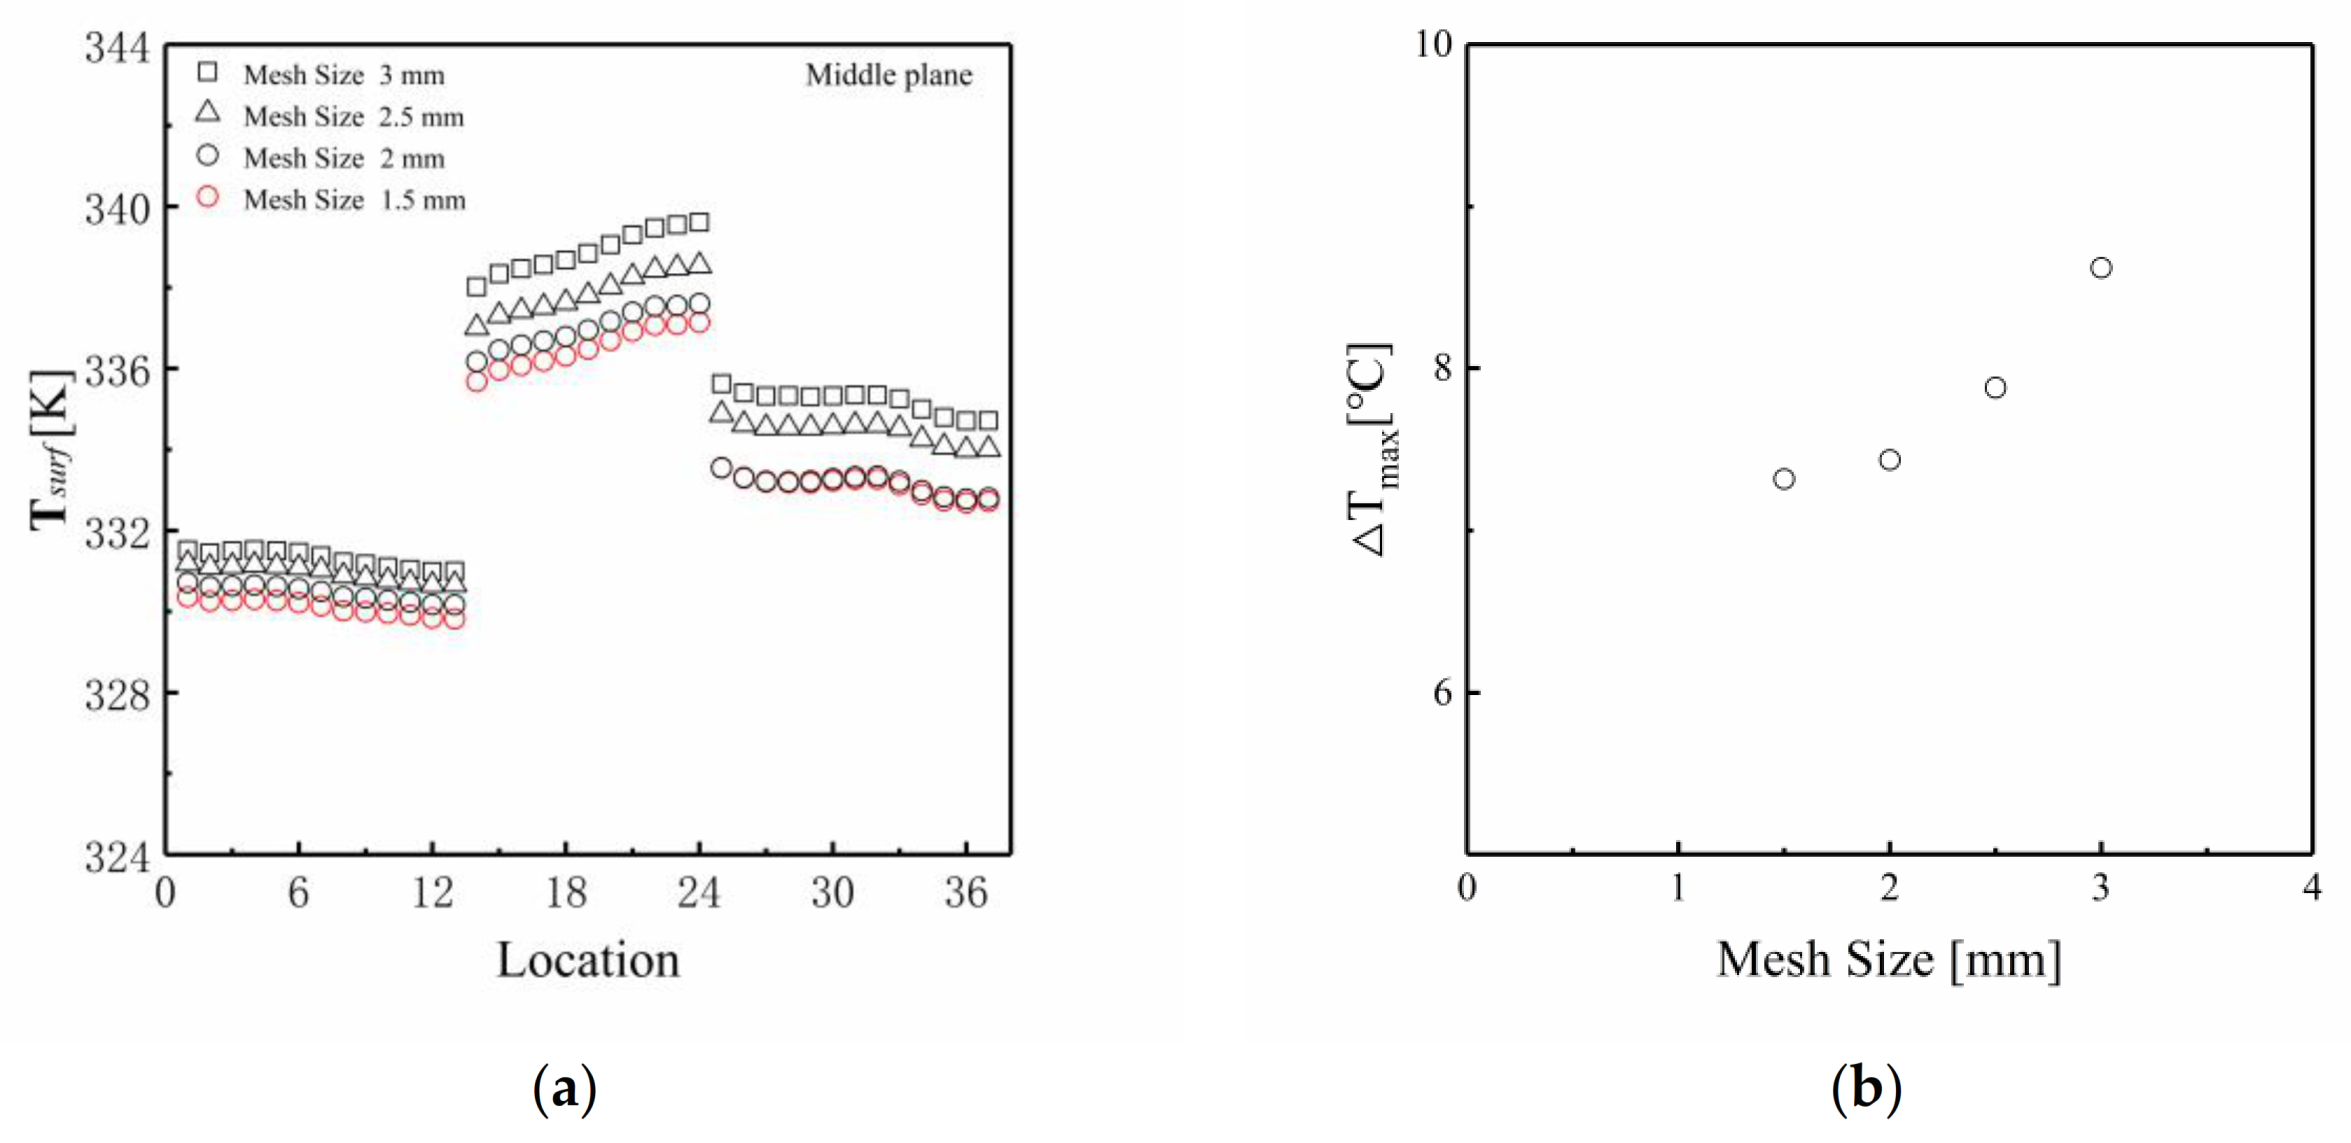
2.2. Meshing
2.3. Governing Equations and Boundary Conditions
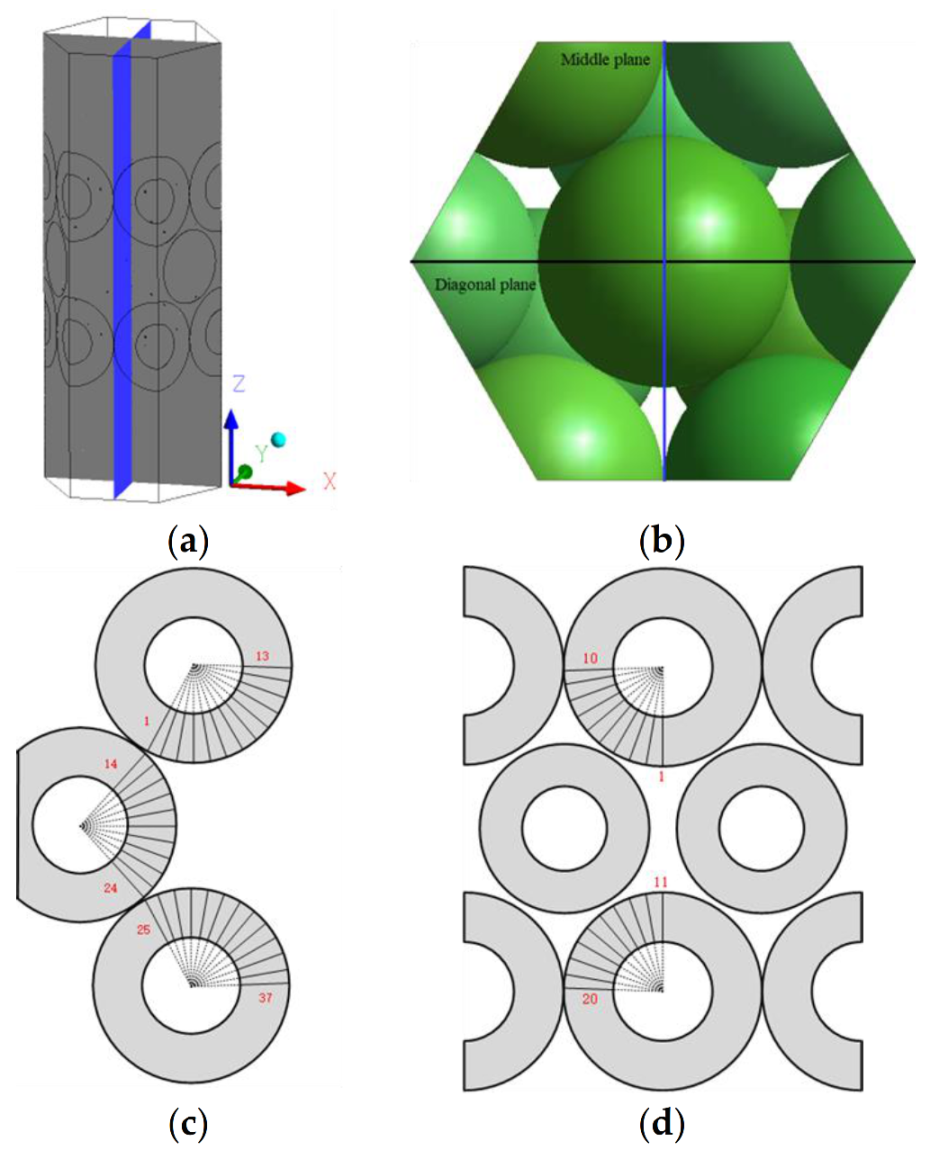
2.4. Solver Settings and Measurement Locations
3. Modeling and Analysis
3.1. Thermal Field and Flow Field
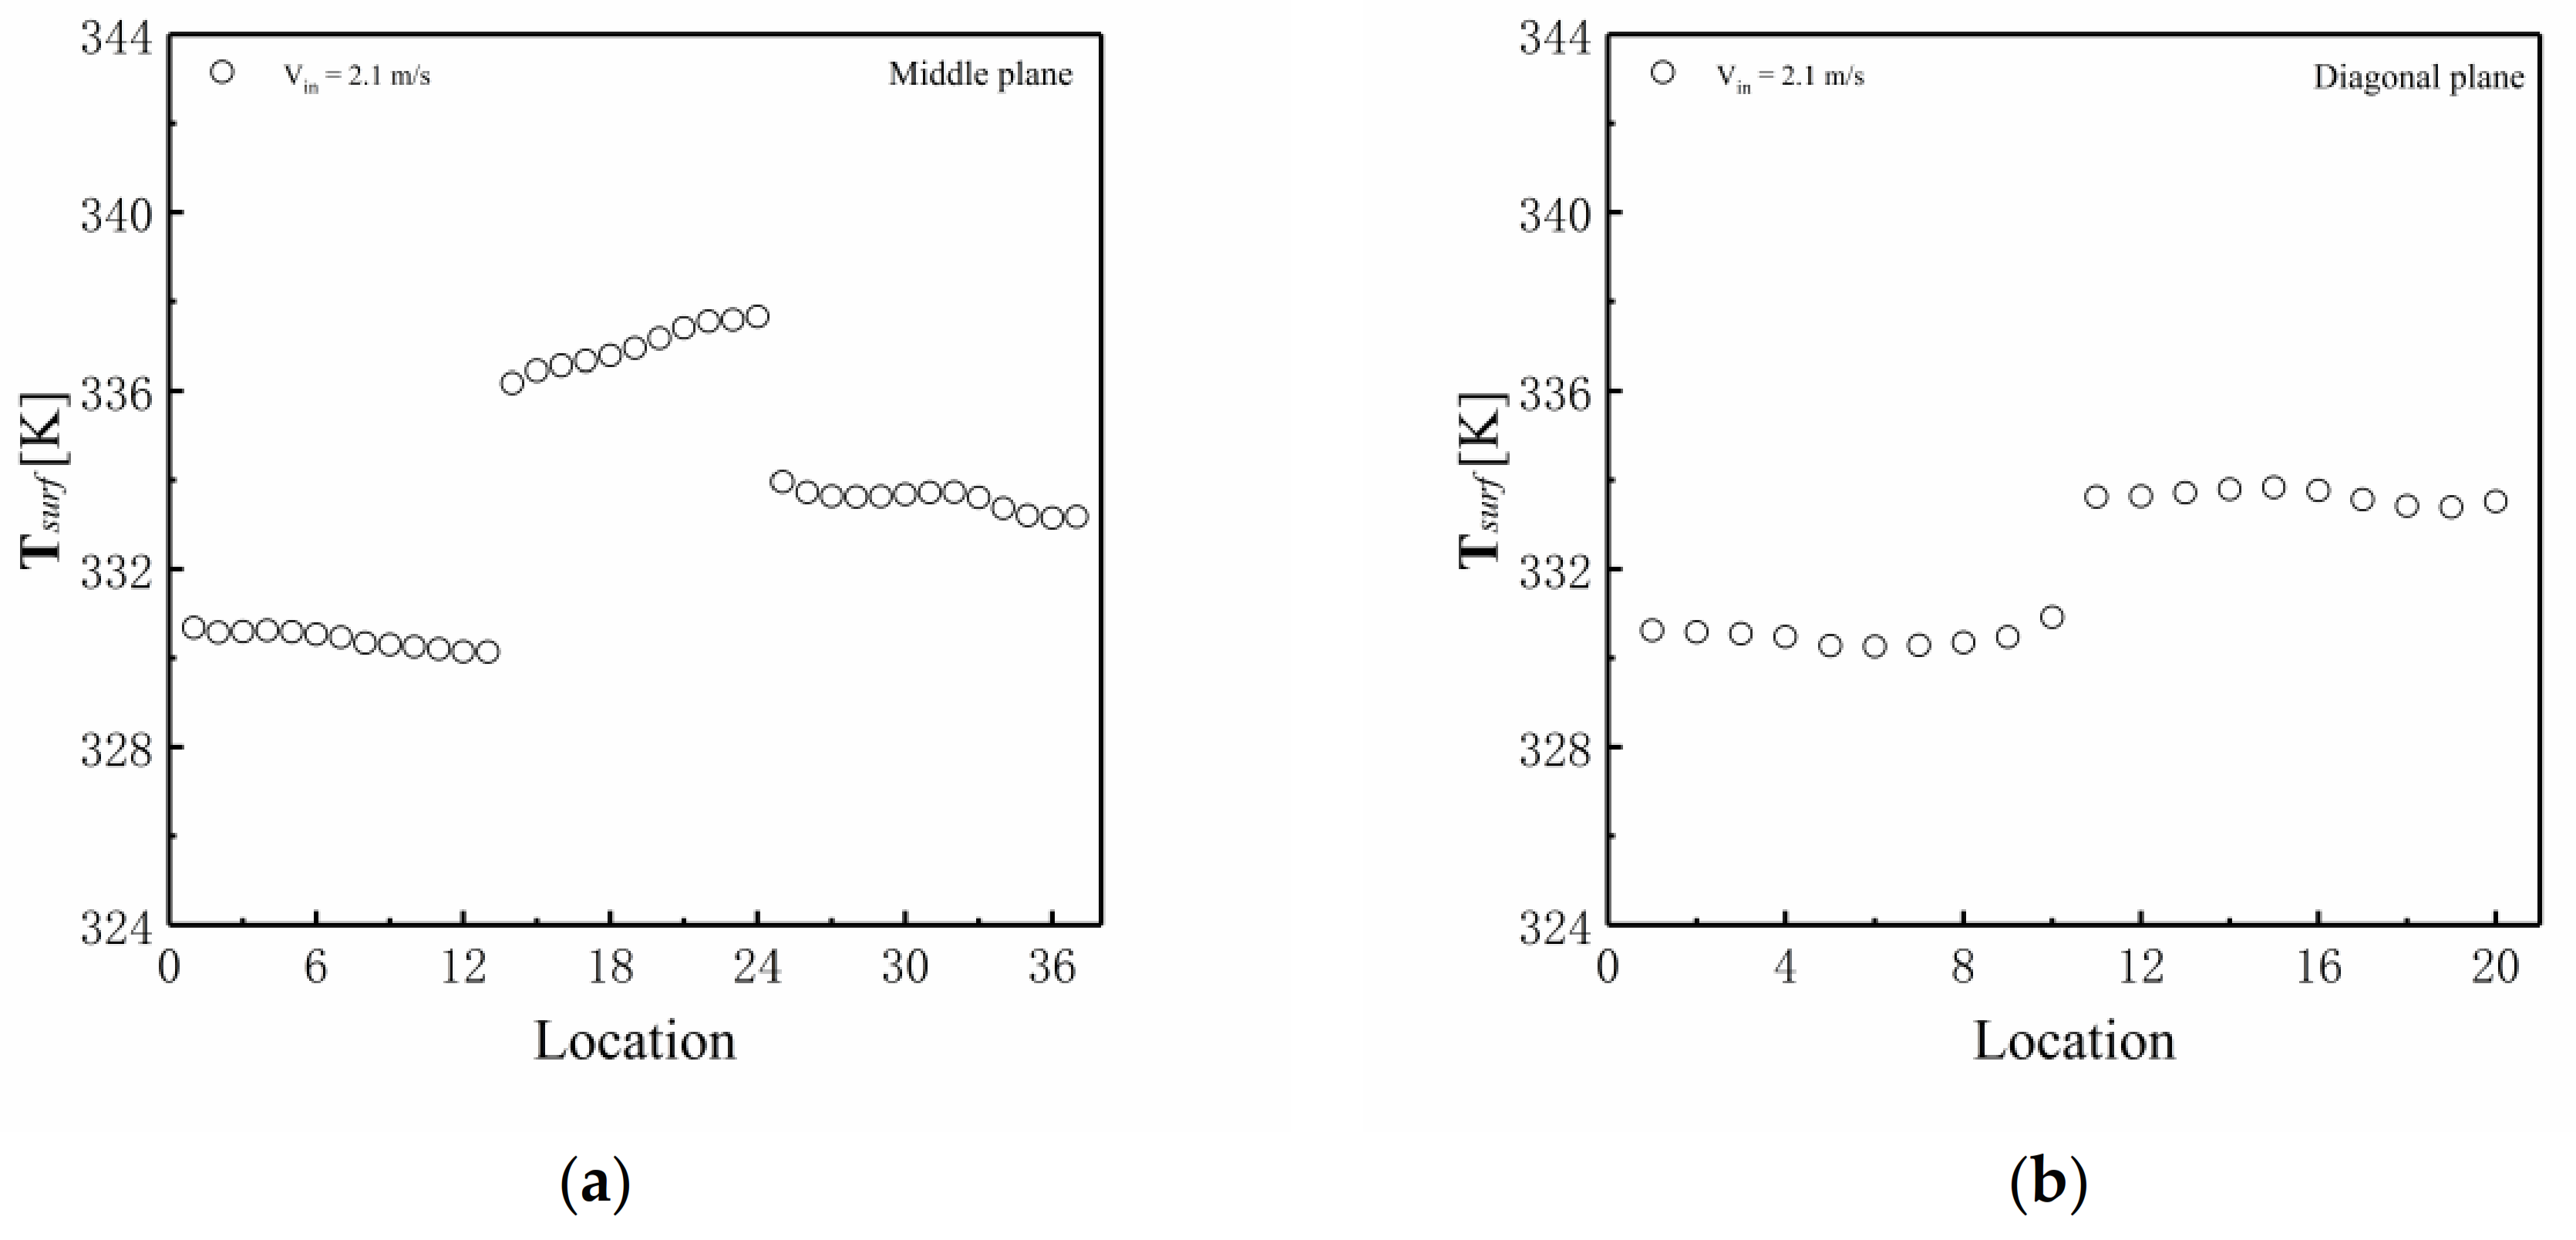
3.2. Pebble Surface Temperature
3.3. Local Heat Transfer Coefficient
3.4. Heat Transfer Characteristics
4. Conclusions
- The strongest heat transfer was found near the right vertices (positions 13 and 37) of the top and bottom pebbles.
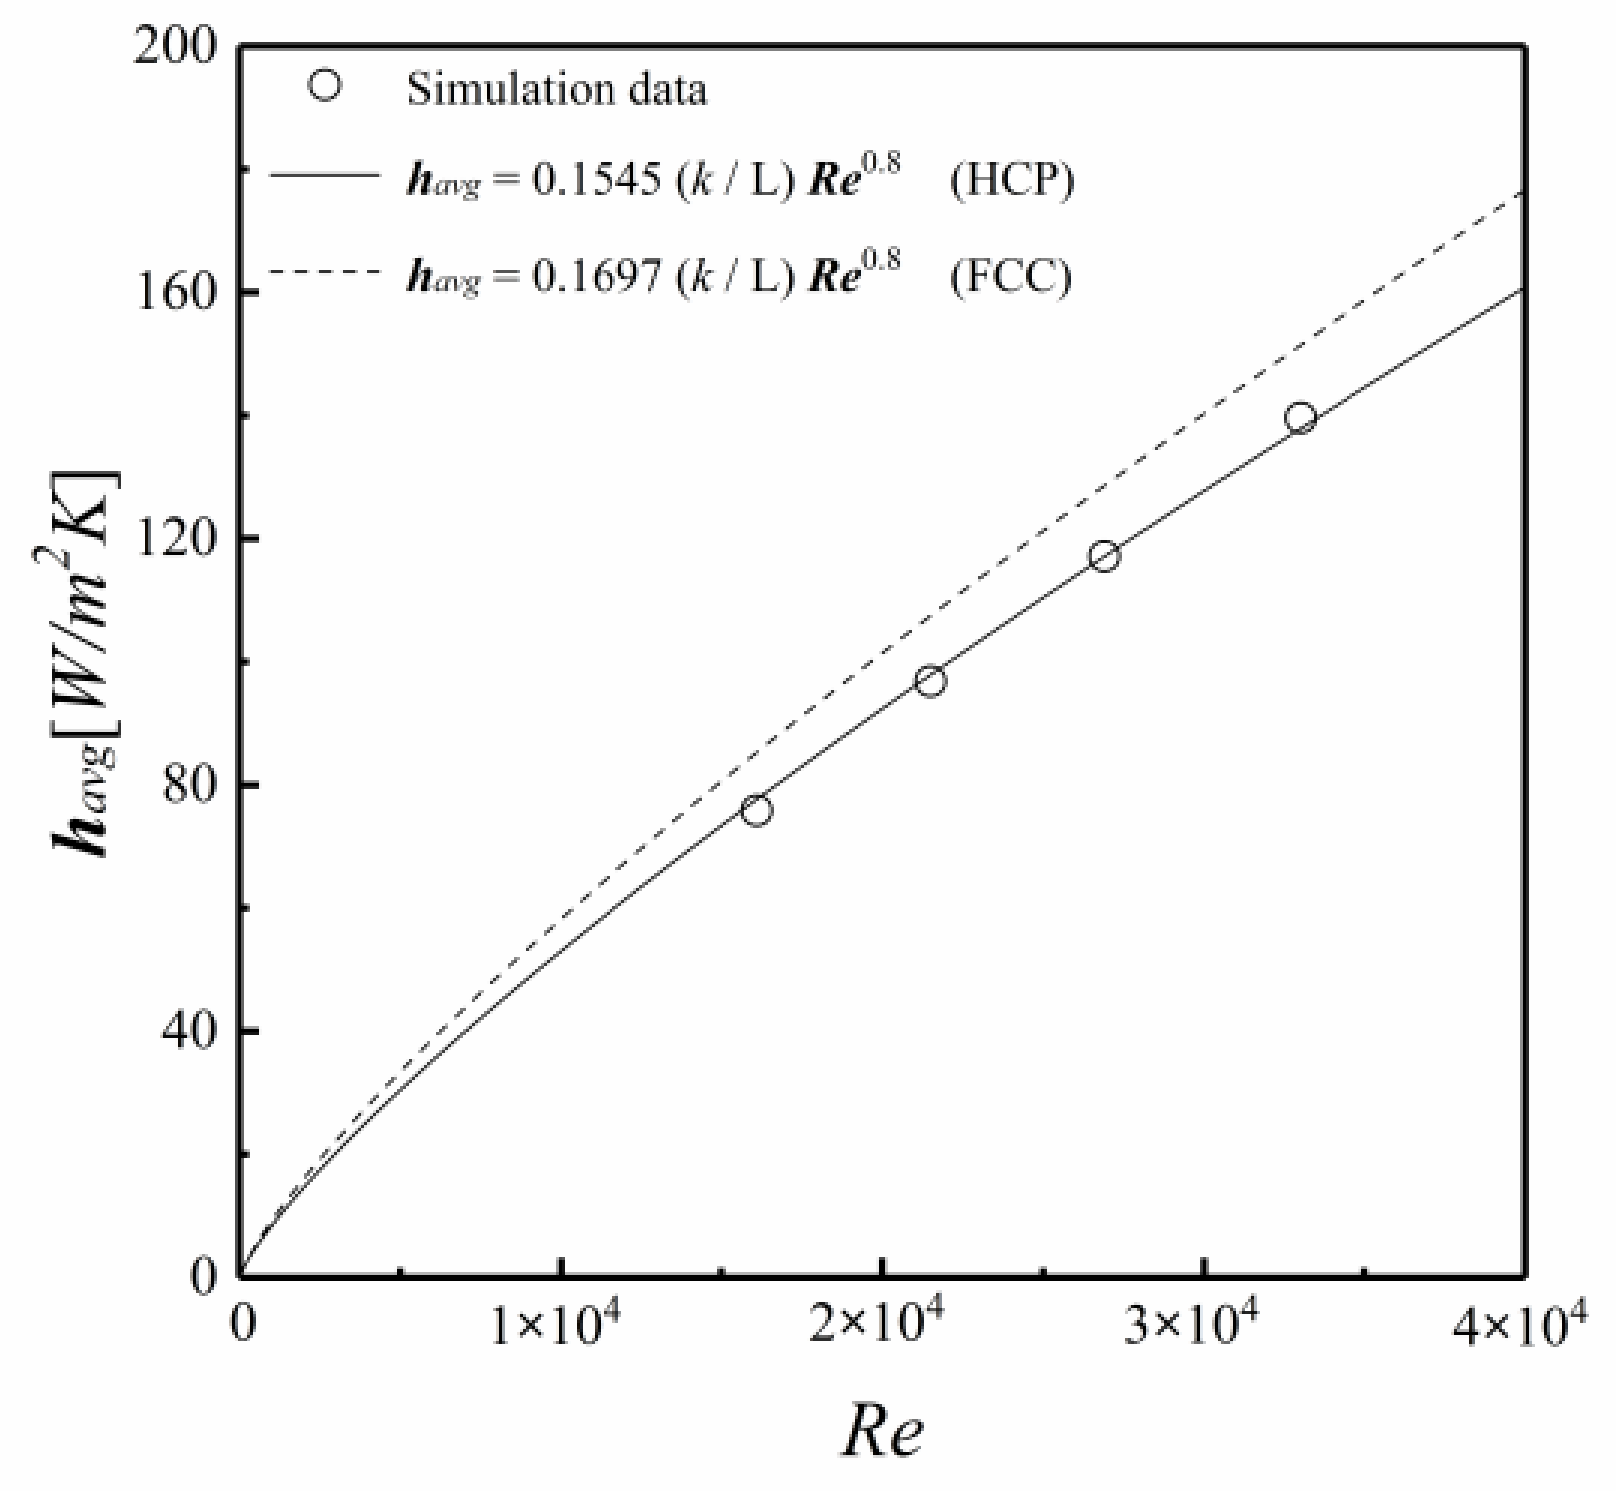
- The correlations of average HTC and Nusselt number were respectively proposed as havg = 0.1545(k/L)Re0.8 and Nu = 0.177Re0.8Pr0.4 (Pr = 0.712, 1.6 × 10⁴ ≤ Re ≤ 4 × 10⁴).
- The average HTCs of the FCC-structured pebble bed were found to be higher than that of the HCP-structured pebble bed.
Author Contributions
Funding
Data Availability Statement
Conflicts of Interest
Nomenclature
| Symbols | Descriptions |
| Cμ | Constant |
| Cp | Heat capacity (J/Kg/°C) |
| D | Characteristic length of the pebble in the reactor core (m) |
| h | Heat transfer coefficient (W/m2K) |
| k | Thermal conductivity (W/m/K) |
| L | Characteristic length of the pebble in the test section (m) |
| p′ | Modified pressure (Pa) |
| r1, r2 | Distance of thermocouple 1 and 2 from the pebble center (m) |
| SE | Heat energy generated by external heat sources |
| SM | Sum of body force |
| T∞ | Temperature of the coolant (K) |
| U | Velocity (m/s) |
| Δ | Difference |
| ε | Turbulence dissipation rate |
| μ | Viscosity (Pas) |
| ρ | Density (Kg/m3) |
| ∇ | Gradient |
| Abbreviations | Descriptions |
| avg | Average |
| BCC | Body-centered cubic |
| CFD | Computational fluid dynamics method |
| DES | Detached-eddy simulation |
| DNS | Direct numerical simulation |
| ETC | Effective transfer coefficient |
| FCC | Face-centered cubic |
| FHR | Fluoride-salt-cooled high-temperature reactor |
| HCP | Hexagonal close-packed |
| HTC | Heat transfer coefficient |
| HTGR | High-temperature gas-cooled reactor |
| LES | Large-eddy simulation |
| PBWR | Pebble-bed water cooled reactor |
| PTV | Particle tracking velocity |
| q-DNS | quasi-direct numerical simulation |
| RANS | Reynolds-averaged Navier–Stokes |
| SC | Simple cubic |
| Surf | Surface |
References
- Zhang, Z.; Dong, Y.; Li, F.; Zhang, Z.; Wang, H.; Huang, X.; Li, H.; Liu, B.; Wu, X.; Wang, H.; et al. The Shandong Shidao Bay 200 MW e High-Temperature Gas-Cooled Reactor Pebble-Bed Module (HTR-PM) Demonstration Power Plant: An Engineering and Technological Innovation. Engineering 2016, 2, 112–118. [Google Scholar] [CrossRef] [Green Version]
- Chen, L.; Lee, J. Experimental analysis of the thermal field and heat transfer characteristics of a pebble-bed core in a high-temperature gas-cooled reactor. Ann. Nucl. Energy 2017, 110, 338–348. [Google Scholar] [CrossRef]
- Moormann, R. A Safety re-evaluation of the AVR pebble bed reactor operation and its consequences for future HTR concepts. In Proceedings of the Fourth International Topical Meeting on High Temperature Reactor Technology, Washington, DC, USA, 28 September–1 October 2008; pp. 265–274. [Google Scholar]
- Moormann, R.; Kemp, R.S.; Li, J. Caution is needed in operating and managing the waste of new pebble-bed nuclear reactors. Joule 2018, 2, 1911–1914. [Google Scholar] [CrossRef] [Green Version]
- Cheng, G.; Gan, J.; Xu, D.; Yu, A. Evaluation of effective thermal conductivity in random packed bed: Heat transfer through fluid voids and effect of packing structure. Powder Technol. 2020, 361, 326–336. [Google Scholar] [CrossRef]
- Ren, H.; Liu, Y. Experimental investigation of fluid flow and heat transfer characteristics of a longitudinal corrugated liner for a combustion chamber. Appl. Therm. Eng. 2016, 108, 1066–1075. [Google Scholar] [CrossRef]
- Zhu, Q.; Xuan, Y. Pore scale numerical simulation of heat transfer and flow in porous volumetric solar receivers. Appl. Therm. Eng. 2017, 120, 150–159. [Google Scholar] [CrossRef]
- Chen, L.; Lee, J. Effect of pebble diameters on the heat transfer characteristics of a structured pebble bed in an HTGR. Energy 2020, 212, 118642. [Google Scholar] [CrossRef]
- Latifi, M.S.; Colangelo, G.; Starace, G. A CFD study on the effect of size of fuel sphere on PBR core. Exp. Comput. Multiph. Flow 2019, 2, 109–114. [Google Scholar] [CrossRef] [Green Version]
- Wu, Z.; Wu, Y.; Wang, C.; Tang, S.; Liu, D.; Qiu, S.; Su, G.; Tian, W. Experimental and numerical study on helium flow characteristics in randomly packed pebble bed. Ann. Nucl. Energy 2019, 128, 268–277. [Google Scholar] [CrossRef]
- Shams, A.; Roelofs, F.; Komen, E.; Baglietto, E. Optimization of a pebble bed configuration for quasi-direct numerical simulation. Nucl. Eng. Des. 2012, 242, 331–340. [Google Scholar] [CrossRef]
- Wu, C.; Ferng, Y.; Chieng, C.; Liu, C. Investigating the advantages and disadvantages of realistic approach and porous approach for closely packed pebbles in CFD simulation. Nucl. Eng. Des. 2010, 240, 1151–1159. [Google Scholar] [CrossRef]
- Bu, S.; Yang, J.; Dong, Q.; Wang, Q. Experimental study of flow transitions in structured packed beds of spheres with electrochemical technique. Exp. Therm. Fluid Sci. 2015, 60, 106–114. [Google Scholar] [CrossRef]
- Kim, M.-H.; Lim, H.-S.; Lee, W.J. Computational Fluid Dynamics Assessment of the Local Hot Core Temperature in a Pebble-Bed Type Very High Temperature Reactor. J. Eng. Gas Turbines Power 2009, 131, 012905. [Google Scholar] [CrossRef]
- Li, L.; Yan, X.; Yang, J.; Wang, Q. Numerical investigation on band-broadening characteristics of an ordered packed bed with novel particles. Appl. Energy 2017, 185, 2168–2180. [Google Scholar] [CrossRef]
- Lee, J.-J.; Park, G.-C.; Kim, K.-Y.; Lee, W.-J. Numerical treatment of pebble contact in the flow and heat transfer analysis of a pebble bed reactor core. Nucl. Eng. Des. 2007, 237, 2183–2196. [Google Scholar] [CrossRef]
- Ahmadi, S.; Sefidvash, F. Study of pressure drop in fixed bed reactor using a computational fluid dynamics (CFD) code. ChemEngineering 2018, 2, 14. [Google Scholar] [CrossRef] [Green Version]
- Li, H.; Qiu, S.; Zhang, Y.; Su, G.; Tian, W. Thermal hydraulic investigations with different fuel diameters of pebble bed water cooled reactor in CFD simulation. Ann. Nucl. Energy 2012, 42, 135–147. [Google Scholar] [CrossRef]
- Hassan, Y.A. Large eddy simulation in pebble bed gas cooled core reactors. Nucl. Eng. Des. 2008, 238, 530–537. [Google Scholar] [CrossRef] [Green Version]
- Yildiz, M.A.; Botha, G.; Yuan, H.; Merzari, E.; Kurwitz, R.C.; Hassan, Y.A. Direct numerical simulation of the flow through a randomly packed pebble bed. J. Fluids Eng. 2020, 142, 041405. [Google Scholar] [CrossRef]
- Fick, L.H.; Merzari, E.; Hassan, Y.A. Direct numerical simulation of pebble bed flows: Database development and investigation of low-frequency temporal instabilities. J. Fluids Eng. 2017, 139, 051301. [Google Scholar] [CrossRef]
- Shams, A.; Roelofs, F.; Komen, E.; Baglietto, E. Numerical simulation of nuclear pebble bed configurations. Nucl. Eng. Des. 2015, 290, 51–64. [Google Scholar] [CrossRef]
- Atmakidis, T.; Kenig, E.Y. CFD-based analysis of the wall effect on the pressure drop in packed beds with moderate tube/particle diameter ratios in the laminar flow regime. Chem. Eng. J. 2009, 155, 404–410. [Google Scholar] [CrossRef]
- Dasgupta, S.; Atta, A. Analysis of single phase newtonian and non-newtonian velocity distribution in periodic packed beds. Chem. Eng. J. 2017, 324, 182–193. [Google Scholar] [CrossRef]
- Jia, X.; Gui, N.; Yang, X.; Tu, J.; Jia, H.; Jiang, S. Experimental study of flow field characteristics on bed configurations in the pebble bed reactor. Ann. Nucl. Energy 2017, 102, 1–10. [Google Scholar] [CrossRef]
- Chen, L.; Lee, W.; Lee, J. Analysis of the thermal field and heat transfer characteristics of pebble beds packed in a face-centered cubic structure. Appl. Therm. Eng. 2017, 121, 473–483. [Google Scholar] [CrossRef]
- Bu, S.; Li, Z.; Ma, Z.; Sun, W.; Zhang, L.; Chen, D. Numerical study of natural convection effects on effective thermal conductivity in a pebble bed. Ann. Nucl. Energy 2020, 144, 107524. [Google Scholar] [CrossRef]
- Hu, Y.; Yang, J.; Wang, J.; Wang, Q. Investigation of hydrodynamic and heat transfer performances in grille-sphere composite pebble beds with DEM-CFD-Taguchi method. Energy 2018, 155, 909–920. [Google Scholar] [CrossRef]
- Wang, J.; Yang, J.; Cheng, Z.; Liu, Y.; Chen, Y.; Wang, Q. Experimental and numerical study on pressure drop and heat transfer performance of grille-sphere composite structured packed bed. Appl. Energy 2018, 227, 719–730. [Google Scholar] [CrossRef]
- Ferng, Y.M.; Lin, K.-Y. Investigating effects of BCC and FCC arrangements on flow and heat transfer characteristics in pebbles through CFD methodology. Nucl. Eng. Des. 2013, 258, 66–75. [Google Scholar] [CrossRef]
- Song, S.; Cai, X.; Liu, Y.; Wei, Q.; Guo, W. Pore scale thermal hydraulics investigations of molten salt cooled pebble bed high temperature reactor with BCC and FCC configurations. Sci. Technol. Nucl. Install. 2014, 2014, 1–16. [Google Scholar] [CrossRef]
- Dave, A.; Sun, K.; Hu, L. Numerical simulations of molten salt pebble-bed lattices. Ann. Nucl. Energy 2018, 112, 400–410. [Google Scholar] [CrossRef]
- Chen, L.; Lee, J. Effects of inserted sphere on thermal field and heat-transfer characteristics of face-centered-cubic-structured pebble bed. Appl. Therm. Eng. 2020, 172, 115151. [Google Scholar] [CrossRef]
- Bergman, T.; Lavine, A. Fundamentals of Heat and Mass Transfer, 8th ed.; Wiley: Hoboken, NJ, USA, 2011. [Google Scholar]
- Chen, Y.; Kim, S. Computation of Turbulent Flows Using an Extended k-Epsilon Turbulence Closure Model; Interim Report Universities Space Research Association: Columbia, MD, USA, 1987; p. 11969. [Google Scholar]
- KTA3102.2 Reactor Core Design of High-Temperature Gas-Cooled Reactors Part 2: Heat Transfer in Spherical Fuel Elements. 1983. Available online: http://www.kta-gs.de/e/standards/3100/3102_2_engl_1983_06.pdf (accessed on 3 November 2021).
- Yang, G.; Yang, J.; Xu, A. Simulation of convective heat transfer in a packed bed with hexagonal close-packed particles. J. Wuhan Univ. Sci. Technol. 2019, 42, 314–320. [Google Scholar] [CrossRef]


| Properties | Air (0.1 MPa, 298.15 K) | Brass [34] |
|---|---|---|
| Density (ρ) [kg/m3] | 1.1855 | 8700 |
| Viscosity (μ) [Pas] | 1.846 × 10⁻⁵ | - |
| Heat capacity (Cp) [J/kg/K] | 1000 | 380 |
| Thermal conductivity (k) [W/m/K] | 0.02605 | 109 |
| Characteristic (L) [m] | - | 0.12 |
| Mesh Size [m] | Grid Number | Mesh Number | ∆T among Pebbles [K] | ∆T among Cases [K] |
|---|---|---|---|---|
| 1.5 × 10⁻³ | 10,595,737 | 53,059,477 | 7.3 | - |
| 2 × 10⁻³ | 4,625,779 | 22,107,175 | 7.4 | 0.5 |
| 2.5 × 10⁻³ | 2,442,427 | 11,241,689 | 7.9 | 1.4 |
| 3 × 10⁻³ | 1,473,143 | 6,506,388 | 8.7 | 2.5 |
Publisher’s Note: MDPI stays neutral with regard to jurisdictional claims in published maps and institutional affiliations. |
© 2022 by the authors. Licensee MDPI, Basel, Switzerland. This article is an open access article distributed under the terms and conditions of the Creative Commons Attribution (CC BY) license (https://creativecommons.org/licenses/by/4.0/).
Share and Cite
Chen, L.; Zhao, J.; Yuan, Y.; Lee, J. Numerical Study on the Thermal Field and Heat Transfer Characteristics of a Hexagonal-Close-Packed Pebble Bed. Computation 2022, 10, 1. https://doi.org/10.3390/computation10010001
Chen L, Zhao J, Yuan Y, Lee J. Numerical Study on the Thermal Field and Heat Transfer Characteristics of a Hexagonal-Close-Packed Pebble Bed. Computation. 2022; 10(1):1. https://doi.org/10.3390/computation10010001
Chicago/Turabian StyleChen, Leisheng, Jiahao Zhao, Yuejin Yuan, and Jaeyoung Lee. 2022. "Numerical Study on the Thermal Field and Heat Transfer Characteristics of a Hexagonal-Close-Packed Pebble Bed" Computation 10, no. 1: 1. https://doi.org/10.3390/computation10010001
APA StyleChen, L., Zhao, J., Yuan, Y., & Lee, J. (2022). Numerical Study on the Thermal Field and Heat Transfer Characteristics of a Hexagonal-Close-Packed Pebble Bed. Computation, 10(1), 1. https://doi.org/10.3390/computation10010001