Article

Study of the Sloshing Dynamics in Partially Filled Rectangular Tanks with Submerged Baffles Using VOF and LES Turbulence Methods for Different Impact Angles

by
Xavier Vallés Rebollo
1,
Ehsan Sadeghi
2,
Ibuki Kusano
1 and
Andrés-Amador García-Granada
1,*
1
Grup d’Enginyeria en Producte Industrial (GEPI), Institut Químic de Sarrià, Universitat Ramon Llull, Via Augusta 390, 08017 Barcelona, Spain
2
Schako Iberia S.L., San Mateo de Gállego, 50840 Zaragoza, Spain
*
Author to whom correspondence should be addressed.
Computation 2022, 10(12), 225; https://doi.org/10.3390/computation10120225
Submission received: 27 October 2022 / Revised: 29 November 2022 / Accepted: 14 December 2022 / Published: 19 December 2022
(This article belongs to the Special Issue Application of Finite Element Methods)

Abstract

:
This research studies how the angle and dimensions of a single baffle affect the dynamics of a fluid in a closed rectangular tank under an accelerated harmonic vibration in resonance. A half-filled non-deformable rectangular tank with a single centered submerged baffle has been simulated using ANSYS® FLUENT. The study aims to characterize the effect of changing the baffle’s angle; hence, 10 simulations have been performed: without a baffle, 90°, 30°, 60°, 120° and 150°, either maintaining the baffle’s length or the projected height constant. The computational fluid dynamics (CFD) method using volume of fluid (VOF) and large eddy simulation (LES) are used to predict the movement of the fluid in two dimensions, which have been benchmarked against experimental data with excellent agreement. The motion is sinusoidal in the +X direction, with a frequency of oscillation equal to its first vibration mode. The parameters studied have been the free surface elevation, values at three different points and maximum; the center of gravity’s position, velocity, and acceleration; and the forces against the tank’s walls. It has been found that the 90° angle has the most significant damping effect, stabilizing the free-surface elevation, reducing the center of gravity dispersion, and leveling the impacting forces. Smaller angles also tame the sloshing and stabilize it.

1. Introduction

Sloshing can be described as a back-and-forth motion of a liquid inside a tank. Liquid sloshing in a tight container is an important phenomenon in transportation, aviation, and naval engineering. The forces acting on containing structures due to this hydrodynamic movement can cause major deformations in the tank and the supporting structures. The amplification of these loads induced by vibration near the natural frequency can lead to major roll and pitch instability, which can greatly affect the handling capabilities of the structure. To prevent structural damage and ensure the cargo’s stability, baffles are usually put in place to divide the container and dampen the forces acting on the walls.
Fuel sloshing is not a new phenomenon, but it has gained momentum in the last few years because of its relevance and the advancement of computational fluid dynamics (CFD) combined with more powerful computational capabilities. Liu and Lin [1] developed a numerical model to study 3D sloshing using volume of fluid (VOF) and large eddy simulation (LES), showing great agreement at small excitation amplitudes. Xue et al. [2] studied different shaped tanks with the same volume, arriving to the conclusion that the liquified natural gas suffered from lower impact pressure overall, and the spherical tank also helped reduce the impact pressure, leading to the understanding that a softer transition slope reduces the impact on the vertical walls. Inclined walls have not been found in the literature review.
As for baffles inside a tank, Craig and Kingsley [3] created a multidisciplinary optimization method to design partially filled containers subjected to sloshing and impact forces. Their work leads to the development of key performance indicators and an algorithm to minimize those values. Kandasamy [4] investigated the effectiveness of different baffle designs in standard tanker trucks. Through the characterization of the center of gravity momentum, they optimized the design of a baffle to counteract load transfer. Gouzdarzi et al. [5] investigated the hydrodynamic dampening capabilities of vertical and horizontal baffles, finding that the location and size significantly affect energy dissipation. Hasheminejad and Aghabeigi [6] developed a parametric analysis of a half-full non-deformable horizontal cylindrical tank of elliptical cross section with vertical baffles. They studied the relationship between geometrical parameters and the resulting natural frequencies of the liquid. Zheng et al. [7] compared several forms of a conventional, circular, and staggered baffle in a partially filled tank to investigate the size of the holes and the impact angle. Hosseini et al. [8] compared experimental results with several simulation analyses and developed a neural network that showed excellent agreement with new data. Bautista-Jacobo et al. [9] performed a comparative study of ”+” and ”X” shaped baffles, focusing on the stabilization time and the turbulent kinetic energy. Results showed comparable properties. Shreeharsha et al. [10] optimized the number of holes in baffles inside an aircraft drop tank in terms of the structural integrity of the tank when suffering a 7 g peak acceleration. Khezzar et al. [11] worked on a rectangular tank with a peak acceleration of 30 g during 40 ms leading to velocities of around 12 m/s with experiments of impacts without baffles. Demirel and Aral [12] demonstrated the best configuration for a horizontally perforated baffle with three slots in different configurations under resonance vibration. Jamalabadi et al. [13] performed a numerical investigation and an optimal design study on the position of a circular baffle to obtain the best performance design in terms of vibration suppression via dampening. Dinçer [14] simulated a fluid-structure interaction (FSI) of an elastic baffle using smoothed article hydrodynamics (SPH) for the fluid and finite element method (FEM) for the structure, coupling both analyses to understand the motion under seismic excitation. Yu et al. [15] proved that, for rectangularly slotted baffles inside a rectangular tank, the optimal number and position of the baffles to suppress sloshing depend on the sloshing mode. Guan et al. [16] compared horizontal, vertical, and T-shaped baffles in sloshing rectangular tanks under horizontal and roll excitation. The conclusion drawn was that the horizontal baffles perform better under rolling than horizontal excitation. The vertical baffles have certain suppression effects under both motions. The T-shaped baffle has the best damping capabilities under horizontal excitation; however, it complicates the sloshing motion under rolling excitation, and it has limited effects.
Many researchers have worked to compare damping efficiency of horizontal and vertical baffles, but, so far, no study has approached the problem of the baffle’s angle, always assuming that a vertical one performs better. This research aims to validate that assumption and the use of the LES turbulence method while characterizing the baffle’s capabilities for different angles and dimensions. The study parameters have been selected as the fundamental descriptors of the tank’s overall stability, both kinetically and dynamically. The present study performs multiple validated simulations of a rectangular tank with a single centered baffle submerged underwater. The governing equations are explained in Section 2. The numerical simulation setup is described and validated in Section 3. Results are discussed in Section 4, and conclusions are drawn in Section 5.

2. Numerical Model

2.1. Governing Equations

The motion of fluids is described by the continuity and momentum equations for incompressible fluids:
· u = 0
t ρ u + · ρ u u T = p + · μ u + u T + ρ g + F
where u is the velocity, t is time, ρ the density, p the pressure, g the gravity acceleration, F the body force acting on the fluid, and μ the viscosity. In our case, we include a boundary condition moving the container (u) and not an external force F. For the walls of the model, Dirichlet boundary condition was applied where the velocity is zero relative to the wall. The no-slip wall boundary condition assumes that there is no relative movement between wall boundary and fluid layer.
CFD solves the Navier–Stokes equations by means of the finite volume method (FVM). FVM discretizes the computational domain into cells, upon which the equations are integrated using the Gauss theorem. Since it is a time-dependent problem, the solution is also discretized into time steps.
The stress tensor that appears in the left-hand side of Equation (2) is associated with generation and dissipation of turbulence terms. Turbulence by nature is a 3D phenomenon that occurs due to the random motion of fluid particles. One of the industrially applied methods of modeling turbulence is Reynolds-averaged Navier–Stokes (RANS) equations, in which solution variables in the instantaneous (exact) Navier–Stokes equations are decomposed into the mean and fluctuating components.
By using this method, all turbulent structures are eliminated from the flow, and a smooth variation of the averaged velocity and pressure fields can be obtained. However, the averaging process introduces additional unknown terms into the transport equations (Reynolds stresses and fluxes) that need to be provided by suitable turbulence models:
u = u ¯ + u ´
Solving turbulence in Navier–Stokes equations for a wide range of length scales in time and space by using direct numerical simulation (DNS) is not feasible for most industrial applications; for this reason, models based on averaging and filtering have to be applied to field variables. Large eddy simulation is based on the approach of resolving large turbulent structures in space and time down to the grid limit everywhere in the flow. The largest eddies are typically comparable in size to the characteristic length of the mean flow. The smallest scales are responsible for the dissipation of turbulence kinetic energy.
In LES, the eddy-viscosity can be modelled in various forms. One of the simplest forms is the Smagorinsky–Lilly model. In this model, the eddy-viscosity is given by Equation (4):
μ t = ρ L s 2 S
where L s is the mixing length for subgrid scales and S is strain rate tensor.

2.2. Volume of Fluid (VOF)

The volume of fluid (VOF) model was implemented to capture the interface between immiscible fluids. VOF is a Eulerian method in which the mesh is stationary. This model assumes a common pressure and velocity field for all the phases placed within a cell. The fluid phases share a single set of momentum equations, and the volume fraction of each fluid phase in each computational cell is controlled by a characteristic function α:
α x , y , z = 1 F l u i d 0 1 F r e e   s u r f a c e 0 E m p t y
A value of α = 0.5 is commonly used as the free surface. As the free surface moves, the volume fraction is updated by solving the continuity equation for each volume fraction. After the computation of α, we can define equivalent characteristics for each cell, such as density and viscosity, where the subscript corresponds to each fluid:
ρ = α ρ 1 + 1 α ρ 2 μ = α μ 1 + 1 α μ 2

2.3. Sloshing Natural Frequency

Sloshing is the motion of two or more immiscible fluids, generally one in the form of gas and another in the form of liquid; typically, this motion occurs inside an accelerated container. According to Raouf A. Ibrahim [17], the potential function f(x; y; t) has to satisfy the Laplace equation:
2 x 2 + 2 y 2 = 0
We can use many parameters to define this potential equation. For the present study, a two-dimensional analysis of the potential function is assumed, meaning that the tank’s depth (Z direction) tends to infinity. This means that in 2D we cannot include friction with front and bottom walls, only left, right, top, and bottom. The solution of the equation, applying the no-slip boundary conditions, leads to the equation for the natural frequency of a rectangular fluid:
ω n = n π g L tanh n π h L
where wn is the frequency of oscillation in the vibration mode, g is gravity, L is the tank length, and h is the fluid height.
In simulations, we need to include the thickness of the baffle, but we are not considering at this stage the rigidity of such baffle. We are not monitoring forces on the baffle, but on left and right walls, where there is no work with which to compare.

3. Simulation Setup

3.1. Tank Schematic and Mesh

The tank is 500 mm in length (L) and 300 mm in height, as defined by Jamalabadi et al. [13], with the water level being 150 mm (h) at time zero for all simulations, as in Craig and Kingsley [3]. The baffle is centered, submerged underwater, and 5 mm in thickness, as defined by Xue et al. [18], constantly for all angles (b), as shown in Figure 1a. Both the length of the baffle (Lb) or the projected height (Hb) is maintained constant throughout the different simulations and to a value of 75 mm, half of the water’s depth, as defined by Joshi et al. [19], to see how both parameters affect the results. Three wave gauges (WG) have been placed to measure the free surface elevation, as by Liu and Lin [1].
The tank contains two phases: water with density ρ = 998.2 kg/m3 and viscosity μ = 1.003E−3 kg/(m·s); and air with ρ = 1.225 kg/m3 and viscosity μ = 1.7894E−5 kg/(m·s). The tank undergoes a sinusoidal displacement x(t) = dsin(wt), where d = 0.005 m, as defined by Liu and Lin [1], Saravanan et al. [20], and Pandit and Chandra Biswal [21] under its first mode natural frequency w = wn = 6.736 rad/s (period T = 0.9328 s, velocity 0.005 × 6.736 = 0.03368 m/s much less than impacts from Khezzar et al. [11]). Time (t) has been discretized with time-steps of 0.0001 s for a total of 7.47 s, equal to 8 acceleration periods. As for the spatial domain, a mesh grid of 5 mm elements has been used, as by Liu and Lin [1] and Xue et al. [2,22]. A mesh convergence study was carried out to check that, with this mesh size, results were providing the right benchmark response. Concerning Reynolds number Re = LU/ν (with L being the gap between baffle and free surface 0.075 m, U the wave, x velocity, and ν the kinematic viscosity of 0.0001 m2/s) Re transition from laminar occurs at 0.03068 m/s with Re = 2301, and turbulence should start for 0.05335 m/s with Re = 4001.

3.2. Method of Solution

The simulations are performed using ANSYS® Fluent R2 2020 with a pressure-based segregated solved technology with no skewness neighbor correction. The VOF model is used to capture the interface between the two fluids. The LES model is adopted to model turbulence, using the wall-adapting local eddy viscosity (WALE) as the sub-grid scale (SGS) model.
For the pressure–velocity coupling problem, the pressure-implicit with splitting of operators (PISO) is used. The PISO scheme takes higher orders of pressure–velocity correction into account, hence enhancing the momentum balance after every pressure-correction equation. To calculate the gradients needed to solve for the scalar values and the velocity derivative, the Green–Gauss cell-based method is used. A second order upwind scheme is used to solve the partial differential equations to discretize the momentum while avoiding diffusion. To calculate the interpolated values of pressure at the cells’ faces, the pressure staggering option (PRESTO) is used. For the volume fraction discretization, the compressive advective numerical method is used. Non-iterative time advancement (NITA) is used for time advancement, as it reduces the computational effort. Since gravity is taken into account, implicit body force treatment is used to have better convergence; because body forces and pressure gradients are almost in equilibrium, convective and viscous terms are small in comparison. All simulations residuals were set to under 10−6.

3.3. Model Validation

Similar to the work by Demirel and Aral [12], we have used different turbulence models such as shear stress transport (SST), k-ω, renormalization group (RNG) k-ε, k-kl-ω, and LES with different wall treatments. Simulations were validated benchmarking the results against the experimental results of Okamoto and Kawahara [23]. The goal is to find the best turbulence model and validate it against experimental results (Tahmasebi et al., [24]). Recent developments in the LES context include the filtering stabilization by Giorfoglio et al. [25,26]
A square tank, 1 m in length (L) and 0.5 m of initial water depth (h), is subjected to a sinusoidal displacement of 9.3 mm of amplitude under first mode resonance wn = 5.315 rad/s (T = 1.182 s, velocity 0.0093 × 5.315 = 0.04943 m/s much less than impacts from Khezzar et al. [11] but similar to Liu and Lin [1], Saravanan et al. [20], and Pandit and Chandra Biswal [21]). Figure 2 tracks the free surface elevation along the tank length. Reynolds-averaged Navier–Stokes (RANS) models such as k-e or k-w underestimate the sloshing, whereas LES perfectly tracks the free surface elevation compared to experimental data.
Once LES has been defined as the model best fitting the experimental data, a second validation is performed using the work from Liu and Lin [1] to benchmark our LES model against a widely renowned model. In this case, a rectangular tank 570 mm in length (L), 300 mm in height, and 150 mm of initial water depth (h) is subjected to a sinusoidal displacement of 5 mm of amplitude under the first resonance mode wn = 6.058 rad/s (velocity 0.005 × 6.058 = 0.03029 m/s much less than impacts from Khezzar et al. [11] but very similar to Liu and Lin [1], Saravanan et al. [20], and Pandit and Chandra Biswal [21]). Three wave gauges measure the free surface elevation at each time step: one in the center of the free surface 285 mm and two 20 mm away from the walls, similar to those in Figure 1. These measurements compared with experimental data and simulations can be seen in Figure 3. Results from this research show even greater accuracy than the previous work and, therefore, validate the LES turbulence model’s use and the discretization methods.

4. Results and Discussion

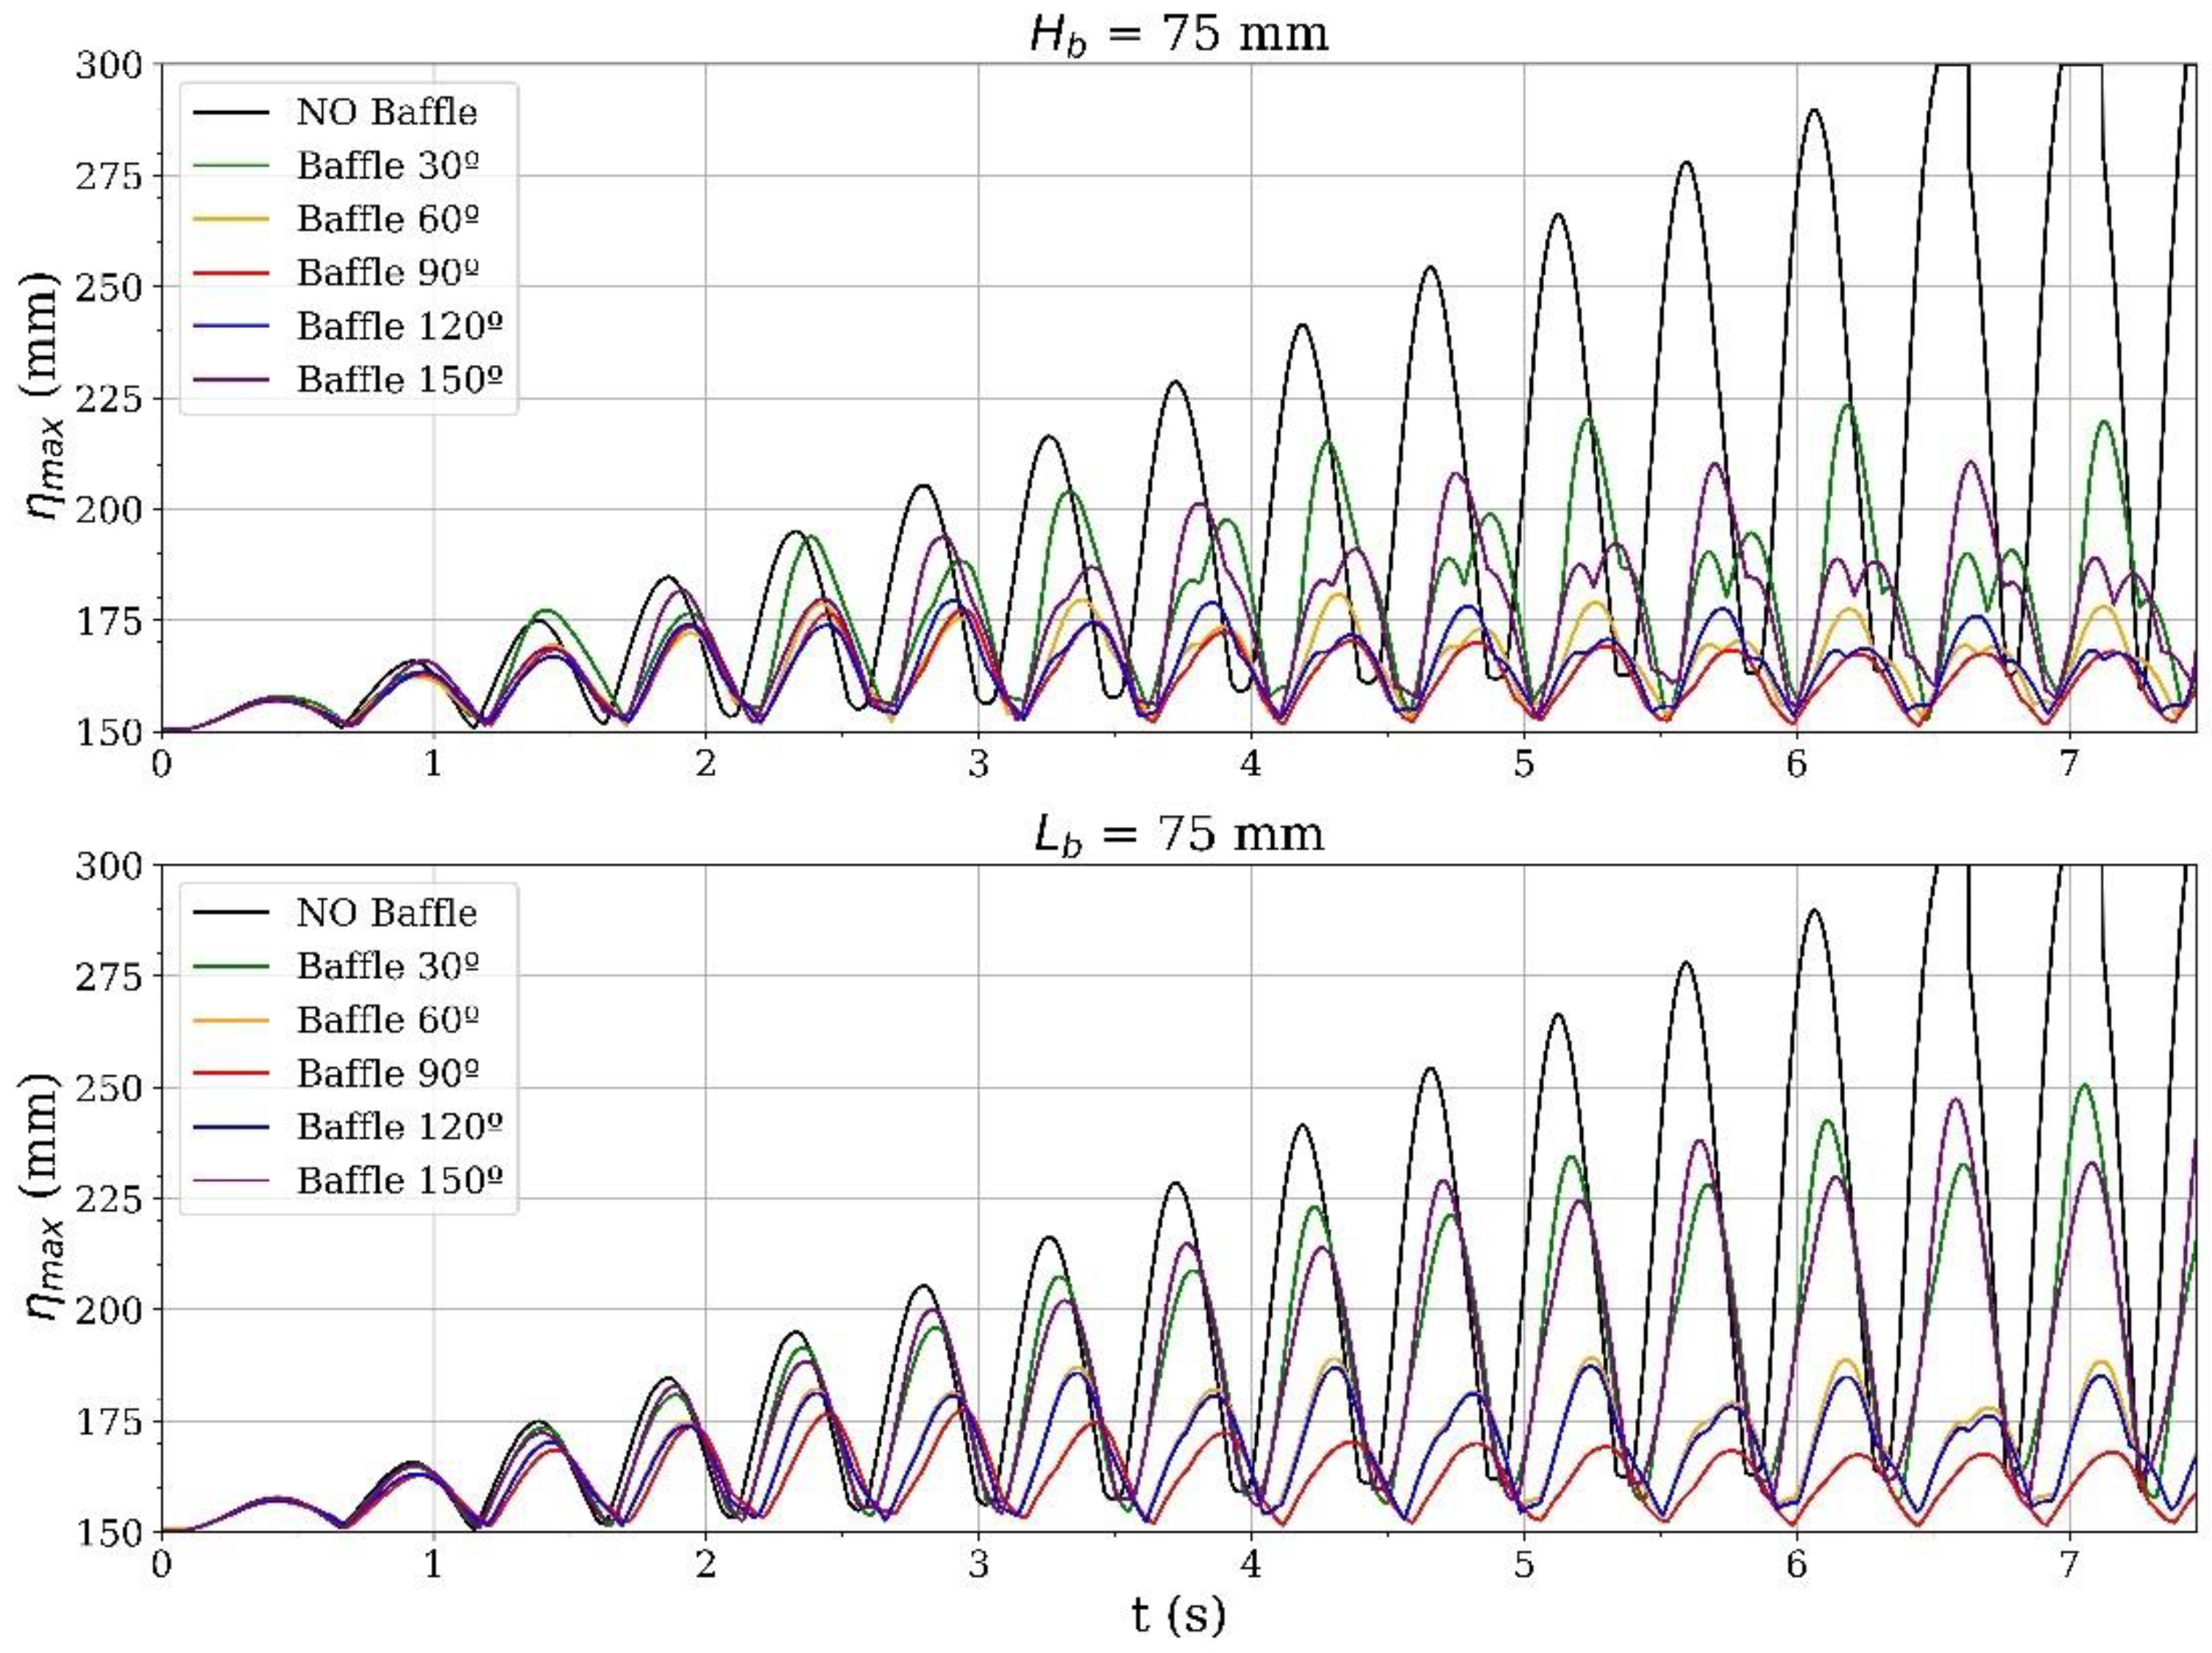
A key parameter of the dynamics of the fluid is the amplitude of the resulting wave. Figure 3 plots the wave peak elevation through time, that is, the height of the resultant wave. Results show a dampening effect on the free surface elevation, reaching a steady-state elevation. The 90° baffle manages to reduce the root mean square (RMS) value of the free surface elevation by 20.12%. When comparing baffles with the same angle but different projected heights, as in Figure 4, Figure 5 and Figure 6, similar results are seen. The ones with a constant projected height slightly outperform the ones with a constant baffle’s length when it comes to taming the fluid.
Given how the induced wave energy is proportional to the square of the free surface elevation, E s = η m a x 2 (Xue et al. [18]), different baffle angles can be compared against the simulation without a baffle using an energy dissipation rate ξ :
ξ = η m a x N O b a f f l e 2 η m a x β 2 η m a x N O b a f f l e 2
ξ is computed for every peak value of the free surface elevation since it is the amplitude of the resulting wave. As seen in Figure 7, a stable energy dissipation rate is achieved for every baffle, being 68.85% the maximum value for the 90° baffle.
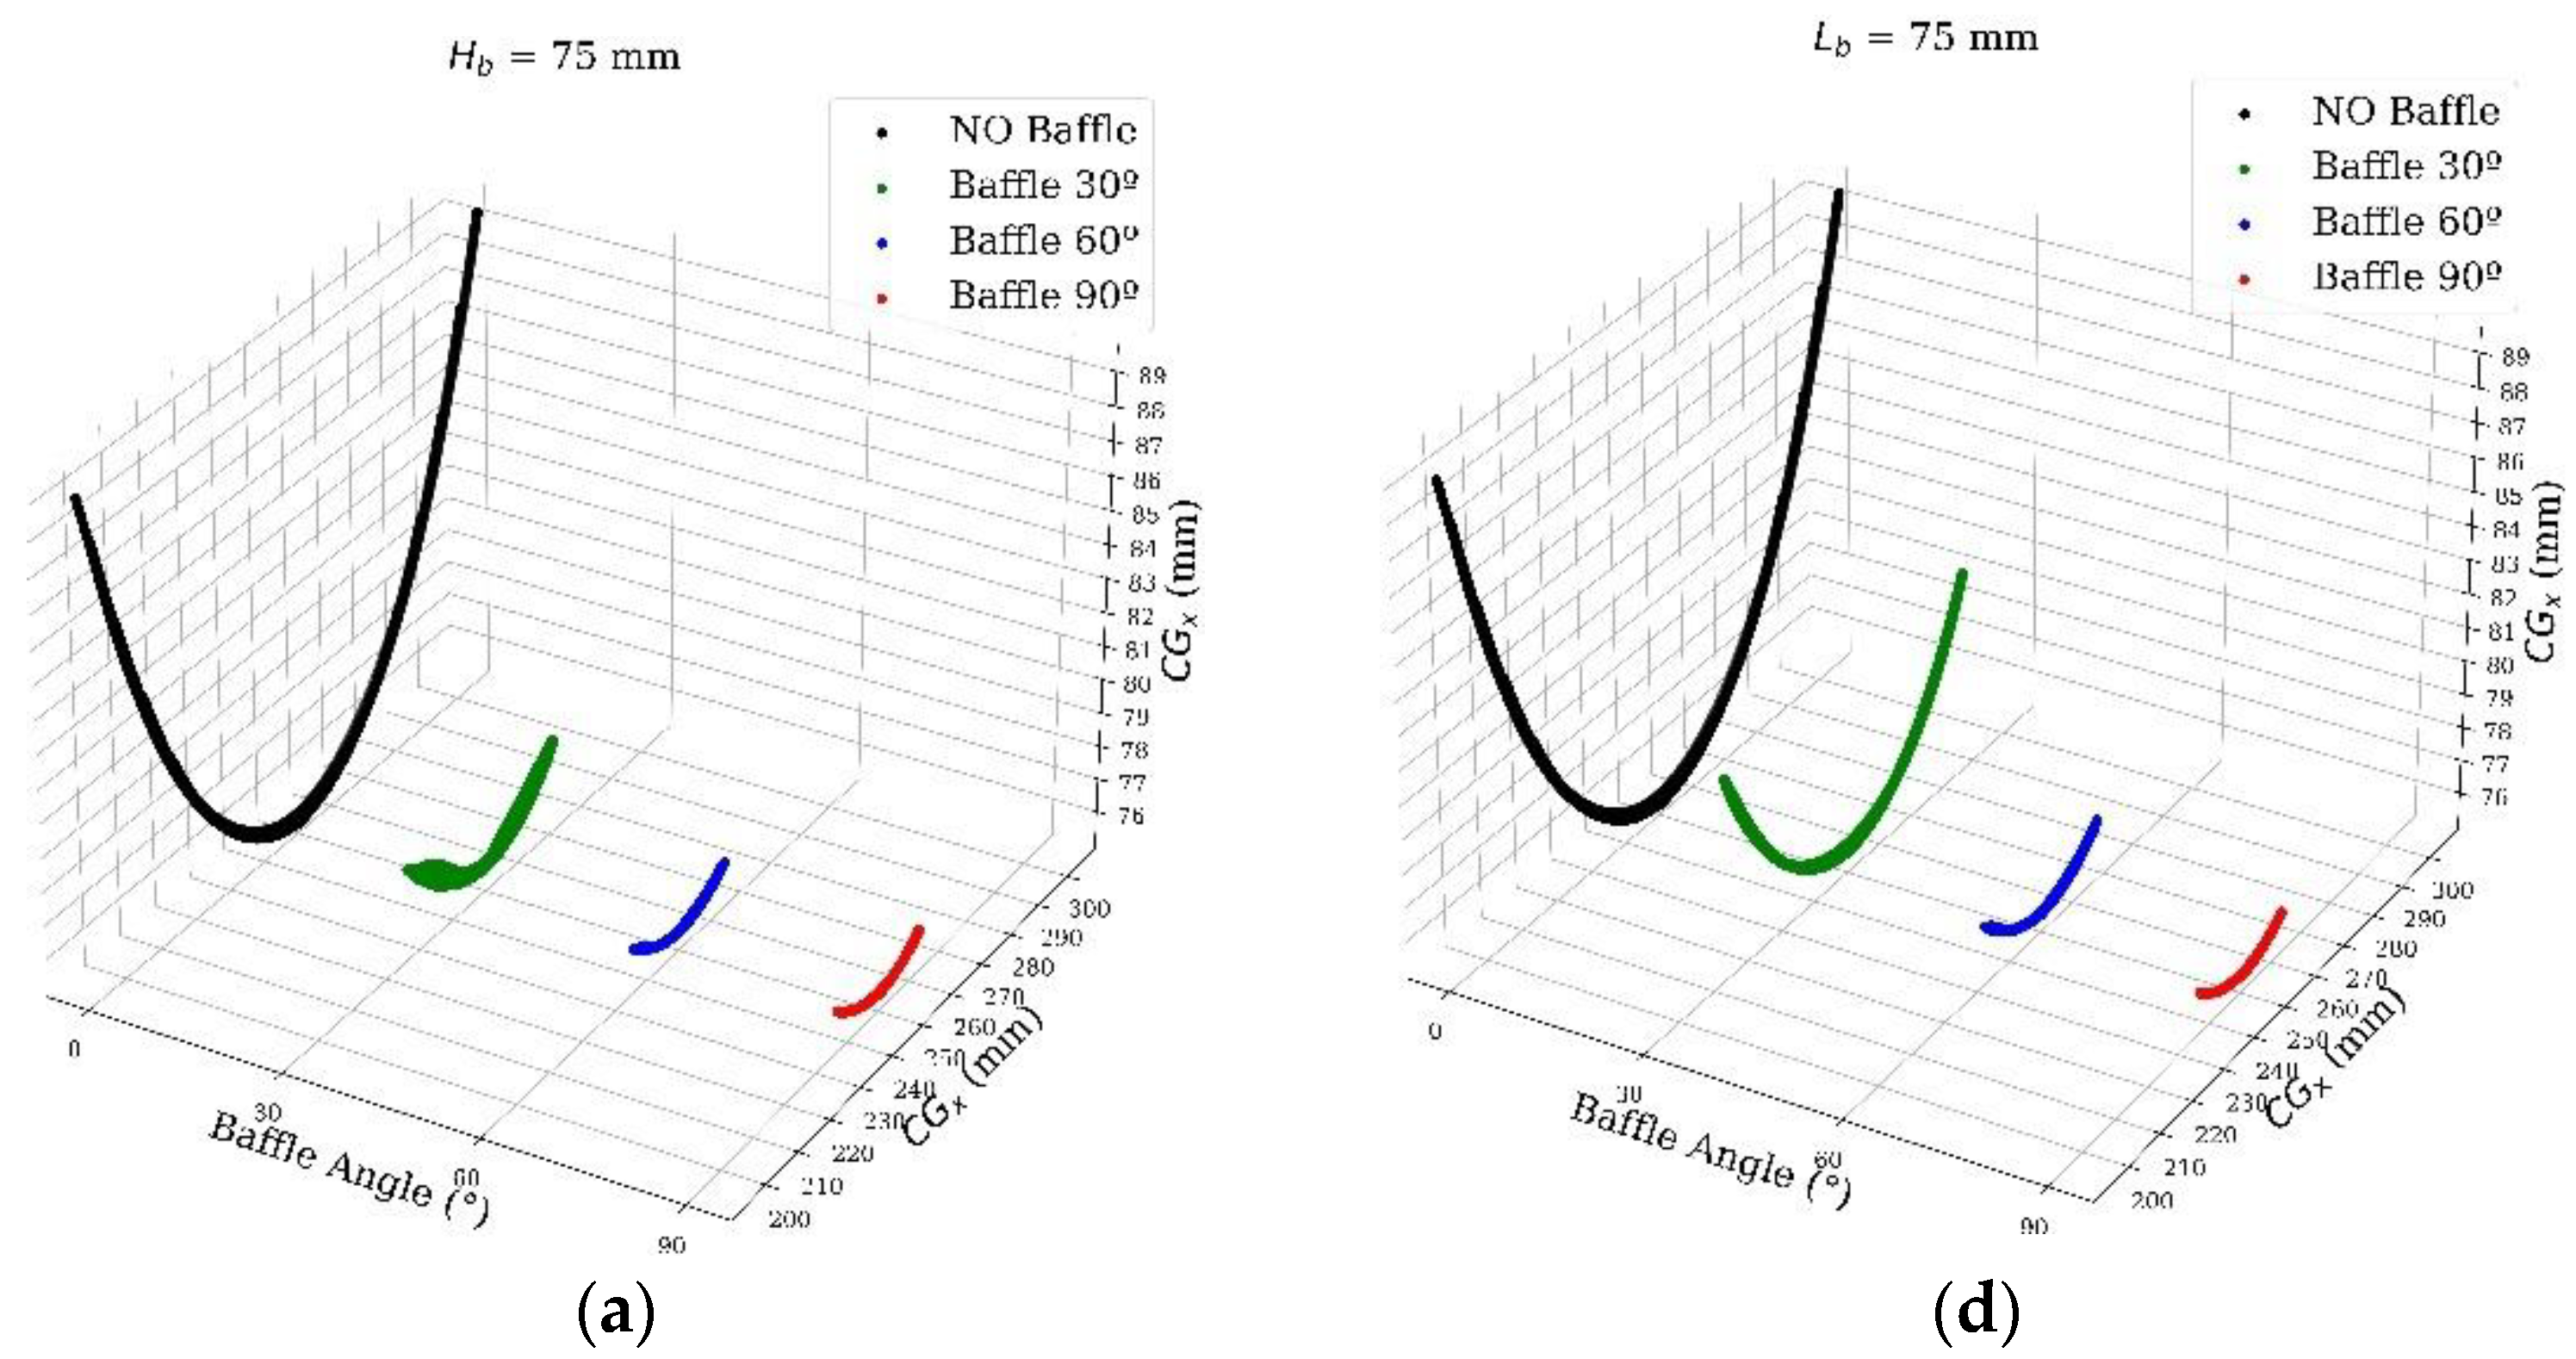
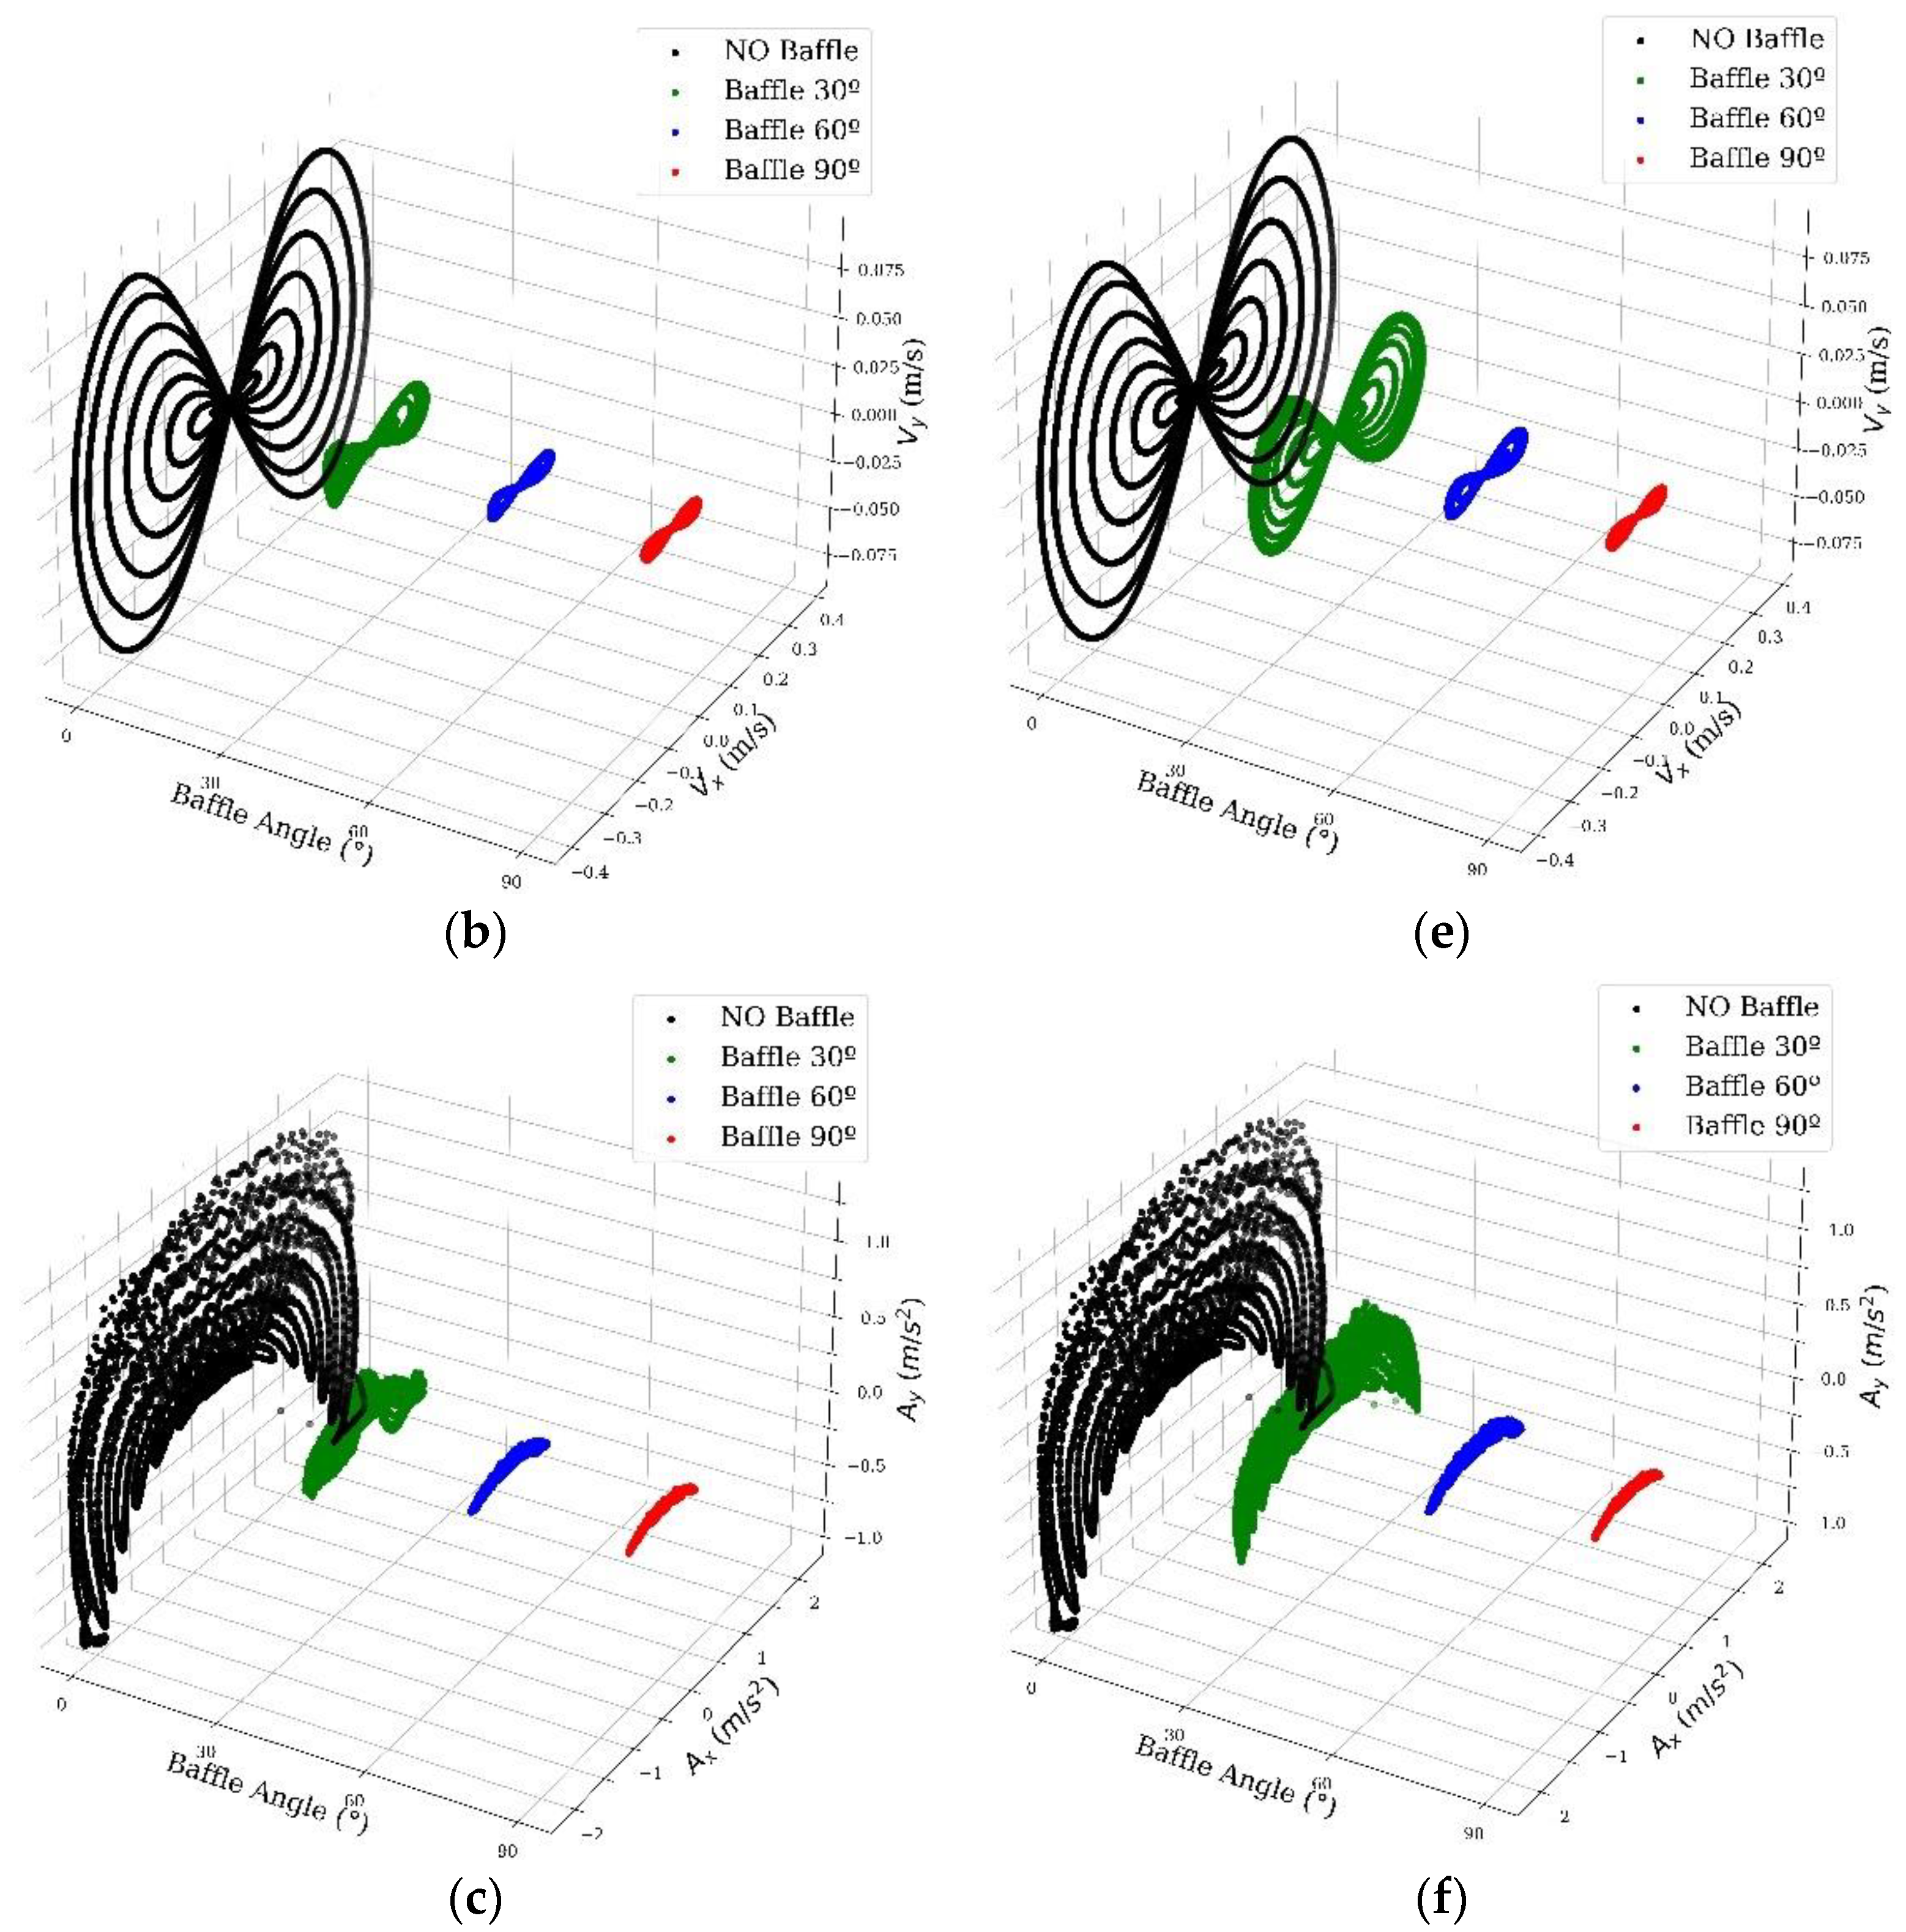
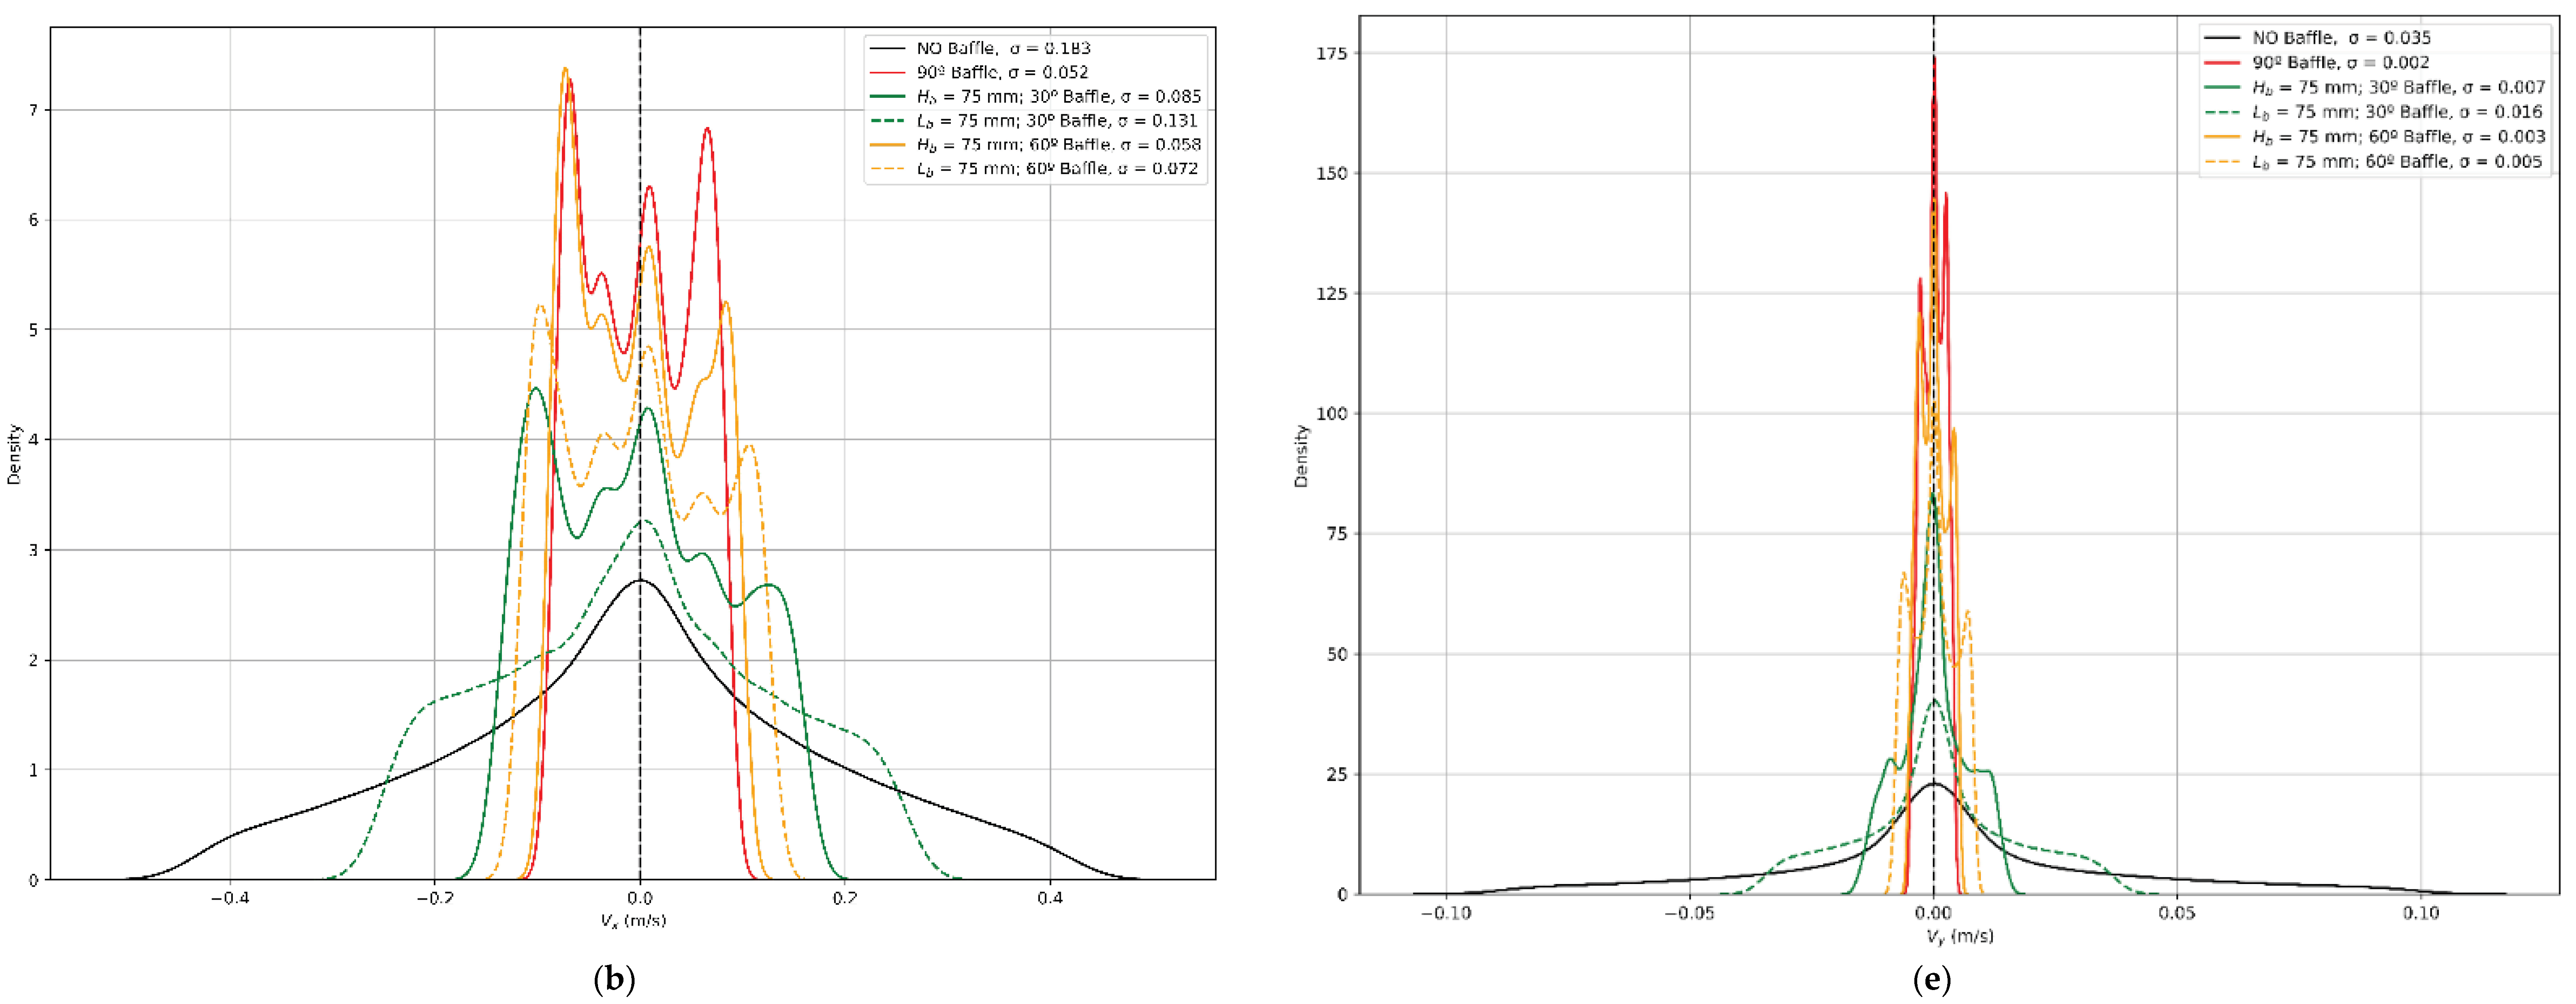
Figure 8 plots the position, velocity, and acceleration of the center of gravity (CG) for all time-steps. The 90° dampens the movement of the CG, therefore stabilizing its pitch. The 90° baffle reduces the standard deviation σ of the CG position, velocity, and acceleration on the X-axis more than three times and more than 15 times on the Y-axis, as in Figure 9.
The forces acting on the wall in Figure 10 have a predominantly X value, being the Y component next to zero for all simulations. Placing a baffle significantly stabilizes the forces acting on the walls. The RMS values of the forces of the left wall when placing at 90° increases 1.705, that is 0.532%, a small price to pay in order to reduce the standard deviation σ of the CG. On the right wall, the RMS decrease 5.438% when placing a vertical baffle.
When performing a linear correlation between the baffle’s dimensions and the minimum, maximum, and RMS values of the study parameter in Table 1, Hb’s importance is signaled over any other parameter. Hb is crucial for the fluid’s overall stability, being directly proportional to the reduction of the standard deviation of the CG position, velocity, and acceleration, and the forces acting on the walls. Hb is inversely proportional to the standard deviation, maximum, and RMS values of the free surface elevation at the three Wave Gauges. On the other hand, Hb is directly proportional to the minimum values; this reinforces the importance of Hb when it comes to dampening the motion over a mean value.

5. Conclusions

The sloshing of fluids inside a closed domain is an important aspect of designing aircrafts, missiles, and trucks carrying fuel or liquids. In designing such vehicles, the resulting loads from sloshing fluids should be considered as such loads may destabilize the vehicles. In this paper, the sloshing dynamics were investigated to study turbulence modelling.
Using LES as the turbulence model and WALE as the SGS model, accurately depicts the sloshing phenomenon and has very good accuracy using 2D simulations, even LES being an essentially three-dimensional technique, compared to experimental results. RANS models, which are potentially faster, oversimplify the motion, therefore leading to a falsely less violent movement of the fluid, with mesh lengths as in previously published studies.
The 90° angle baffle has the best stabilizing and damping capabilities. The 90° angle baffle outperforms the other baffles in every aspect and reduces the dispersion of the study’s parameters more than any other baffle.
Throughout all the study’s parameters, Hb constantly signals a linear correlation with the study’s parameters to reduce or increase them in favor of the fluid’s stability.
Just placing a baffle, even one with an angle that performs significantly worse than the best ones, helps dampen and stabilize the fluid’s motion inside the tank. This effect can be seen when studying the energy dissipation rate. The minimum stable value is 39.66%, which is significant enough to dampen the fluid’s movement and make it reach a steady-state motion.
When it comes to the three dimensions of the baffle, Hb has the most significant importance when it comes to taming capabilities. This also is true when comparing baffles with the same angle. Baffles with Hb = 75 mm perform better than those with the same angle but Lb = 75 mm. This is related to the previous and next conclusion because baffles with a constant Lb have a smaller Hb.
The closer the baffle’s angle to 90°, the greater its damping capabilities. The 60° and 120° angles perform better and more similar to the 90° angle than the 30° and 150° baffle.
All of the baffles reach a steady-state situation where the fluid inside the tank oscillates constantly. The closer to the 90° angle, the faster this state is reached and the more constrained the oscillation is. This steady state is also the state of maximum dissipation of energy, reaching a constant maximum value.
Stabilizing the CG comes at a price; the forces acting on the wall minimum and RMS value increase, whereas the maximum value decreases. This follows the line of the stabilization ideas, but it leads to greater stresses on the tank walls when it comes to forces. However, the requirements to which the walls are subjected increase very slightly, and the benefits when it comes to the CG’s position, velocity, and acceleration are worth the effort.
Now that the simulation method is benchmarked against published experiments, future research should focus on flexible baffles with different configurations within a fluid-structure interaction scheme.

Author Contributions

Conceptualization, E.S. and X.V.R.; methodology, A.-A.G.-G.; software, A.-A.G.-G.; validation, E.S., I.K. and X.V.R.; formal analysis, A.-A.G.-G.; investigation, X.V.R.; resources, A.-A.G.-G.; writing—original draft preparation, X.V.R.; writing—review and editing, I.K. All authors have read and agreed to the published version of the manuscript.

Funding

This work is supported by IQS School of Engineering, Universitat Ramon Llull.

Institutional Review Board Statement

Not applicable.

Informed Consent Statement

Not applicable.

Data Availability Statement

Not applicable.

Conflicts of Interest

The authors declare no conflict of interest.

References

  1. Liu, D.; Lin, P. A numerical study of three-dimensional liquid sloshing in tanks. J. Comput. Phys. 2008, 227, 3921–3939. [Google Scholar] [CrossRef]
  2. Xue, M.A.; Chen, Y.; Zheng, J.; Qian, L.; Yuan, X. Fluid dynamics analysis of sloshing pressure distribution in storage vessels of different shapes. Ocean Eng. 2019, 192, 106582. [Google Scholar] [CrossRef]
  3. Craig, K.J.; Kingsley, T.C. Design optimization of containers for sloshing and impact. Struct. Multidiscip. Optim. 2007, 33, 71–87. [Google Scholar] [CrossRef]
  4. Kandasamy, T. An Analysis of Baffles Designs for Limiting Fluid Slosh in Partly Filled Tank Trucks. Open Transp. J. 2010, 4, 23–32. [Google Scholar] [CrossRef]
  5. Goudarzi, M.A.; Sabbagh-Yazdi, S.R.; Marx, W. Investigation of sloshing damping in baffled rectangular tanks subjected to the dynamic excitation. Bull. Earthq. Eng. 2010, 8, 1055–1072. [Google Scholar] [CrossRef]
  6. Hasheminejad, S.M.; Aghabeigi, M. Sloshing characteristics in half-full horizontal elliptical tanks with vertical baffles. Appl. Math. Model. 2012, 36, 57–71. [Google Scholar] [CrossRef]
  7. Zheng, X.L.; Li, X.S.; Ren, Y.Y.; Wang, Y.N.; Ma, J. Effects of transverse baffle design on reducing liquid sloshing in partially filled tank vehicles. Math. Probl. Eng. 2013, 2013, 1–13. [Google Scholar] [CrossRef] [Green Version]
  8. Hosseini, M.; Vosoughifar, H.; Farshadmanesh, P. Simplified Dynamic Analysis of Sloshing in Rectangular Tanks with Multiple Vertical Baffles. J. Water Sci. Res. 2013, 5, 19–30. [Google Scholar]
  9. Bautista-Jacobo, J.L.; Rodríguez-Morales, E.; Montes-Rodríguez, J.J.; Gámez-Cuatzín, H. Effect of Baffles on the Sloshing in Road Tankers Carrying LPG: A Comparative Numerical Study. Math. Probl. Eng. 2015, 2015, 35947. [Google Scholar] [CrossRef]
  10. Shreeharsha, H.V.; Shivakumar, S.G.; Mallikarjun, S.G. Simulation of Sloshing in Rigid Rectangular Tank and a Typical Aircraft Drop Tank. J. Aeronaut. Aerosp. Eng. 2017, 6, 1–9. [Google Scholar] [CrossRef]
  11. Khezzar, L.; Seibi, A.; Goharzadeh, A. Water sloshing in rectangular tanks—An experimental investigation\& numerical simulation. Int. J. Eng. 2009, 3, 174–184. [Google Scholar]
  12. Demirel, E.; Aral, M.M. Liquid sloshing damping in an accelerated tank using a novel slot-baffle design. Water 2018, 10, 1565. [Google Scholar] [CrossRef]
  13. Jamalabadi, M.Y.A.; Ho-Huu, V.; Nguyen, T.K. Optimal design of circular baffles on sloshing in a rectangular tank horizontally coupled by structure. Water 2018, 10, 1504. [Google Scholar] [CrossRef] [Green Version]
  14. Dinçer, A.E. Investigation of the sloshing behavior due to seismic excitations considering two-way coupling of the fluid and the structure. Water 2019, 11, 2664. [Google Scholar] [CrossRef] [Green Version]
  15. Yu, L.; Xue, M.A.; Jiang, Z. Experimental investigation of parametric sloshing in a tank with vertical baffles. Ocean Eng. 2020, 213, 107783. [Google Scholar] [CrossRef]
  16. Guan, Y.; Yang, C.; Chen, P.; Zhou, L. Numerical investigation on the effect of baffles on liquid sloshing in 3D rectangular tanks based on nonlinear boundary element method. Int. J. Nav. Archit. Ocean Eng. 2020, 12, 399–413. [Google Scholar] [CrossRef]
  17. Ibrahim, R.A. Liquid Sloshing Dynamics: Theory and Applications; Cambridge University Press: Cambridge, UK, 2005; Volume 1, p. 970. Available online: https://books.google.com/books?id=ctvhvH74ZzEC (accessed on 15 May 2021).
  18. Xue, M.A.; Zheng, J.; Lin, P. Numerical simulation of sloshing phenomena in cubic tank with multiple baffles. J. Appl. Math. 2012, 2012, 1–21. [Google Scholar] [CrossRef] [Green Version]
  19. Joshi, A.Y.; Bansal, A.; Rakshit, D. Effects of Baffles on Sloshing Impact Pressure of a Chamfered Tank. Procedia Eng. 2017, 173, 940–947. [Google Scholar] [CrossRef]
  20. Saravanan, G.; Sannasiraj, S.A.; Sundar, V. Asymptotic Analysis of Sloshing in a Rectangular Tank. Int. J. Ocean Clim. Syst. 2014, 5, 89–103. [Google Scholar] [CrossRef]
  21. Pandit, A.; Biswal, K.C. Sloshing response of partially filled rectangular tank under periodic horizontal ground motion. MATEC Web Conf. 2018, 172, 1–5. [Google Scholar] [CrossRef] [Green Version]
  22. Xue, M.; Lin, P.Z.; Zheng, J.H.; Ma, Y.X.; Yuan, X.L.; Nguyen, V.T. Effects of perforated baffle on reducing sloshing in rectangular tank: Experimental and numerical study. China Ocean Eng. 2013, 27, 615–628. [Google Scholar] [CrossRef]
  23. Okamoto, T.; Kawahara, M. Two-dimensional sloshing analysis by Lagrangian finite element method. Int. J. Numer. Methods Fluids 1990, 11, 453–477. [Google Scholar] [CrossRef]
  24. Tahmasebi, M.K.; Shamsoddini, R.; Abolpour, B. Performances of Different Turbulence Models for Simulating Shallow Water Sloshing in Rectangular Tank. J. Mar. Sci. Appl. 2020, 19, 381–387. [Google Scholar] [CrossRef]
  25. Girfoglio, M.; Quaini, A.; Rozza, G. A Finite Volume approximation of the Navier-Stokes equations with nonlinear filtering stabilization. Comput. Fluids 2019, 187, 27–45. [Google Scholar] [CrossRef] [Green Version]
  26. Girfoglio, M.; Quaini, A.; Rozza, G. A POD-Galerkin reduced order model for a LES filtering approach. J. Comput. Phys. 2021, 436, 110260. [Google Scholar] [CrossRef]
Figure 1. Tank schematic for (a) h = 150 mm, L = 500 mm and (b) baffle configuration for fixed Hb = 75 mm and (c) for fixed Lb = 75 mms.
Computation 10 00225 g001
Figure 2. Free surface elevation along the tank length at t = 3.55 s (3 periods T). The dotted line represents the initial free surface elevation.
Computation 10 00225 g002
Figure 3. Comparison of the time series of the free surface elevation h at probe 1, probe 2, and probe 3, respectively.
Computation 10 00225 g003
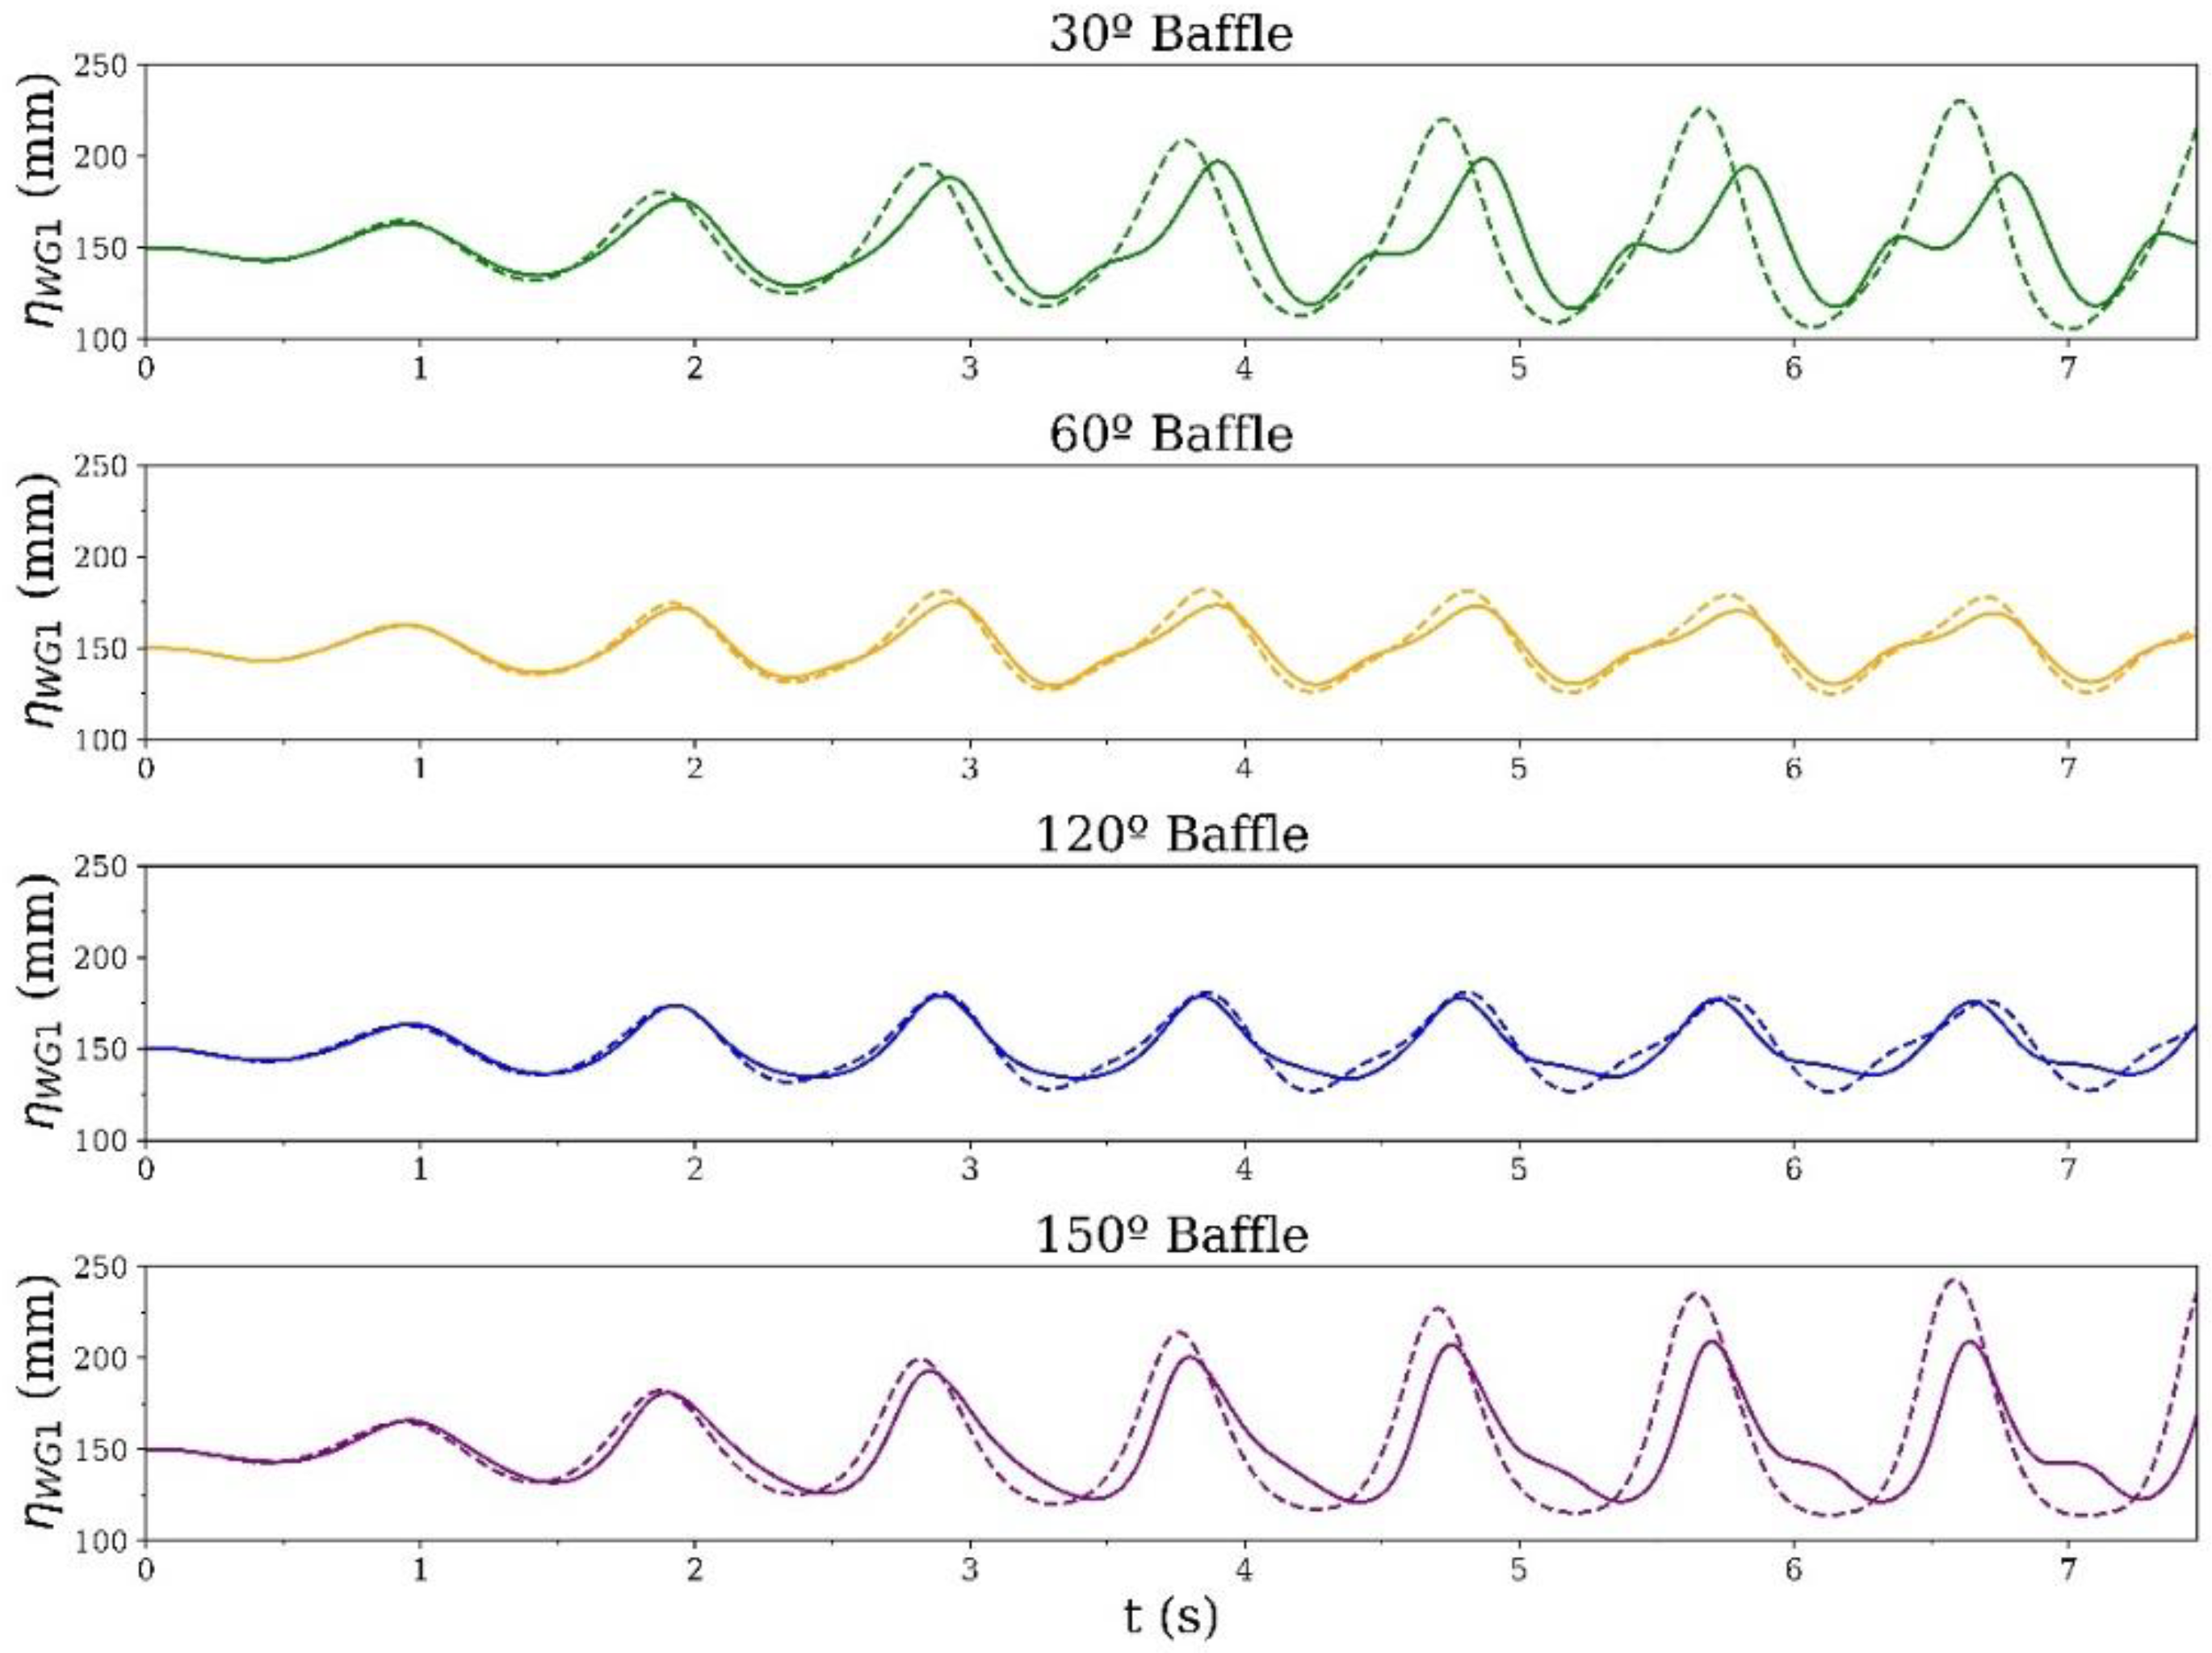
Figure 4. Free surface elevation at WG1. The solid line represents the simulations where Hb = 75 mm, the dotted line where Lb = 75 mm.
Computation 10 00225 g004
Figure 5. Free surface elevation at WG3. The solid line represents the simulations where Hb = 75 mm, the dotted line where Lb = 75 mm.
Computation 10 00225 g005
Figure 6. Maximum free surface elevation through time, that is, the height of the wave through the simulation time.
Computation 10 00225 g006
Figure 7. Energy dissipation rate.
Computation 10 00225 g007
Figure 8. X and Y scattered plot for each angle. Left column for fixed Hb = 75 mm (a) CG position, (b) velocity and (c) acceleration and right column for fixed Lb = 75 mm (d) CG position, (e) velocity and (f) acceleration.
Computation 10 00225 g008aComputation 10 00225 g008b
Figure 9. Kernel density distribution. Left column for fixed Hb = 75 mm (a) CG position, (b) velocity and (c) acceleration in X direction and right column for fixed Lb = 75 mm (d) CG position, (e) velocity and (f) acceleration in Y direction.
Computation 10 00225 g009aComputation 10 00225 g009bComputation 10 00225 g009c
Figure 10. Forces for left column for fixed Hb = 75 mm for (a) left wall, (b) right wall and right column for fixed Lb = 75 mm for (c) left wall, (d) right wall.
Computation 10 00225 g010
Table 1. Pearson’s linear correlation coefficient.
hmax RMSWG1 RMSWG2 RMSWG3 RMSxmax RMS
Lb−0.46−0.580.61−0.490.098
Hb−0.92−0.960.94−0.920.92
Cb−0.014−0.160.15−0.05−0.3
CGx minCGx maxCGx RMSCGy minCGy maxCGy RMS
Lb0.56−0.58−0.380.94−0.66−0.51
Hb0.88−0.97−0.730.62−0.96−0.94
Cb0.18−0.15−0.0360.89−0.27−0.073
Vx minVx maxVx RMSVy minVy maxVy RMS
Lb0.6−0.6−0.540.66−0.66−0.63
Hb0.97−0.97−0.960.96−0.96−0.97
Cb0.17−0.17−0.0910.27−0.26−0.22
Ax minAx maxAx RMSAy minAy maxAy RMS
Lb0.56−0.56−0.540.7−0.57−0.61
Hb0.96−0.96−0.960.98−0.93−0.96
Cb0.12−0.12−0.0930.3−0.16−0.2
s CGxs CGys Vxs Vys Axs Ay
Lb−0.53−0.65−0.54−0.63−0.55−0.61
Hb−0.96−0.97−0.96−0.97−0.87−0.96
Cb−0.086−0.25−0.088−0.22−0.14−0.2
FLW minFLW maxFLW RMSFRW minFRW maxFRW RMS
Lb0.61−0.590.430.56−0.57−0.71
Hb0.97−0.940.880.96−0.96−0.98
Cb0.19−0.190.0140.12−0.14−0.31
s FLWs FRW
Lb−0.5−0.5
Hb−0.94−0.94
Cb−0.059−0.47
Publisher’s Note: MDPI stays neutral with regard to jurisdictional claims in published maps and institutional affiliations.