Abstract
The work is devoted to solving current scientific and applied problems of the development of radar imaging methods. These developments are based on statistical theory of optimal signal processing. These developments allow researchers to create coherent high-resolution information-enriched images as well as incoherent images. These methods can be practically applied in multichannel aerospace radars through the proposed programs and algorithms. Firstly, the following models of stochastic signals at the output of multichannel registration regions of scattered electro-magnetic fields, internal noise, and observation equations are developed and their statistical characteristics investigated. For the considered models of observation equations, the likelihood functional is defined. This definition is an important stage in optimizing spatial and temporal signal processing. These signals are distorted by internal receiver noises in radar systems. Secondly, by synthesising and analysing methods of measuring a radar cross section, the problem of incoherent imaging by aerospace radars with planar antenna array is solved. Thirdly, the obtained optimal mathematical operations are physically interpreted. The proposed interpretation helps to implement a quasi-optimal algorithm of radar cross section estimation in aerospace radar systems. Finally, to verify the proposed theory, a semi-natural experiment of real radio holograms processing was performed. These radio holograms are digital recordings of spatial and temporal signals by an airborne synthetic aperture radar (SAR) system. The results of the semi-natural experiment are presented and analysed in the paper. All the calculations, developments and results in this paper can be applied to new developments in areas such as remote sensing or non-destructive testing.
1. Introduction
The use of spatio-temporal signal processing methods in radar systems located on mobile platforms makes it possible to form high-precision and highly informative radar images in any weather conditions or time of day. Due to its advantages radar images are used for nondestructive testing of various objects, aerospace research of the Earth’s surface, ship tracking and illegal vessel detection, surface digital elevation model reconstruction and geohazards monitoring.
Radar imaging methods have been used for more than 70 years. Radar imaging developments, in both theory and practice, can be divided into three periods. The first period was associated with the search for heuristic solutions for the construction of airborne radars. It also was devoted to the accumulation of basic knowledge in the field of theory and practice of high-precision radar imaging. The second is a period of rapid implementation of methods for optimizing signal processing algorithms and of synthesis of optimal and quasi-optimal radio engineering systems. Most of the methods and algorithms of this second period were based on mathematical statistics, statistical decision theory and optimal estimates of the parameters of probability distributions. The third period is associated with the rapid development of a high-precision and small-sized element base of radio measuring devices and with improvements in such elements as phased antenna arrays, low-noise amplifiers, power amplifiers, DSPs and FPGAs, all of which are necessary to implement the optimal algorithms synthesized in the second period. These developments in the manufacturing of radio-electronic assemblies and blocks have rapidly increased in the last decade so there is now a lag in the theoretical development of methods and algorithms. These modern methods do not use the full potential of the existing radio engineering equipment, therefore, they need further optimization and development which takes into account the technical capabilities of advanced radio electronics.
The development of the theory must be based on the works of V. A. Kotel’nikov [1], D. Midlton [2], F. Woodward [3], P. A. Bakut [4], I. A. Bol’shakov [4], S. Ye. Fal’kovich [5,6,7], V. K Volosyuk [8], L. Gutkin [9], B. R. Levin [10], Ya. D. Shirman [11], A. A. Kuriksha [4], G. P. Tartakovskiy [4], V. Repin [4], I. Ya. Kremer [12], R.L. Stratonovich [13,14,15], V.I. Tikhonov [16,17]. In the most of these works, the research was performed in the context of fixed ground spatially distributed systems and antenna arrays, however, the methodology of their optimization can also be applied to mobile airborne radars with aerospace-based antenna array. It should also be noted that the methods for synthesizing radar apertures in mobile airborne systems obtained in mentioned works are considered to a greater extent in relation to signals that can be described by a functionally deterministic model. At the same time, it was proved [18,19,20,21] that the roughness of the investigated surfaces, the random placement of scattering elements in space and the inhomogeneity of the electro-physical composition of objects lead to stochastic scattering of signals with a random distribution of phases and amplitudes. The result of the coherent processing of such electro-magnetic fields leads to the appearance of speckle noise and requires secondary processing and filtration. The secondary processing result is proportional to the radar cross section of surfaces and objects. Such approaches to processing stochastic signals and radar cross section estimation in aerospace radars are not optimal.
From the analysis of onboard radar systems and the achievements of the statistical theory of optimization of signal processing the following contradiction follows: on the one hand, today there are all the necessary technical solutions and element basis for creating combined high-precision and information-enriched radar images in multichannel multi-glide radio systems. On the other hand, there is no statistical theory of optimal stochastic signals processing in multichannel aerospace imaging radar systems which would make it possible to overcome the existing limits of accuracy and achieve potential qualitative characteristics of the functioning of multichannel onboard radar. This work reveals results from research that allow this contradiction to be overcome.
2. Materials and Methods
2.1. Models of Signals, Noises and Observation Equation
The determination of signal and noise models is one of the key issues in the development of the theory. For further conclusions, it is advisable to consider the generalized geometry of surface and object imaging in multichannel aerospace radars in Figure 1.
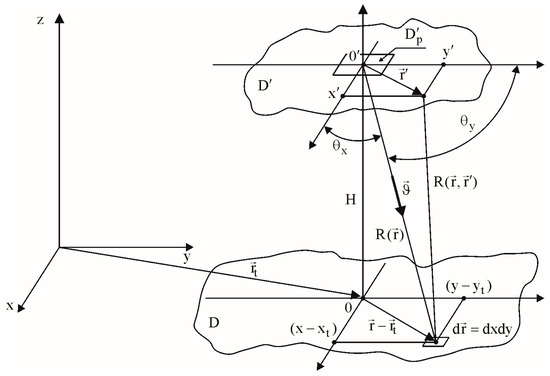
Figure 1.
Generalized geometry of surfaces and objects imaging in multichannel aerospace radars.
In Figure 1D is the surface on which the boundary conditions are phenomenologically stated in the form of the scattering coefficient . is the possible parameter that is interesting to estimate. There are a lot of electrodynamic models of the surface that describe the relations between surface parameters and scattering coefficient . The most interesting parameters, , in remote sensing are real and imaginary parts of the complex permittivity, slopes and heights of the relief, soil density, and soil moisture.
is the area of observation, and the primary (before processing) description of the field in a coherent form taking into account its amplitude and phase dependences. Within region there is a physical rectangular region, , of registration of scattered signals, which in general may have an arbitrary shape. The coordinates of include a coherent image that takes the influence of various inhomogeneities, such as inhomogeneities of chemical composition, inhomogeneities of the refractive index gradient and irregularities of the real surface, into account in its amplitude-phase structure. The region emitting the probing signal may be outside of or may be aligned with the origin of region . The only limitation is the wide emission angle of the probing signal, particularly omnidirectional radiation.
The model of the probing signal has the following form:
where
is the complex envelope in the form of periodic serial of pulses (simple rectangular, chirp, phase–code manipulation, etc.) with pulse repetition period ; is the complex envelope of one pulse; , is the carrier frequency.
The probing signal propagates and reaches the observation area with coordinates , is reflected therefrom (scattered on its inhomogeneities), and is then received by registration area . The received space–time signal should be described using a phenomenological approach [22]. On the one hand, this approach is based on the diffraction theory, Kirchhoff’s and Rayleigh-Sommerfeld theorems, and combines in its structure already known, well-defined electrodynamic models of test surfaces [23,24,25]; on the other hand, it is based on the Huygens-Fresnel principle [26,27] which allows it to describe underlying surfaces and objects of complex shape with an arbitrary distribution of electrophysical parameters and statistical characteristics. The model of the received signal is as follows:
where is the specific complex scattering coefficient of some small element of surface ; is the estimated parameter;
is the unit signal scattered from element of surface with specific complex scattering ; is the attenuation of the field in the path of propagation; is the amplitude-phase distribution in the region of signal registration; is the delay time of the field when it is distributed from point to point taking into account the shift of the registration area to the point .
The received signals are always observed against the background of the internal noise of the receiver, which is approximated by white Gaussian processes with a correlation function:
We assume that the spectral noise density in each element of the registration area is the same.
For coherent radio vision systems, the observation equation can be presented as an additive mixture of useful signals and noise:
When solving the optimization problem of processing the received oscillations according to the model (6), several cases of determining the structure of the complex scattering coefficient and parameters are considered. In one case, is considered to be a deterministic function, which is a complex coherent image of the surface and objects of observation. Otherwise, it is a stochastic process, the correlation function of which is related to the radar cross section (RCS) as follows:
where is the spatial correlation function; is the scattering vector. For such problems, all of the necessary information about the observation area is concentrated not in the coefficient itself, but in the spectral statistical characteristic (spectral power density) of a statistically inhomogeneous random process. It is a parameter of the observation area to be evaluated. This parameter is not in the observation equation, but in its statistical characteristics—the correlation function and the function inverse to the correlation function.
The correlation function of Equation (6) is written as follows:
2.2. Bases of Statistical Theory
In this paper it is noted that both the received signals and noises are of a random nature and are statistically similar. We will perform the optimal processing of such signals using the modern achievements of the theory of statistical decisions and estimates of the parameters of probability distributions, which will allow us not only to synthesize optimal algorithms, but also to design the corresponding structural schemes. In this subsection we will consider the bases of the theory of optimization of the stochastic space–time signals processing in onboard radars, the features of constructing probability density functionals, and methods for calculating the potential characteristics of algorithms and systems. In the formulation of the optimization problem, the target direction of the work, the initial data and a priori information are noted. An optimization criterion is selected from the analysis of the problem statement. It is known [5,8,10] that in conditions of parametric a priori uncertainty, a minimum of a priori information requires the maximum likelihood method.
The essence of the maximum likelihood functional method is to find an estimated parameter that maximizes the likelihood function . Function is a conditional probability density function of a vector random process at a fixed value of the vector of parameters, , which can have both constant values and be a function of time or spatial (angular ) coordinates. Instead of function , its logarithm is more often maximized. To find optimal estimates of the parameters , the following system of equations is solved:
where is the partial derivative operator, and is the true value of the parameter .
When solving problems of estimating parameters of spatially extended objects, the parameters are functions of spatial coordinates . Taking into account geometry in Figure 1, the system of Equation (9) will have the following form:
where is the operator of the variational (functional) derivative. The method for calculating the variational derivatives is considered in [28].
One of the most important stages in solving optimization problems is the construction of a likelihood function. In [8] a technique for constructing a wide class of likelihood functions is presented. The likelihood function for observation Equation (6) with statistical characteristics (8) is written in the form:
where is the coefficient that depends on the energy parameter , and is a function inverse to the correlation function that can be found from the integral equation:
In order to estimate the limiting errors of the underlying surface parameters estimation, it is necessary to calculate the trace of the operator which is inverse to the Fisher operator:
where is the symbol of the trace,
is the Fisher operator.
In the case of estimating one parameter, Expression (13) has the following form:
where is the sign of statistical averaging.
3. Results
The proposed statistical theory can be applied to the problem of optimal radar cross section estimation in onboard imaging radars with planar antenna arrays.
3.1. Geometry of the Surface Sensing
In Figure 2 the geometry of the surface sensing is shown from the aerospace carrier of the radar system with a planar antenna array.
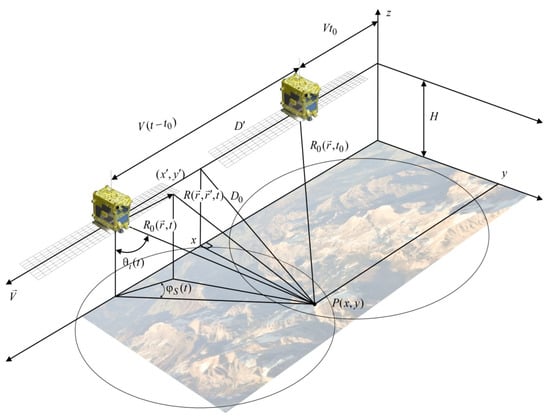
Figure 2.
Geometry of surface sensing.
Using a small area around the phase center of the registration area (in the case of discrete idealization, one element of the antenna array) the signal (1) is emitted in the direction of the investigated surface in a wide sector of angles.
The received signals are stochastic and have the following form:
where
Expression (15), taking into account (17), describes the reflected signal from each point at each point of the registration area with coordinates in the process of rectilinear motion of the aircraft at a constant speed .
For a statistical description of the received signals and noises, we will write down the observation equation:
where is a white Gaussian noise.
Correlation function of observation Equation (18):
3.2. Problem Statement
According to the reception of stochastic reflected oscillations of each element of the antenna array which are observed against the background of additive Gaussian noise , it is necessary to optimally estimate the radar cross section of the underlying surface as a statistical characteristic of the complex scattering coefficient .
3.3. Solution of the Optimization Problem
We obtain the optimal estimation algorithm by the method of maximum likelihood with the likelihood function
Since depends on the coordinates , the problem of finding the maximum of Function (20) is solved by variational methods.
Since the exponent and its power are monotonically related to each other, instead of the likelihood Function (20) derivation, it is possible to take the derivative of its logarithm and equate the obtained result to zero:
To obtain a variational derivative , the estimate can be represented as a sum
where is the optimal value, and is the variation of the estimate, which is some of its arbitrary small deviation from the optimal value
is an arbitrary function describing the deviation of the desired estimate in a short distance from a small parameter from its optimal value . Instead of the variational derivative with respect to the function , we will find a partial derivative with respect to the degree of deviation .
As a result of taking the derivative, we obtain the following equation:
This equation is called the likelihood equation. Its exact definition was obtained in [8]. It should be noted that in this equation does not use an equal sign, but rather a sign equating the left part to the right part. The right part is the main algorithm that corresponds to the result of processing the received signal . Observation equations have a random nature because of internal noise. The result of will be random too. The left part is a deterministic process. It can be shown that the left-hand side of this likelihood equation is the average result (mathematical expectation) of the right-hand side.
We write the inverse correlation function as follows:
The derivative of the inverse correlation function has the following form:
Derived from the direct correlation function:
Substituting (25) into (24), we obtain:
where is the reference signal in the synthesized optimal method of recovery of radar cross section. The presence of an inverse correlation function under the sign of the integral indicates that the introduction of this signal into the processing algorithm involves inverse filtering of the received oscillations, i.e., their decorrelation or bleaching (approaching white noise).
Substituting the obtained expressions (26) and (25) into the likelihood Equation (20), we obtain:
where
is the uncertainty function (hardware function) of scatterometric SAR and planar antenna array, which determines its resolution. It is a spatial pulse characteristic of the radar system, i.e., the reaction (result of processing) of the SAR to a point source , which creates a reflected single signal ,
is the reference signal energy ,
is the optimal output effect of modified scatterometric SAR.
Since the function was defined as arbitrary, the zero equality of the integral (27) is possible only when the expression under the integral is equal to zero, i.e.,
For simplification and more effective implementation of this algorithm, it is expedient to pass in it to complex envelopes, therefore
From the obtained expressions it follows that the function is a consistent and biased estimate (the bias can be eliminated) of the radar cross section. It does not strive for true value with increasing observation time, even when the process is statistically homogeneous and the radar cross section is the constant . Note that the estimation of the radar cross section as a component of the energy spectrum is a spectral estimation. Its consistency can be ensured by further averaging.
Expression (32) is the basis of a modified algorithm for synthesizing apertures in onboard radars with planar antenna array. In contrast to the classical algorithm for synthesizing the aperture, which integrates the product of the received signal and the reference equal to a single signal, the modified algorithm additionally performs decorrelation of signals reflected from Earth’s surface, which consists of their integration with . As a result, the characteristic speckle intervals will be much smaller than in the classical aperture synthesis. The decorrelation procedure provides a certain subdivision and can be performed using an inverse filter with a pulse response , which is usually used to solve incorrect inverse problems of recovery of various functions and, in particular, images [29].
For further analysis (32) rewrite the unit signal
where
Taking into account the presented single signal, we will rewrite the optimal output effect as follows:
where
is the complex envelope of the unit signal, is the complex envelope of the observation equation, is the vector of directing cosines that change in time proportionally to the motion of the aircraft.
The obtained method of processing space–time signals (35) is general and fair for solving many problems of estimating the parameters of useful signals. However, the general expression in solving partial problems acquires a number of new properties that characterize the features of the construction of algorithms for a particular geometry of problems. Assume that the area of the registration of the reflected signals is discrete, consisting of a set of elementary antennas, which together form the antenna array. The model of the observation equation for such a discrete disclosure has the form:
In this case the algorithm (35) is written in matrix form
where is the vector-column of the received signals (dimension ), is the transposition sign, is the matrix of spatial matching filter with dimension , is the vector-column of amplitude phase distribution with dimension .
The essence of processing the received space–time signals according to (38) is as follows. Initially, the received oscillations from the output of each element of the antenna array are processed in a spatial filter with a pulse response . Then the space–time signals are bleached in the space filter . The resulting signals are processed in a beam synthesizer, which performs a spatial discrete Fourier transform and forms a beam fan in all directions. As the aircraft moves, each individual beam at each time moves in space so that its maximum is always directed to a selected point on the surface. The next stage of processing is the decorrelation of signals over time in a filter with a pulse response . The coordinated filtering unit performs coherent detection of the amplitudes of the received and decorrelated signals from the directions and coherent accumulation of the reflected signals along the flight path of the aircraft. Coherent phase shift in the reference signal leads to the formation of an artificial aperture, the length of which is equal to the product of the speed of the aircraft and the synthesis time. In this case, the synthesis time is determined by the focusing time on the selected point on the surface.
4. Discussion
To discuss effectiveness of the optimal method of incoherent imaging in radars with planar antenna array and processing of stochastic space–time signals a semi-natural experiment was performed on digital records of real radio-holograms of aircraft synthetic aperture radar. Such data (raw radar images) were obtained according to the program of cooperation with 14 research institutes in China, which specializes in the development of radars. In Figure 3 it is shown the whole “raw images” obtained from the side view radar and in the Figure 4 it is shown part of the radio hologram of the mirror point on the surface. In the digital radio hologram, the pixel number is plotted on the abscissa and ordinate axes.
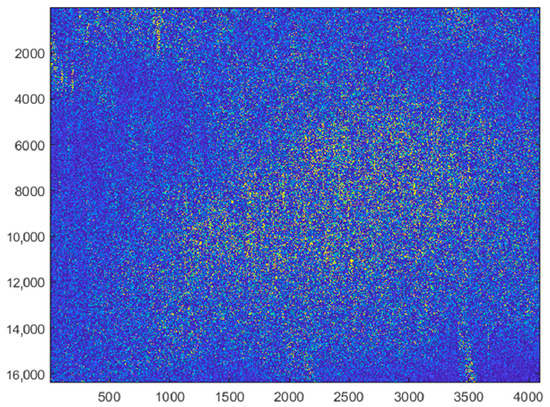
Figure 3.
Radar data before processing (“raw” data)—the whole image.
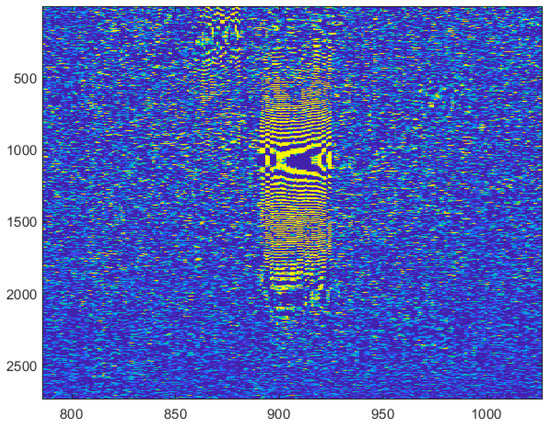
Figure 4.
Part of the digital radio hologram of the mirror point on the surface.
The radar image recovered by the proposed method is shown in Figure 5. In Figure 6 the results of comparative analyses are shown—the radar images obtained by the classical method of signal processing (Figure 6a,c) and the new synthesized method (Figure 6b,d).
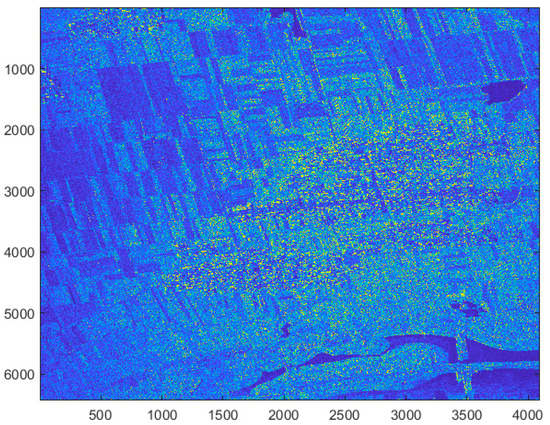
Figure 5.
The radar image recovered by the proposed method.
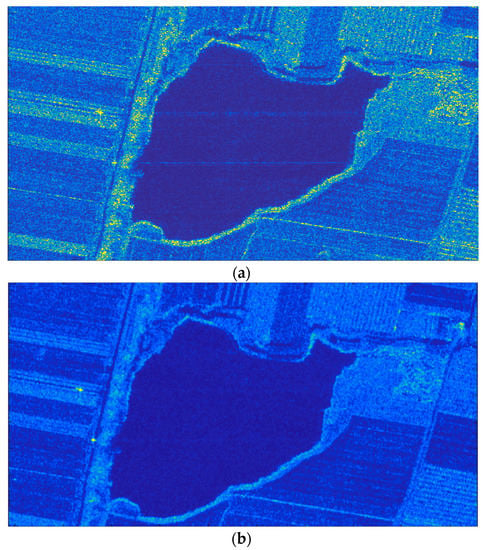
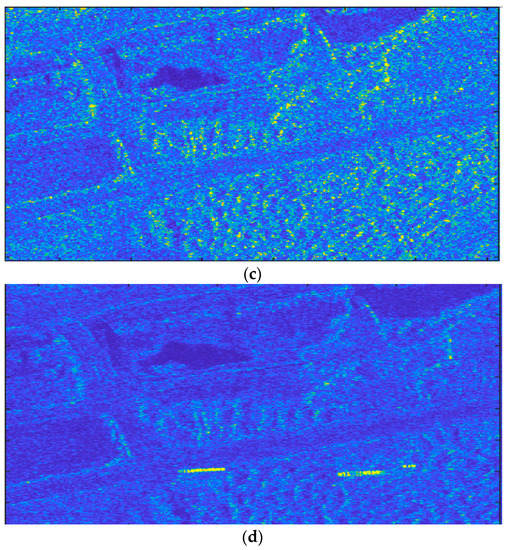
Figure 6.
The result of the radar imaging: (a,c)—parts of the image obtained by the classical method; (b,d)—more informative image obtained in accordance with the new method of signal processing.
All of the images in Figure 6 were not filtered; only the signal processing algorithm was implemented. In the image processed by the new method, the level of speckle noise is lower, the boundaries of objects are more clearly observed, and objects are detected (two bright points in Figure 6b and two extended objects in Figure 6d, which are the most likely to be cars moving on the road), which are hidden by noise in Figure 6a,b.
The reference quality metrics were used in order to quantify the quality of processing of received space–time signals in radars with planar antenna array on digital records of real radio holograms. The result of averaging 1000 estimates is shown in Table 1.

Table 1.
Quantitative assessments of the quality of coherent image recovery.
From the analysis of the results given in Table 1 it follows that the proposed method has a higher quality and a smaller amount of speckle noise.
5. Conclusions
The article shows how to overcome the contradiction between existing high-tech achievements of technical solutions of imaging radars and undeveloped statistical theory of optimal stochastic signals processing in such airborne radars. The developed models of signals, noises and observation equations allow researchers to describe geometries of imaging by multichannel and multi-view aerospace radars. It is supposed that receiving signals can be formed in any time, any point of receiving antenna and from any point of the surface. The proposed statistical approach of new methods synthesis enables the potential information to be calculated from observation equation. One of the main advantages of this theory is the analytical expression for marginal errors estimation. The solution of the particular problem of optimal radar cross section estimation in onboard imaging radars gave several new results. In contrast to the known heuristic methods of incoherent imaging it is proposed operation of whitening the received signals in the adaptive decorrelation filter. The proposed decorrelation operation in proportion to the signal-to-noise ratio expands the range of received signals, bringing them closer to white noise, and, thus, provides superresolution while coherent and incoherent imaging. These results were proved by a semi-natural experiment. In sum a statistical theory of radar cross section estimation as an incoherent image of the observation region in aerospace radars with antenna array has been developed.
Author Contributions
Conceptualization, V.V.; methodology, S.Z. All authors have read and agreed to the published version of the manuscript.
Funding
The work was funded by the Ministry of Education and Science of Ukraine. The state registration numbers of the projects are 0120U102082, 0119U100968, 0121U109600, and 0121U109598.
Institutional Review Board Statement
Not applicable.
Informed Consent Statement
Not applicable.
Data Availability Statement
Not applicable.
Conflicts of Interest
The authors declare no conflict of interest.
References
- Kotel’nikov, V.A. The Theory of Optimum Noise Immunity; McGraw-Hill Book, Co.: New York, NY, USA, 1959. [Google Scholar]
- Middlton, D. Introduction to Statistical Communication Theory; Sovetskoye radio: Moscow, Russia, 1961–1962; Volume 1–2. (In Russian) [Google Scholar]
- Woodward, F.M. Probability Theory and Information Theory with Application to Radar; Pergamon: New York, NY, USA, 1964. [Google Scholar]
- Bakut, P.A.; Tartakovsky, G.P. Questions of the Statistical Theory of Radar; Sovetskoye radio: Moscow, Russia, 1963. (In Russian) [Google Scholar]
- Falkovich, S.E.; Ponomarev, V.I.; Shkvarko, Y.V. Optimal Reception of Space-Time Signals in Radio Channels with Scattering; Radio i svyaz: Moscow, Russia, 1989. (In Russian) [Google Scholar]
- Falkovich, S.E.; Kostenko, P.Y. Fundamentals of the Statistical Theory of Radio Engineering Systems: A Tutorial; Kharkiv Aviation Institute: Kharkov, Russia, 2005. (In Russian) [Google Scholar]
- Falkovich, S.E. Signal Parameters Estimation; Sovetskoye radio: Moscow, Russia, 1970. (In Russian) [Google Scholar]
- Volosyuk, V.K.; Kravchenko, V.F. Statistical Theory of Radio Engineering Systems for Remote Sensing and Radar; Fizmatlit: Moscow, Russia, 1988. (In Russian) [Google Scholar]
- Gutkin, L.S. Theory of Optimal Radio Reception Methods with Fluctuation Interference; Gosenergoizdat: Leningrad, Russia, 1961. (In Russian) [Google Scholar]
- Levin, B.R. Theoretical Foundations of Statistical Radio Engineering; Sovetskoye radio: Moscow, Russia, 1969. (In Russian) [Google Scholar]
- Shirman Ya, D.; Manzhos, V.N. Theory and Technique of Processing Radar Information Against the Background of Interference; Radio i svyaz: Moscow, Russia, 1981. (In Russian) [Google Scholar]
- Kremer, I. Spatial-Temporal Signal Processing; Moscow Izdatel Radio Sviaz: Moscow, Russia, 2004; 204p. [Google Scholar]
- Stratonovich, R. Selected Questions of Fluctuation Theory in Radio Engineering; Sov. Radio: Moscow, Russia, 1961. (In Russian) [Google Scholar]
- Stratonovich, R.L. On the theory of optimal non-linear filtration of random functions. Theory Prob. Appl. 1959, 4, 223–225. [Google Scholar]
- Stratonovich, R.L. Application of the Markov processes theory to optimum filtration of signals. Radio Eng. Electron. Phys. 1960, 5, 1–19. [Google Scholar]
- Tikhonov, V.I. Statistical Radio Engineering; Radio i svyaz: Moscow, Russia, 1982. (In Russian) [Google Scholar]
- Tikhonov, V.I. Optimal Signal Reception; Radio i svyaz: Moscow, Russia, 1983. (In Russian) [Google Scholar]
- Klyatskin, V.I. Stochastic Equations: Theory and Applications in Acoustics, Hydrodynamics, Magnetohydrodynamics, and Radiophysics, Volume 1: Basic Concepts, Exact Results, and Asymptotic Approximations. Understanding Complex Systems; Springer International Publishing: Berlin/Heidelberg, Germany, 2015. [Google Scholar]
- Tan, S. Multiple Volume Scattering in Random Media and Periodic Structures with Applications in Microwave Remote Sensing and Wave Functional Materials. Ph.D. Thesis, University of Michigan, Ann Arbor, MI, USA, 2016. [Google Scholar]
- Tang, K.; Buckius, R.O. A statistical model of wave scattering from random rough surfaces. Int. J. Heat Mass Transf. 2001, 44, 4059–4073. [Google Scholar] [CrossRef]
- Mishchenko, M.I.; Liu, L.; Mackowski, D.W.; Cairns, B.; Videen, G. Multiple scattering by random particulate media: Exact 3D results. Opt. Express 2007, 15, 2822–2836. [Google Scholar] [CrossRef] [PubMed]
- Volosyuk, V.K.; Pavlikov, V.V.; Zhyla, S.S. Phenomenological Description of the Electromagnetic Field and Coherent Images in Radio Engineering and Optical Systems. In Proceedings of the 2018 IEEE 17th International Conference on Mathematical Methods in Electromagnetic Theory (MMET), Kyiv, Ukraine, 2–5 July 2018; pp. 302–305. [Google Scholar] [CrossRef]
- Yang, Y.; Chen, K.; Shang, G. Surface Parameters Retrieval from Fully Bistatic Radar Scattering Data. Remote Sens. 2019, 11, 596. [Google Scholar] [CrossRef]
- Zeng, J.Y.; Chen, K.S.; Bi, H.Y.; Zhao, T.J.; Yang, X.F. A comprehensive analysis of rough soil surface scattering and emission predicted by AIEM with comparison to numerical simulations and experimental measurements. IEEE Trans. Geosci. Remote Sens. 2017, 55, 1696–1708. [Google Scholar] [CrossRef]
- Liao, T.H.; Tsang, L.; Huang, S.; Niamsuwan, N.; Jaruwatanadilok, S.; Kim, S.B.; Ren, H.; Chen, K.L. Co-polarized and cross-polarized backscattering from random rough soil surfaces from L-band to Ku-band using numerical solutions of Maxwell’s equations with near-field precondition. IEEE Trans. Geosci. Remote Sens. 2016, 54, 651–662. [Google Scholar] [CrossRef]
- TTeperik, V.; Archambault, A.; Marquier, F.; Greffet, J.J. Huygens-Fresnel principle for surface plasmons. Opt. Express 2009, 17, 17483–17490. [Google Scholar] [CrossRef] [PubMed]
- Chu, H.; Qi, J.; Wang, R.; Qiu, J. Generalized Rayleigh-Sommerfeld Diffraction Theory for Metasurface-Modulating Paraxial and Non-Paraxial Near-Field Pattern Estimation. IEEE Access 2019, 7, 57642–57650. [Google Scholar] [CrossRef]
- Klyatskin, V.I. Stochastic Equations Through the Eye of the Physicist; Elsevier: Amsterdam, The Netherlands, 2005. [Google Scholar]
- Vasilenko, G.I.; Taratorin, A.M. Image Recovery; Radio i svyaz: Moscow, Russia, 1986. [Google Scholar]
Publisher’s Note: MDPI stays neutral with regard to jurisdictional claims in published maps and institutional affiliations. |
© 2022 by the authors. Licensee MDPI, Basel, Switzerland. This article is an open access article distributed under the terms and conditions of the Creative Commons Attribution (CC BY) license (https://creativecommons.org/licenses/by/4.0/).