
Real-Scale Study on Methane and Carbon Dioxide Emission Reduction from Dairy Liquid Manure with the Commercial Additive SOP LAGOON
 , , ,
, , ,  ,
,  ,
, 
Abstract
1. Introduction
2. Materials and Methods
2.1. Site and Manure Management Description
2.2. Slurry Analysis
2.3. Emission and Fluxes Determination
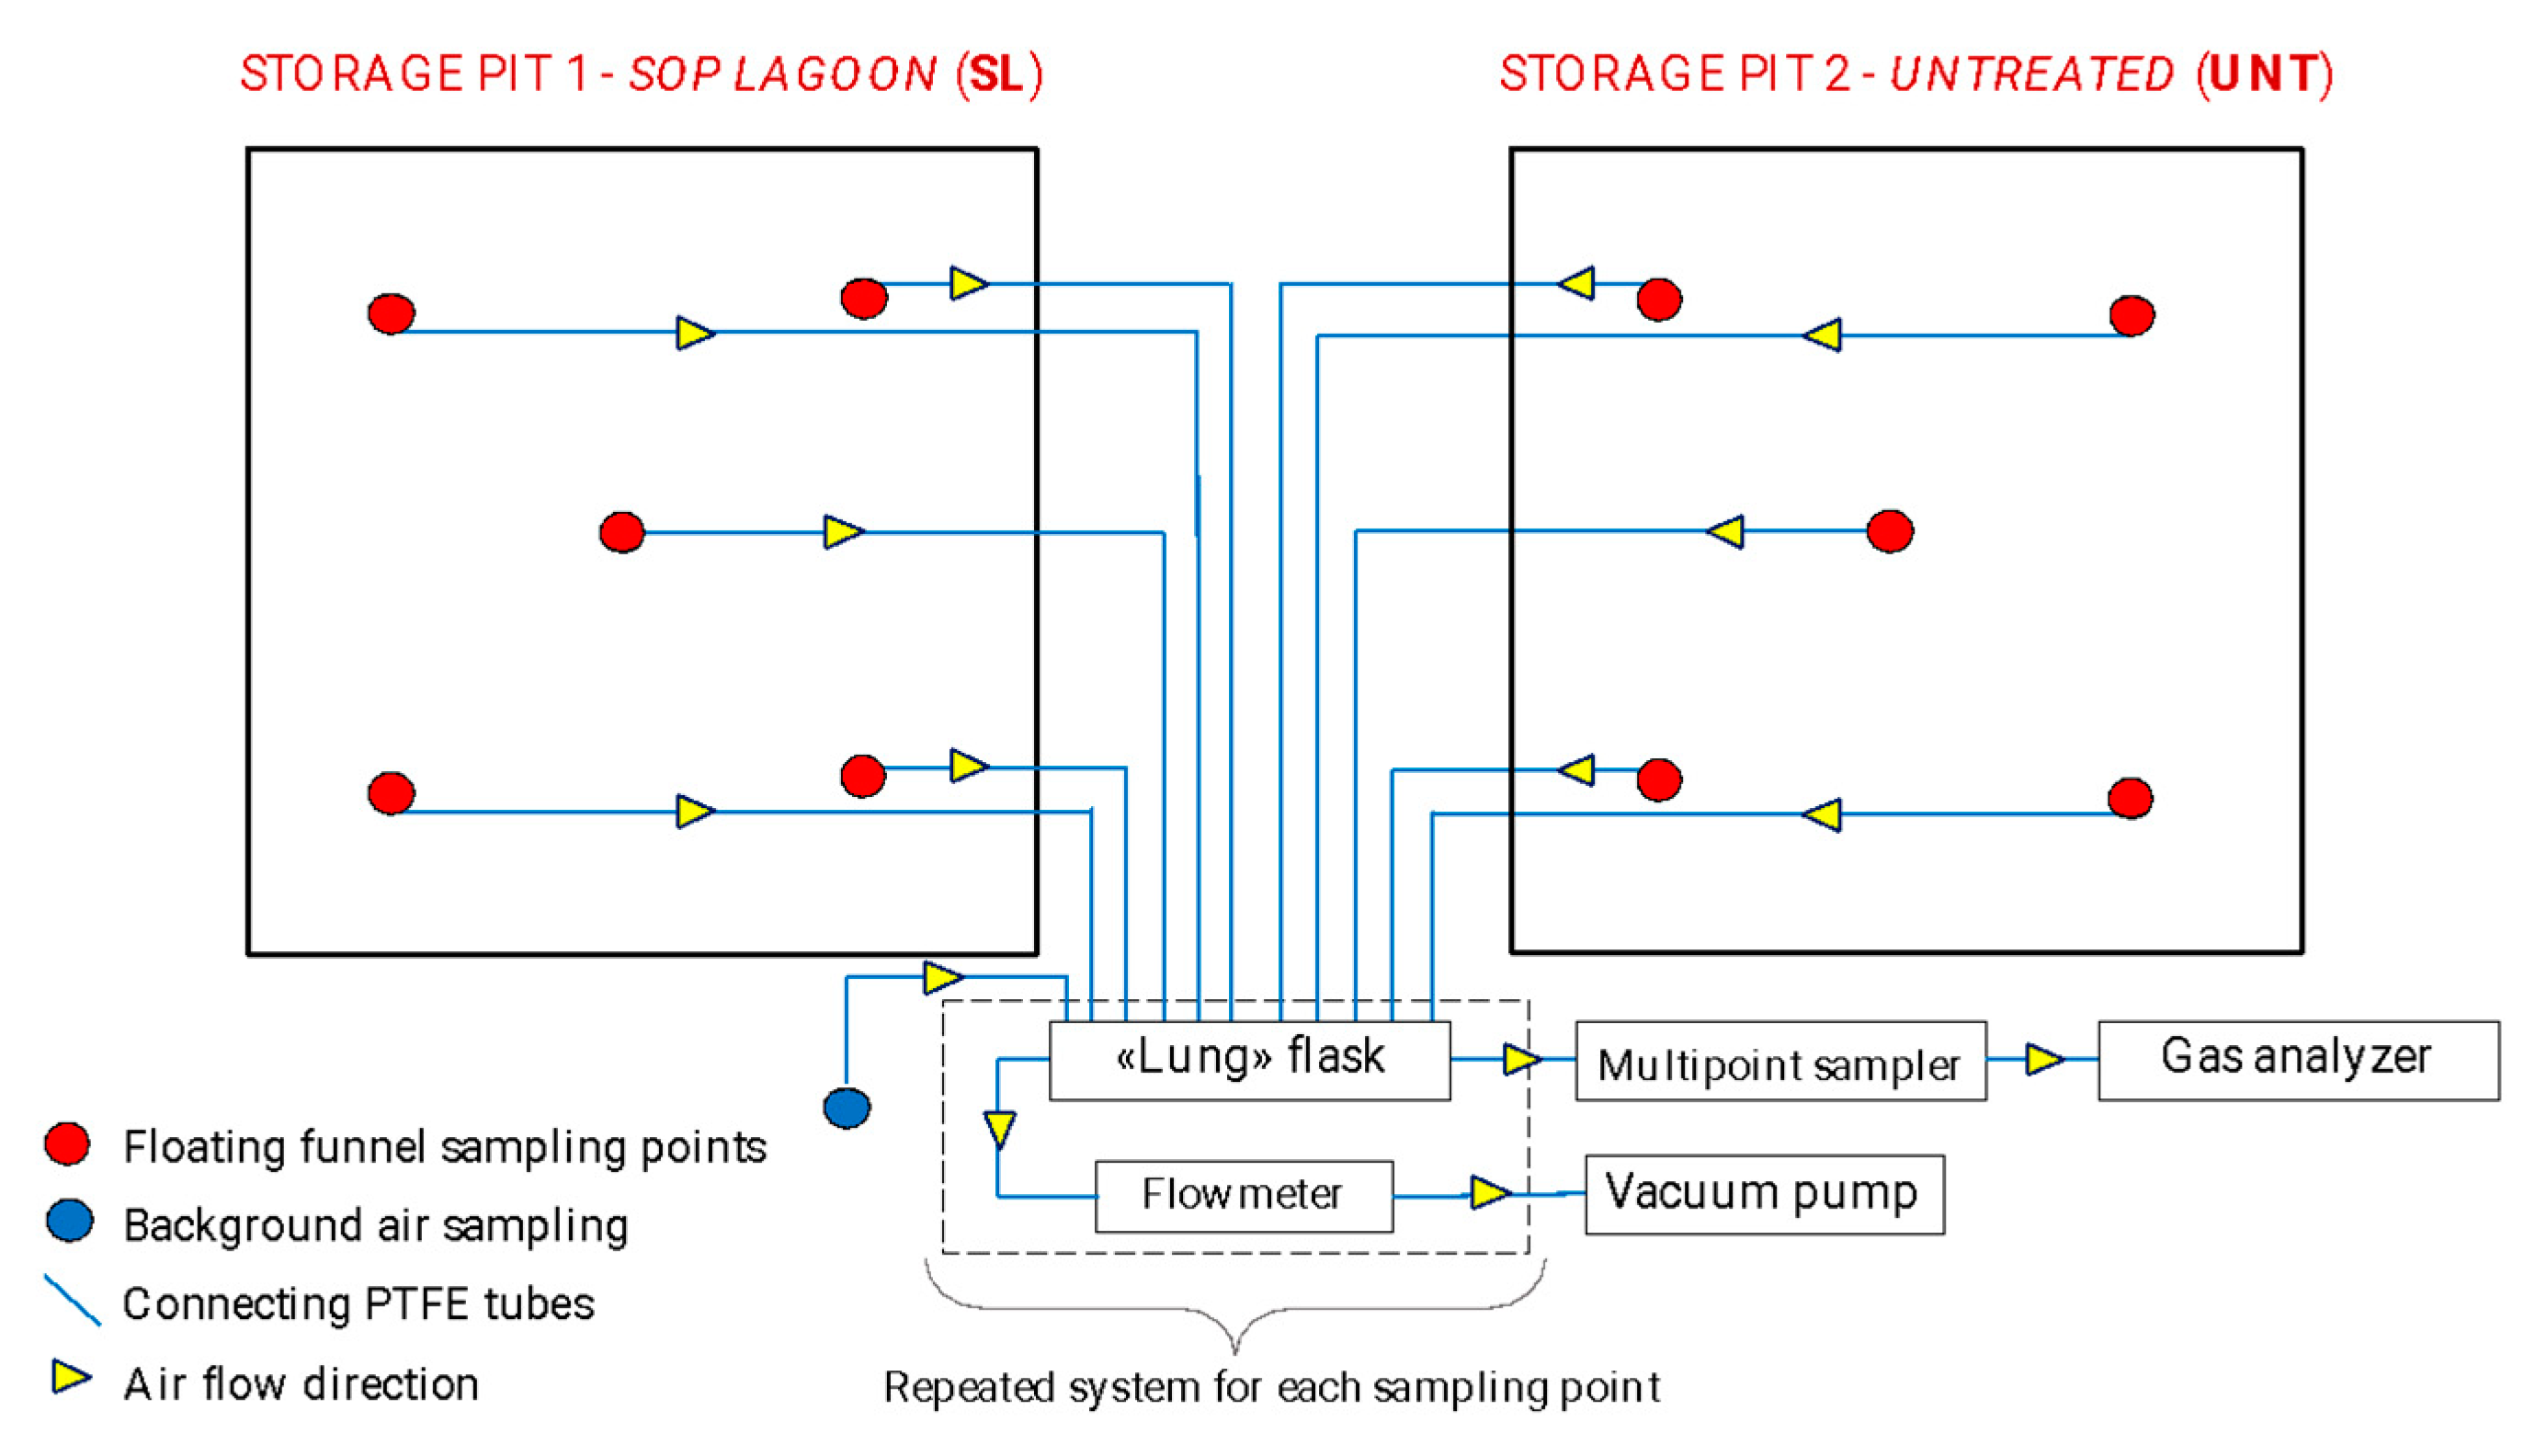
- Floating PVC funnels, positioned on the slurry surface. The funnels have a diameter of 42 cm. Each funnel covers a surface equal to approximately 0.14 m2, for a total covered area for each pit of approximately 0.7 m2, thus greater than the 0.5 m2 suggested by the aforementioned VERA protocol;
- PTFE tubes that connected each floating funnel with a corresponding “lung flask”, hermetically sealed with rubber stoppers. Utilizing a vacuum generated by a pump positioned downstream of the system, the air was sucked by the multi-component gas analyzer from each lung flask, passing through a multipoint gas sampler. The use of external pumps was necessary to support the emissive flow towards the lung flasks, because the vacuum generated by the small pump bundled with the multi-component gas analyzer was insufficient to overcome the hydraulic resistance of the PTFE tubes (several tens of meters long);
- A 12-way multipoint gas sampler (MGS) to which the floating funnels in the two slurry tanks (five for the UNT and five for the SL) were connected via IN channels. An additional channel was used to sample the background air (“white”) to check the atmospheric concentration of the gases under study. The multipoint gas sampler device allows the user to open one channel at a time, via solenoid valves, for a chosen time interval and to define the order of the opening and closing of the different channels. Finally, the MGS was connected via the OUT channel to the gas analyzer: a real time assessment of gases was done with a high-resolution spectrometer (ETG FTIR 9500, Chivasso, Italy) that exploits the Fourier transformed IR spectroscopy (FTIR) technique. The instrument collects a complete infrared spectrum at regular intervals, which is scanned in full, allowing the simultaneous detection and measurement of different gases present in the air at a given time. The measurement time interval, and the unit of measurement with which to express the gas concentration (mg/m3 or ppm), can be set manually. The instrument has a resolution of 0.01 ppm for CH4 and 1 ppm for CO2.
- F is the GHG flux (mg/m2/h);
- Q is the air flow (m3/h);
- Cin is the gas concentration in the air above the slurry surface, sampled by the funnel system (mg/m3);
- Cout is the corresponding background gas air concentration (mg/m3);
- A is the surface of the funnel (m2).
2.4. Data Analysis
3. Results
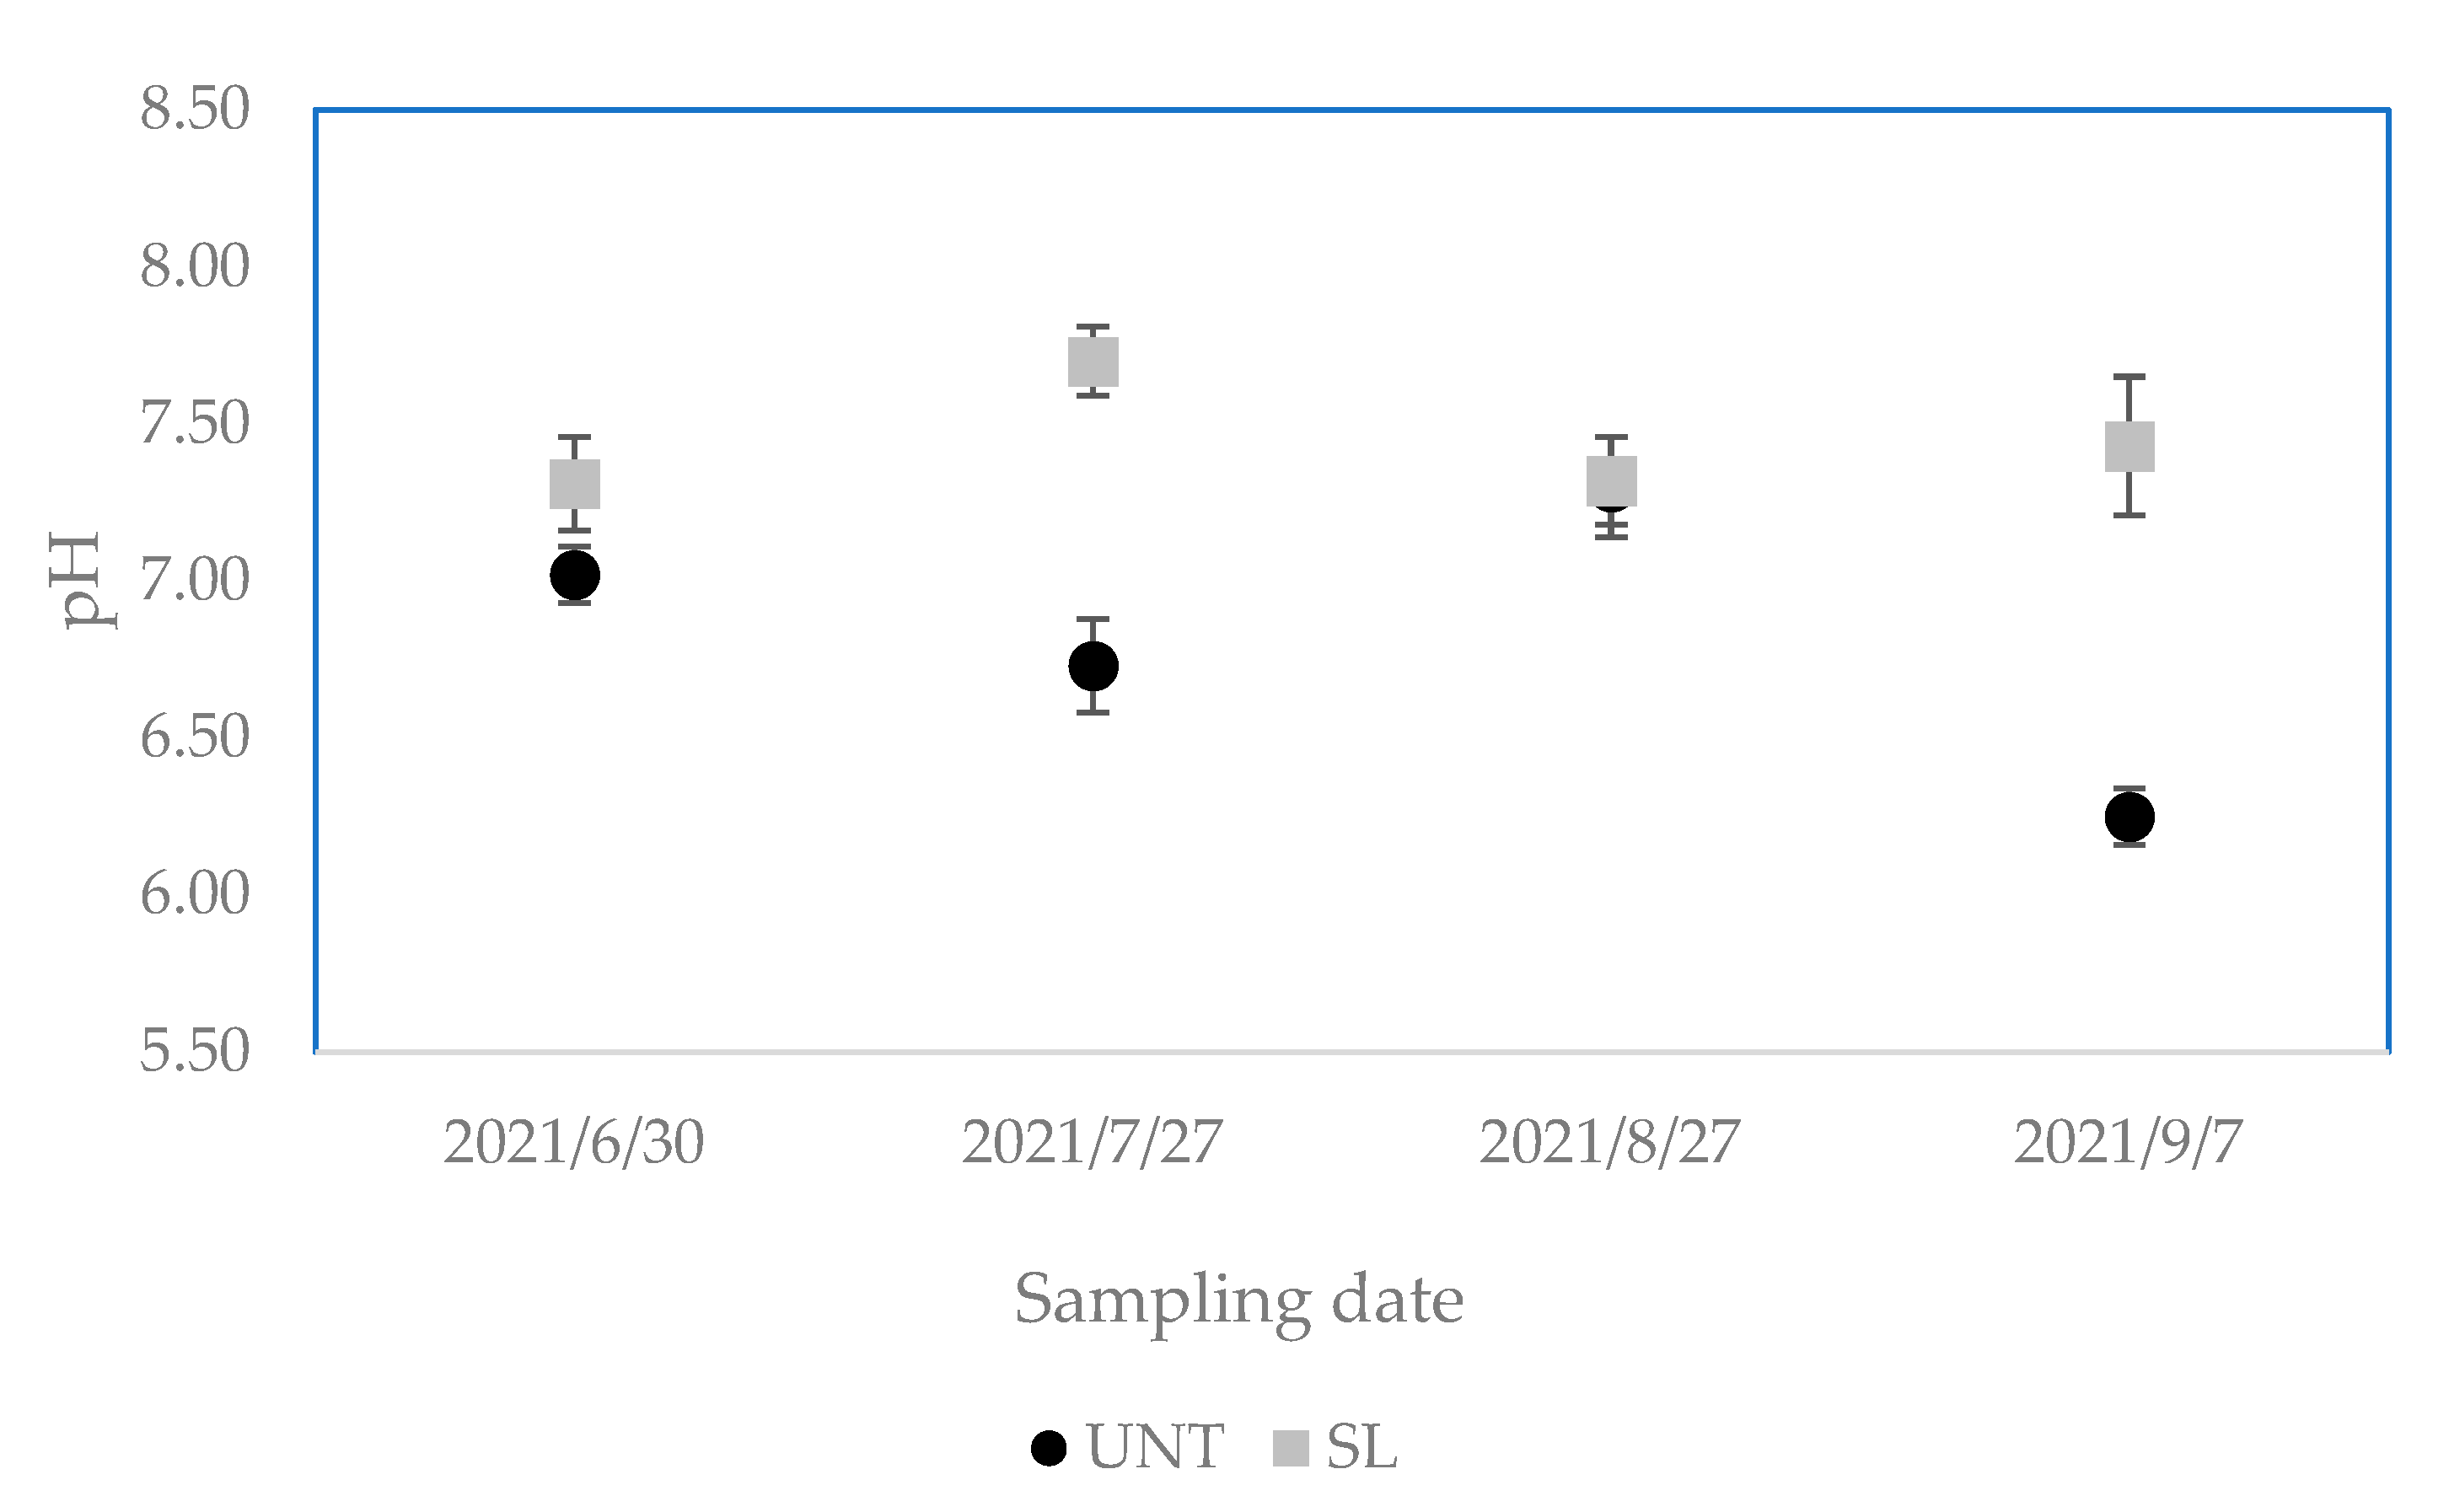
3.1. Slurry Chemical Characteristics

| Variable | Value |
|---|---|
| TS (%) | 8.43 ± 0.12 |
| VS (% TS) | 74.25 ± 0.5 |
| TKN (g/kg) | 3.70 ± 0.06 |
| TAN (g/kg) | 1.69 ± 0.03 |
| TAN (% TKN) | 0.46 ± 0.01 |
| Organic Carbon (%DM) | 40.20 ± 0.20 |
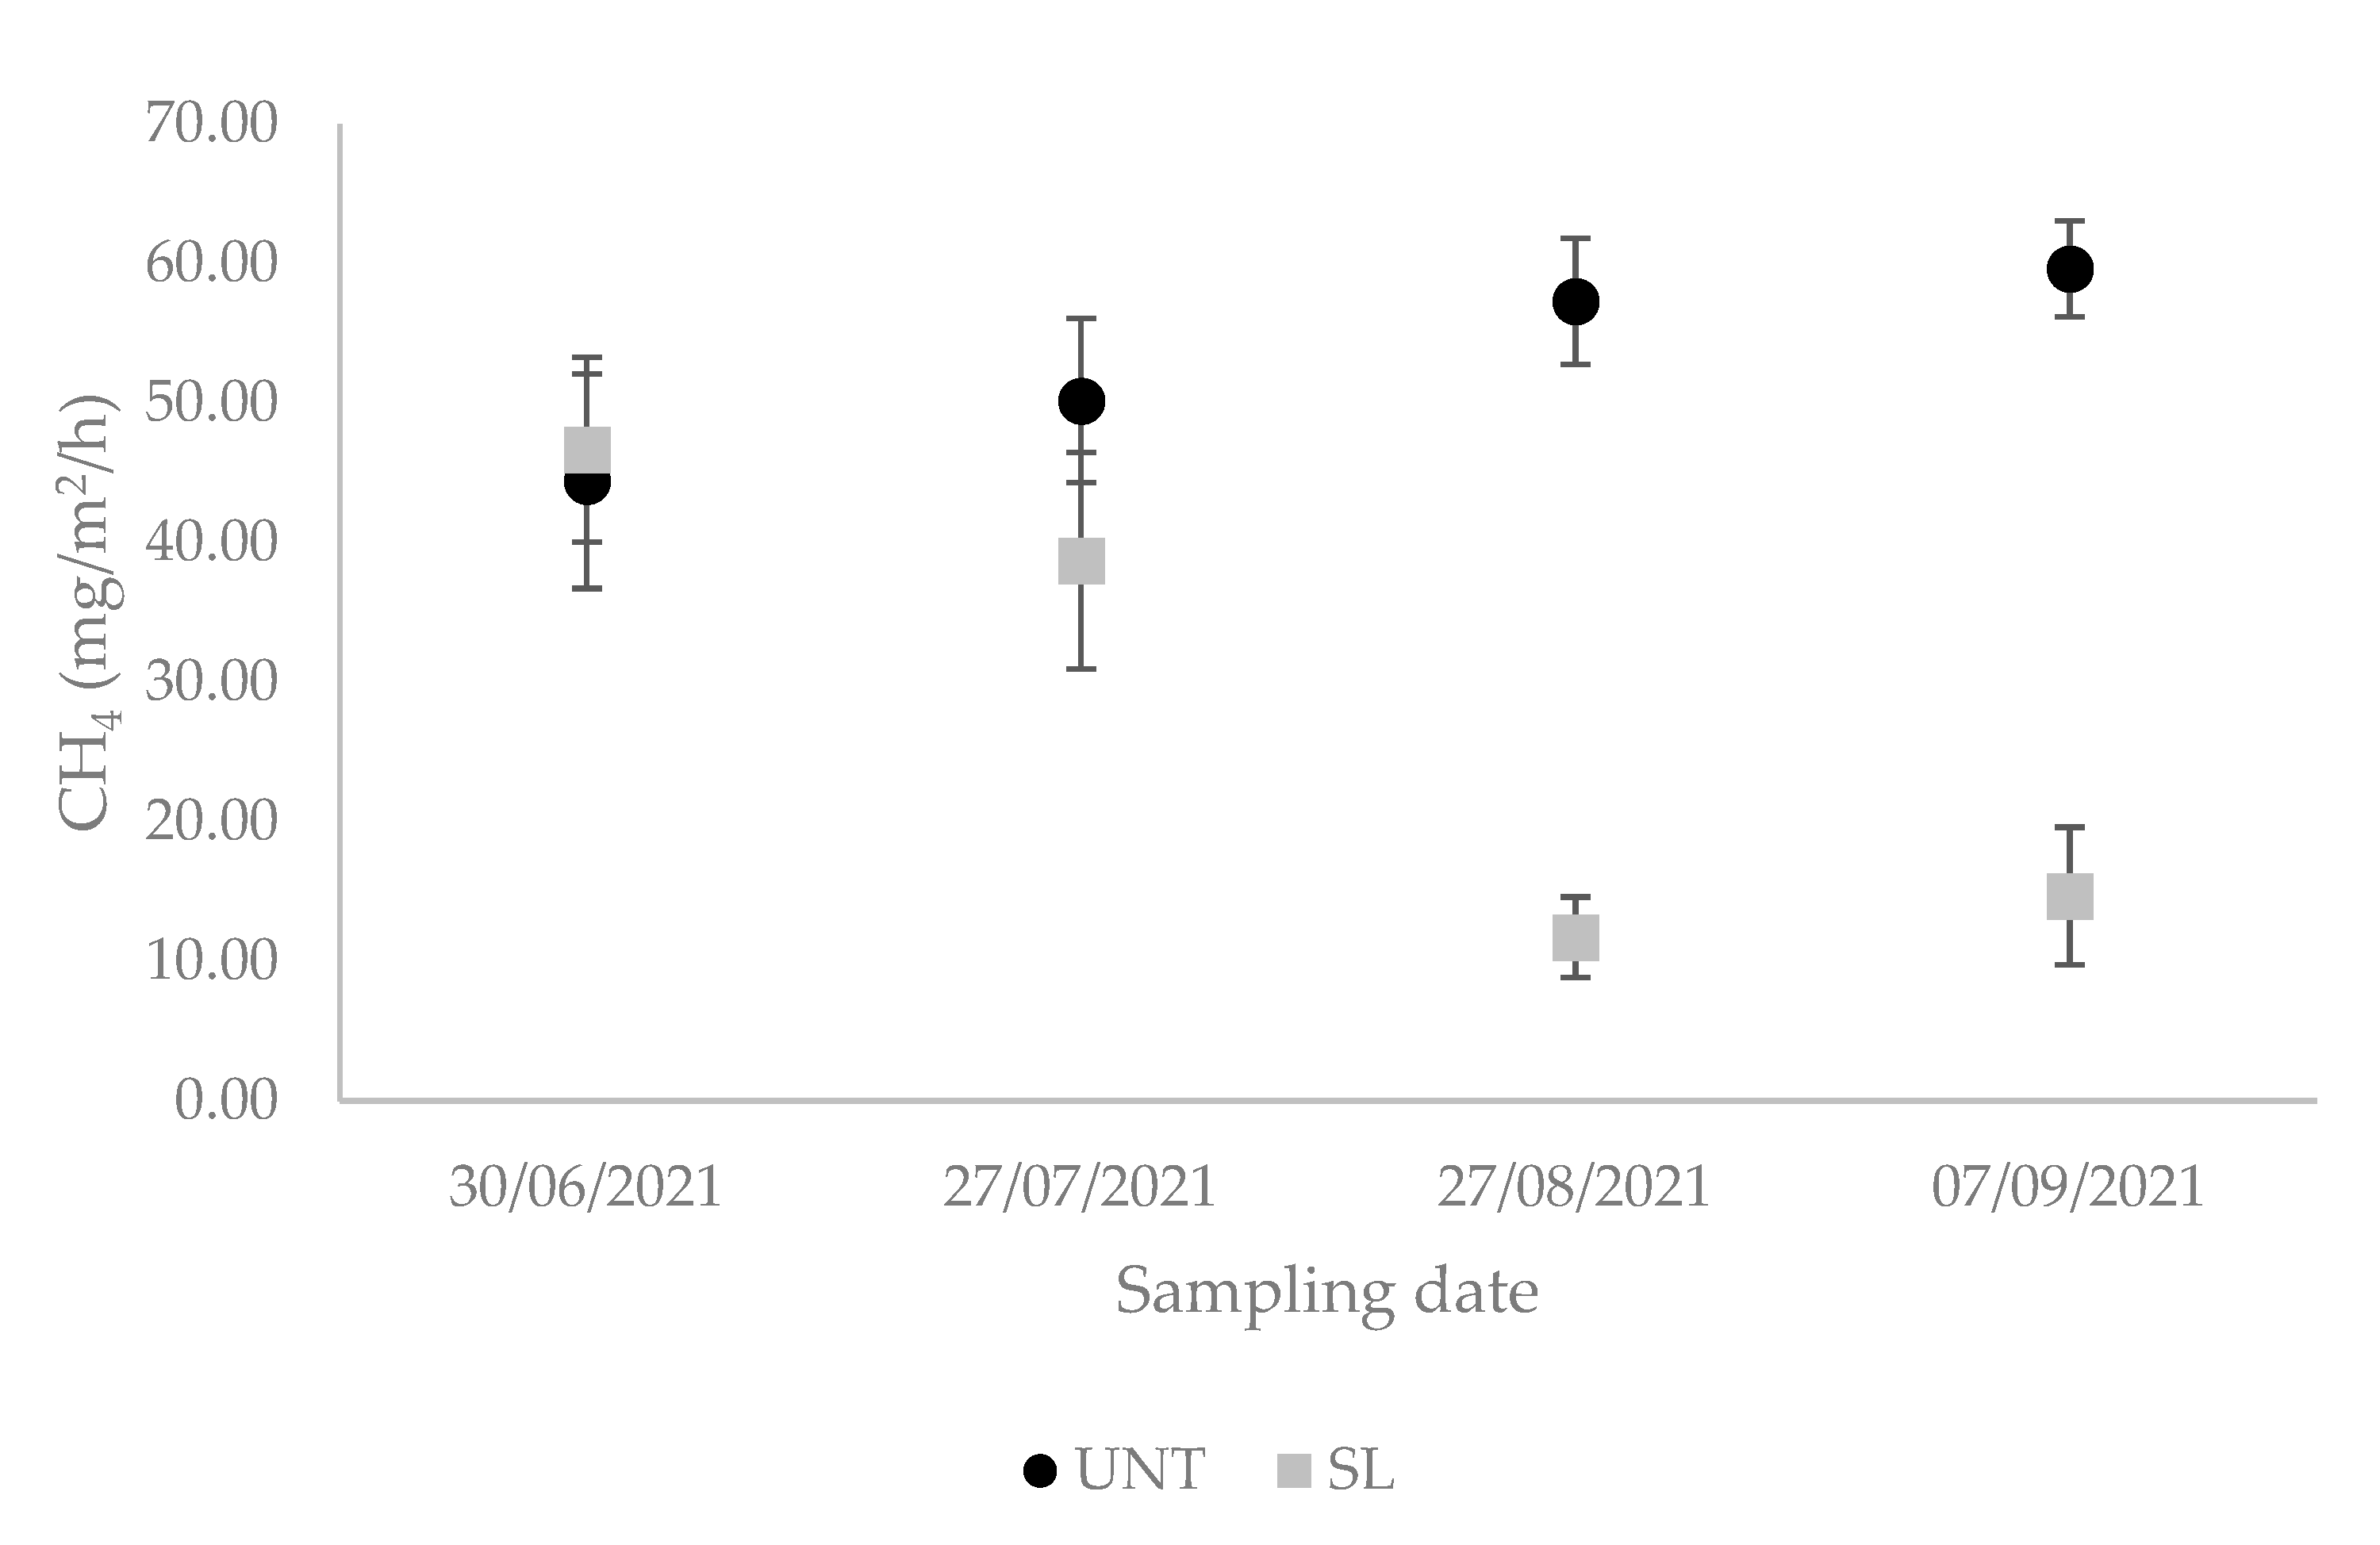
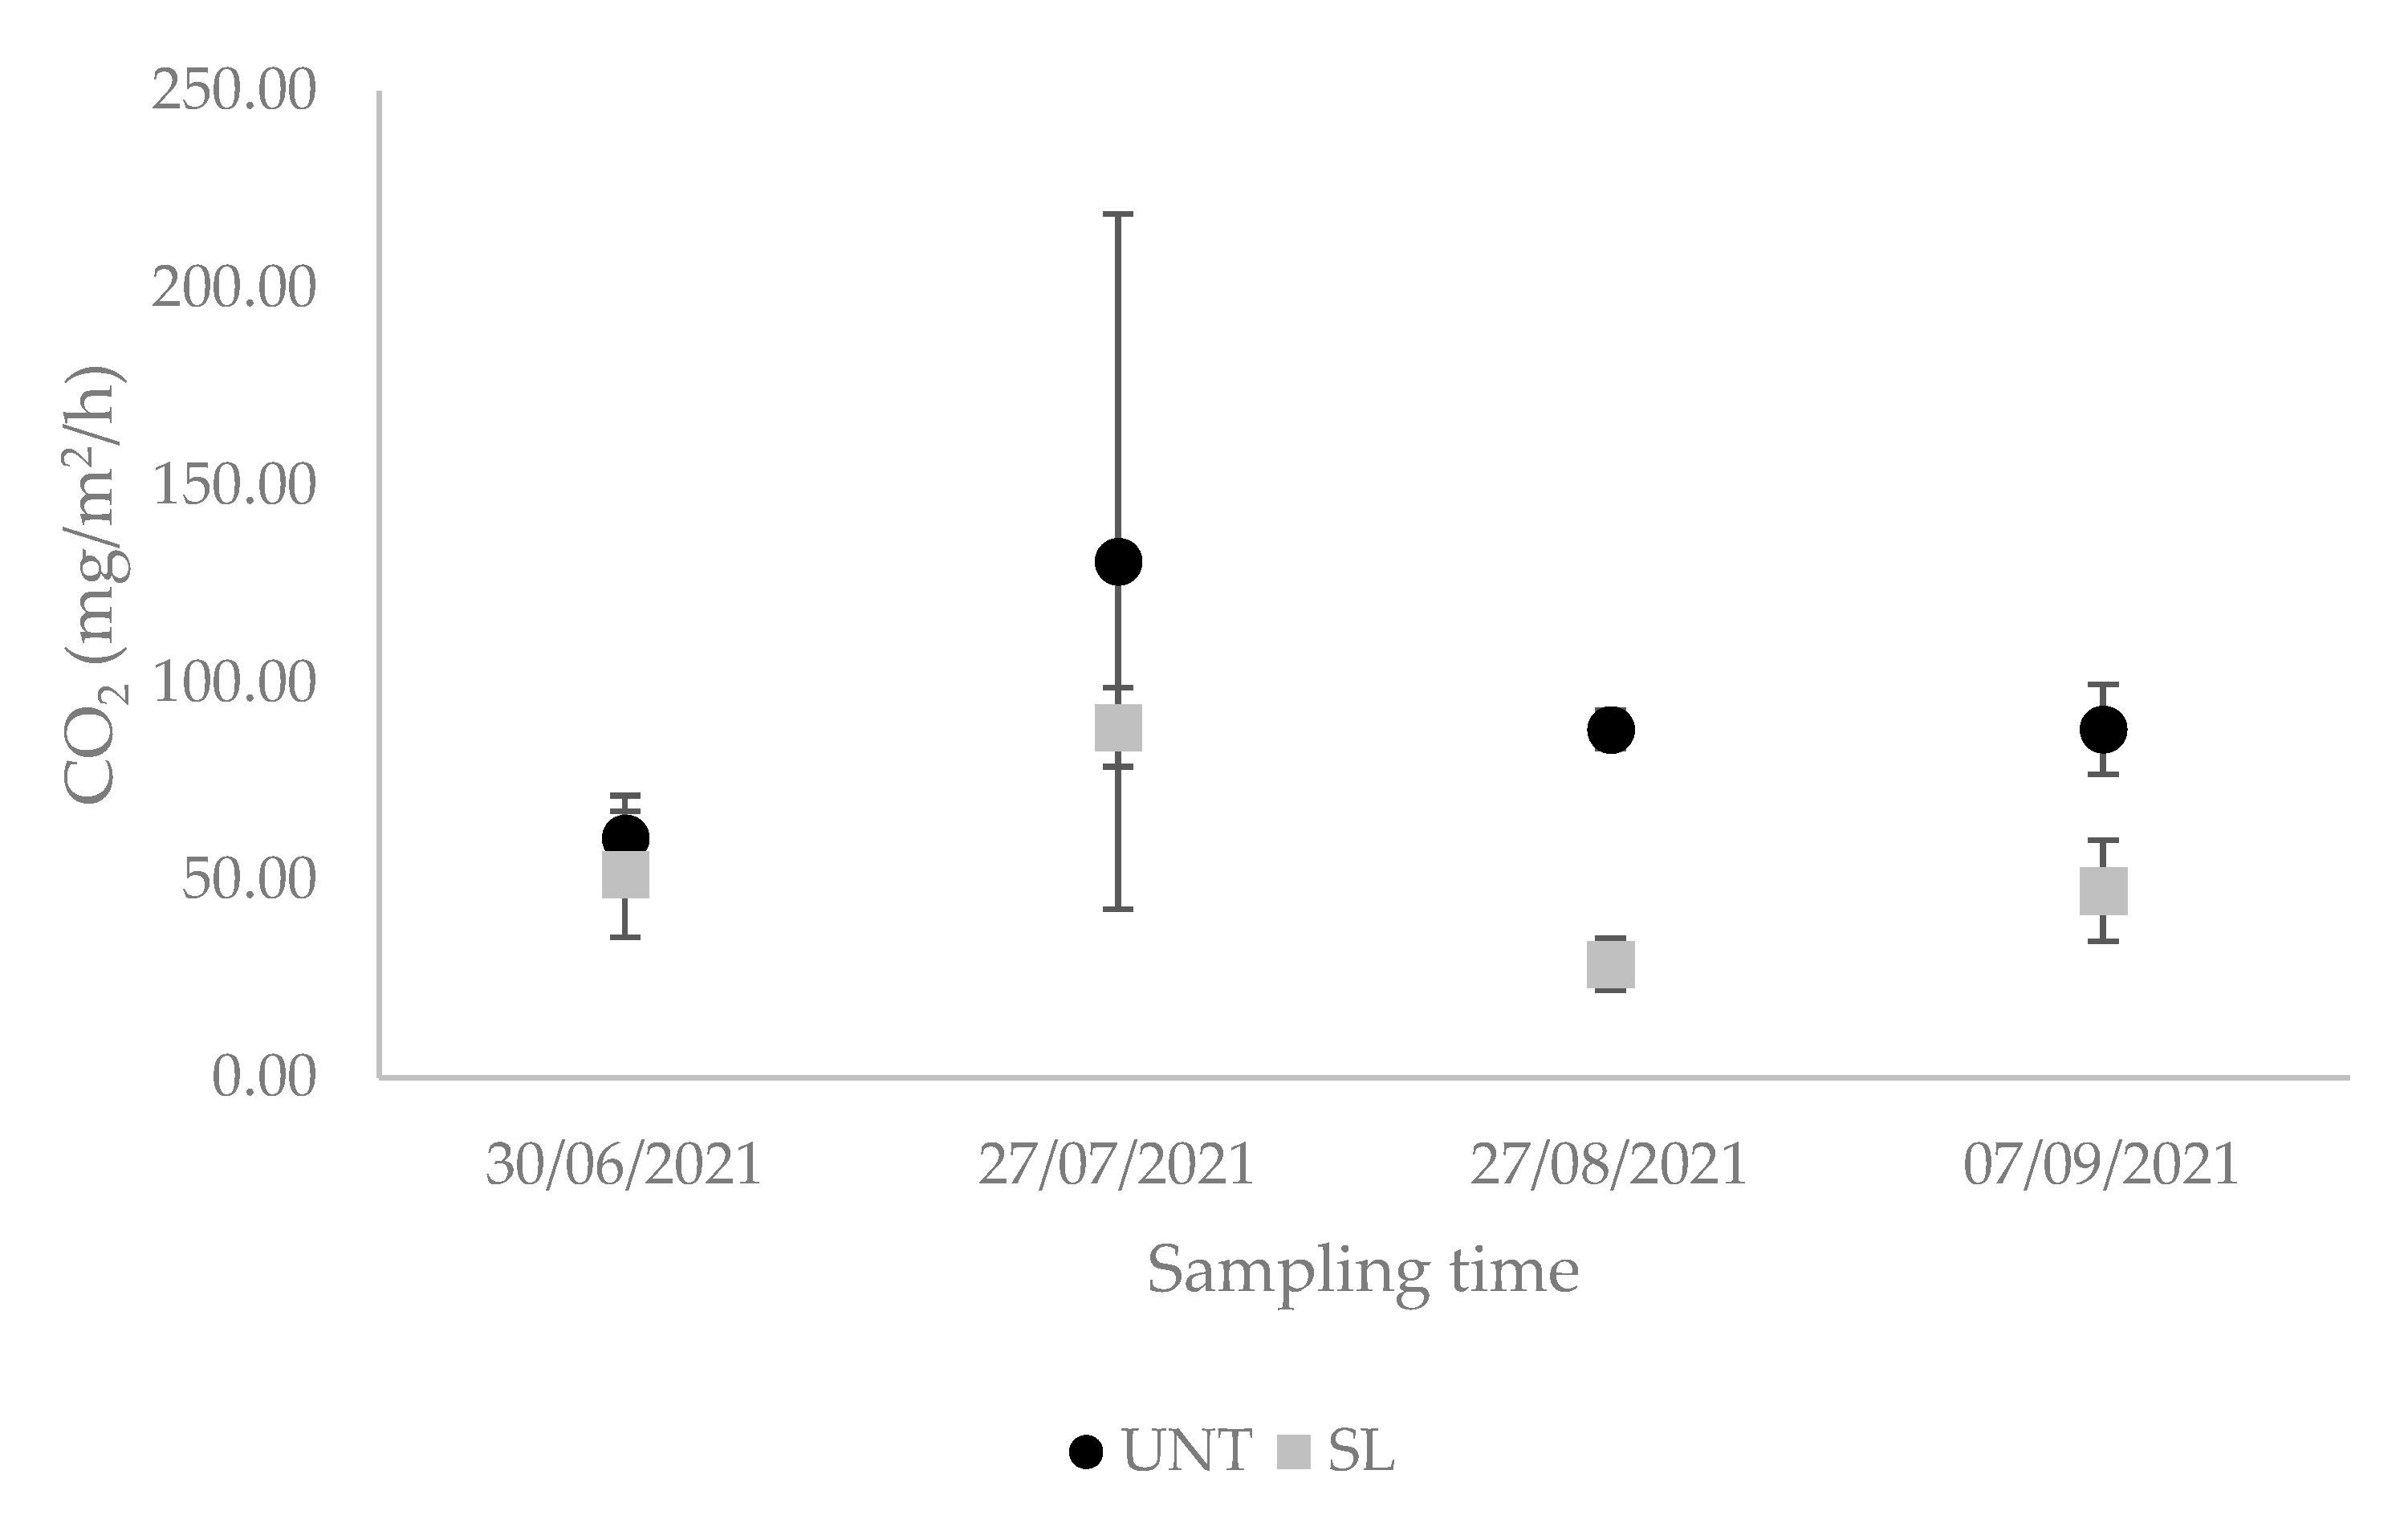
3.2. Gas Emissions
3.3. Additional Observations
4. Discussions
Additional Considerations
5. Conclusions
Author Contributions
Funding
Institutional Review Board Statement
Informed Consent Statement
Data Availability Statement
Conflicts of Interest
References
- Climate Change 2022: Impacts, Adaptation and Vulnerability. In Contribution of Working Group II to the Sixth Assessment Report of the Intergovernmental Panel on Climate Change; Pörtner, H.-O., Roberts, D.C., Tignor, M.M.B., Poloczanska, E.S., Mintenbeck, K., Alegría, A., Craig, M., Langsdorf, S., Löschke, S., Möller, V., et al., Eds.; Cambridge University Press: Cambridge, UK; New York, NY, USA, 2022; p. 3056. [Google Scholar] [CrossRef]
- WMO Update: 50:50 Chance of Global Temperature Temporarily Reaching 1.5 °C Threshold in Next Five Years. Available online: https://public.wmo.int/en/media/press-release/wmo-update-5050-chance-of-global-temperature-temporarily-reaching-15%C2%B0c-threshold (accessed on 14 December 2022).
- Clark, M.A.; Domingo, N.G.G.; Colgan, K.; Thakrar, S.K.; Tilman, D.; Lynch, J.; Azevedo, I.L.; Hill, J.D. Global Food System Emissions Could Preclude Achieving the 1.5° and 2°C Climate Change Targets. Science 2020, 370, 705–708. [Google Scholar] [CrossRef] [PubMed]
- Sun, X.; Wang, P.; Ferris, T.; Lin, H.; Dreyfus, G.; Gu, B.-H.; Zaelke, D.; Wang, Y. Fast Action on Short-Lived Climate Pollutants and Nature-Based Solutions to Help Countries Meet Carbon Neutrality Goals. Adv. Clim. Change Res. 2022, 13, 564–577. [Google Scholar] [CrossRef]
- Xu, Y.; Ramanathan, V. Well below 2 °C: Mitigation Strategies for Avoiding Dangerous to Catastrophic Climate Changes. Proc. Natl. Acad. Sci. USA 2017, 114, 10315–10323. [Google Scholar] [CrossRef] [PubMed]
- Methane Emissions. Available online: https://energy.ec.europa.eu/topics/oil-gas-and-coal/methane-emissions_en (accessed on 14 December 2022).
- Allen, M.R.; Shine, K.P.; Fuglestvedt, J.S.; Millar, R.J.; Cain, M.; Frame, D.J.; Macey, A.H. A Solution to the Misrepresentations of CO2-Equivalent Emissions of Short-Lived Climate Pollutants under Ambitious Mitigation. NPJ Clim. Atmos. Sci. 2018, 1, 16. [Google Scholar] [CrossRef]
- The Biogenic Carbon Cycle and Cattle. Available online: https://clear.ucdavis.edu/explainers/biogenic-carbon-cycle-and-cattle (accessed on 14 December 2022).
- Global Methane Pledge. Available online: https://www.globalmethanepledge.org/ (accessed on 14 December 2022).
- GMP COP27 Joint Factsheet. Available online: https://energy.ec.europa.eu/system/files/2022-11/GMP%20COP27%20Joint%20Factsheet.pdf (accessed on 14 December 2022).
- SB 1383. Available online: https://www.yubasutterrecycles.com/files/2793c2592/SB+1383.pdf (accessed on 14 December 2022).
- Brandt, A.R.; Heath, G.A.; Cooley, D. Methane Leaks from Natural Gas Systems Follow Extreme Distributions. Environ. Sci. Technol. 2016, 50, 12512–12520. [Google Scholar] [CrossRef] [PubMed]
- Regulation of the European Parliament and of the Council. Available online: https://eur-lex.europa.eu/resource.html?uri=cellar:06d0c90a-5d91-11ec-9c6c-01aa75ed71a1.0001.02/DOC_1&format=PDF (accessed on 14 December 2022).
- European Commission. An EU Methane Strategy. Available online: https://ec.europa.eu/commission/presscorner/detail/en/qanda_20_1834 (accessed on 14 December 2022).
- Climate Change and Land—IPCC. Available online: https://www.ipcc.ch/site/assets/uploads/sites/4/2020/02/SPM_Updated-Jan20.pdf (accessed on 31 December 2022).
- Emissions from Livestock and Manure Management. Available online: https://www.ipcc-nggip.iges.or.jp/public/2019rf/pdf/4_Volume4/19R_V4_Ch10_Livestock.pdf (accessed on 14 December 2022).
- Estimated Global Anthropogenic Methane Emissions by Source 2010. Available online: https://www.igsd.org/estimated-global-anthropogenic-methane-emissions-by-source-2010/ (accessed on 14 December 2022).
- The Role of the Dairy Sector in a Low-Carbon Future. Available online: https://www.fao.org/3/CA2929EN/ca2929en.pdf (accessed on 14 December 2022).
- Amon, B.; Kryvoruchko, V.; Moitzi, G.; Amon, T. Greenhouse Gas and Ammonia Emission Abatement by Slurry Treatment. Int. Congr. Ser. 2006, 1293, 295–298. [Google Scholar] [CrossRef]
- Italian Greenhouse Gas Inventory. Available online: https://www.isprambiente.gov.it/files2022/pubblicazioni/rapporti/nir2022_italy_r360.pdf (accessed on 14 December 2022).
- Current California GHG Emission Inventory Data. Available online: https://ww2.arb.ca.gov/ghg-inventory-data (accessed on 14 December 2022).
- McCauley, J.I.; Labeeuw, L.; Jaramillo-Madrid, A.C.; Nguyen, L.N.; Nghiem, L.D.; Chaves, A.V.; Ralph, P.J. Management of Enteric Methanogenesis in Ruminants by Algal-Derived Feed Additives. Curr. Pollut. Rep. 2020, 6, 188–205. [Google Scholar] [CrossRef]
- Jayanegara, A.; Sarwono, K.A.; Kondo, M.; Matsui, H.; Ridla, M.; Laconi, E.B.; Nahrowi. Use of 3-Nitrooxypropanol as Feed Additive for Mitigating Enteric Methane Emissions from Ruminants: A Meta-Analysis. Ital. J. Anim. Sci. 2018, 17, 650–656. [Google Scholar] [CrossRef]
- Honan, M.; Feng, X.; Tricarico, J.M.; Kebreab, E.; Honan, M.; Feng, X.; Tricarico, J.M.; Kebreab, E. Feed Additives as a Strategic Approach to Reduce Enteric Methane Production in Cattle: Modes of Action, Effectiveness and Safety. Anim. Prod. Sci. 2021, 62, 1303–1317. [Google Scholar] [CrossRef]
- Carrazco, A.V.; Peterson, C.B.; Zhao, Y.; Pan, Y.; McGlone, J.J.; DePeters, E.J.; Mitloehner, F.M. The Impact of Essential Oil Feed Supplementation on Enteric Gas Emissions and Production Parameters from Dairy Cattle. Sustainability 2020, 12, 10347. [Google Scholar] [CrossRef]
- Mosque, J.; Schils, R.; Groenestein, K.; Hoeksma, P.; Velthof, G.; Hummelink, E. Emissies van Lachgas, Methaan En Ammoniak Uit Mest.Pdf. Available online: https://edepot.wur.nl/161899 (accessed on 14 December 2022).
- VanderZaag, A.C.; Baldé, H.; Crolla, A.; Gordon, R.J.; Ngwabie, N.M.; Wagner-Riddle, C.; Desjardins, R.; MacDonald, J.D. Potential Methane Emission Reductions for Two Manure Treatment Technologies. Environ. Technol. 2018, 39, 851–858. [Google Scholar] [CrossRef] [PubMed]
- Misselbrook, T.; Hunt, J.; Perazzolo, F.; Provolo, G. Greenhouse Gas and Ammonia Emissions from Slurry Storage: Impacts of Temperature and Potential Mitigation through Covering (Pig Slurry) or Acidification (Cattle Slurry). J. Environ. Qual. 2016, 45, 1520–1530. [Google Scholar] [CrossRef] [PubMed]
- Amon, B.; Kryvoruchko, V.; Fröhlich, M.; Amon, T.; Pöllinger, A.; Mösenbacher, I.; Hausleitner, A. Ammonia and Greenhouse Gas Emissions from a Straw Flow System for Fattening Pigs: Housing and Manure Storage. Livest. Sci. 2007, 112, 199–207. [Google Scholar] [CrossRef]
- Borgonovo, F.; Conti, C.; Lovarelli, D.; Ferrante, V.; Guarino, M. Improving the Sustainability of Dairy Slurry by A Commercial Additive Treatment. Sustainability 2019, 11, 4998. [Google Scholar] [CrossRef]
- Peterson, C.B.; El Mashad, H.M.; Zhao, Y.; Pan, Y.; Mitloehner, F.M. Effects of SOP Lagoon Additive on Gaseous Emissions from Stored Liquid Dairy Manure. Sustainability 2020, 12, 1393. [Google Scholar] [CrossRef]
- Baird, R.B.; Eaton, A.D.; Rice, E.W. (Eds.) Standard Methods for the Examination of Water and Wastewater, 23rd ed.; American Public Health Association, American Water Works Association, Water Environment Federation: Washington, DC, USA, 2017. [Google Scholar]
- VERA Test Protocol. Available online: https://www.vera-verification.eu/app/uploads/sites/9/2019/05/VERA_Test_protocol_slurryseparation_v3_2018_final.pdf (accessed on 14 December 2022).
- Balsari, P.; Airoldi, G.; Dinuccio, E.; Gioelli, F. Ammonia Emissions from Farmyard Manure Heaps and Slurry Stores—Effect of Environmental Conditions and Measuring Methods. Biosyst. Eng. 2007, 97, 456–463. [Google Scholar] [CrossRef]
- Finzi, A.; Mattachini, G.; Lovarelli, D.; Riva, E.; Provolo, G. Technical, Economic, and Environmental Assessment of a Collective Integrated Treatment System for Energy Recovery and Nutrient Removal from Livestock Manure. Sustainability 2020, 12, 2756. [Google Scholar] [CrossRef]
- Martínez-Suller, L.; Azzellino, A.; Provolo, G. Analysis of Livestock Slurries from Farms across Northern Italy: Relationship between Indicators and Nutrient Content. Biosyst. Eng. 2008, 99, 540–552. [Google Scholar] [CrossRef]
- Regueiro, I.; Coutinho, J.; Fangueiro, D. Alternatives to Sulfuric Acid for Slurry Acidification: Impact on Slurry Composition and Ammonia Emissions during Storage. J. Clean. Prod. 2016, 131, 296–307. [Google Scholar] [CrossRef]
- Petersen, S.O.; Andersen, A.J.; Eriksen, J. Effects of Cattle Slurry Acidification on Ammonia and Methane Evolution during Storage. J. Environ. Qual. 2012, 41, 88–94. [Google Scholar] [CrossRef]
- Ndegwa, P.M.; Hristov, A.N.; Arogo, J.; Sheffield, R.E. A Review of Ammonia Emission Mitigation Techniques for Concentrated Animal Feeding Operations. Biosyst. Eng. 2008, 100, 453–469. [Google Scholar] [CrossRef]
- Habtewold, J.; Gordon, R.; Sokolov, V.; VanderZaag, A.; Wagner-Riddle, C.; Dunfield, K. Reduction in Methane Emissions From Acidified Dairy Slurry Is Related to Inhibition of Methanosarcina Species. Front. Microbiol. 2018, 9, 2806. [Google Scholar] [CrossRef]
- Sokolov, V.K.; VanderZaag, A.; Habtewold, J.; Dunfield, K.; Wagner-Riddle, C.; Venkiteswaran, J.J.; Crolla, A.; Gordon, R. Dairy Manure Acidification Reduces CH4 Emissions over Short and Long-Term. Environ. Technol. 2021, 42, 2797–2804. [Google Scholar] [CrossRef] [PubMed]
- Ma, C.; Dalby, F.R.; Feilberg, A.; Jacobsen, B.H.; Petersen, S.O. Low-Dose Acidification as a Methane Mitigation Strategy for Manure Management. Agric. Sci. Technol. 2022, 2, 437–442. [Google Scholar] [CrossRef]
- Park, S.H.; Lee, B.R.; Jung, K.H.; Kim, T.H. Acidification of Pig Slurry Effects on Ammonia and Nitrous Oxide Emissions, Nitrate Leaching, and Perennial Ryegrass Regrowth as Estimated by 15N-Urea Flux. Asian-Australas. J. Anim. Sci. 2018, 31, 457–466. [Google Scholar] [CrossRef] [PubMed]
- Febrisiantosa, A.; Ravindran, B.; Choi, H.L. The Effect of Co-Additives (Biochar and FGD Gypsum) on Ammonia Volatilization during the Composting of Livestock Waste. Sustainability 2018, 10, 795. [Google Scholar] [CrossRef]
- SangSun, L.; HyunJin, P.; XiYing, H.; SunIl, L.; ByeongJun, J.; JinHyeob, K.; WooJung, C. Nitrogen, Carbon, and Dry Matter Losses during Composting of Livestock Manure with Two Bulking Agents as Affected by Co-Amendments of Phosphogypsum and Zeolite. Ecol. Eng. 2017, 102, 280–290. [Google Scholar]
- Hao, X.; Larney, F.J.; Chang, C.; Travis, G.R.; Nichol, C.K.; Bremer, E. The Effect of Phosphogypsum on Greenhouse Gas Emissions during Cattle Manure Composting. J. Environ. Qual. 2005, 34, 774–781. [Google Scholar] [CrossRef]
- Speshock, J.L.; Brady, J.A.; Eastman, J.; Roach, T.; Hays, S.; Kattes, D. Impact of Manure Storage Time and Temperature on Microbial Composition and Stable Fly (Diptera: Muscidae) Development. Adv. Microbiol. 2019, 9, 248–265. [Google Scholar] [CrossRef]
- Sokolov, V.; VanderZaag, A.; Habtewold, J.; Dunfield, K.; Tambong, J.T.; Wagner-Riddle, C.; Venkiteswaran, J.J.; Gordon, R. Acidification of Residual Manure in Liquid Dairy Manure Storages and Its Effect on Greenhouse Gas Emissions. Front. Sustain. Food Syst. 2020, 4, 568648. [Google Scholar] [CrossRef]
- Lynch, J.; Cain, M.; Pierrehumbert, R.; Allen, M. Demonstrating GWP *: A Means of Reporting Warming-Equivalent Emissions That Captures the Contrasting Impacts of Short- and Long-Lived Climate Pollutants. Environ. Res. Lett. 2020, 15, 044023. [Google Scholar] [CrossRef]
- Agrisource. Available online: http://agrisource.org/fr/1/home.html (accessed on 15 December 2022).
- Holly, M.A.; Larson, R.A.; Powell, J.M.; Ruark, M.D.; Aguirre-Villegas, H. Greenhouse Gas and Ammonia Emissions from Digested and Separated Dairy Manure during Storage and after Land Application. Agric. Ecosyst. Environ. 2017, 239, 410–419. [Google Scholar] [CrossRef]
- Veltman, K.; Rotz, C.A.; Chase, L.; Cooper, J.; Ingraham, P.; Izaurralde, R.C.; Jones, C.D.; Gaillard, R.; Larson, R.A.; Ruark, M.; et al. A Quantitative Assessment of Beneficial Management Practices to Reduce Carbon and Reactive Nitrogen Footprints and Phosphorus Losses on Dairy Farms in the US Great Lakes Region. Agric. Syst. 2018, 166, 10–25. [Google Scholar] [CrossRef]
- Kupper, T.; Häni, C.; Neftel, A.; Kincaid, C.; Bühler, M.; Amon, B.; VanderZaag, A. Ammonia and Greenhouse Gas Emissions from Slurry Storage—A Review. Agric. Ecosyst. Environ. 2020, 300, 106963. [Google Scholar] [CrossRef]
- Guarino, M.; Fabbri, C.; Brambilla, M.; Valli, L.; Navarotto, P. Evaluation of simplified covering systems to reduce gaseous emissions from livestock manure storage. Trans. ASABE 2006, 49, 737–747. [Google Scholar] [CrossRef]
- A Review of Livestock Methane Emission Factors. Available online: https://www.epa.ie/publications/research/climate-change/Research_Report_288.pdf (accessed on 14 December 2022).
- Aguerre, M.J.; Wattiaux, M.A.; Powell, J.M. Emissions of Ammonia, Nitrous Oxide, Methane, and Carbon Dioxide during Storage of Dairy Cow Manure as Affected by Dietary Forage-to-Concentrate Ratio and Crust Formation. J. Dairy Sci. 2012, 95, 7409–7416. [Google Scholar] [CrossRef] [PubMed]
- Duan, Y.-F.; Reinsch, S.; Ambus, P.; Elsgaard, L.; Petersen, S. Methanotrophic Activity in Slurry Surface Crusts as Influenced by CH4, O2, and Inorganic N. J. Environ. Qual. 2017, in press. [Google Scholar] [CrossRef]
- Külling, D.R.; Dohme, F.; Menz, H.; Sutter, F.; Lischer, P.; Kreuzer, M. Methane Emissions of Differently Fed Dairy Cows and Corresponding Methane and Nitrogen Emissions from Their Manure during Storage. Environ. Monit. Assess. 2002, 79, 129–150. [Google Scholar] [CrossRef]
- USEPA. Climate Change Indicators: Atmospheric Concentrations of Greenhouse Gases. Available online: https://www.epa.gov/climate-indicators/climate-change-indicators-atmospheric-concentrations-greenhouse-gases (accessed on 14 December 2022).
- Bokowa, A.; Diaz, C.; Koziel, J.A.; McGinley, M.; Barclay, J.; Schauberger, G.; Guillot, J.-M.; Sneath, R.; Capelli, L.; Zorich, V.; et al. Summary and Overview of the Odour Regulations Worldwide. Atmosphere 2021, 12, 206. [Google Scholar] [CrossRef]
- Janni, K. Reflections on Odor Management for Animal Feeding Operations. Atmosphere 2020, 11, 453. [Google Scholar] [CrossRef]


Disclaimer/Publisher’s Note: The statements, opinions and data contained in all publications are solely those of the individual author(s) and contributor(s) and not of MDPI and/or the editor(s). MDPI and/or the editor(s) disclaim responsibility for any injury to people or property resulting from any ideas, methods, instructions or products referred to in the content. |
© 2023 by the authors. Licensee MDPI, Basel, Switzerland. This article is an open access article distributed under the terms and conditions of the Creative Commons Attribution (CC BY) license (https://creativecommons.org/licenses/by/4.0/).
Share and Cite
Chiodini, M.E.; Costantini, M.; Zoli, M.; Bacenetti, J.; Aspesi, D.; Poggianella, L.; Acutis, M. Real-Scale Study on Methane and Carbon Dioxide Emission Reduction from Dairy Liquid Manure with the Commercial Additive SOP LAGOON. Sustainability 2023, 15, 1803. https://doi.org/10.3390/su15031803
Chiodini ME, Costantini M, Zoli M, Bacenetti J, Aspesi D, Poggianella L, Acutis M. Real-Scale Study on Methane and Carbon Dioxide Emission Reduction from Dairy Liquid Manure with the Commercial Additive SOP LAGOON. Sustainability. 2023; 15(3):1803. https://doi.org/10.3390/su15031803
Chicago/Turabian StyleChiodini, Marcello Ermido, Michele Costantini, Michele Zoli, Jacopo Bacenetti, Daniele Aspesi, Lorenzo Poggianella, and Marco Acutis. 2023. "Real-Scale Study on Methane and Carbon Dioxide Emission Reduction from Dairy Liquid Manure with the Commercial Additive SOP LAGOON" Sustainability 15, no. 3: 1803. https://doi.org/10.3390/su15031803
APA StyleChiodini, M. E., Costantini, M., Zoli, M., Bacenetti, J., Aspesi, D., Poggianella, L., & Acutis, M. (2023). Real-Scale Study on Methane and Carbon Dioxide Emission Reduction from Dairy Liquid Manure with the Commercial Additive SOP LAGOON. Sustainability, 15(3), 1803. https://doi.org/10.3390/su15031803