Article

Evaluating User Behaviour in a Cooperative Environment

1
JAKALA, 20124 Milano, Italy
2
Dimes Department, University of Calabria, 87036 Rende, Italy
3
Subcom, 20124 Milano, Italy
4
Istituto di Calcolo e Reti ad Alte Prestazioni (ICAR-CNR), 87036 Rende, Italy
5
ICT-SUD, 87036 Rende, Italy
6
Alkemy, 20124 Milano, Italy
*
Author to whom correspondence should be addressed.
Information 2018, 9(12), 303; https://doi.org/10.3390/info9120303
Submission received: 15 October 2018 / Revised: 25 November 2018 / Accepted: 27 November 2018 / Published: 30 November 2018
(This article belongs to the Special Issue Advanced Learning Methods for Complex Data)

Abstract

:
Big Data, as a new paradigm, has forced both researchers and industries to rethink data management techniques which has become inadequate in many contexts. Indeed, we deal everyday with huge amounts of collected data about user suggestions and searches. These data require new advanced analysis strategies to be devised in order to profitably leverage this information. Moreover, due to the heterogeneous and fast changing nature of these data, we need to leverage new data storage and management tools to effectively store them. In this paper, we analyze the effect of user searches and suggestions and try to understand how much they influence a user’s social environment. This task is crucial to perform efficient identification of the users that are able to spread their influence across the network. Gathering information about user preferences is a key activity in several scenarios like tourism promotion, personalized marketing, and entertainment suggestions. We show the application of our approach for a huge research project named D-ALL that stands for Data Alliance. In fact, we tried to assess the reaction of users in a competitive environment when they were invited to judge each other. Our results show that the users tend to conform to each other when no tangible rewards are provided while they try to reduce other users’ ratings when it affects getting a tangible prize.

1. Introduction

Big Data [1] is nowadays the leading paradigm both for research and industrial applications. Many platforms and tools have been proposed for innovative data analysis for managing huge amounts of data [2,3,4]. These new approaches are guided by the need shared by both researchers and industries to rethink storage and analysis techniques in order to deal with the massive data that are continuously generated at faster rates and showing a really heterogeneous nature [5]. As a matter of fact, the Big Data revolution has been guided by the continuous advances of the web technologies which make available complex and powerful data providers having very efficient connections. As an example, applications such as Uber, Facebook or Twitter attract millions of users. The peculiar features of such application can be summarized as: Uber: ridesharing domain, Twitter/Facebook: Social Network/Micro-Blogging domain, Dropbox: File storage domain, Craigslist: Sales domain. It is worth noting that all of these approaches fuel the so-called sharing economy. Indeed, the definition of new data analysis models and tools based on artificial intelligence and machine learning is mandatory for a more efficient monitoring of data flows. From a practical point of view, this can favour more democratic, secure forms of sharing economy, better management of digital rights and new user-focused and fair-payment models of social participation.
Unfortunately, this information is generated by quite heterogeneous sources and exhibit different formats and semantic [6]. However, this information contains “gold nuggets” about user behavior, their opinions about product and services and the way they interact each other. Thus, there is a continuous demand (shared by researcher and industries) for new algorithms that could allow a deep understanding of user preferences and their interaction patterns with complex systems.
To this end in [7], we described a collaborative network that allows users to cooperate with each other getting high performance task execution (by partitioning complex tasks in smaller and easier subtasks) while saving money. Indeed, we allow the use of computing capabilities and skills that would be wasted otherwise. Moreover, as the subtasks assigned to users may consist of processes whose result is the definition of specific features for a context (e.g., deciding whether a restaurant is better than another), we need to deal with controversial or inconsistent data. Thus, we devised some proper data manipulation strategies in order to make data as much reliable as possible. This step will allow us to effectively evaluate the user’s cooperation and their behavior.
In more detail, in Figure 1, we show our Peer To Peer (P2P) system for user cooperation. Our platform is rather flexible, thus it can be leveraged for every complex task that can be partitioned in subtasks.
As a first step, in order to participate in the network, users have to install the Coremuniti server ( N S A (Node Server Agent) in Figure 1) in order to set the type of task and the resources they are able to solve, when solving a task, users (referred in what follows as resource providers) will be rewarded with credits to be spent on the network. Users who may need help to perform complex tasks should run the client tool (referred as N C A (Node Client Agent) in Figure 1. In order to ask for task computation on the network, users need to meet one of the following constraints: (1) they previously participated in network activities as providers and had been rewarded with a sufficient amount of credits or (2) they pay for the service. For the sake of efficiency, we partition the bigger tasks into smaller subtasks that can be easily managed by resource providers.
When a set of providers outputs a subtask, it is checked for correctness leveraging a ranking system based on users’ mutual judgment; if the output is correct, we reward the participating peers. Details of this strategy are beyond the scope of this paper and are described in [7].
As user involvement is crucial, we reward users based on their effectiveness and quality of the provided results. In more detail, we allow users requesting task execution to evaluate the quality of the results provided by resource providers. Since the correctness of the task to be performed is a decision-making problem (e.g., deciding whether given decision is correct or assigning a given job a rank against others) that can be influenced by other users [8], we need to provide a soundness guarantee. In particular, in literature, several approaches have been proposed for measuring the influence that users have on each other in several scenarios like leisure suggestions [9,10] or large social environments [11]. Indeed, a work somehow closely related to ours falls in the category of non-progressive influence analysis.
Indeed, in the seminal work [12], the authors demonstrate how to reduce the non-progressive influence maximization problem to the progressive case by modifying the original graph under specific assumption. Since in a non-progressive process a node can switch between states indefinitely (in our case, a user can be assigned to different tasks each time s/he joins the network), the classical target function of influence maximization under progressive models (i.e., the one trying to maximize the expected number of influenced nodes), can not be exploited in the non-progressive scenario. Thus, Ref. [13] suggests a new target function that maximizes the total time during which nodes are using a product by discrete-time non-progressive model that leverages the idea in [12].
In order to properly manage the issues discussed above, we propose an approach based on the analysis of network dynamics by Exponential Graph Random Models (EGRM) [14]. In particular, we aim at evaluating the maximum likelihood of the features (i.e., parameters) that are relevant for task assignment (e.g., the rank achieved by those users). In more detail, we leverage EGRM for the analysis of relative liking judgments among users, and for modelling the revenue flow generated by user interactions. Unfortunately, the maximum likelihood evaluation is computationally hard even for small sized scenarios. In this paper, we will describe two approaches for sampling data that overcome the problem mentioned above: (1) Metropolis Hastings sampling and (2) Clustering based sampling.
We analyze what happens with users’ search preferences when they are aware of other people’s choices. This case could often arise in social environments or crowd based systems where people usually post their activities. In more detail, we considered a group of users involved in a research project and we let them know mutual preferences on some topics. After that, we analyzed user search strategies after a rewarding plan has been started, i.e., we give some credits to those people that suggested some useful search directions to other users (initially, they are not aware of them). We analyzed the network dynamics using two different approaches: the first one based on Exponential Random Graph Model (ERGM) to model the interactions, and a second one based on clustering for grouping users. Our goal is to identify profitable links for spreading search dimensions as this information can be leveraged by decision makers in order to design effective marketing campaigns or other activities based on user influence.
To properly measure the above-mentioned network dynamics, we compute three values proposed in [15] and briefly described in the following.
  • Global Nonconformity (GNC): in many settings where a user observe the rankings ofothers, it has been shown in literature that this will influence its rank causing his/her own rankings to conform with others;
  • Local Nonconformity (LNC): these parameters model the case of a user i ranking a user j that is influenced only by users ranked above j;
  • Deference Aversion (DA): this parameter is the most intriguing in our context. The above-mentioned parameters deal with the mutual adjustment among raters regarding their relative assessments of third parties. In our framework, however, higher rankings are associated with positive evaluation (thus higher rewards), such that being ranked below others is aversive. Thus, if user l ranks j above i and i ranks l above j, i is ranking herself below l. As a consequence, deference aversion may lead i to resist ranking l above j.
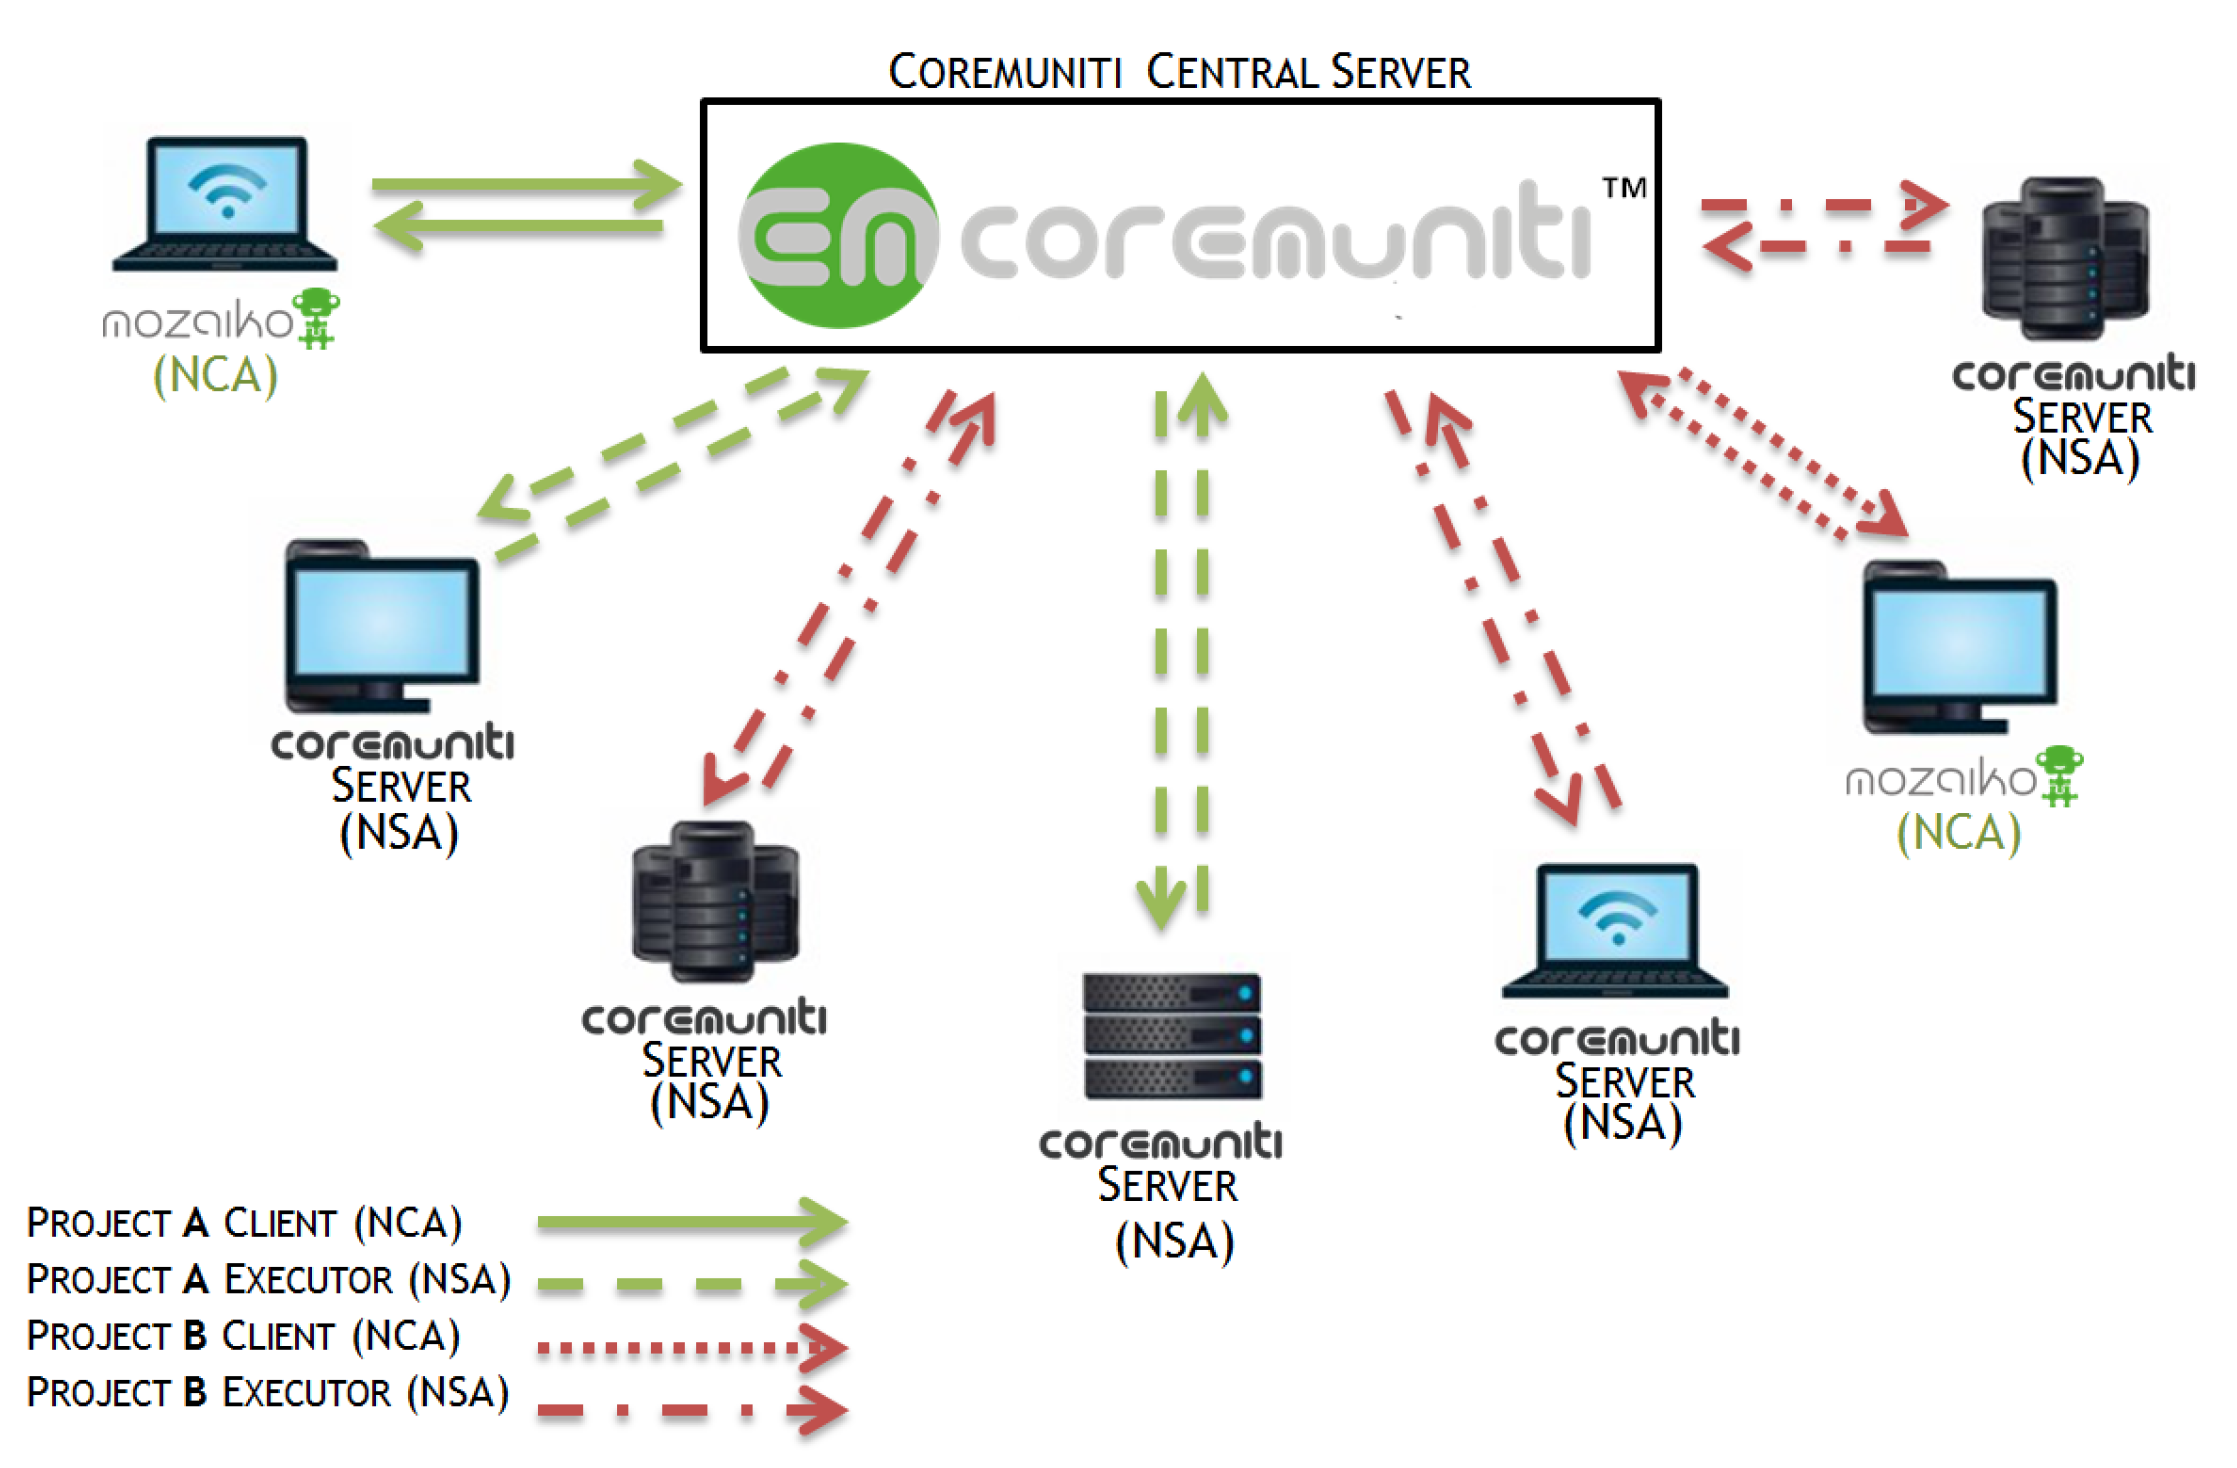
2. Data Preparation

As we mentioned above, we may need to deal with inconsistent data (as users may assign different interpretations, thus different score meaning, to a specific feature) or we may need the informative content to be provided to users. Indeed, data coming from the crowd require a great effort to be managed as they could be quite uncertain [16] or biased [17]. Indeed, we can refer to these data as incomplete data, thus requiring proper pre-elaboration prior to their analysis. In what follows, we briefly describe two approaches we leveraged in our system.

2.1. Dealing with Incomplete and Inconsistent Data

Reasoning in the presence of inconsistent information is a problem that has attracted a great deal of interest in the AI and database communities. Many inconsistency-tolerant semantics for query answering have been proposed, and most of them rely on the notions of consistent query answer and repair. Intuitively, a repair is a “maximal” consistent subset of the facts of the knowledge base. A consistent answer to a query is a query answer that is entailed by every repair. Since there could be many repairs, finding certain answers is most commonly in coNP in data complexity, and it is very often coNPhard, even for conjunctive queries [18,19]. For this reason, different approximation strategies to compute a sound but possibly incomplete set of consistent query answers in polynomial time have been developed.
Consistent query answering was first proposed in [20]. Query answering under various inconsistency-tolerant semantics for ontologies expressed in DL languages has been studied in [21,22,23,24,25,26,27], and in [28,29,30,31] for ontologies expressed by fragments of Datalog+/–. Several notions of maximality for a repair have been considered in [32]. An approach for the approximation of consistent query answers from above and from below have been proposed in [27]. In [33], an approach based on three-valued logic to compute a sound but possibly incomplete set of consistent query answers has been proposed. All of the approaches above adopt the most common notion of repair, where whole facts are removed. This can cause a loss of information, and it might well be the case that only a few of the facts’ attributes are involved in inconsistencies, leading to a significant loss of useful data.
There have also been different proposals adopting a notion of repair that allows values to be updated [34,35,36,37,38]. Recently, a new approach based on the value updates has been proposed in [39]. Its repair strategy behaves similar to the one of [34,36,37] in that values on the right-hand side of functional dependencies (FDs) are updated. However, those works focus on FDs only, whereas [39] allows much more general constraints. Moreover, Ref. [39] introduces the notion of a universal repair, which compactly represents all repairs and can be used for exact/approximate query answering. Consistent query answering in this framework is coNP-complete (data complexity), while the approximation algorithm provides a sound (but possibly incomplete) set of consistent query answers in polynomial time. The repair strategy in [39] can be seen as an instance of the value-based family of policies proposed in [40], even though the two approaches differ in how multiple dependencies are handled, and they focus on FDs only. In [38], numerical databases and a different class of (aggregate) constraints have been considered.
Approximation algorithms for computing sound but possibly incomplete sets of query answers in the presence of nulls have been also proposed in [41,42,43,44], but no dependencies are considered therein, and thus the database is assumed to be consistent.
The coarse-grained classification of facts into two classes (namely, consistent and non-consistent ones) does not provide much information about the non-consistent facts (e.g., a fact may be entailed by 99 out of 100 repairs). There has been some work on probabilistic query answering on inconsistent knowledge bases [37,45,46] that define probabilistic guarantees for query answers. The [45] considers primary keys only and a repair strategy based on fact deletions; [37] considers a restricted class of functional dependencies and a repair strategy based on fact updates, but none of them deal with approximating query answers. The most recent proposal [46] employs a repair strategy based on fact deletions (and insertions) and deals with more general dependencies and approximation schemes. We applied different ideas presented in this work in our system.
Universal solution and chase algorithm. Computing solutions in data exchange, and computing certain answers in data integration and in a possibly inconsistent knowledge base can be solved by exhibiting a universal model. Roughly speaking, a model for a database and a set of dependencies is a finite instance that includes the database and satisfies the dependencies. A universal model is a model that can be “mapped” to every other model—in a sense, it represents the entire space of possible models. Universal models are slight generalizations of universal solutions in the data exchange setting [47], and can be used to compute them. Moreover, the certain answers to a conjunctive query in the presence of dependencies can be computed by evaluating the query over a universal model (rather than considering all models). Other applications of universal models (e.g., dependency implication and query containment under dependencies) can be found in [48]. The computation of universal models can be done by means of the fixpoint chase algorithm, when it terminates [48]. The execution of the chase involves inserting tuples possibly with null values to satisfy tuple generating dependencies (TGDs), and replacing null values with constants or other null values to satisfy equality generating dependencies (EGDs). Specifically, the chase consists of applying a sequence of steps, where each step enforces a dependency that is not satisfied by the current instance. It might well be the case that multiple dependencies can be enforced and, in this case, the chase picks one non deterministically. Different choices lead to different sequences, some of which might be terminating, while others might not. Unfortunately, checking whether the chase terminates is an undecidable problem [48]. To cope with this issue, several “termination criteria” have been proposed, that is, (decidable) sufficient conditions ensuring chase termination. Some recent works can be found in [49,50].

2.2. Enriching the Data: Data Posting

One of the most important features of Data Posting recently introduced in [51] is the improvement of data exchange between the sources and the target database. The idea is to adapt the well-known Data Exchange techniques to the new Big Data management and analysis challenges we find in real world scenarios.
First of all, the Data Posting approach allows for avoiding the introduction of null values due to the presence of existential quantifiers in the mapping rules (the so called, Source to Target Generating Dependencies) choosing in a smart way the values to be inserted. The choice of the appropriate values is made on the basis of the directions specified in the framework. Intuitively, the candidate values can be extracted thanks to the data mining techniques, while the selection rules can be expressed using the count constraints [52]. In more detail, the source database is enriched with additional tables, called domain relations, that can be used to perform the non deterministic choice among some value sets. In addition, “count constraints" are used to select the most appropriate values (i.e., those that are supported by at least a certain number of occurrences) [51].
The problem of finiteness of the Target database is well known in the context of Data Exchange. As discussed in the previous section, the existence of existential quantifiers in the mapping rules and their replacement with null values can create situations in which the finiteness property of the Target database could not be satisfied. The Data Posting framework selects the actual values from a finite set of candidates, ensuring the finiteness of the Target database. Obviously, the solution thus obtained could also not be universal as it represents a specific choice. However, it is worth noticing that, in the context of Big Data, we are often interested in the discovery of new knowledge and the overall analysis of the data and some attributes of the target tables can be created for storing the discovered values. Thus, the choice of concrete values can be seen as a first phase of data analysis that solves uncertainties by enriching the information contents of the whole system.
In order to illustrate the use of this approach in our system, we provide two toy examples that will make clear the wide applicability of the approach.
Example 1.
Consider the sources S 1 and S 2 describing the user’s profiles by relations P 1 ( I , N , V ) and P 2 ( I , N , V ) , respectively, with attributes I (profile’s identifier), N (attribute’s name) and V (attribute’s value). Suppose also to have a relation C ( I 1 , I 2 , L ) that contains the information about a profile’s compatibility in the above-mentioned relations. In particular, the first two attributes contain a profile’s identifiers from tables S 1 and S 2 , respectively, whereas L represents the level of compatibility of these profiles.
In order to enrich entities of the source S 1 with some “relevant" attributes from the source S 2 , we can set the following rules: An attribute combination name-value ( n 2 , v 2 ) taken from the source S 2 is added to the profile with identifier i 1 if it is “supported" by at least 10 profiles of the source S 2 with a percentage of compatibility towards i 1 at least 50 % .
This situation can be modeled in our setting as follows. The relations P 1 , P 2 and C can be considered as source relations. D is a domain relation composed of values 0 and 1. The target relations are:
  • A ( I 1 , I 2 , N 2 , V 2 ) stores the information of the profile from P 2 , whose compatibility level with some profile in P 1 is at least 50 % .
  • Add ( I 1 , N 2 , V 2 , Flag ) stores the combinations name-value taken from P 2 and the decision to add this couple to the profile from P 1 , represented by means of Flag attribute: 0 (not add) 1 (add).
The source to target dependencies are
P 2 ( i 2 , n 2 , v 2 ) C ( i 1 , i 2 , l ) l 0 , 50 A ( i 1 , i 2 , n 2 , v 2 ) , P 2 ( i 2 , n 2 , v 2 ) C ( i 1 , i 2 , l ) l 0 , 50 D ( flag ) Add ( i 1 , n 2 , v 2 , flag ) ,
where all variables are universally quantified. The fact that D is domain relation and its presence in the body of the second constraint express that only one value between 0 and 1 can be chosen for each triple ( i 1 , n 2 , v 2 ) in the relation Add .
The following count constraints guarantee that all combinations name-value ( n 2 , v 2 ) “supported" by at least 10 profiles in the relation P 2 with a percentage of compatibility towards i 1 at least 50 % are added to i 1 , whereas the combinations that do not satisfy the above-mentioned property are not added to i 1 :
( 1 ) : Add ( i 1 , n 2 , v 2 , 1 ) # ( { I 2 : A ( i 1 , I 2 , n 2 , v 2 ) } ) 10 , ( 2 ) : Add ( i 1 , n 2 , v 2 , 0 ) # ( { I 2 : A ( i 1 , I 2 , n 2 , v 2 ) } ) < 10 .
Intuitively, # is an interpreted function symbol for computing the cardinality of a set, lowercase and uppercase letters denote variables that are respectively universally and existentially quantified.
In order to choose for the same attribute only one value “supported" by at least 10 profiles in the relation P 2 with a percentage of compatibility towards i 1 at least 50 % , the second constraint must be substituted by the following one, where anonymous variables, denoted by an underscore, are used to define a relation projection:
( 2 ) : Add ( i 1 , n 2 , _ , _ ) # ( { V : Add ( i 1 , I , n 2 , V , 1 ) } ) = 1 .
By adding to the set of { 1 , 2 } constraint 3 reported below, we can also specify that the added value must be the most supported one:
( 3 ) : Add ( i 1 , n 2 , v 2 , 1 ) , Add ( i 1 , n 2 , v , 0 ) # ( { I 2 : A ( i 1 , I 2 , n 2 , v 2 ) } ) # ( { I 2 : A ( i 1 , I 2 , n 2 , v ) } ) .
Example 2.
Suppose having the description of the user ratings (that we call comments) stored in the relation C ( U , N , V ) with attributes U (user identifier), N (argument of rating) and V (rating value). Suppose having a relation T ( U 1 , U 2 , L ) that represents the trust level L of user U 2 for the user U 1 .
In order to suggest to the user some “relevant" comments, we can set the following rules: a comment ( n , v ) is suggested to the user u if it is “supported" by at least 20 users whose trust level towards u is greater than 70 % .
This situation can be modeled in the data posting setting as follows. The relations C and T can be considered as source relations. D is domain relation composed by values 0 and 1. The target relations are:
  • A ( U 1 , U 2 , N , V ) auxiliary relation that stores the comments for users with compatibility level greater than 70 % .
  • S ( U , N , V , Decision ) stores the decision to suggest the comment ( N , V ) to the user U , represented by means of Decision attribute: 0 (not suggest) and 1 (suggest).
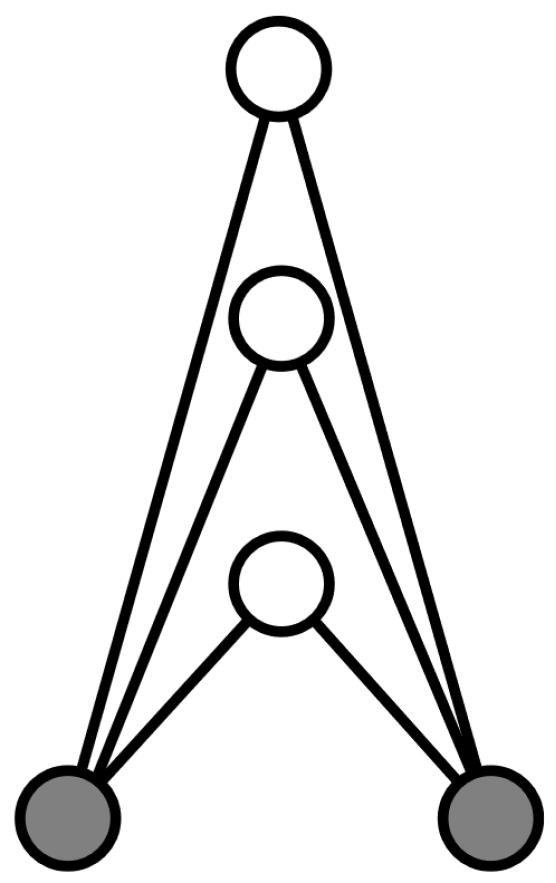
The source to target dependencies are
C ( u 2 , n , v ) T ( u 1 , u 2 , l ) l > 0 , 70 A ( u 1 , u 2 , n , v ) , C ( u 2 , n , v ) T ( u 1 , u 2 , l ) l > 0 , 70 D ( d ) S ( u 1 , n , v , d ) ,
where all variables are universally quantified. The fact that D is a domain relation and its presence in the body of the second constraint expresses that only one value between 0 and 1 can be chosen for each triple ( u 1 , n , v ) in the relation S .
The following count constrains guarantee that all comments ( n , v ) “supported" by at least 20 users whose trust level towards u is greater than 70 % are suggested to the user u, whereas the comments that do not satisfy the above-mentioned property are not suggested to u:
( 1 ) : S ( u 1 , n , v , 1 ) # ( { U 2 : A ( u 1 , U 2 , n , v ) } ) 20 , ( 2 ) : S ( u 1 , n , v , 0 ) # ( { U 2 : A ( u 1 , U 2 , n , v ) } ) < 20 .
As usual, # is an interpreted function symbol for computing the cardinality of a set; lowercase and uppercase letters denote variables that are respectively universally and existentially quantified.
In order to determine for the same rating argument only the most supported values in the above-mentioned choice, constraint ( 2 ) must be substituted by the following constraints:
( 3 ) : S ( u 1 , n , _ , _ ) # ( { V : S ( u 1 , n , V , 1 ) } ) 1 , ( 4 ) : S ( u 1 , n , v 2 , 1 ) , S ( u 1 , n , v , 0 ) # ( { U 2 : A ( U 1 , U 2 , n , v 2 ) } ) # ( { U 2 : A ( U 1 , U 2 , n , v ) } ) .
Constraint 3 ensures that at least one value for each relevant argument is chosen, constraint 4 specifies, that this value must be maximally supported. Observe that in the case that two or more values are maximally supported for the same argument and the same user, all of these values will be suggested owing to the presence of the ≥ sign in the constraint 3. Observe that, by substituting this sign with an equal sign, we can impose the selection of only one from the maximally supported values. In the absence of additional constraints, this selection will be performed in a non-deterministic way.
Once we have properly manipulated the input data, we can assign the tasks to users (e.g., determining the quality of other user reviews). The next section is devoted to describe our approach to evaluate the user ranking behaviours.

3. ERGM Sampling

As mentioned above in many scenarios, user searches (or suggestions) can be evaluated by other users. This process leads to a matrix representation of these rankings (denoted as S, in what follows). Each cell S i , j reports the value assigned to the search (or suggestion) of j by user i. Using S as a basis for computation, it is easy to compute S + that contains information about tie between i to j (i.e., S i , j > 0 ) and S that reports information about no tie between i to j (i.e., R i , j = 0 ). We point out that nodes i and j are tied if there exists a link between them in their social environment (e.g., likes or comments on the same post).
In order to perform an effective analysis of network dynamics in our scenario, we leverage a well studied approach (which dates back to some decades ago) based on Exponential Graph Random Models (EGRM) [14] that offers better performances even against recent approaches [53,54,55]. ERGMs have been introduced for formulating hypotheses about social processes that might have produced empirically observed social networks. In more detail, ERGMs belong to a family of statistical models that have been introduced for social networks for analyzing the dependence assumptions underpinning hypotheses of network formation. As an example, consider the toy network reported in Figure 2; the graph exhibits a structure composed of two nodes having no relations with each other but sharing all of their partners; this situation is worth investigation from a social network viewpoint.
The analysis can be performed by comparing the frequency of particular configurations in observed networks with their frequency in stochastic models. Dependence assumptions are based on the idea that pairs of nodes cannot be connected independently of what happens in the rest of the network; in a sense, users are influenced by the (eventual) presence or absence of specific users and their opinions.
In our scenario, when evaluating the maximum likelihood of the features (i.e., parameters) that are relevant for task assignment (e.g., the rank achieved by those users), it is crucial to take into account relative liking judgments among users. The latter analysis allows a more accurate modelling of the revenue flow generated by user interactions.
In more detail, in order to evaluate the effect of user searches, we are interested in measuring the existence of a tie (represented as a value in S). To better explain this phenomenon, we leverage important features like mean searches number, average number of obtained results, etc. In what follows, we represent such variables as z 1 ( S ) , z 2 ( S ) z n ( S ) and the model parameters by a vector θ computed as follows:
θ 1 · z 1 ( S ) + θ 2 z ˙ 2 ( S ) + + θ n z ˙ n ( S ) .
To compute the probability value P ( S ) , we need to compute its Maximum Likelihood Estimates (MLE), i.e., we need to compute:
L ( Θ ) = P ( Z 1 = z 1 , Z 2 = z 2 , , Z n = z n ) = f ( z 1 , Θ ) · f ( z 2 , Θ ) f ˙ ( z n , Θ ) = i f ( z i , Θ ) .
Unfortunately, as it is easy to see from the above formula, the maximum likelihood evaluation is computationally hard even for small sized scenarios. In what follows, we will describe our approaches for sampling data that overcome the above-mentioned problem: (1) Metropolis–Hastings sampling and (2) Clustering based sampling.

3.1. Metropolis–Hastings

This algorithm tries to evaluate a probability density function F ( x 1 , , x n ) that is our unknown target by leveraging the values of proposal distribution P ( x 1 , , x n ) . The output of this sampling step is a proper data partition. These samples provide a good estimates of F ( x 1 , , x n ) as they exhibit similar shapes. Our implementation is reported in Algorithm 1.
Based on the above strategy for sample generation, we can implement the Best Search sampling strategy reported in Algorithm 2.
Algorithm 1 MH Sampling.
Require:N output samples; B: number of samples for burn-in;
Ensure: a sequence of k network resource providers P = [ p 1 , , p k ]
1:
S =
2:
generate an initial sample s
3:
for i = 0 to B + N do
4:
s s
5:
 perturb s
6:
j i t t e r = r a n d o m ( )
7:
if j i t t e r m i n ( 1 , P ( s ) P ( s ) ) then
8:
   s = s
9:
end if
10:
  if k B then
11:
   Add s to S
12:
  end if
13:
end for
14:
returnS
Algorithm 2 Algorithm for Best Search sampling.
Require: A set of searches to be performed y, a rank matrix X, the probability array p, an integer a c c U , an integer c M a x S
Ensure: a sequence of k sampled nodes P = [ p 1 , , p k ]
c C o a l the current coalition of users, c P c o a l the probability of the current coalition of user, t C o a l the generated coalition, t P C o a l the probability of the generated coalition, S T the set of generated coalition (that does not contain duplicated elements).
1:
c C o a l = , c P c o a l = 0
2:
S =
3:
for i = 1 to b u r n + I t do
4:
t C o a l = c C o a l
5:
if 0 < | t C o a l | < c M a x S then
6:
   t C o a l = g e n e r i c U p d a t e ( t C o a l )
7:
else
8:
  if | t C o a l | = 0 then
9:
    t C o a l = a d d U s e r ( t C o a l )
10:
   else
11:
     t C o a l = r e m U s e r ( t C o a l )
12:
   end if
13:
  end if
14:
   t P C o a l = c o m p u t e P r o b ( t C o a l , y )
15:
   j i t t e r = r a n d o m ( )
16:
  if j i t t e r < m i n ( 1 , t P C o a l c P c o a l ) then
17:
    c C o a l = t C o a l , c P c o a l = t P C o a l
18:
  end if
19:
  if i > b u r n I t then
20:
    u p d a t e ( S , c C o a l )
21:
  end if
22:
end for
23:
return b e s t S e a r c h ( S , a c c U )
In more detail, the two steps of the algorithm work as follows. The first step is devoted to initialize the coalition by generating b u r n samples to be disregarded. Next, we compute i t coalition that are added to S.
Function computeProb(tCoal,y) computes the probability that a task y can be executed by coalition t C o a l according to the values included in matrix X t C o a l as follows:
c o m p u t e P r o b ( t C o a l , y )
= p C o a l t C o a l 1 i = 1 m p ( X t C o a l i , y i ) ,
where p X t C o a l i , y i is defined as follows: p X t C o a l i , y i = 1 3 , i f h , k   s.t.   X t C o a l [ i ] [ h ] X t C o a l [ i ] [ k ] and, if no such h , k exists, and otherwise
p X t C o a l i , y i =
p u , if y i = 1 , ( a ) ( 1 p u ) p [ i ] , if y i = 1 e X t C o a l i = 1 , ( b ) p u p [ i ] , if y i = 1 e X t C o a l i = 0 , ( c ) p u ( 1 p i ) , if y i = 0 e X t C o a l i = 1 , ( d ) ( 1 p u ) ( 1 p i ) , if y i = 0 e X t C o a l i = 0 . ( e )
In more detail, the definition c o m p u t e P r o b ( t C o a l , y ) assumes that the probability that t C o a l executes y is the combination of two different independent contributions:
  • the fact that t C o a l users formed a coalition, and
  • the probability that the user in t C o a l worked on y.
The first contribution is represented by the factor p C o a l t C o a l 1 in Equation (3), where p C o a l is the probability that two randomly picked users cooperate. The second contribution is represented by the product, for each subtask i of the task y, of the probability that the users in t C o a l executed the i-th sub-task of y. The latter probability is assumed to be p u if the i-th subtask of y is not evaluated (case ( a ) of Equation (4)), where p u is a constant representing the probability that a task has not been evaluated. In cases ( b ) ( e ) of Equation (4), the probability that the users in t C o a l executed the i-th sub-tast of y is assumed proportional to the probability that the subtask was randomly executed.

3.2. Using Clustering

The natural dynamics of social networks may result in the formation of user coalitions willing to interact with similar users. To address this issue, we leverage cluster analysis that is a powerful knowledge discovery tool widely investigated over the last several decades [56,57,58]. In this paper, we are interested in identifying natural clusters; thus, we leverage CLUBS + [59], a new clustering algorithm for matrix data as the ones considered in our experiments. A complete description of the algorithm and its peculiar features are reported in [59], while here we only mention that, as clusters are detected by CLUBS + , we can perform sampling by randomly picking up some users from each cluster and using it in our algorithms.

4. Experimental Evaluation

4.1. Setup

In this section, we report the results obtained on a test set of user searches collected for four months during the D-ALL project activities. In more detail, users involved in the project cooperate in evaluating different services (e.g., restaurants, art itineraries and so on) and the project goal is to extract relevant patterns from these information. We provided each user with two different options: (1) they can ask for search suggestion or (2) they can suggest search directions on request. At fixed time intervals, users may evaluate obtained results (both as consumers and providers of information) by assigning a rank ranging from 0 to 10 to their experience. As we implemented a rewarding strategy, i.e., users pay for targeted suggestions and are paid when they suggest a proper search, the effectiveness evaluation is crucial as we do not want users to pay for wrong information.
As explained in previous sections, we model our small network interactions by a random graph that is continuously updated as new links among users appear (i.e., new interactions between a pair of users). In order to better understand the information relevant to our goal, we leverage two types of analysis: the first one, referred to as cross-sectional (CS), considers only the variation occurring when data are observed while the second one considers each observation as an independent unit; thus, it is referred to as dynamic (Dyn). In order to be fair and to evaluate the influence excerpted by users each other, every participant is aware of the other’s scores.
The latter results in the need to analyze factors that are endogenous, i.e., those phenomenon that may arise when users each know the rankings of others, thus causing the rankings given by user i to be influenced by other user rankings except i. To this end, we measure in what follows the values of GNC, LNC and DA.

4.2. Evaluation

In order to analyze the evolution of user search effects, we use the following statistics: overall search number performed by user; keyword total number; mean assigned keyword rank. For the sake of completeness, we use both cross-sectional and dynamic analysis combined with clustering and Metropolis–Hastings sampling.
In what follows, we summarize in tabular form the results obtained. Note that, for dynamic analysis, we compute fifteen graphs (one for each week except the first one); for the other analysis, we have 16 graphs.
We show in Table 1 the obtained values for the DA, GNC and LNC for CS and Dyn analysis when adopting M-H sampling. It is easy to observe that the values obtained for Deference Aversion have always been high since the beginning. It is worth noting that, as we start rewarding users (at week 4), the DA values further increase. In more detail, both for dynamic and cross-sectional analysis, global nonconformity is not a significant factor. The values reported for the other two factors are, on the whole, significant, but are uniformly smaller in magnitude for dynamic analysis compared to those of the corresponding weeks in the cross-sectional analysis and are less precisely estimated (as represented by uniformly greater standard errors). This is because, rather than embodying the structure of the whole network, they embody only the structure of changes in the network over the week, thus the only important value to rely on is the weekly changes of values. This means that “instant” social effects (e.g., friendship reciprocation) have been absorbed into the Week 0 observation, which is not modeled in the dynamic analysis.
Moreover, above-mentioned phenomena can be considered as a kind of social “envy”: users tend to decrease the scores of other users in order to get more requests for themselves and thus get more rewards. We note that also LNC value is high while GNC is not impressive: in a sense, users tend to agree on the general topics but not on the specific ones. Similar observations can be made for all of the analysis reported in Table 2, Table 3 and Table 4.
As a final note, we can observe that the results obtained when sampling data by clustering are slightly better. This behaviour can be explained considering that, when leveraging cluster approaches, it is more likely to obtain more homogeneous groups (i.e., group of users sharing common interests and features).
Remark 1.
The results reported in this section have been used for the evaluation of gain obtained by users when considering the four scenarios described above. A first evaluation can be made by observing that, for those users exhibiting low deference aversion values, executed task number increases and the rewards they get are higher. This phenomenon produces a higher satisfaction rate for tasks requesting users due to the higher accuracy of results. In what follows, we describe our assignment strategy that leverages such a result.
In more detail, our assignment strategy meets two constraints: (1) overall task completion time minimization; and (2) provider and consumer of task satisfaction.
We assume a set RP = { r p 1 , , r p n } of available resource providers, an assignment function λ c : RP N × N , for matching resource providers with a t m i n , t m a x constraint. Herein: t m i n (resp. t m a x ) is the minimum (resp. maximum) execution time for subtask completion.
Furthermore, we leverage a rewarding strategy that takes into account the “usefulness” of the result provided by each r p i . Indeed, let s t be a subtask having a c credits value that has been assigned to r p i 1 , r p i x . We order r p i 1 , r p i x ascending w.r.t. their rankings based on the strategies described above and build a new sequence R P s t . Obviously, those providers that fail to complete the assigned subtasks are queued to R P s t based on their task completion ratio.
As soon as more than two providers output their results, we give 3 c 10 of the reward to the first three listed in R P s t , i.e., the ones which performed better in computing s t . This choice has its rationale in what follows: we need to output the results as soon as possible, thus if the first three providers output a correct answer, we give them a higher share of the reward that has been assigned for that task. After this first step, we assign c 10 credits to the other providers in R P s t . In more detail, each provider j [ 4 . . x ] is assigned a share computed as follows:
c × C o m p l ( R P s t [ j ] ) 10 × k = 4 x C o m p l ( R P s t [ k ] ) .
Herein: C o m p l ( r p ) is completion percentage of s t performed by r p . By this step, we guarantee that all resource providers will be reward for their effort even in the case of incomplete task computation. The rationale for this choice is to encourage all the users to join the network as they get some reward even if their computational power was not adequate to solve the whole task assigned to them. The following example will clarify this issue.
Example 3.
Consider the case that a group of four resource providers R P = { r p 1 , , r p 4 } was assigned to s t (for the sake of readability we assume here that all users obtained the same ranking), where λ c ( r p 1 ) = 1 , 5 , λ c ( r p 2 ) = 2 , 7 , λ c ( r p 3 ) = 6 , 7 and λ c ( r p 4 ) = 4 , 8 . In this case, t = 4 and t = 7 and
E C s t , R P = 4 + 4 5 ( 1 F 0 3 ( x ) ) d x + 5 6 ( 1 F 1 3 ( x ) ) d x + 6 7 ( 1 F 2 3 ( x ) ) d x = 4 + 4 5 ( 1 x 1 5 1 x 2 7 2 x 4 8 4 ) d x + 5 6 ( 1 x 2 7 2 x 4 8 4 ) d x + 6 7 1 x 2 7 2 x 6 7 6 + x 2 7 2 1 x 6 7 6 x 4 8 4 + 1 x 2 7 2 x 6 7 6 x 4 8 4 d x = 4 + 4 5 ( 1 x 1 4 x 2 5 x 4 4 ) d x + 5 6 ( 1 x 2 5 x 4 4 ) d x + 6 7 1 x 2 5 x 6 1 + x 2 5 1 x 6 1 x 4 4 + 1 x 2 5 x 6 1 x 4 4 d x = 4 + 11 x 10 7 x 2 80 + 7 x 3 240 x 4 320 4 5 + 3 x 5 + 3 x 2 20 x 3 60 5 6 + 1 10 ( 126 x + 44 x 2 17 x 3 3 + x 4 4 ) 6 7 = 4 + 901 960 + 11 15 + 31 120 5.93 .

5. Conclusions and Future Work

In this work, we described the use of Exponential Random Graph Models for the analysis of user influence across social networks. We exploited many interesting mathematical tools to model several psychological and social mechanisms that proved to be effective in our scenario. The ability to evaluate and compare competing approaches based on a fair mechanism proved to be adequate in our context, thus validating the use of statistical approaches for our goal. Moreover, given the current wave of interest in social networks, computationally scalable estimation is worth the investigation. We are aware that, compared to population-scale networks, the networks considered here are fairly small. However, the latter observation does not decrease the validity of our approach as ranking data of the form analyzed here is typically of interest only in specific groups or organizational settings in which all members of the network are salient since such networks are by nature fairly small. Thus, highly scalable techniques are less compelling in our setting. Nevertheless, computationally scalable estimation is an interesting challenge for future research in this area that we want to address in the next few months. In this respect, it is worth noticing that ERGMs provide an effective tool for addressing both new and classic problems in social network decision-making. The main outcome of our research is the proof of the social influence excerpt by users, each in a cooperative environment when a kind of reward is provided. In more detail, we proved that the influence tends to be negative when the reward is tangible (such as money) or positive if the reward is intangible (such as gaining popularity in an expert environment).
As a future work, we plan to investigate more scalable approaches to extend our results in a larger environment.

Author Contributions

Conceptualization, E.B. and D.S.; Data curation, I.T.; Methodology, D.C.; Software, N.C.; Validation, A.S.; Writing—review & editing, E.M.

Funding

This research was funded by Ministero dell’Istruzione, dell’Università e della Ricerca: D-ALL.

Conflicts of Interest

The authors declare no conflict of interest.

References

  1. Big Data. Nature 2008. Available online: https://www.nature.com/collections/wwymlhxvfs (accessed on 30 November 2018).
  2. Borkar, V.R.; Carey, M.J.; Li, C. Inside “Big Data Management”: Ogres, Onions, or Parfaits? In International Conference on Extending Database Technology; Rundensteiner, E.A., Markl, V., Manolescu, I., Amer-Yahia, S., Naumann, F., Ari, I., Eds.; ACM: New York, NY, USA, 2012; pp. 3–14. [Google Scholar]
  3. Lohr, S. The Age of Big Data. 2012. Available online: nytimes.com (accessed on 30 November 2018).
  4. Manyika, J.; Chui, M.; Brown, B.; Bughin, J.; Dobbs, R.; Roxburgh, C.; Byers, A.H. Big Data: The Next Frontier for Innovation, Competition, And Productivity; McKinsey Global Institute: New York, NY, USA, 2011. [Google Scholar]
  5. Agrawal, D.; Bernstein, P.; Bertino, E.; Davidson, S.; Dayal, U.; Franklin, M.; Gehrke, J.; Haas, L.; Halevy, A.; Han, J.; et al. Challenges and Opportunities With Big Data—A Community White Paper Developed by Leading Researchers across The United States; ACM: New York, NY, USA, 2012. [Google Scholar]
  6. Data, Data Everywhere. The Economist. 25 February 2010. Available online: https://www.emc.com/collateral/analyst-reports/ar-the-economist-data-data-everywhere.pdf (accessed on 30 November 2018).
  7. Cassavia, N.; Flesca, S.; Ianni, M.; Masciari, E.; Pulice, C. Distributed computing by leveraging and rewarding idling user resources from P2P networks. J. Parallel Distrib. Comput. 2018, 122, 81–94. [Google Scholar] [CrossRef]
  8. Almgren, K.; Lee, J. An empirical comparison of influence measurements for social network analysis. Soc. Netw. Anal. Min. 2016, 6, 52:1–52:18. [Google Scholar] [CrossRef]
  9. Rodríguez, H.; Macías, J.; Montalván, N.; Garzozi, R. Influence of Social Networks from Cellphones to Choose Restaurants, Salinas—2016. In Proceedings of International Conference on Information Theoretic Security (ICITS 2018); Springer: Cham, Switzerland, 2018; pp. 992–1003. [Google Scholar]
  10. Cassavia, N.; Masciari, E.; Pulice, C.; Saccà, D. Discovering User Behavioral Features to Enhance Information Search on Big Data. TiiS 2017, 7, 7:1–7:33. [Google Scholar] [CrossRef]
  11. Almgren, K.; Lee, J. Applying an influence measurement framework to large social network. J. Netw. Technol. 2016, 7, 7. [Google Scholar]
  12. Kempe, D.; Kleinberg, J.M.; Tardos, É. Maximizing the Spread of Influence Through a Social Network. In Proceedings of the Ninth ACM SIGKDD International Conference on Knowledge Discovery and Data Mining, Washington, DC, USA, 24–27 August 2003; pp. 137–146. [Google Scholar]
  13. Lou, V.Y.; Bhagat, S.; Lakshmanan, L.V.S.; Vaswani, S. Modeling Non-Progressive Phenomena for Influence Propagation; CoRR: Leawood, KS, USA, 2014. [Google Scholar]
  14. Brown, L.D. Fundamentals of Statistical Exponential Families with Applications in Statistical Decision Theory. Available online: https://ci.nii.ac.jp/naid/10000043684/ (accessed on 30 November 2018).
  15. Krivitsky, P.N.; Butts, C.T. Exponential-family random graph models for rank-order relational data. Sociol. Methodol. 2017. [Google Scholar] [CrossRef]
  16. Zhang, C.J.; Chen, L.; Tong, Y.; Liu, Z. Cleaning uncertain data with a noisy crowd. In Proceedings of the 31st IEEE International Conference on Data Engineering (ICDE), Seoul, Korea, 13–17 April 2015; pp. 6–17. [Google Scholar]
  17. Budak, C.; Agrawal, D.; El Abbadi, A. Limiting the spread of misinformation in social networks. In Proceedings of the 20th International Conference on World Wide Web (WWW’11), Hyderabad, India, 28 March–1 April 2011; pp. 665–674. [Google Scholar]
  18. Chomicki, J.; Marcinkowski, J. Minimal-change integrity maintenance using tuple deletions. Inf. Comput. 2005, 197, 90–121. [Google Scholar] [CrossRef]
  19. Wijsen, J. A Survey of the Data Complexity of Consistent Query Answering under Key Constraints. In Proceedings of the International Symposium on Foundations of Information and Knowledge Systems (FoIKS), Bordeaux, France, 3–7 March 2014; pp. 62–78. [Google Scholar]
  20. Arenas, M.; Bertossi, L.E.; Chomicki, J. Consistent Query Answers in Inconsistent Databases. In Proceedings of the Eighteenth ACM SIGMOD-SIGACT-SIGART Symposium on Principles of Database Systems (PODS’99), Philadelphia, PA, USA, 31 May–3 June 1999; pp. 68–79. [Google Scholar]
  21. Lembo, D.; Lenzerini, M.; Rosati, R.; Ruzzi, M.; Savo, D.F. Inconsistency-Tolerant Semantics for Description Logics; Hitzler, P., Lukasiewicz, T., Eds.; Web Reasoning and Rule Systems, RR 2010, Lecture Notes in Computer Science; Springer: Berlin/Heidelberg, Germany, 2010; Volume 6333. [Google Scholar]
  22. Lembo, D.; Lenzerini, M.; Rosati, R.; Ruzzi, M.; Savo, D.F. Query Rewriting for Inconsistent DL-Lite Ontologies; Rudolph, S., Gutierrez, C., Eds.; Web Reasoning and Rule Systems, RR 2011; Lecture Notes in Computer Science; Springer: Berlin/Heidelberg, Germany, 2011; Volume 6902, pp. 155–169. [Google Scholar]
  23. Lembo, D.; Lenzerini, M.; Rosati, R.; Ruzzi, M.; Savo, D.F. Inconsistency-tolerant query answering in ontology-based data access. J. Web Semant. 2015, 33, 3–29. [Google Scholar] [CrossRef]
  24. Bienvenu, M. First-Order Expressibility Results for Queries over Inconsistent DL-Lite Knowledge Bases. In Proceedings of the 24th International Workshop on Description Logics (DL 2011), Barcelona, Spain, 13–16 July 2011. [Google Scholar]
  25. Bienvenu, M. On the Complexity of Consistent Query Answering in the Presence of Simple Ontologies. In Proceedings of the Twenty-Sixth AAAI Conference on Artificial Intelligence (AAAI’12), Toronto, ON, Canada, 22–26 July 2012. [Google Scholar]
  26. Rosati, R. On the Complexity of Dealing with Inconsistency in Description Logic Ontologies. In Proceedings of the Twenty-SeconD International Joint Conference on Artificial Intelligence—Volume Two (IJCAI’11), Barcelona, Spain, 16–22 July 2011; pp. 1057–1062. [Google Scholar]
  27. Bienvenu, M.; Rosati, R. Tractable Approximations of Consistent Query Answering for Robust Ontology-based Data Access. In Proceedings of the Twenty-Third International Joint Conference on Artificial Intelligence (IJCAI’3), Beijing, China, 3–9 August 2013; pp. 775–781. [Google Scholar]
  28. Lukasiewicz, T.; Martinez, M.V.; Simari, G.I. Inconsistency-Tolerant Query Rewriting for Linear Datalog+/−. In Proceedings of the Second international conference on Datalog in Academia and Industry (Datalog 2.0’12), Vienna, Austria, 11–13 September 2012; pp. 123–134. [Google Scholar]
  29. Lukasiewicz, T.; Martinez, M.V.; Simari, G.I. Complexity of Inconsistency-Tolerant Query Answering in Datalog+/−. In Proceedings of the OTM 2013 Conferences: Confederated International Conferences: CoopIS, DOA-Trusted Cloud, and ODBASE 2013, Graz, Austria, 9–13 September 2013; pp. 488–500. [Google Scholar]
  30. Lukasiewicz, T.; Martinez, M.V.; Pieris, A.; Simari, G.I. From Classical to Consistent Query Answering under Existential Rules. In Proceedings of the Twenty-Ninth AAAI Conference on Artificial Intelligence, Austin, TX, USA, 25–30 January 2015; pp. 1546–1552. [Google Scholar]
  31. Lukasiewicz, T.; Martinez, M.V.; Simari, G.I. Inconsistency Handling in Datalog+/− Ontologies. In Proceedings of the 20th European Conference on Artificial Intelligence (ECAI 2012), Montpellier, France, 27–31 August 2012; pp. 558–563. [Google Scholar]
  32. Bienvenu, M.; Bourgaux, C.; Goasdoué, F. Querying Inconsistent Description Logic Knowledge Bases under Preferred Repair Semantics. In Proceedings of the Twenty-Eighth AAAI Conference on Artificial Intelligence (AAAI’14), Québec City, QC, Canada, 27–31 July 2014; pp. 996–1002. [Google Scholar]
  33. Furfaro, F.; Greco, S.; Molinaro, C. A three-valued semantics for querying and repairing inconsistent databases. Ann. Math. Artif. Intell. 2007, 51, 167–193. [Google Scholar] [CrossRef]
  34. Bohannon, P.; Flaster, M.; Fan, W.; Rastogi, R. A Cost-Based Model and Effective Heuristic for Repairing Constraints by Value Modification. In Proceedings of the 2005 ACM SIGMOD International Conference on Management of Data (SIGMOD’05), Baltimore, MD, USA, 14–16 June 2005; pp. 143–154. [Google Scholar]
  35. Bertossi, L.E.; Bravo, L.; Franconi, E.; Lopatenko, A. The complexity and approximation of fixing numerical attributes in databases under integrity constraints. Inf. Syst. 2008, 33, 407–434. [Google Scholar] [CrossRef]
  36. Greco, S.; Molinaro, C. Approximate Probabilistic Query Answering over Inconsistent Databases; Li, Q., Spaccapietra, S., Yu, E., Olivé, A., Eds.; i Conceptual Modeling—ER 2008, Lecture Notes in Computer Science; Springer: Berlin/Heidelberg, Germany, 2008; Volume 5231, pp. 311–325. [Google Scholar]
  37. Greco, S.; Molinaro, C. Probabilistic query answering over inconsistent databases. Ann. Math. Artif. Intell. 2012, 64, 185–207. [Google Scholar] [CrossRef]
  38. Flesca, S.; Furfaro, F.; Parisi, F. Querying and repairing inconsistent numerical databases. ACM Trans. Database Syst. 2010, 35, 14:1–14:50. [Google Scholar] [CrossRef]
  39. Greco, S.; Molinaro, C.; Trubitsyna, I. Computing Approximate Query Answers over Inconsistent Knowledge Bases. In Proceedings of the Twenty-Seventh International Joint Conference on Artificial Intelligence (IJCAI 2018), Stockholm, Sweden, 13–19 July 2018; pp. 1838–1846. [Google Scholar] [CrossRef]
  40. Martinez, M.V.; Parisi, F.; Pugliese, A.; Simari, G.I.; Subrahmanian, V.S. Policy-based inconsistency management in relational databases. Int. J. Approx. Reason. 2014, 55, 501–528. [Google Scholar] [CrossRef]
  41. Guagliardo, P.; Libkin, L. Making SQL Queries Correct on Incomplete Databases: A Feasibility Study. In Proceedings of the 35th ACM SIGMOD-SIGACT-SIGAI Symposium on Principles of Database Systems (PODS’16), San Francisco, CA, USA, 26 June–1 July 2016; pp. 211–223. [Google Scholar]
  42. Libkin, L. How to Define Certain Answers. In Proceedings of the International Joint Conferences on Artificial Intelligence (IJCAI), Buenos Aires, Argentina, 25–31 July 2015; pp. 4282–4288. [Google Scholar]
  43. Libkin, L. Certain answers as objects and knowledge. Artif. Intell. 2016, 232, 1–19. [Google Scholar] [CrossRef]
  44. Greco, S.; Molinaro, C.; Trubitsyna, I. Computing Approximate Certain Answers over Incomplete Databases. In Proceedings of the 11th Alberto Mendelzon International Workshop on Foundations of Data Management and the Web, Montevideo, Uruguay, 7–9 June 2017. [Google Scholar]
  45. Andritsos, P.; Fuxman, A.; Miller, R.J. Clean Answers over Dirty Databases: A Probabilistic Approach. In Proceedings of the 22nd International Conference on Data Engineering (ICDE’06), Atlanta, GA, USA, 3–7 April 2006; p. 30. [Google Scholar]
  46. Calautti, M.; Libkin, L.; Pieris, A. An Operational Approach to Consistent Query Answering. In Proceedings of the 37th ACM SIGMOD-SIGACT-SIGAI Symposium on Principles of Database Systems, Houston, TX, USA, 10–15 June 2018; pp. 239–251. [Google Scholar] [CrossRef]
  47. Fagin, R.; Kolaitis, P.G.; Miller, R.J.; Popa, L. Data exchange: Semantics and query answering. Theor. Comput. Sci. 2005, 336, 89–124. [Google Scholar] [CrossRef]
  48. Deutsch, A.; Nash, A.; Remmel, J.B. The chase revisited. In Proceedings of the Twenty-Seventh ACM SIGMOD-SIGACT-SIGART Symposium on Principles of Database Systems (PODS 2008), Vancouver, BC, Canada, 9–11 June 2008; pp. 149–158. [Google Scholar] [CrossRef]
  49. Greco, S.; Spezzano, F.; Trubitsyna, I. Checking Chase Termination: Cyclicity Analysis and Rewriting Techniques. IEEE Trans. Knowl. Data Eng. 2015, 27, 621–635. [Google Scholar] [CrossRef]
  50. Calautti, M.; Greco, S.; Molinaro, C.; Trubitsyna, I. Exploiting Equality Generating Dependencies in Checking Chase Termination. PVLDB 2016, 9, 396–407. [Google Scholar] [CrossRef]
  51. Cassavia, N.; Masciari, E.; Pulice, C.; Saccà, D. Discovering User Behavioral Features to Enhance Information Search on Big Data. TiiS 2017, 7, 7:1–7:33. [Google Scholar] [CrossRef]
  52. Saccà, D.; Serra, E.; Guzzo, A. Count Constraints and the Inverse OLAP Problem: Definition, Complexity and a Step toward Aggregate Data Exchange; Lukasiewicz, T., Sali, A., Eds.; Lecture Notes in Computer Science; Springer: Berlin, Germany, 2012; Volume 7153, pp. 352–369. [Google Scholar]
  53. Borodin, A.; Filmus, Y.; Oren, J. Threshold Models for Competitive Influence in Social Networks. In Proceedings of the 6th International Conference on Internet and Network Economics (WINE’10), Stanford, CA, USA, 13–17 December 2010; pp. 539–550. [Google Scholar]
  54. Chen, W.; Wang, Y.; Yang, S. Efficient Influence Maximization in Social Networks. In Proceedings of the 15th ACM SIGKDD International Conference on Knowledge Discovery and Data Mining (KDD ’09), Paris, France, 28 June–1 July 2009; pp. 199–208. [Google Scholar]
  55. Du, N.; Song, L.; Gomez-Rodriguez, M.; Zha, H. Scalable Influence Estimation in Continuous-Time Diffusion Networks; NIPS: London, UK, 2013; pp. 3147–3155. [Google Scholar]
  56. Aggarwal, C.C.; Reddy, C.K. (Eds.) Data Clustering: Algorithms and Applications; CRC Press: Boca Raton, FL, USA, 2014. [Google Scholar]
  57. Greco, S.; Masciari, E.; Pontieri, L. Combining inductive and deductive tools for data analysis. AI Commun. 2001, 14, 69–82. [Google Scholar]
  58. Masciari, E.; Mazzeo, G.M.; Zaniolo, C. Analysing microarray expression data through effective clustering. Inf. Sci. 2014, 262, 32–45. [Google Scholar] [CrossRef]
  59. Mazzeo, G.M.; Masciari, E.; Zaniolo, C. A fast and accurate algorithm for unsupervised clustering around centroids. Inf. Sci. 2017, 400, 63–90. [Google Scholar] [CrossRef]
Figure 1. Coremuniti system at work.
Information 09 00303 g001
Figure 2. A graph exhibiting shared partners’ structure.
Information 09 00303 g002
Table 1. MH sampling and cross-sectional analysis.
Week GNC LNC DA
1 0.000 0.013 0.133
2 0.001 0.014 0.138
3 0.002 0.017 0.146
4 0.002 0.020 0.166
5 0.002 0.028 0.211
6 0.003 0.043 0.278
7 0.002 0.040 0.302
8 0.002 0.037 0.366
9 0.002 0.039 0.384
10 0.001 0.040 0.399
11 0.002 0.036 0.417
12 0.001 0.038 0.422
13 0.001 0.039 0.433
14 0.001 0.040 0.442
15 0.000 0.039 0.451
16 0.001 0.040 0.460
Table 2. MH sampling and dynamic analysis.
WeekTransition GNC LNC DA
1 2 0.000 0.011 0.221
2 3 0.001 0.016 0.241
3 4 0.002 0.018 0.266
4 5 0.002 0.022 0.322
5 6 0.001 0.024 0.341
6 7 0.001 0.026 0.348
7 8 0.002 0.024 0.367
8 9 0.002 0.028 0.411
9 10 0.003 0.031 0.432
10 11 0.002 0.035 0.466
11 12 0.002 0.034 0.479
12 13 0.002 0.033 0.485
13 14 0.002 0.031 0.502
14 15 0.001 0.032 0.511
15 16 0.001 0.035 0.525
Table 3. Clustering based sampling and cross-sectional analysis.
Week GNC LNC DA
1 0.000 0.018 0.127
2 0.001 0.019 0.141
3 0.001 0.021 0.166
4 0.002 0.024 0.174
5 0.003 0.042 0.181
6 0.002 0.053 0.188
7 0.002 0.058 0.192
8 0.002 0.062 0.195
9 0.001 0.067 0.199
10 0.002 0.071 0.194
11 0.001 0.073 0.192
12 0.001 0.075 0.193
13 0.001 0.079 0.191
14 0.002 0.081 0.190
15 0.002 0.083 0.193
16 0.001 0.085 0.194
Table 4. Clustering based sampling and dynamic analysis.
Week GNC LNC DA
1 2 0.000 0.011 0.144
2 3 0.001 0.015 0.167
3 4 0.000 0.019 0.171
4 5 0.001 0.021 0.181
5 6 0.001 0.033 0.184
6 7 0.001 0.041 0.186
7 8 0.000 0.047 0.19
8 9 0.001 0.051 0.198
9 10 0.001 0.059 0.197
10 11 0.000 0.061 0.189
11 12 0.001 0.072 0.185
12 13 0.001 0.082 0.174
13 14 0.001 0.084 0.181
14 15 0.000 0.089 0.188
15 16 0.000 0.091 0.187

