Article

The Impact of Message Replication on the Performance of Opportunistic Networks for Sensed Data Collection

by
Tekenate E. Amah
1,*,
Maznah Kamat
1,
Kamalrulnizam Abu Bakar
1,
Syed Othmawi Abd Rahman
1,
Muhammad Hafiz Mohammed
1,
Aliyu M. Abali
1,
Waldir Moreira
2 and
Antonio Oliveira-Jr
3
1
Department of Computer Science, Faculty of Computing, Universiti Teknologi Malaysia, Skudai 81310, Johor, Malaysia
2
Fraunhofer-AICOS, Porto 4200-135, Portugal
3
Institute of Informatics, Federal University of Goiás, Goiânia 74690-900, GO, Brazil
*
Author to whom correspondence should be addressed.
Information 2017, 8(4), 143; https://doi.org/10.3390/info8040143
Submission received: 3 October 2017 / Revised: 6 November 2017 / Accepted: 6 November 2017 / Published: 9 November 2017

Abstract

:
Opportunistic networks (OppNets) provide a scalable solution for collecting delay-tolerant data from sensors to their respective gateways. Portable handheld user devices contribute significantly to the scalability of OppNets since their number increases according to user population and they closely follow human movement patterns. Hence, OppNets for sensed data collection are characterised by high node population and degrees of spatial locality inherent to user movement. We study the impact of these characteristics on the performance of existing OppNet message replication techniques. Our findings reveal that the existing replication techniques are not specifically designed to cope with these characteristics. This raises concerns regarding excessive message transmission overhead and throughput degradations due to resource constraints and technological limitations associated with portable handheld user devices. Based on concepts derived from the study, we suggest design guidelines to augment existing message replication techniques. We also follow our design guidelines to propose a message replication technique, namely Locality Aware Replication (LARep). Simulation results show that LARep achieves better network performance under high node population and degrees of spatial locality as compared with existing techniques.

1. Introduction

The rapid growth of human population and the increasing flow towards urban areas [1] indicates a need for smart sustainable cities, where there are preventive maintenance activities and resource optimization for critical infrastructure such as transportation, communications, water, and energy. In order to achieve this, information communications technology (ICT) is tasked with developing economical and pervasive solutions to improve the quality of life through efficient urban operations and services. Wireless sensors play an important role in this regard. With the concept of Internet of Things (IoT), which would see sensors widely deployed in the environment and embedded in physical objects, the applications are almost limitless.
The sensors in IoT scenarios need to be connected to the Internet in order to share the generated information across multiple platforms and facilitate various applications. To accomplish this, a backhaul is required to collect and convey sensed data to gateways that are connected to remote management centres through the Internet [2]. With sensors spatially displaced in the environment, the desired level of coverage can be directly achieved through long-range communication technologies or by deploying numerous relay nodes. However, with finite resources and limited budgets [3], it is challenging to achieve the required level of scalability with respect to the cost of procuring, installing, and maintaining supporting infrastructure for every application. For instance, it is not economical to equip each sensor node with cellular connectivity (e.g., Du et al. [4] reports an annual cost of ~$380 per sensor) and the high transmission power reduces sensor lifetime. It is also uneconomical to deploy relay nodes to collect data from sensors via wireless mesh networks with ad hoc technologies (e.g., the sensor network across Wuxi City, China [5] for CO2 data requires approximately 11 relays per sensor for proper collection). Another backhaul option is the existing communication infrastructure in cities, such as networks offering Internet access to citizens [2]. However, with mobile data traffic on the rise due to the widespread use of mobile devices and content-centric services (e.g., live audio and video streaming) among users [6], introducing sensed data shall contribute in overloading the network.
By leveraging pervasive mobile devices (such as smartphones and tablets) as data mules, opportunistic networks (OppNets) provide a satisfactory level of scalability and also eliminate the costs in setting up wireless networks with ad hoc technologies. Based on the store-carry-forward (SCF) communication paradigm, data-bundles (or messages) stored in device buffers are carried from one point to another as the user moves about. When user devices encounter each other (i.e., come within radio transmission range), they exchange a list of messages in their buffers and may decide to forward some of them through available short-range wireless communication interfaces such as Bluetooth or Wi-Fi. Although delivering a message in this manner may take a relatively long time (as compared with the traditional networks [7,8,9,10]), it is suitable for a subset of Smart City applications that only require occasional sensor node connectivity opportunities (e.g., twice a day) and also utilize data that can tolerate delays of up to hours or a day (e.g., agricultural monitoring [11], habitat monitoring [12] and environmental monitoring data for: garbage collection and green zone management [2]; analysis of noise levels and water quality [13]; river pollution management [14]; and for meter readings [15]). Thus, OppNets come in handy as a backhaul solution since they address two main challenges. First, the desired coverage is achieved without costs of procuring, installing and maintaining supporting infrastructure by leveraging pervasive mobile devices as data mules (e.g., [16,17,18]). Second, direct device-to-device communication through available short-range wireless communication technologies offloads infrastructure networks and frees bandwidth for mobile users (e.g., [19,20,21]).
The benefits of opportunistically collecting delay-tolerant data for Smart City applications have motivated various studies. For example, the spatial analysis of a city-wide mobility dataset of Beijing, which suggests that knowledge of daily user travel patterns can be exploited to design more effective data collection protocols [17]. Also supporting these results are findings from smartphone mobility traces [22], which identify strong spatial and temporal localities as important characteristics of user mobility that need to be considered in the design of data collection protocols and algorithms. There are also contributions on protocol evaluation (e.g., the implementation of an OppNet testbed for a large-scale Smart City platform that utilizes an opportunistic backhaul [18]), duty-cycling (e.g., extending sensor node lifetime through a sensor node-initiated probing mechanism that exploits periods of the day during which encounters with portable handheld user devices are more frequent [23]) and the wireless communication technology (e.g., an analytical and experimental study of the performance and trade-offs of collecting sensed data with Bluetooth Low Energy [24]).

1.1. Message Transmission Overhead in OppNets

Portable handheld user devices (e.g., smartphones and tablets) have become inseparable components of OppNets. Besides their ability to serve as routers, they present the primary user interface, as they are the main platform for human communication today. These devices can now be perceived as the users themselves: their attachment to humans allows them to follow and learn user movement patterns, gather social information about the user, as well as maintain user contextual information (e.g., contact information, occupation and preferences). While the presence of these devices contributes to the feasibility of collecting sensed delay-tolerant data with OppNets, it is also responsible for certain challenges that befall network protocol design.
Due to freedom of human movement and long intervals that may exist between successive encounters, messages may remain buffered in relay nodes for relatively long periods in the order of hours to days. Although delay is tolerated in OppNets, it is preferable to keep it minimal, in order to reduce message loss due to time-to-live (TTL) exhaustion or buffer overflows at congested nodes. This is often curbed by generating multiple copies of a message (referred to as “message replication” in this paper) and sending them through different routes. However, an optimal performance requires a careful selection of the number of copies for each message. Too many copies may lead to excessive transmissions, frequent buffer overflows, and rapid battery depletion. Fewer copies, on the other hand, may reduce throughput, due to less delivery guarantees and increased delays.
Therefore, in order for nodes to collectively optimize overall network performance, a major challenge lies in their ability to decide how many copies to generate per message, and when to generate a copy. Nodes require knowledge about the network to make such decisions. Unfortunately, due to the infrastructure-less nature of the network and high dynamicity of user movement, global knowledge about the network is not available to nodes. Attempts to obtain global knowledge may be impractical [25] and often threatens the feasibility of the technology [26]. Such attempts may result in excessive bandwidth utilization, transmission overheads, and may also compromise throughput. Furthermore, the dynamicity of the network poses difficulties in obtaining up-to-date knowledge [27]. Routing solutions also need to cope with portable handheld user device characteristics typical of the application scenario, such as high population and degrees of spatial locality [28].

1.2. Authors’ Contribution

Clearly, the presence of portable handheld user devices introduce several unique characteristics that need to be considered in order to realize efficient, feasible and robust routing solutions for collecting sensed data with OppNets. Unfortunately, most of the existing routing protocols utilize message replication techniques that are not designed in accordance with these characteristics, thereby degrading their performance and feasibility in real-world implementation. In this regard, we augment existing message replication techniques through the following contributions:
  • First, we establish relevant characteristics that the presence of portable handheld user devices introduces to OppNets for sensed data collection. Then, we investigate the impact of these characteristics on existing message replication techniques, and suggest related design guidelines that need to be observed in order to improve routing performance and feasibility in real-world implementation.
  • Second, we follow our design guidelines to propose a set of mechanisms that collectively form a message replication technique, namely Locality Aware Replication (LARep). When incorporated into relevant routing protocols, LARep reduces message transmission overhead without compromising throughput. Simulation results show that LARep achieves better performance as compared with existing replication techniques.

1.3. Organization of the Paper

The remainder of this work is organized as follows. Our first contribution is detailed in Section 2. First, we present the need for message replication techniques in OppNets, identify network characteristics that need to be observed when replicating messages, and overview existing message replication techniques. Then, we investigate the current state of message replication in OppNets with respect to sensed data collection, and suggest design guidelines for message replication techniques. For our second contribution, we follow our design guidelines to propose a technique for improving message replication in Section 3. In particular, we consider the unique characteristics of OppNets for sensed data collection to propose a set of mechanisms and an algorithm that constitute LARep. In Section 4, we evaluate our proposed LARep through simulation experiments. Finally, Section 5 concludes the paper and discusses future work.

2. Message Replication in OppNets for Sensed Data Collection

In this section, we study message replication in OppNets for sensed data collection. First, Section 2.1 presents the need for message replication techniques in OppNets. In Section 2.2, OppNet characteristics general characteristics as well as those specific to scenarios for collecting sensed data that need to be observed by message replication techniques are identified. Then, Section 2.3 provides an overview on the existing message replication techniques. The current state of message replication in OppNets with respect to sensed data collection is then investigated in Section 2.4. Finally, we conclude this section by suggesting message replication guidelines for collecting sensed data with OppNets in Section 2.5.

2.1. Need for Message Replication Techniques

OppNet routing protocols require knowledge about the network in order to determine suitable relay nodes during message forwarding. While knowledge can be derived from similarities in node movement patterns (e.g., MobySpace [29]) or social characteristics (e.g., PeopleRank [30], Bubble Rap [31] and dLife [32]), gateway nodes are neither mobile nor portray social characteristics. Also, the lack of adequate contextual information on gateway nodes limits the applicability of context-aware approaches (e.g., CiPRO [33]). By maintaining and updating history of encounters, encounter-based routing protocols can efficiently identify routing paths to gateway nodes [31], thereby making them more suitable for sensed data collection. With encounter-based routing, the ability of a node to contribute towards delivering a message is usually determined by computing its “forwarding utility” for the destination. Although different encounter-based protocols adopt different strategies for computing forwarding utilities, the concept is often the same, such that a higher value indicates higher delivery ability (e.g., PRoPHET [34] routing). Message replication on the other hand, is tasked with controlling the number of message copies introduced in the network. To explain this, consider the network illustrated in Figure 1, which consists of 11 nodes labelled a to k (note that this illustration is for explanatory purposes only and the topology, e.g., the number of nodes and their links, is not in accordance with any particular pattern). The nodes are connected by delay-tolerant links, meaning that two connected nodes are neighbours that regularly encounter each other.
Taking node a ’s forwarding utility for node k as U a ( k ) , node a forwards a copy of a message that is destined for node k to node b , if U b ( k ) > U a ( k ) . The direction of the link indicates the flow of the message towards the destination based on increasing forwarding utility values. Hence, source node a is likely to generate more copies of a message destined for node k than source node i would. In other words, source node i is likely to generate fewer copies than source node a since U i ( k ) > U a ( k ) . For example, node a would generate 11 copies of a message destined for node k (i.e., every node in the network would have a copy), while node i would generate only 3 copies (i.e., only node i , node j and node k would have copies). This shows that the forwarding utility alone is not a good indicator of the number of message copies generated in the network, and directly modifying it in this regard may reduce its ability to determine suitable relay nodes. This justifies the need for additional algorithms or mechanisms that can control the number of generated message copies without interfering with forwarding utility computation. For instance, every node, including source node a , could drop the message after forwarding a copy. This would generate either 5, 6 or 4 copies, depending on the neighbour that encounters the source node first. Delivery opportunity could be increased by allowing the source node to drop the message after forwarding it twice. This case would generate either 9, 7 or 8 copies, depending on the two neighbours that the source node encounters first. We refer to such algorithms or mechanisms as “message replication techniques”. Next, we identify OppNet characteristics that impact on the performance of message replication techniques. Then, we study existing message replication techniques and how they perform in the presence of the identified characteristics in Section 2.3 and Section 2.4, respectively.

2.2. Handheld User Devices and OppNets for Sensed Data Collection

Unique OppNet characteristics such as operating without relying on supporting infrastructure, absence of central administration, lack of end-to-end connectivity, and node mobility bring about new challenges, especially in the aspect of routing. As a result, nodes lack global or up-to-date knowledge about the network, and attempts at obtaining such knowledge may risk making assumptions that go against network characteristics. For instance, obtaining knowledge about available forwarding routes may require making incorrect assumptions that the network topology is fairly stable or that there is some sort of central administration. Also, the presence of portable handheld user devices introduces additional challenges that determine the feasibility and performance of message replication techniques for sensed data collection. We identify these characteristics in the following subsections, in order to facilitate investigation on the current state of message replication.

2.2.1. General Characteristics

The general characteristics of OppNets for sensed data collection introduced by portable handheld user devices are mainly related to technological challenges. Due to the versatility of these devices, users are willing to contribute only a limited amount of their resources (in terms of battery, memory and processing power) to the network. OppNets preferably exploit the short-range communication interfaces available on portable handheld devices in order to minimize energy consumption. The use of short-range communication interfaces also introduces additional characteristics, such as limited bandwidth on the network side. Hence, it is important that overheads in OppNets are minimized as much as possible, in order to maintain feasibility and encourage user participation.

2.2.2. Characteristics Specific to Smart City Scenarios

A. Higher User and Node Population
The impact of node population on message transmission overhead can be observed from the scenario in Figure 1, in which more message copies are generated when more relay nodes are present. With human population growing rapidly (at an average rate of 1.2% per annum over the last 50 years) and increasingly flowing towards urban areas [1], the number of portable handheld user devices in Smart Cities is expected to increase significantly in the years to come. Other nodes that can be connected with these devices in such environments (e.g., sensors, vehicles, and appliances) are likely to increase in number as well. Consequently, OppNets for sensed data collection are likely to consist of large number of nodes—a city for instance, with some hundred thousand (handheld and static) nodes. Hence, it would be preferable if message transmission overhead does not tend to rise at a high rate with user and device population.
B. Higher Degrees of Spatial Locality and Dynamicity in Human Movement
Freedom of user movement coupled with short transmission ranges results in short-lived encounters, frequent disconnections and a highly dynamic network topology. User movement also exhibits high degrees of spatial and temporal locality. Studies show that users regularly visit only one or few regions(s) in the network. McNett and Voelker [35] analyse the mobility patterns of 275 users equipped with handheld PDAs in a campus wireless network. Their results show that only few users—less than 2% of them—were associated with a very high number of access points in the network. A similar study conducted by Wang et al. [36] on Dartmouth College’s WLAN mobility trace shows that nodes visit their first two preferred locations at a probability of 70%. Hasan et al. [37] also observe that most of the time, nodes visit only few locations in the network with high probability of return, which often corresponds to their home and workplace. Zhao et al. [38] study movement traces in a campus and find that the students usually take relatively few trips—less than four—and visit relatively few different locations—less than five—per day.
It is also evident from studies in literature that a strong correlation exists between encounter frequency and geographic proximity. Zhu et al. [39] study real world movement traces and show that the number of encounters between node pairs decreases rapidly when the distance between their home regions increases. No node pair whose home proximity is greater than 4km had more than 100 encounters. Thus, nodes tend to move within a local area, and this influences the encounters it experiences. The results also show that encounters between nodes from the same region are significantly more than encounters between nodes from different regions, since only a small proportion of node movement spans longer distances. Based on this intuition, Yu et al. [40] attempt to improve delivery rate by sending messages to the home region of the destination. These characteristics indicate that the mobility of portable handheld user devices and their encounters are not random, and OppNet solutions need to be designed accordingly since they rely on node movement and encounter opportunities.

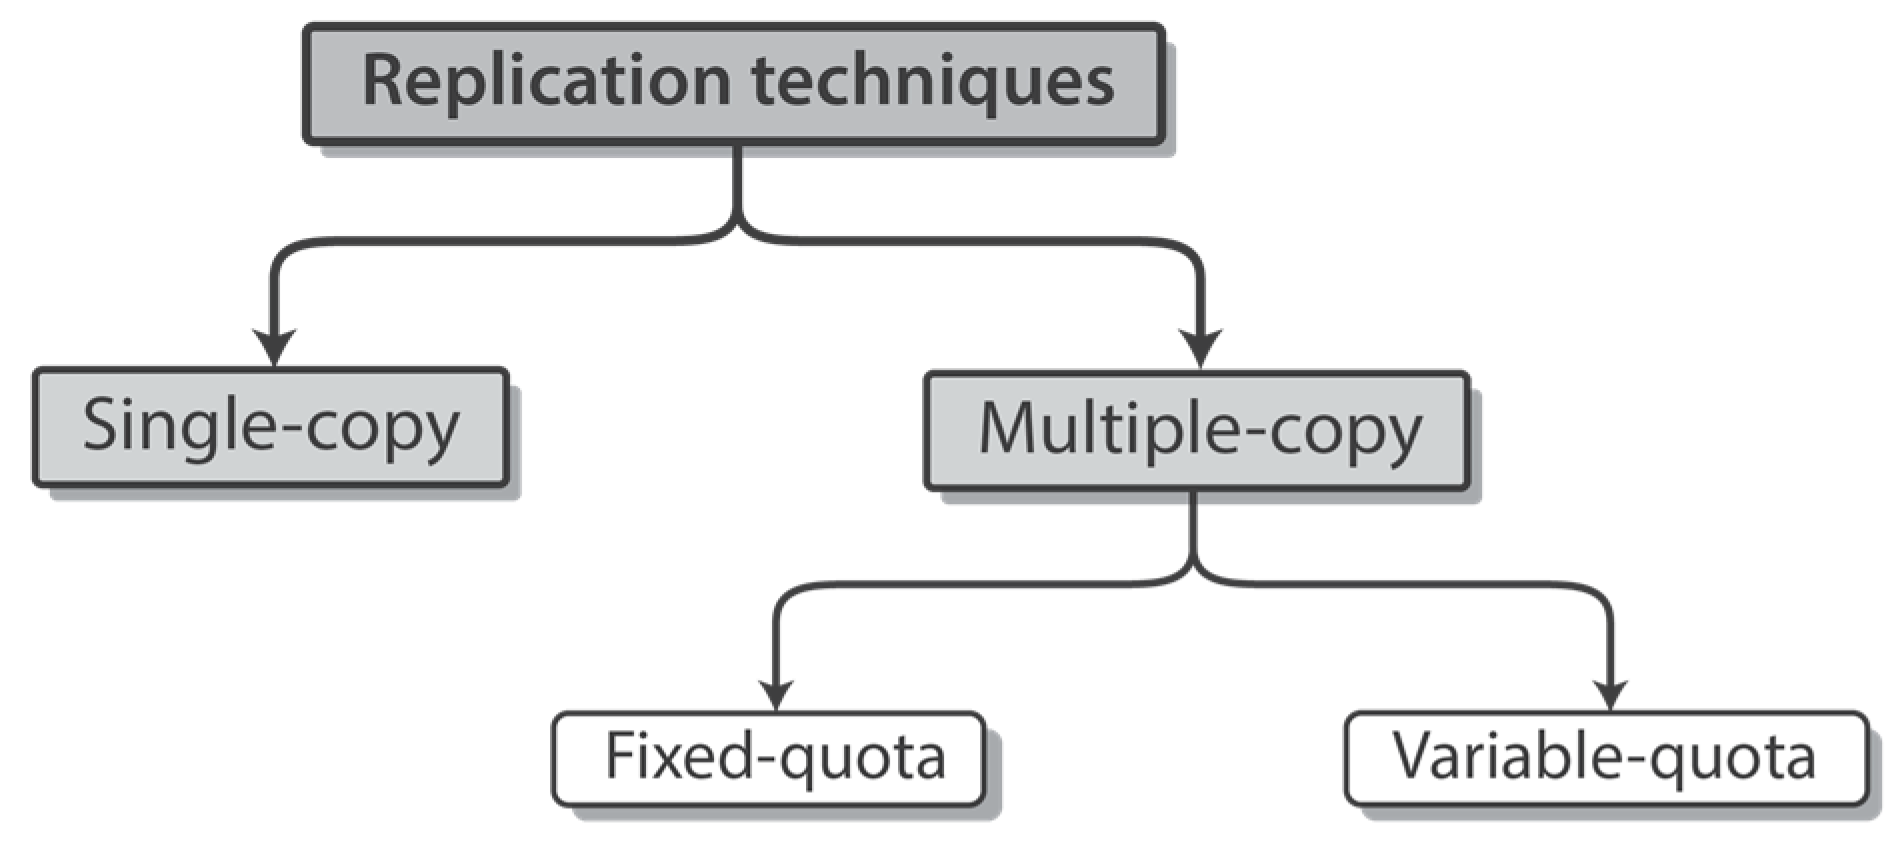
2.3. Existing Message Replication Techniques

Due to freedom of user movement, short-lived encounters and device inconsistencies, it is often required to send multiple copies of messages through different routes in order to guarantee their delivery. At the same time, the number of copies needs to be kept minimal due to resource constraints on portable handheld user devices. The absence of supporting infrastructure, end-to-end connectivity and central administration imposes many challenges in achieving this balance. Consequently, network designers resort to inferring knowledge from locally available information through best effort heuristics, without guarantees about their convergence properties towards the desired global outcome. This section provides an overview of the existing message replication techniques for OppNets according to the taxonomy in Figure 2.

2.3.1. Single-Copy Replication

Message replication techniques can be classified into two main categories, namely single-copy and multiple-copy. Single-copy replication allows only one copy of each message in the network. Examples are the replication techniques of Direct Transmission [41] and First Contact [42]. The former buffers the message at the source until the destination is directly encountered, while the latter achieves single-copy replication by removing from the buffer messages that have been successfully forwarded to a relay node.

2.3.2. Multiple-Copy Replication

Multiple-copy replication, on the other hand, associates messages with a replication quota (i.e., number of permitted replicas) that may either be fixed or variable.
A. Fixed-Quota Replication
Fixed-quota replication is achieved by “spraying” a certain number of message copies in the network, and then by utilizing single-copy replication to disseminate them afterwards. The number of copies to be sprayed is termed as the message quota and represented by L , which after exhaustion, switches to single-copy replication, e.g., Spray and Focus [43] (SnF). In this case, the source node may either utilize the quota alone (i.e., source spraying [44,45]) or may distribute it to relay nodes that also do the same until their quota is exhausted. In the later approach, quota allocation may be binary or based on other allocation rules.
In binary quota allocation [44,45], the relay node is allocated 1/2 of the remaining message quota—practically, the relay node gets L / 2 , and the custodian is left with L / 2 . The message quota can be allocated based on other rules besides binary allocation. The quasi spray and search algorithm, SAS [46], allocates quota according to a function of the forwarding abilities of the encountered nodes. In ISW [47], the allocation ratio is decoupled from a neighbourhood index that indicates encounter duration with the destination. Other strategies allocate quota according to the ratio of utilities such as: degree centrality [48]; average waiting time between successive encounters [49]; probability of encountering the destination in the near future [50]; frequency of encounters [51]; or one derived from two or more features—for instance, frequency of encounters and encounters with the destination [52].
B. Variable-Quota Replication
There are message replication approaches that seek more flexibility by utilizing a variable quota. By forwarding a limited number of copies and monitoring certain message properties (e.g., hop count), replication can be controlled by switching to single-copy replication when a threshold is reached, e.g., EpiPRo [53]. Due to varying encounter opportunities among nodes and different messages being replicated at different rates, the resulting number of copies is not fixed but dynamically varies for each message. Gossiping [54], which is also referred to as Randomized Flooding, randomly selects the value of a parameter, p , upon encounter. The parameter allows trade-offs between transmission overhead and throughput as it is varied in the range (0, 1). It dynamically switches between Epidemic and Direct Transmission such that, when it is 1, the message is replicated, and when it is 0, the message is retained unless the encountered node is the destination. Zhang et al. [54] also propose another means of controlling replication through a time threshold. With every message, a custodian associates a timer that, after exhaustion, prompts the message to be removed from the buffer. The only exception refers to messages generated by the custodian itself, which allows a certain level of delivery guarantee.
There are strategies that rather attempt to alleviate the overhead caused by excessive replication. VACCINE [54] utilizes anti-packets to inform nodes to drop delivered messages. Shin et al.’s [55] message dropping policies are based on the total number of nodes in the network and the total number of replicas of a given message existing in the network. The former is assumed to be known, while the latter is estimated by exchanging and updating knowledge upon encounters. Batabyal and Bhaumik [56] rely on the Uniform Minimum Variance Estimator (UMVUE) for this estimate, which is based on determining the node population from a set of observed IDs of previously encountered nodes.
Other strategies change replication approaches according to message properties, node connectivity, or perceived network conditions. Iqbal and Chowdhury’s [57] adaptive spraying scheme replicates messages until a certain “switch value” is reached (which is based on the number of remaining quota, L , and a chosen “reference value”), then shifts to single-copy replication. Miao et al. [58] dynamically control the number of message copies based on the TTL. You et al.’s [59] dynamic replication is based on the average hop count of all routes existing between the message custodian and the destination. The average hop count is determined by maintaining and updating information in message headers, and a message is replicated only when the relay node has a low probability of delivering the message within the average hop count.
Due to intermittent connectivity, Huang et al. [51] consider the connection strength between the source and destination, and determine the number of message copies as a fraction of a pre-determined value, L M . Thus, less connection strength implies more copies (i.e., a larger fraction of L M ), and vice versa. Lo et al.’s [49] approach is based on the level of congestion, which is inferred from the state of buffers of encountered nodes. n-Epidemic Routing [60] replicates a message only when at least n nodes are in contact.

2.4. Current State of Message Replication in OppNets

Although message replication in OppNets has been widely investigated, the existing replication techniques are not designed with the unique characteristics of Smart City scenarios in mind. Hence, in this section, we investigate the impact of relevant OppNet characteristics on existing message replication techniques. OppNet movement scenarios and simulation set-up are presented in Section 2.4.1, with which experiments are conducted to analyse the performance of existing message replication techniques in Section 2.4.2.

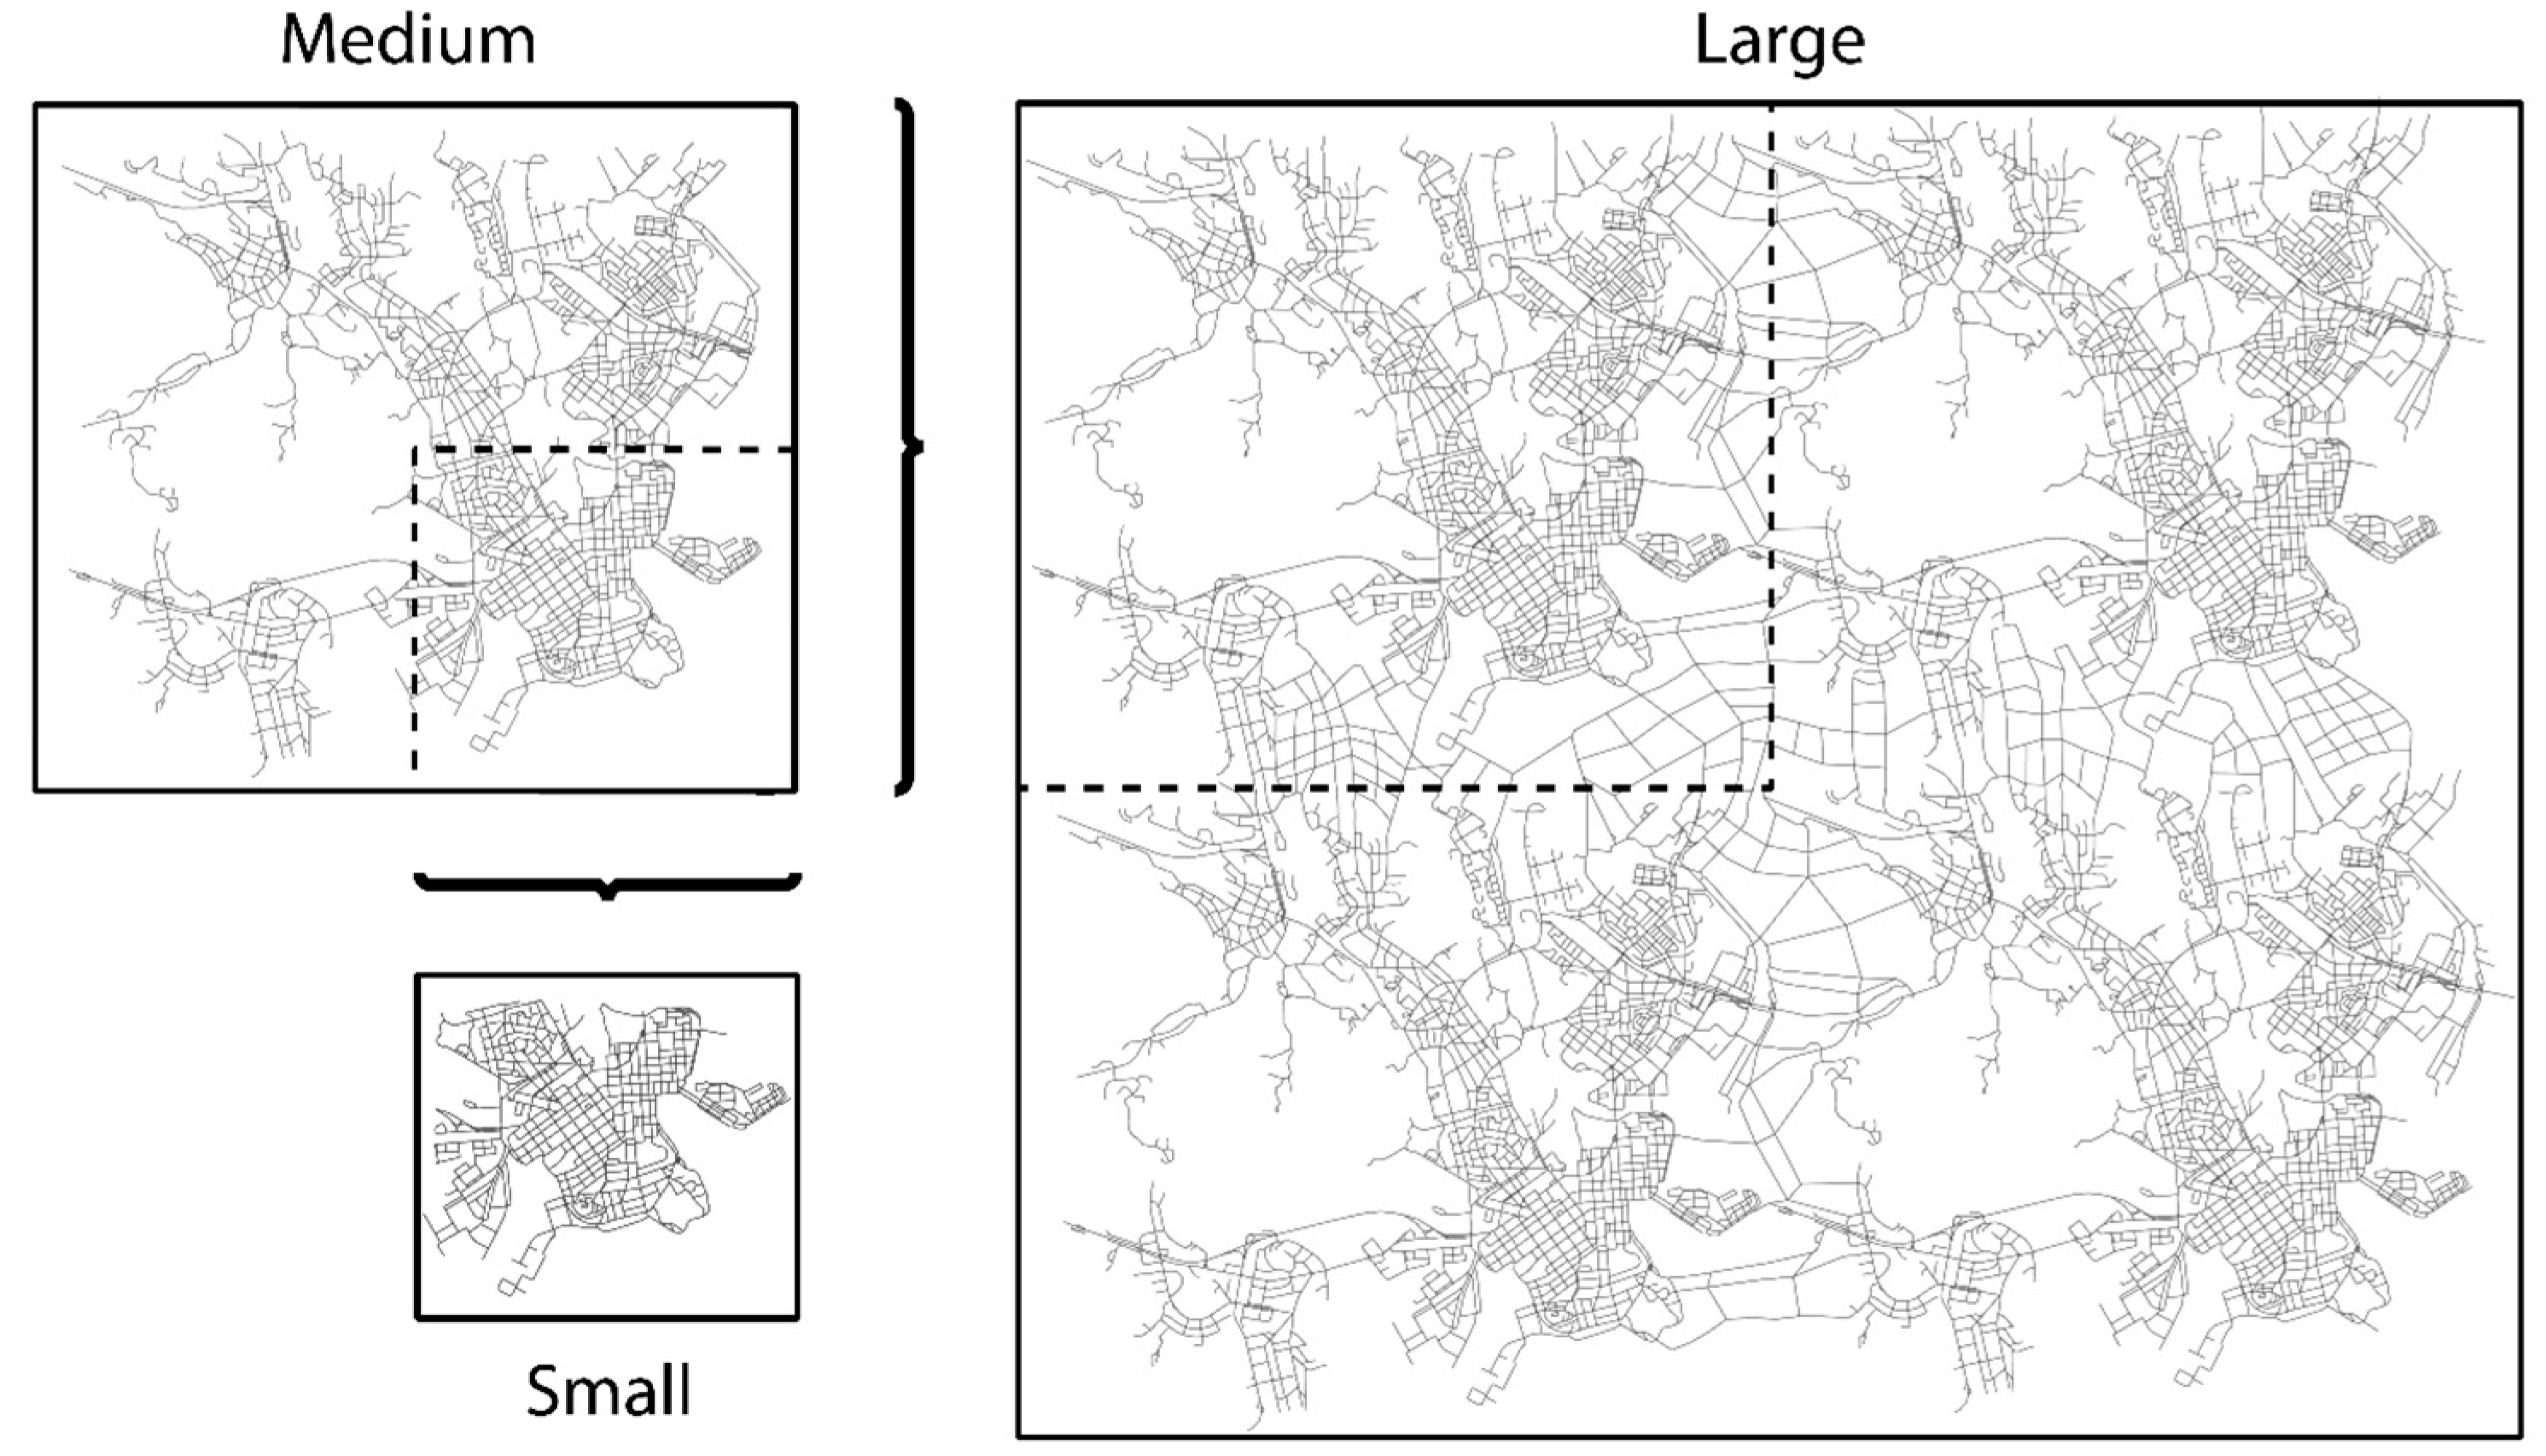
2.4.1. OppNet Movement Scenarios and Simulation Set-Up

The Helsinki simulation area in the Opportunistic Network Environment (ONE) simulator [61], which consists of four main districts, is modified to obtain three movement scenarios, as shown in Figure 3. For comparative analysis the scenarios, namely small, medium, and large, correspond to their relative size. To obtain the different network sizes, the Helsinki simulation area is used to represent the medium scenario, the small scenario is represented by one of the four main districts in the medium scenario and the large scenario is artificially generated from the combination of 4 copies of the medium scenario. The number of nodes for each scenario is varied proportionally leaving the essential encounter characteristics unchanged.
It is assumed that communications are between mobile users in a city using smartphones or similar handheld devices equipped with GPS and moving according to the Working Day Movement (WDM) model [62]. Since WDM models daily movement routines in working days, a total simulation duration of 5 days is chosen, i.e., 1 day for warm up (to ensure complete encounter history generation), 3 days for message generation and routing, and 1 day for cool down. A message is generated every 10 to 15 min from a randomly chosen node (the source) to another randomly chosen node (the destination).
Energy consumption for Bluetooth is according to the configuration settings in the module proposed by Silva et al. [63]. Since we are interested in only energy expenditure of different replication techniques, only energy consumed from receiving and sending messages is considered and other means through which nodes consume energy is ignored. On that basis, scan energy (i.e., energy consumed from device discovery), scan response energy (i.e., energy consumed from device discovery response), and base energy (i.e., energy consumed in idle state) is set to 0. The parameters used for the simulation set-up are shown in Table 1. The following metrics are used to evaluate the performance of the network: (i) throughput, the percentage of generated messages that were delivered; (ii) message transmission overhead, the average number of transmissions required to deliver a message copy; and (iii) average energy consumption, the average amount of initial energy expended at the end of the simulation. 10 trials with different random seeds are simulated for each result in order to present the average and the 95% confidence interval.

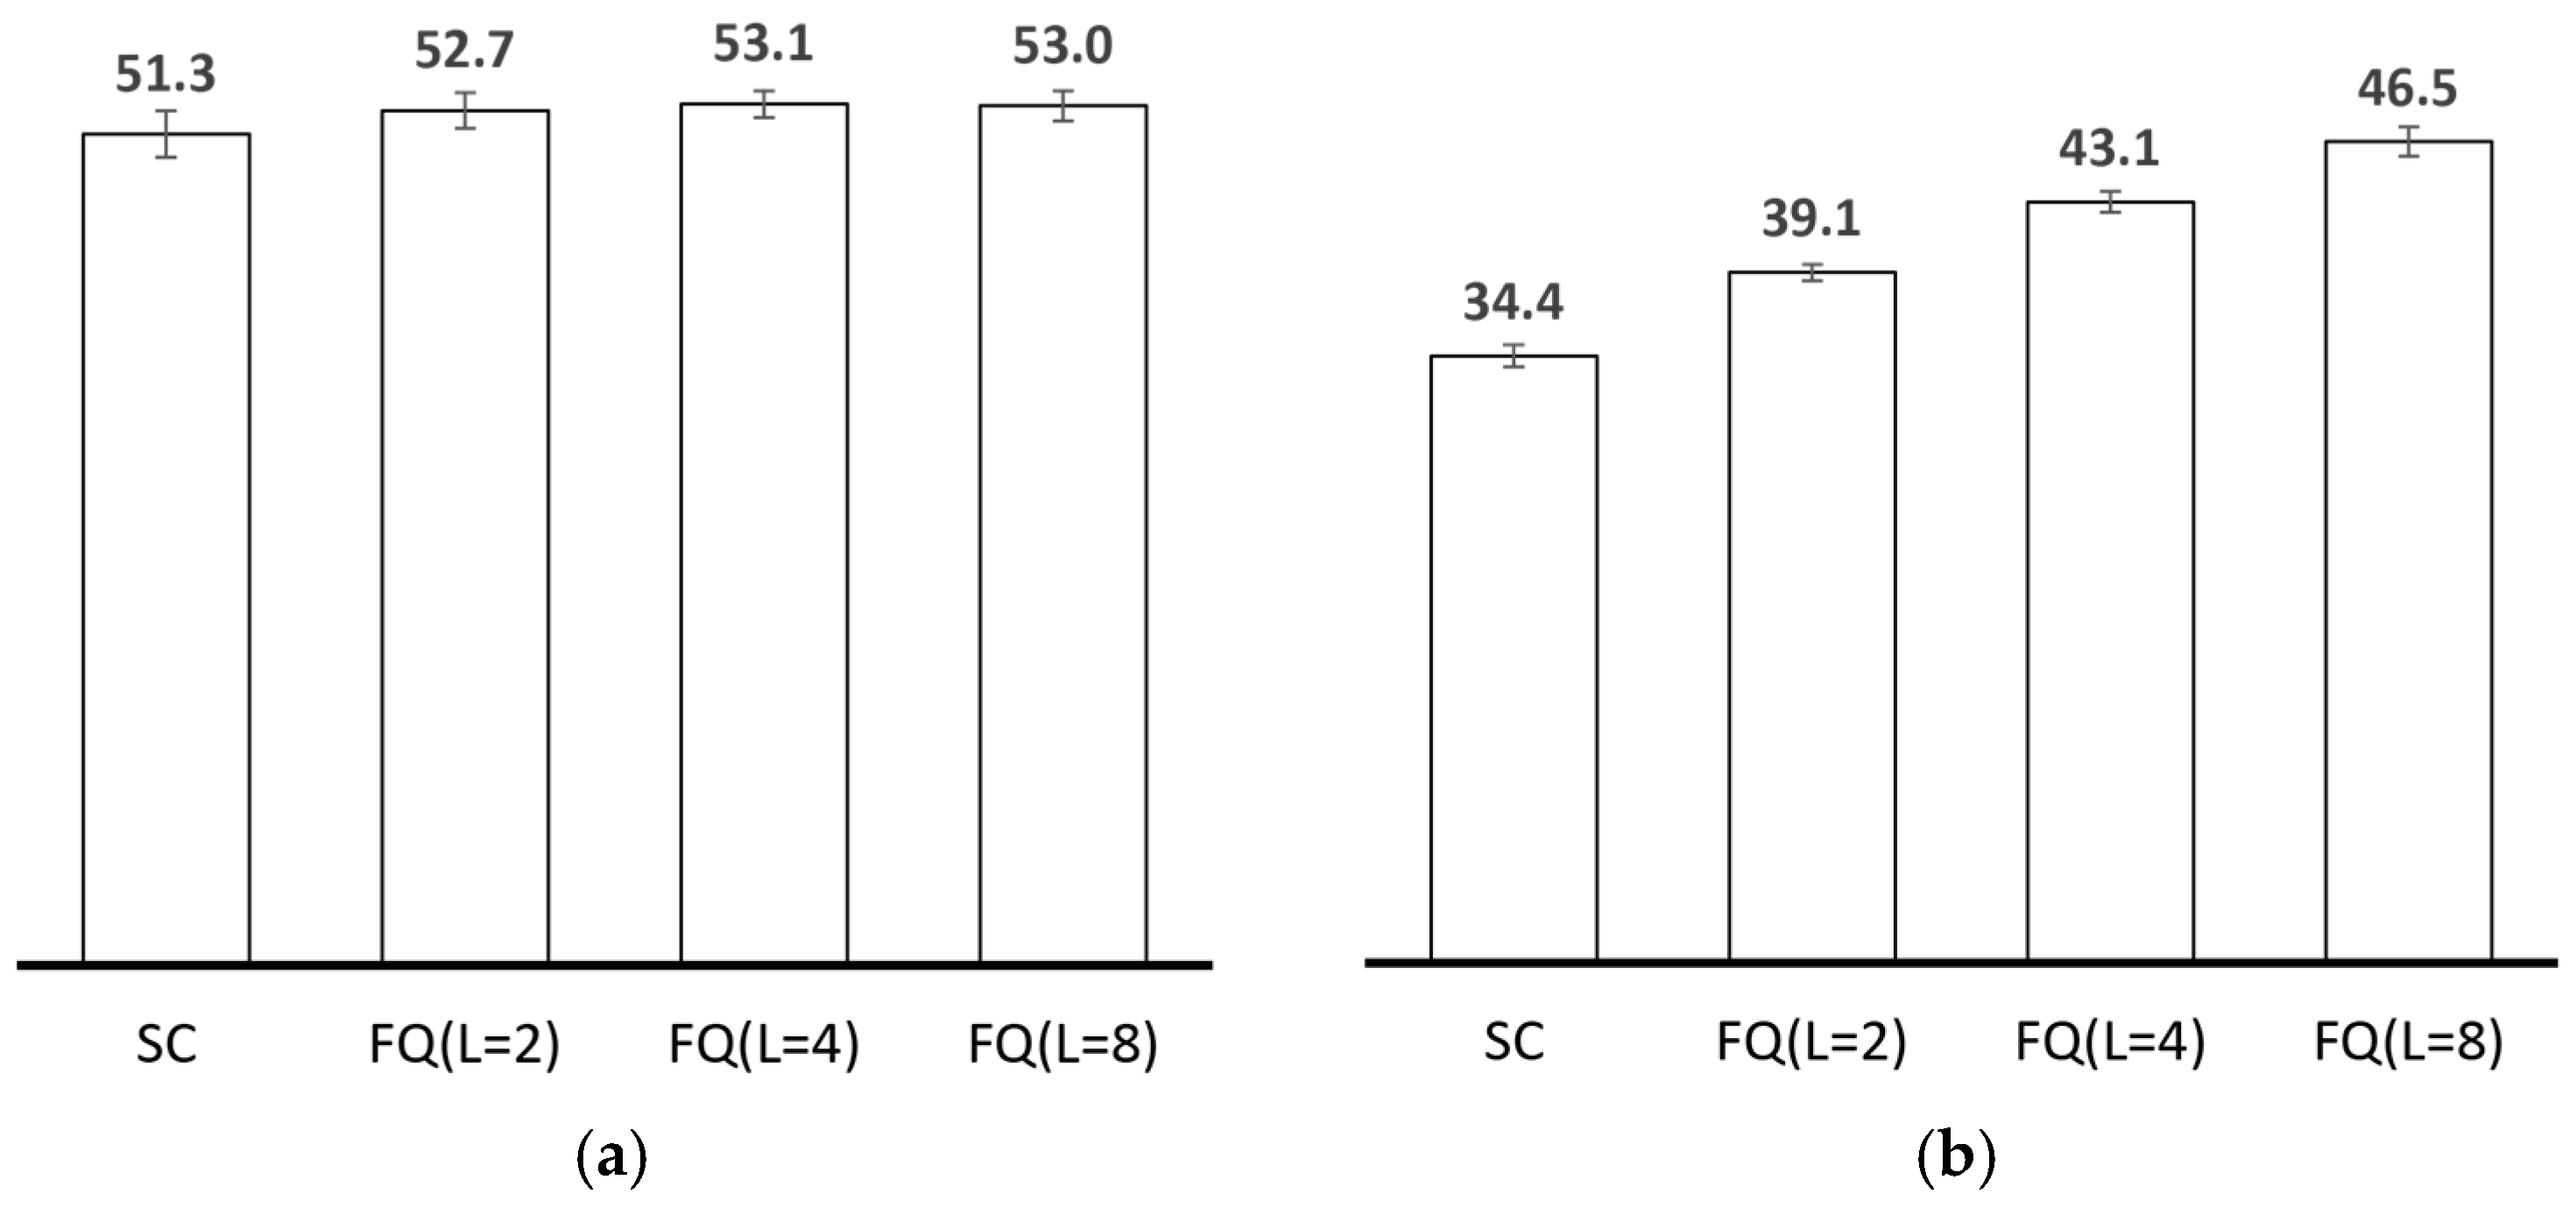
2.4.2. Performance Analysis of Existing Replication Techniques

Ideally, with respect to sensed data collection with OppNets, message loss would be minimal if only one copy of each message existed in the network at a time. Due to fewer messages in node buffers, more successful message transmissions would be realized per encounter. Results in Figure 4a show that the throughput achieved when PRoPHET utilizes single-copy replication is comparable with multiple-copy replication. In fact, generating excess copies in an ideal state is likely to result in lower throughput due to buffer overflows. However, real-world implementation scenarios are far from ideal. The wireless communication interfaces on user devices may not always be turned on. Hence, a message may never be delivered if only one copy exists in the network, as its custodian may miss important encounter opportunities. Also, the wireless communication interface on handheld user devices could be shared among different applications, including other OppNet applications such as content dissemination [64] and location-targeted services [65]. With single-copy replication, the only existing message copy would thereby compete with these other applications and messages whenever a data transmission opportunity arises. Hence, there is a higher chance of missing a suitable relay node that may never be encountered during the lifetime of the message. Accounting for these factors in the simulation results in significantly less delivery guarantees, as shown in Figure 4b.
Our results in Figure 4b support the notion that only one copy of a message may not be sufficient to guarantee its delivery [66]. The chances that the message may be lost due to buffer overflows or TTL exhaustion is heightened under higher network activity coupled with network characteristics such as high node population and degrees of spatial locality. In this regard, multiple-copy replication is a more preferable strategy. This section provides qualitative and quantitative analysis of the multiple-copy replication techniques overviewed in Section 2.3 under the network characteristics presented in Section 2.2. We start by addressing high node population and its impact on message transmission overhead, metadata overhead as well as the impact when coupled with limited bandwidth and high network dynamicity. Next, we investigate the impact of spatial locality on encounter opportunities and on the overhead-throughput trade-off for different sets of messages.
A. Impact of High Node Population
Increased transmission overhead
Considering the versatile nature of portable handheld devices, routing should take minimal toll on available energy. The versatility of portable handheld user devices requires them to perform a lot of other operations besides routing. Considering this, only a limited amount of node resources may be allocated to routing. The overhead incurred by some of the existing message replication techniques tends to rise at noticeable rates with node population. The effects of this may not be significant in networks that consist of a few hundred users and participating endpoints. However, in sensed data collection scenarios, where network coverage increases and extends to thousands of nodes, the number and frequency of encounters are likely to rise. In turn, the number of message transmissions may contribute to significant overhead and energy consumption.
Under high node population, lack of a replication technique may generate excess message copies, hence, high message transmission overhead. Forwarding messages without considering the forwarding ability of nodes (e.g., Epidemic) rapidly exhausts node and network resources. The rate of resource consumption can be reduced by considering the forwarding ability of nodes. In that case, messages are forwarded only when the encountered node is a more suitable relay (i.e., presents a higher forwarding utility, e.g., PRoPHET). However, messages continue to be replicated in this manner unless their TTL is exhausted or dropped due to buffer overflow. Without mechanisms that notify nodes about the delivery status of messages they carry (which are usually unsuitable in OppNets due to increased resource consumption [67] and delays [68]), the resulting amount of message copies mostly depends on the forwarding utility of the source node and the total node population. The number of more suitable relay nodes is increased when messages are generated by nodes with relatively low forwarding utilities or when there is a large number of nodes in the network. This results in increased replication such as in Figure 5 (transmission overhead increases steadily with node population), most of which may be redundant, and eventually lead to higher energy consumption.
Some variable replication techniques also result in excessive transmission overhead under high node population. EpiPRo may generate excess copies of a message before its hop count property reaches the threshold. In Zhang et al.’s [54] Gossiping and timer threshold proposals for instance, the optimal p and timer threshold values may cause excessive transmission overhead in higher node population. The proposal by Iqbal and Chowdhury [57] also requires an optimal reference value in order to terminate message replication at the right time, which may still result in excess message copies in highly populated areas. n-Epidemic replicates messages according to n , i.e., the number of nodes in contact. The choice of this parameter is crucial to the performance of the network since extreme values reduce network performance. Higher values of n reduce the probability of transmission while lower values tend towards Epidemic. Hence, there is the risk of excessive replication in high node population, as a large number of nodes may be in contact most of the time–in shopping malls, for instance.
Increased metadata overhead
Most of the variable-quota replication techniques neglect control overhead that results from metadata dissemination [69], as they frequently transmit metadata in order to update perceived information that may become stale too quickly. Metadata transmission is thus traded for the overhead incurred in data transmissions, which may still consume the limited resources on nodes. Metadata transmissions may also interfere with the process of data transmission, due to limited bandwidth, highly dynamic user movement and intermittent connectivity. The metadata overhead incurred by VACCINE’s anti-packets increases with node population. The delay in propagating them increases as well, since it depends on the rate of node encounters. Anti-packets may therefore fail to fulfil their purpose by the time they are received, as replicas of delivered messages could have been dropped due to TTL exhaustion or buffer overflow. This may result in unnecessary transmission overhead. Further influencing the amount of transmission overhead incurred in the process is the amount of TTL allocated to anti-packets.
Metadata dissemination may also increase the number of failed message transmissions. Besides the issue of limited bandwidth, encounter duration is shared between metadata and data transmission [69]. The metadata overhead incurred by some replication techniques increases in higher node population. For example, the performance of Shin et al.’s [55] replication technique depends on a mechanism for deleting delivered messages. This requires nodes to exchange metadata in the form of lists containing IDs of delivered messages and expiration times. Another example is Lo et al.’s [49] proposal, which requires information about each encountered node in order to maintain and update a neighbour table. The neighbour table contains node ID, buffer occupancy, a list of messages in the buffer, a list of neighbouring nodes, and a list of time stamps indicating encounter start and end times. Miao et al. [58] require encountered nodes to update their community table, community graph and gateway graph. The information exchanged includes node ID with the corresponding community ID and node ID of gateway nodes for communities. In high node population, frequently transmitting such metadata (alongside existing ones such as summary vectors) may require more time [70] to successfully exchange messages. This contributes to increased contention due to the short-lived nature of node encounters in OppNets, and may eventually result to throughput degradation [71]. Figure 6 shows that the implementation of summary vectors alone reduces PRoPHET’s throughput by about 14%.
Poor adaptability to increased network dynamicity
Increased network dynamicity (i.e., more rapid and significant changes in network conditions such as topology, node density and encounter rates) in higher node population may also prevent some replication techniques from performing as expected, especially in the absence of global knowledge. Shin et al. [55] focus on scenarios in which the number of nodes in the network is known (e.g., battlefield scenarios). However, this is not applicable to OppNets for sensed data collection in which the number of nodes increases without prior notification. You et al.’s [59] dynamic replication is based on the average hop count of existing routes to the destination. Due to the numerous portable handheld devices and highly dynamic network topology, it is difficult to determine the total number of routes between a node pair in real-world implementation. In the case of n-Epidemic, the choice of n may need to adapt to different network conditions in order to be suitable for implementation in realistic scenarios. For instance, high encounter frequencies during rush hours may cause messages generated within the period to be over-replicated, while messages generated before or afterwards may be under-replicated, cf. Figure 7 (two peaks occur every 24 h which correspond to periods of increased encounter frequencies such as during rush hours). Similarly, Gossiping and the time threshold approach require more adaptive parameters, i.e., p and the time threshold, respectively. Iqbal and Chowdhury [57] and Miao et al. [58] also require an adaptive reference value and TTL threshold, respectively. Due to increased network dynamicity in higher node population, values that may be optimal under one network condition may not be suitable under another. Hence, distributed mechanisms that can enable them to adapt to different network conditions are required.
B. Impact of High Degrees of Spatial Locality
Uneven distribution of encounter opportunities
As observed in Section 2.2, spatial locality plays an important role in the encounter opportunities experienced between different sets of nodes. Users often visit only few places and mostly move within a local region, thereby reducing the likelihood of seeing people on a regular basis the farther away their homes are located. In terms of OppNets (depending on the geographic location of source and destination nodes), the delivery of some messages through encounter-based utilities may be less likely than others. Hence, in the design of OppNet routing solutions for collecting sensed data, entirely neglecting spatial locality inherent to user movement may lead to poor throughput.
From Section 2.3, we observe that existing fixed-quota replication techniques overlook the impact of spatial locality on network performance. First, in the spray phase, some techniques tend to allocate the remaining quota according to a ratio determined from encounter-based or social-based node relationships. For example: SAS, a function of the forwarding utilities of the encountered nodes; Huang et al. [51], connection strength with the destination; ISW, encounter duration with the destination; degree centrality [48]; average waiting time between successive encounters [49]; probability of encountering the destination in the near future [50]; frequency of encounters [51]; or one derived from two or more encounter-based features—frequency of encounters and encounters with the destination [52], for instance. Second, most of them utilize only encounter-based properties in the second phase of replication after the spraying quota is exhausted. For example, SnF utilizes single-copy replication, entirely relying on the encounter-based forwarding utility for the number of transmissions.
Unfortunately, since the chances of determining more suitable relay nodes through encounter-based or social-based forwarding utilities alone reduce under higher degrees of spatial locality, allocating message quota accordingly may not be effective. Hence, messages may make little progress towards the destination despite the quota allocated to relay nodes during the spray phase. In the second phase, less encounter opportunities between nodes from different local regions reduces the chances of finding relay nodes with better encounter-based forwarding utilities. While a transitive property (i.e., a property that infers the forwarding utility of a node for a destination it has never encountered from neighbouring nodes that encounter the destination, e.g., PRoPHET and SnF) is able to perceive encounter-based knowledge over multiple hops, the resulting forwarding utilities are fine-grained. For messages traversing multiple regions, the quality of more suitable relay nodes becomes less, i.e., the difference between the sender’s and receiver’s forwarding utility becomes less (cf. Figure 8). Consequently, such messages are subjected to more number of transmissions.
Some variable-quota replication techniques may also suffer from the obliviousness of spatial locality. For instance, You et al.’s [59] proposal generates more replicas when relay nodes have a low chance of delivering the message. Without considering the properties of spatial locality, this replication may result to excessive transmission overhead in high degrees of spatial locality, since most neighbouring nodes may have low chances of delivering messages to distant destinations through encounter-based or social-based forwarding utilities alone. Similarly, the proposal by Huang et al. [51] may result in excessive replication, since more message copies are generated when the connection strength between the source and the destination is low.
Knowledge about N , the total number of nodes in the network, is required to compute: UMVUE’s total number of message replicas existing in the network; and L , the replication quota for fixed-quota replication techniques. UMVUE estimates N by counting unique IDs of encountered nodes. Unfortunately, this may be too costly for resource constrained nodes as it requires large storage and frequent lookup operations. Also, it may take long for this method to converge, especially in networks comprising of disjointed communities. Furthermore, UMVUE relies on the assumption that nodes are assigned IDs of the same pattern. In Smart City scenarios however, node IDs may not be of the same pattern, considering that they may be from different communities, regions or sub-networks. Spyropoulos et al. [72] show that in an independent and identically distributed (IID) uniform mobility, the value of L for a required expected delay can be determined as a function of only N . The authors propose a method of determining N through inter-contact time statistics, that is, if nodes are assumed to perform independent random walks. This method converges faster than ID-counting, since the only requirement, which is sufficient inter-contact time samples, may come from nearby nodes. However, nodes do not show location preference under IID uniform mobility and these estimations have not been investigated under a more realistic mobility model such as WDM. WDM increases reality by introducing spatial locality in node movement, which allows nodes to reveal different levels of location preference.
Higher chances of message loss
With different number of message copies and varying amounts of progress made in the network, the order in which they are transmitted and dropped needs to conform to their priority. Although many strategies for determining these orders exist, desirable results are realized only when they are in accordance with the message replication technique. Hence, some message replication techniques (e.g., Lo et al. [49] and Shin et al. [55]) are complemented with buffer management policies, which often consist of rules for queuing messages, dropping messages or both. In order to create room in node buffers, most replication techniques utilize the first-in-first-out (FIFO) dropping policy in which the message that was received first is dropped first, while others drop messages with higher hop count (e.g., Lo et al. [49]) or less remaining TTL (e.g., Shin et al. [55]). The idea is that there is a higher probability of having more copies of such messages in the network and dropping them is unlikely to impact significantly on their delivery. However, in Smart City scenarios where user movement exhibits high degrees of spatial locality, dropping such messages may have significant impact on throughput. Since fewer nodes travel across multiple local districts [62] (i.e., regions), related messages are likely to be delivered through more number of hops and may need to stay longer in node buffers (cf. Figure 9). Hence, with the existing dropping policies, messages traversing longer distances tend to be dropped before arriving their destination.
Sub-optimal message copies
The results in Figure 10 indicate that a fixed quota may cause some messages to be under-replicated (i.e., generating less copies than required) and others over-replicated (i.e., generating more copies than necessary) under high degrees of spatial locality. Depending on the location of source and destination nodes, some messages may require more quota to guarantee delivery, while others may require less [28]. For instance, less copies may be required to guarantee the delivery of messages destined to nodes that are located nearby, while messages to nodes father away may require more copies—since they are more likely to be dropped. Hence, to maximize throughput with minimal transmission overhead, different messages may require different quota. The lack of flexibility in fixed-quota replication may cause unnecessary transmission overhead or reduced throughput, and either case degrades network performance. As shown in Figure 10, messages traversing more regions have less chances of delivery with SnF. Only 26% of messages generated to destinations 3 regions away are delivered, as compared with 74% for messages whose source and destination nodes are located within the same region.
In order to achieve optimal performance, the replication quota needs to be carefully selected, and this may be challenging and almost impractical without global knowledge of network parameters. So far, there is yet to be a suitable means of varying these parameters according to the requirements of different messages under high degrees of spatial locality. With these replication techniques, the choice that better guarantees the delivery of messages traversing multiple local regions may cause other messages to be replicated in excess. The additional transmission overhead may lead to frequent buffer overflows and eventually reduce achievable throughput.

2.5. Message Replication Guidelines for Collecting Sensed Data with OppNets

Sensed data collection with OppNets is mainly targeted for Smart City scenarios, and as learned from Section 2.3, the existing message replication techniques are not designed to cope with the characteristics of these scenarios. Feasible and efficient replication techniques need to operate in accordance with network characteristics and guarantee sufficient number of message copies in the network without causing excessive message transmission overhead on the energy constrained nodes. We suggest the following guidelines regarding message replication for collecting sensed data with OppNets:
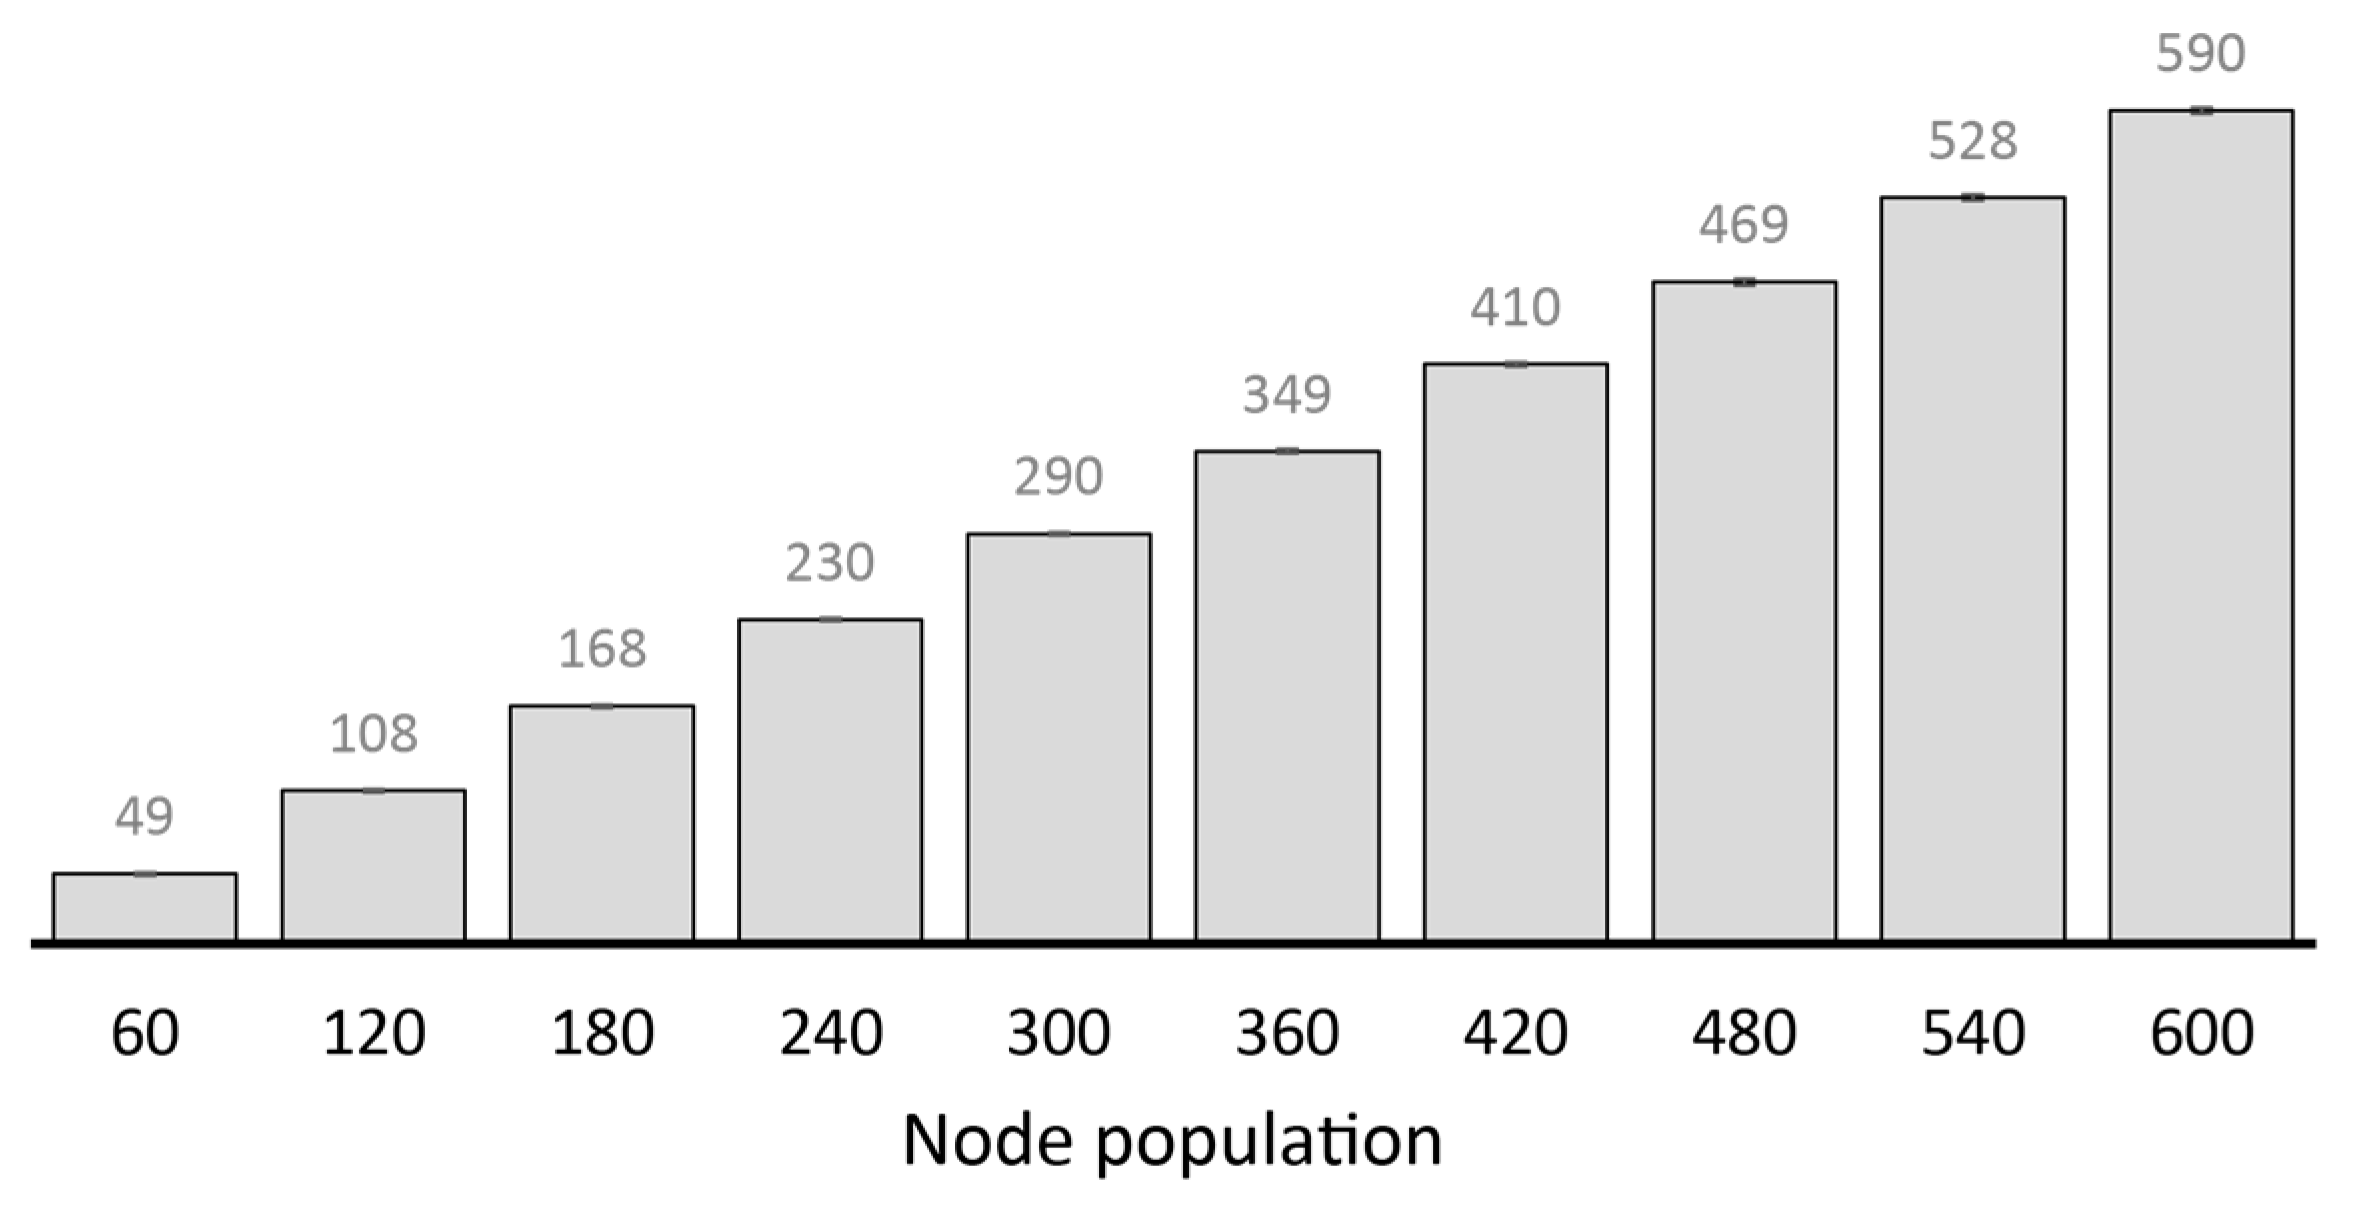
  • The number of message copies should not increase at a high rate with node population. In other words, the transmission overhead incurred in high node population should remain relatively low. Messages could be replicated according to the progress they have made towards their respective destinations. However, the progress should be identified without incurring excessive metadata overhead, preferably perceived from existing message properties or new ones that may not incur significant overhead.
  • While message replication can be controlled by selecting optimal thresholds for parameters such as the number of nodes currently in contact or message properties such as remaining TTL, adapting to different network conditions requires more than one optimal value for a threshold. The choice of these thresholds need to be made on the go, and should vary according to changing network conditions. In order to achieve this, network conditions that determine the optimal choice of these thresholds at every point in time need to be identified.
  • The goal of message replication is to maintain an acceptable level of delivery guarantee with minimal message copies. This means that messages need to be replicated sparingly and every generated copy needs to contribute towards maximizing delivery. Achieving this becomes more challenging under higher degrees of spatial locality due to insufficient encounter opportunities between nodes from different regions. Maximizing message delivery with minimal copies may require knowledge about the relationship between spatial locality and encounter opportunities between different sets of nodes.
  • Freeing node buffers of delivered messages is a direct approach towards minimizing redundant replication. However, notifying nodes through anti-packets may cause additional overhead, interfere with data transfer opportunities and may also take too long to disseminate. Optionally, message dropping policies could be designed to first drop messages that are more likely to have been delivered. It is important that such policies approach different messages according to their individual delivery criteria, as some messages may require more hops and buffer time than others to achieve the same delivery guarantees. Nodes also need to retain messages for which they have higher chances of delivery.
  • Assumptions need to be in accordance with realistic node movement, especially one that exhibits spatial and temporal properties of human mobility. The absence of central administration, lack of end-to-end connectivity and highly dynamic network topology should also be considered. It should be noted that global knowledge about the network is almost impractical to acquire locally and the performance of replication techniques should not depend on obtaining information that may become stale too quickly. Also, the performance of replication techniques should not rely on the existence of particular network infrastructure, since their presence in the application scenario may not be guaranteed. Solutions should be able to perform acceptably under varying amounts of infrastructure support or none at all. This is to maintain the ability offload existing mobile networks if need be.
In the next section, we follow these design guidelines to propose our message replication technique, namely LARep.

3. Reducing Transmission Overhead without Compromising Throughput

OppNet routing requires message replication techniques that maintain low transmission overhead under increasing node population and degrees of spatial locality without degrading throughput. In order to achieve this, the progress messages have made towards their respective destinations needs to be determined through means that incur low metadata transmission overhead (i.e., metadata transmission that does not increase drastically with node population, or require frequent updates) and are based on realistic assumptions (i.e., assumptions that do not require knowledge of global network parameters and are suitable for realistic human movement patterns). As observed in an earlier study [28], the optimal quota for message replication varies with the degree of spatial locality. Regulating the replication quota to suit different messages showed a better performance trade-off between transmission overhead and throughput. In particular, different messages were assigned different replication quota, depending on the distance—in terms of number of regions apart—between the home region of the source and destination nodes. In this section, we present LARep, and address the following points in the process:
  • An approach to determine the optimal quota for different messages on-the-go; and
  • Achieving this with minimal metadata transmission overhead and realistic assumptions.
By addressing these points, LARep is able to achieve the features shown in Table 2.

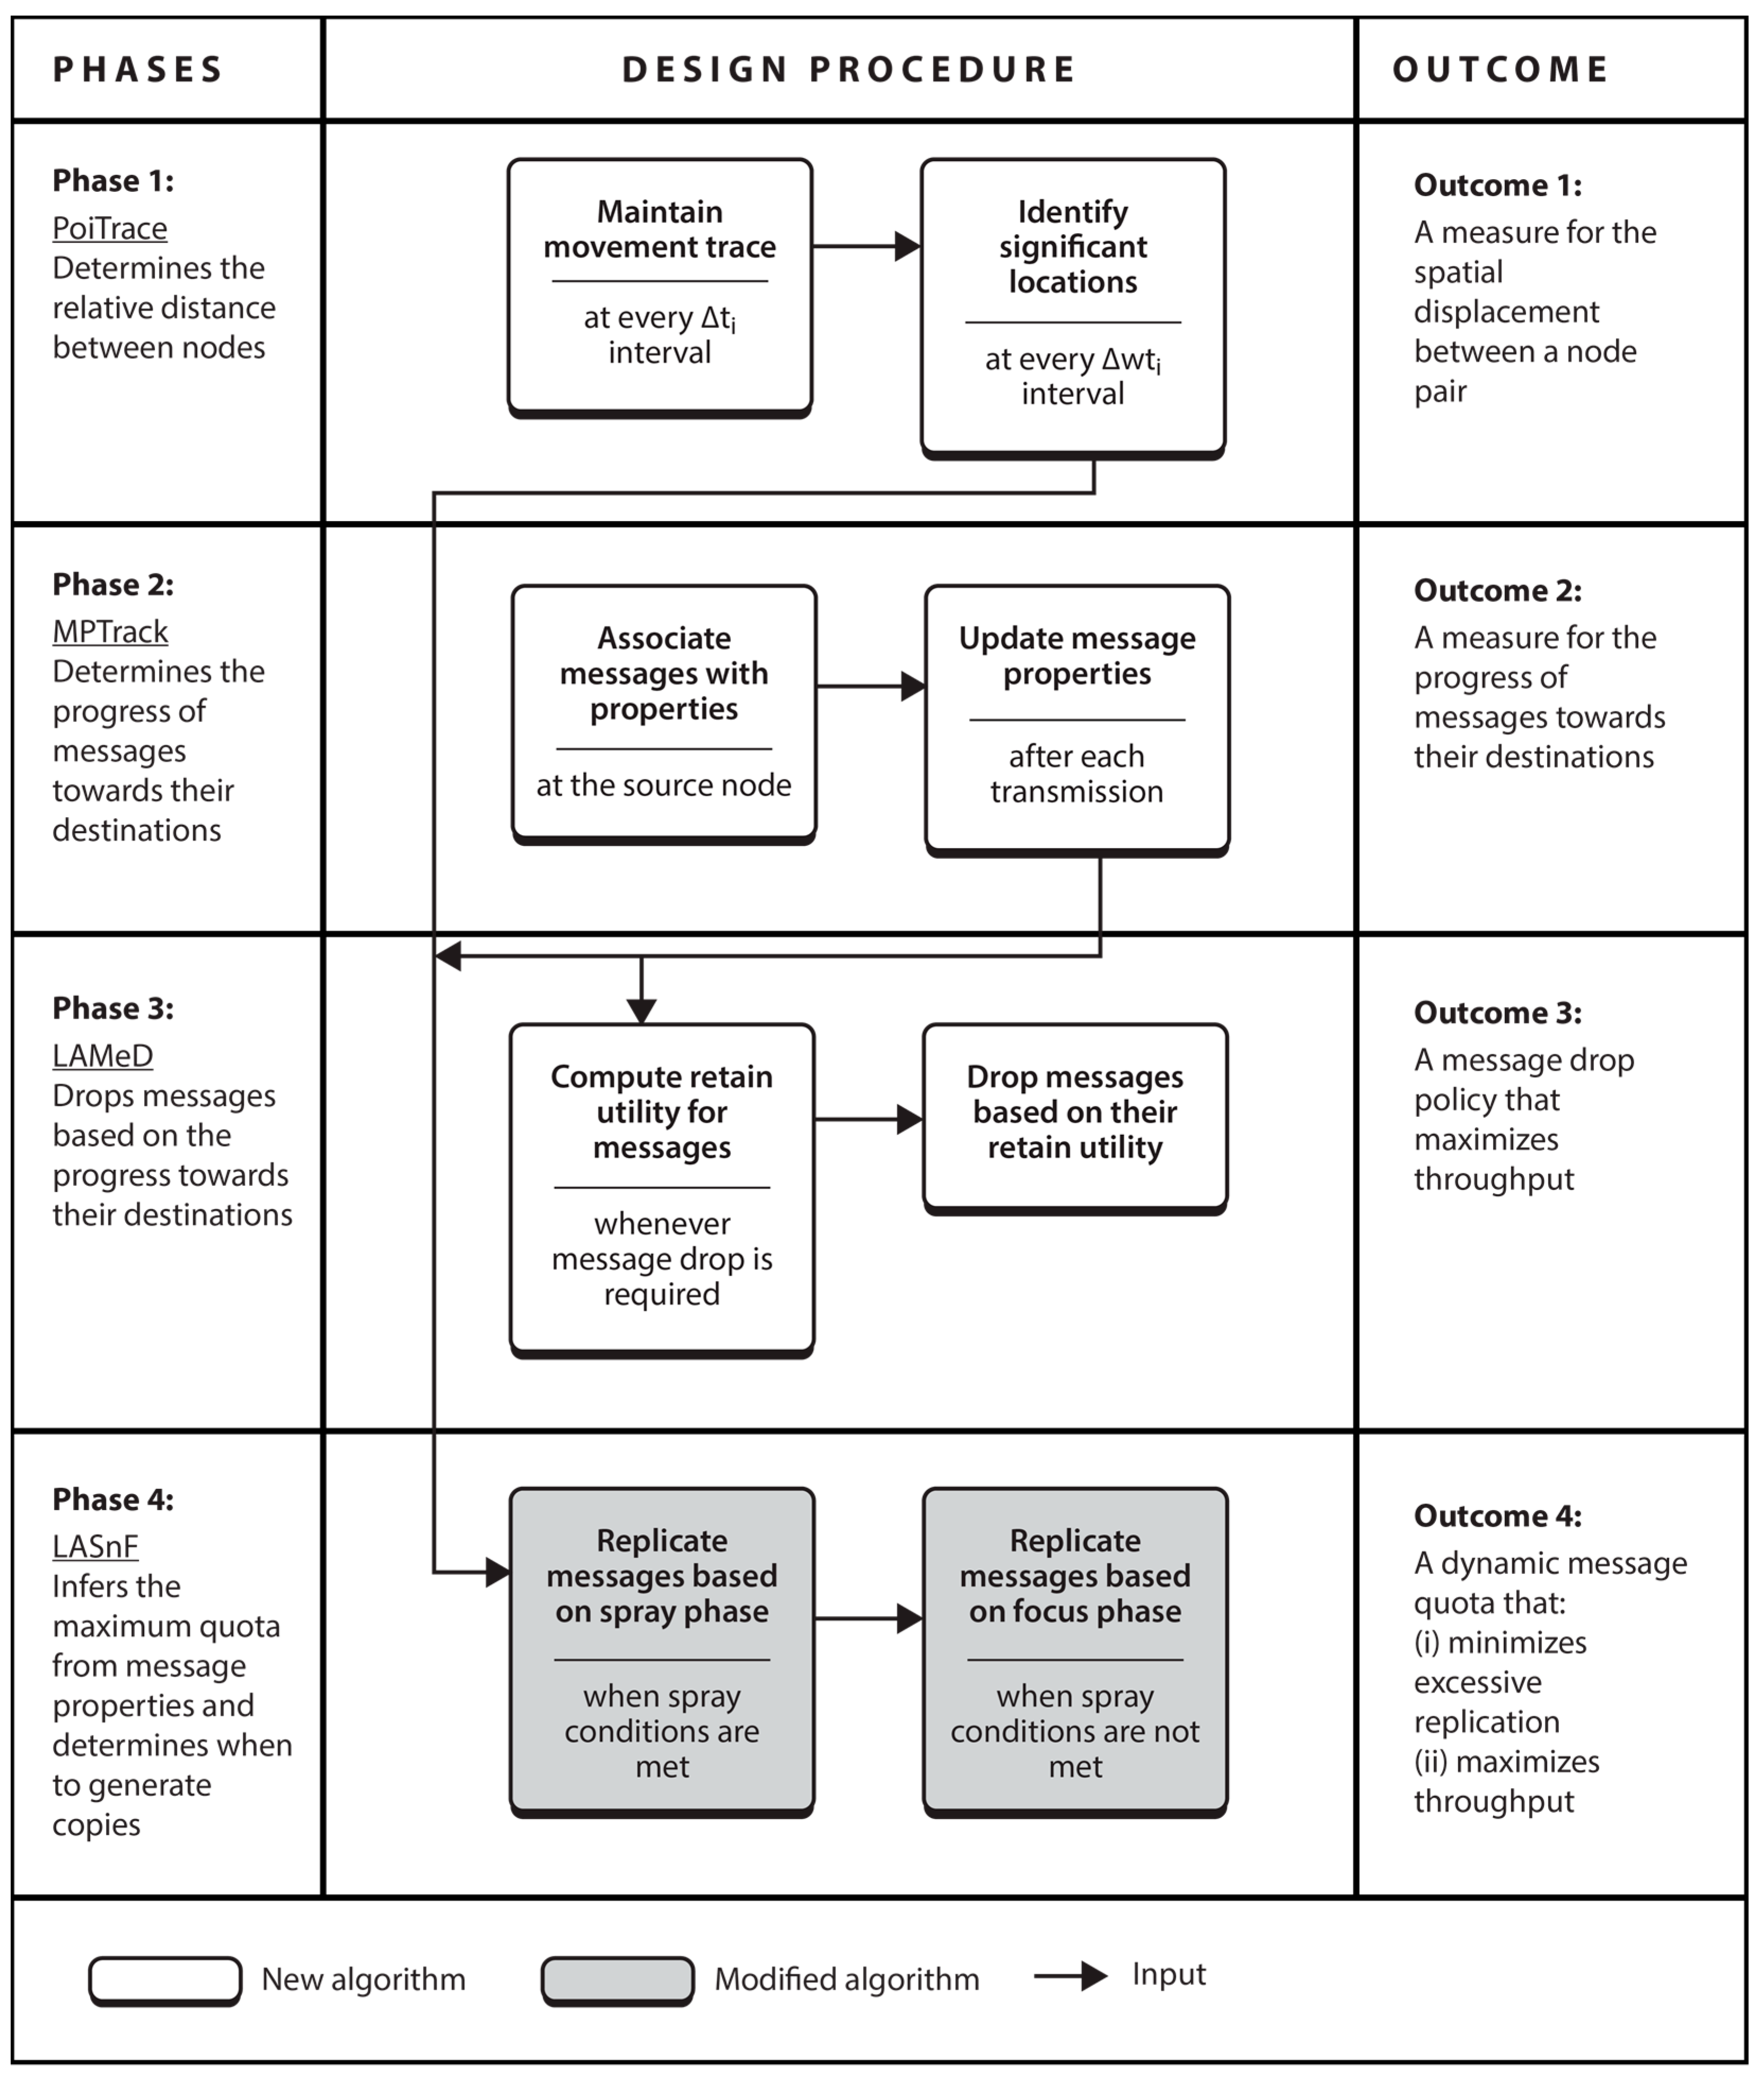
3.1. Overview of LARep

In an earlier study [28] on the impact of spatial locality on routing performance, we observed that less messages were delivered to destination nodes whose home regions were located farther away from that of the source. This also corresponds with results obtained in Section 2.4.2 (cf. Figure 10). Based on these findings, the basic idea behind LARep is to increase throughput by compensating for distance with more message copies, while keeping account of the progress messages have made towards their respective destinations in order to control excessive replication.
Since buffer overflows may cause generated message copies to be lost, LARep implements a mechanism that drops messages according to the progress they have made towards their destination. LARep’s message dropping policy gives more priority to messages that have made less progress towards their destination nodes as well as those that the carrier node can make more contributions towards delivering.
In order to curb the effects of the “slow start” phase (which happens especially in higher degrees of spatial locality when the source node is unable to encounter a sufficient number of relay nodes that have higher forwarding utilities), LARep starts by spraying message copies. However, instead of utilizing a fixed quota during the spray phase, LARep implements a variable quota that adapts to current network conditions, such as the progress that the message has made towards the destination node and the distance between the source and destination nodes.
In order to maximize throughput, LARep refrains from assuming strict rules for deleting messages that have been forwarded after the spray phase. Rather, messages are removed from the buffer only when there is need to create space for incoming or newly generated messages and the proposed message dropping policy is tasked with the selection of messages to be dropped. Therefore, after the spray phase, messages continue to be replicated to relay nodes presenting higher forwarding utilities, but only when the copies in the network are deemed insufficient.
Hence, the task of minimizing transmission overhead without compromising throughput can be divided into four subtasks:
  • Determining a measure for the relative distance between the source and destination nodes;
  • Locally determining how much progress messages have made towards their destination nodes without frequent metadata transmissions;
  • Dropping messages according to the progress they have made towards their destination nodes; and
  • Varying message replication quota according to the distance between the source and destination nodes, and generating copies based on the progress messages have made towards their destination nodes.
This section overviews LARep by presenting the tasks involved in realizing the four subtasks. As shown in Figure 11, the tasks are addressed in four phases.
Phase 1. The first phase is concerned with determining the most significant locations visited by nodes. The current location is collected via GPS at fixed intervals and stored in device memory. With this information, the areas a node is mostly found in are interpreted as its significant locations. The major challenge in this phase is how to maintain GPS readings from which the most frequently visited locations can be determined, knowing that the same exact pair of coordinates may never be recorded twice. To address this, we introduce the PoiTrace mechanism, which converts incoming GPS readings into a more stable form and records them in their respective positions in a location table. With this, the locations most frequently visited by a node can be inferred from the set of most recurring pair of coordinates.
Phase 2. The second phase focuses on gaining knowledge about the progress messages have made towards their destinations, in order to facilitate replication decisions. The source node embeds in message headers, the relative distance between itself and the destination node, and also associates two properties with each message. Similar to message properties such as hop count, the two new properties are updated whenever a message is transmitted. The main challenge in this phase is how to infer from the available information, how much a message has advanced towards the destination node. To address this, we propose the Message Progress Tracking (MPTrack) mechanism, which with the information in message headers alone, computes a measure from which the progress messages have made towards their respective destination nodes can be inferred.
Phase 3. Messages are dropped in order to create space for incoming or newly generated messages. A major issue in high degrees of spatial locality is that messages travelling longer distances require more buffer time to reach their destinations. Unfortunately, the likelihood of losing them increases the longer they remain buffered. In the third phase, we propose the Locality Aware Message Dropping (LAMeD) mechanism, which provides a policy for dropping messages by considering the progress made towards their destination nodes. A node selects a message to drop by comparing the forwarding utility for each message, the spatial displacement between the source and destination nodes and the progress made towards the destination node. As a result, throughput is improved.
Phase 4. The fourth phase is concerned with determining the number of copies to generate for each message and when to generate a copy. The optimal replication quota of a message at a given instance depends on current encounter properties of nodes, which may vary due to various physical parameters affecting node movement and encounter rates. Hence, a major challenge in this phase is how to account for instantaneous changes in replication requirements for different messages. To address this, we exploit locality awareness to propose the Locality Aware Spray and Focus (LASnF) algorithm. LASnF introduces two phases and defines new message replication conditions for each phase based on properties in the message header and the forwarding abilities of the concerned nodes. This results in a variable message quota that minimises excessive replication and maximises throughput.
The following assumptions are made in the design of LARep: (i) each node is a smart mobile device and is equipped with a Global Positioning System (GPS); (ii) nodes are collaborative and willing to participate in routing; and (iii) source nodes have the necessary information for destinations, which are node ID and location-based information in this case.

3.2. LARep Design

This section presents the design of LARep, and is organized as follows. Section 3.2.1 presents PoiTrace, a mechanism for determining the most significant locations visited by nodes from GPS information obtained on-the-go. In order to facilitate replication decisions with this information, Section 3.2.2 proposes MPTrack, a mechanism for gaining knowledge about the progress messages have made towards their destination nodes. Section 3.2.3 proposes the LAMeD mechanism, which provides a policy for dropping messages by considering the progress made towards their destinations. In Section 3.2.4, LASnF, a locality aware algorithm for determining the number of copies to generate for each message and when to generate a copy, is presented.

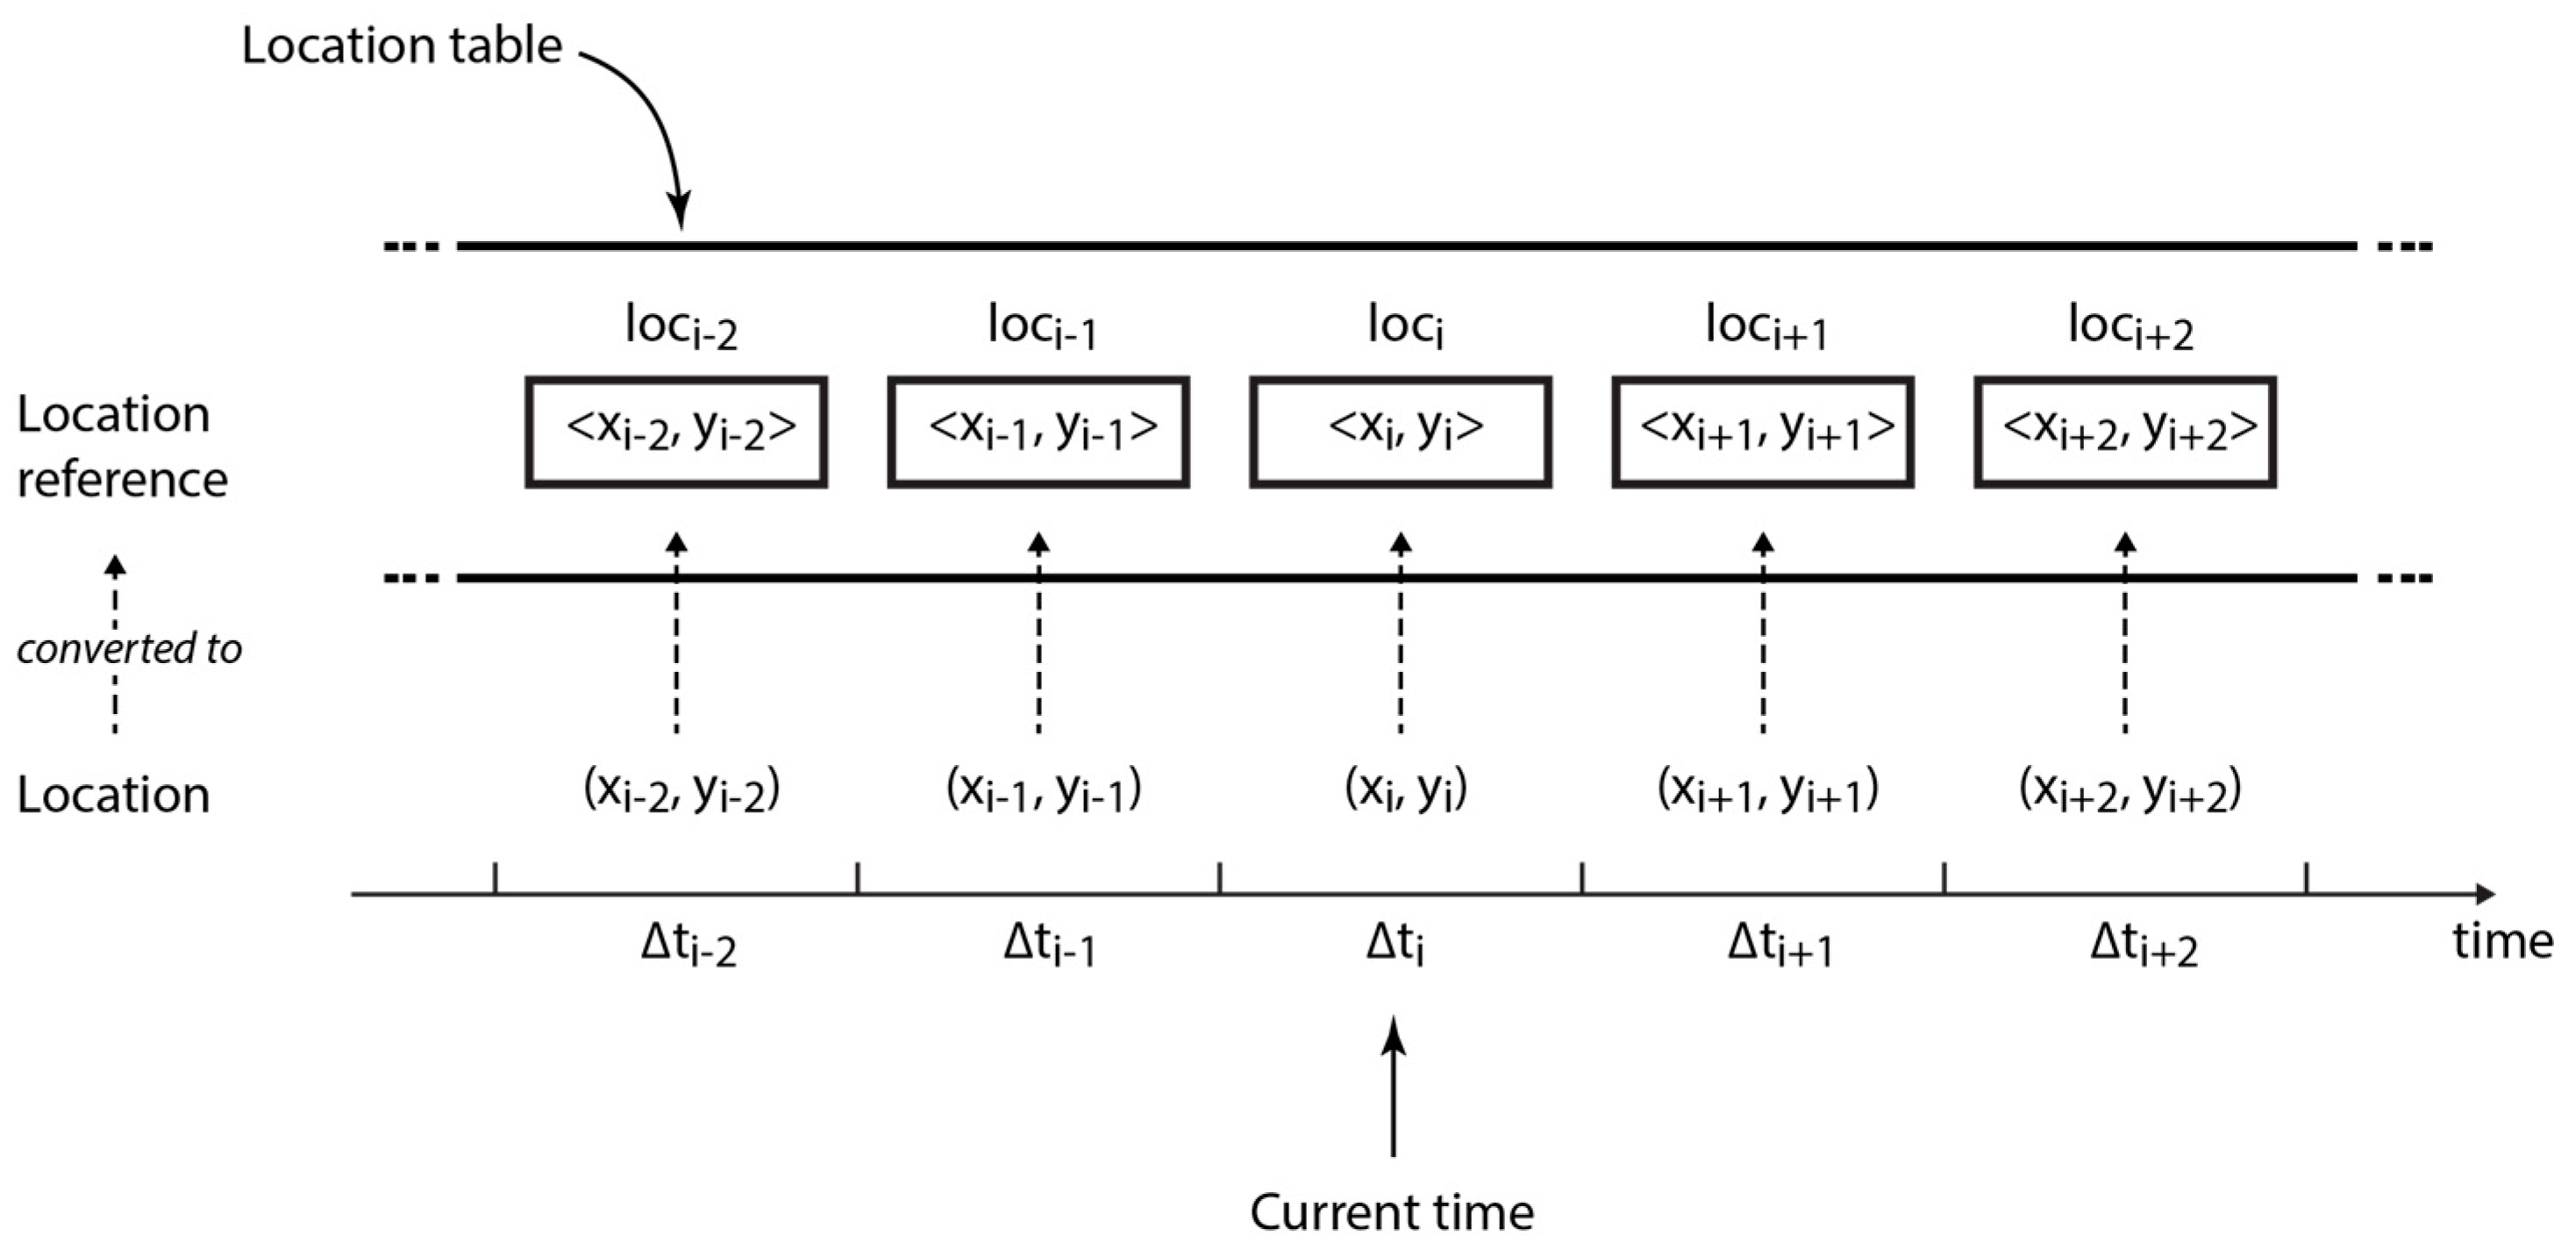
3.2.1. Phase 1: Determining the Relative Distance between Nodes

Phase 1 introduces PoiTrace [73], a mechanism that maintains region-based information from which the most significant locations visited by a node can be inferred. User movement may reveal multiple significant locations and can be exploited for routing. However, we are interested in investigating how our POI approach can reduce contact information overhead. In order to keep the idea comprehensive, the mechanism proposed here identifies only the two most significant locations, which we refer to as “home” and “work” location. Besides these locations often corresponding to home and work locations, research also shows that most users have at least two most significant locations and regularly commute between them [74].

Collecting and Recording Location Information

At every sampling interval Δ t , each node collects its current position by GPS in form of latitude and longitude and records it in the corresponding time slot in the location table (cf. Definition 1)—note that LARep is fully distributed and does not require synchronization between devices. For example, ( x i , y i ) , the GPS coordinates collected at Δ t i , the current sampling interval, are recorded as l o c i , a location reference in the current time slot.
Definition 1 (Location Table).
The location table, L T , which consists of n time slots, is a set of n elements, each known as a location reference (cf. Equation (1)). Each location reference l o c i L T is a tuple of the format l o c i = x i , y i , where i ( { i : Z | i 1 n } ) indicates the current time slot.
L T = { l o c 1 , l o c 2 , l o c 3 , , l o c n } = { x 1 , y 1 , x 2 , y 2 , x 3 , y 3 , , x n , y n }
The basic idea behind the algorithm for recording location information is as follows: location references in L T should be able to map geographical locations visited for longer periods from user movement, by representing them with circular areas. In order to achieve this, a certain extent of deviation between successive incoming GPS locations is tolerated while acquiring location references. The location reference l o c a for any two locations ( x 1 , y 1 ) and ( x 2 , y 2 ) is the same if the circular areas formed by radius r from both locations intersect. This condition is met if d 1 , 2 , the Euclidean distance between the two locations, is less than 2 r (cf. Equation (2)).
d 1 , 2 = ( x 1 x 2 ) 2 + ( y 1 y 2 ) 2
Hence, if the circular area formed by r from any incoming pair of coordinates ( x i , y i ) intersects with the circular area formed by r from a previous pair of coordinates ( x a , y a ) , then x a , y a , the corresponding location reference, is formed from the existing coordinates. Otherwise, a location reference x i , y i is formed from the incoming coordinates (cf. Equation (3) and Figure 12).
l o c i = l o c ( d a , i ) = { x a , y a ,   d a , i < 2 r x i , y i ,   d a , i 2 r
Algorithm 1 summarises how l o c i is acquired using the current location in the form of latitude x i and longitude y i , the previous location references in L T , and a threshold distance r . Consequently, the number of recurrences of a location reference l o c a in L T represents the number of periods in which the user is present in the circular area formed by r from location ( x a , y a ) .
Algorithm 1 The algorithm for recording location information
Information 08 00143 i001

Extracting Significant Locations

Significant locations are identified by more number of recurrences in L T . At every sampling interval Δ w t , a node running on LARep extracts the two most recurring location references from its location table—where w is a constant of the algorithm. These locations represent POIs, and are denoted by ( x h , y h ) and ( x w , y w ) , corresponding to the node’s home and work locations, respectively. Although incoming GPS coordinates may slightly vary each time the node is in either location, the location reference records only a single pair of approximated coordinates each sampling interval Δ t , provided the circular area formed by the incoming pair of coordinates intersects with that of a previous coordinate.
Here, to facilitate understanding, we further explain the working principle of PoiTrace with an example scenario. Consider the map of a fictional city in Figure 13 which is divided into 9 regions labelled A to I . Charlie, a user in the city lives in region C and travels to work in region G . The first three GPS readings takes place in his house at location a , b , and c . The next reading takes place on his way to work, at location d . The next two readings take place in his office, at location e and f . ( x a , y a ) , the GPS reading in location a is recorded as x a , y a in the location table. However, as shown in Table 3, the readings at location b (i.e., ( x b , y b ) ) and c (i.e., ( x c , y c ) ) are also recorded as x a , y a , instead of x b , y b and x c , y c , respectively. This is because the circle of radius r formed from these locations intersects with the circle formed from a previous location, i.e., location a . Likewise, the readings at e and f are both recorded as x e , y e . After a period of Δ 6 t 1 (here we take w as 6), the two most significant locations of this user become ( x a , y a ) and ( x e , y e ) , which we consider as the home and work location, respectively.

3.2.2. Phase 2: Determining Message Progress towards the Destination

In this section, we propose the Message Progress Tracking (MPTrack) mechanism, which determines the progress messages have made towards their respective destination nodes. At the source node, MPTrack associates to every generated message, m , two properties, namely s r c D s t D i s t m and w m . As shown in Equation (4), the s r c D s t D i s t m property of a message holds the Euclidean distance between ( x s r c , y s r c ) , the location of the source node, and ( x d s t , y d s t ) , the location of the destination node. This information remains the same throughout the lifetime of the message. The other message property, w m , is initialized to the source node’s forwarding utility for the destination node, d m , and is updated whenever the message is transmitted (i.e., received or sent). The updates are done according to Equation (5). Suppose node i sends to node j a message, m , that is destined for node d m . Node i , the sender, updates the w m property of its own copy of m with node j ’s (i.e., the receiver’s) forwarding utility for d m , i.e., U j ( d m ) . Node j , the receiver, also updates the w m property of its own copy of m with, U j ( d m ) , its own forwarding utility.
s r c D s t D i s t m = ( x s r c x d s t ) 2 + ( y s r c y d s t ) 2
w m ( n e w ) = w m ( o l d ) + U j ( d m )
The s r c D s t D i s t m property signifies the relative number of copies required to guarantee the delivery of m to the destination node. Hence, the higher the value of s r c D s t D i s t m , the more copies of m is required in the network. w m on the other hand, indicates the relative number of copies of m existing in the network. As m takes more steps towards the destination, the value of w m increases respectively, based on the forwarding utilities of the relays traversed.

3.2.3. Phase 3: Policy for Dropping Messages

Two conditions can cause messages to be removed from the buffer. The first condition is TTL exhaustion and the second one is when the free buffer space is insufficient for holding generated or received messages. In the latter case, messages are removed based on the dropping policy in use. With the conventional FIFO policy, the message that was received first is dropped first. However, as observed in Section 2.4.2, this does not favor messages travelling longer distances. Under buffer constraints or high data traffic, messages with higher s r c D s t D i s t m values tend to be dropped before they can travel close enough to the destination. Although the idea is that more copies of such messages may have been generated and forwarded to relay nodes along the way, the likelihood of encountering more suitable relay nodes may be low under high degrees of spatial locality (i.e., when the message is still in custody of a node that is located far from the destination node). Hence, depending on the s r c D s t D i s t m and the forwarding utility of the custodian, the message may have been replicated to only few relay nodes.
The message dropping policy proposed in this section, namely Locality Aware Message Dropping (LAMeD), minimizes the loss of messages with higher s r c D s t D i s t m , as well as those that have less copies in the network. The proposed policy creates room in the buffer based on a “retain utility”, such that the message with the smallest retain utility is dropped first. r e t a i n U t i l i t y i ( m ) , the retain utility of a message m , on node i that is destined for node d m is given by Equation (6), where d i s t T o D s t i ( m ) is the Euclidean distance between the current location of node i and node d m .
r e t a i n U t i l i t y i ( m ) = U i ( d m ) × d i s t T o D s t i ( m ) w m
With r e t a i n U t i l i t y i ( m ) directly proportional to U i ( d m ) in Equation (6), nodes tend to hold on to messages for which they have higher chances of delivery, while they are more likely to first drop the ones for which they can make less delivery contributions. With r e t a i n U t i l i t y i ( m ) also directly proportional to d i s t T o D s t i ( m ) in the equation, the tendency to retain messages that are spatially farther away from their destination is increased. With r e t a i n U t i l i t y i ( m ) inversely proportional to w m , the tendency to retain messages that have higher w m is decreased, as copies of such messages are likely to be more in the network or may already be in custody of relays with higher forwarding utilities. With our proposed message dropping policy, the tendency of retaining messages is in accordance with the amount of contribution that can be made towards delivering them, the distance they are travelling and the expected extent to which they have been replicated. Therefore, whenever the free buffer space is insufficient for an incoming message, m , the message with the least value of r e t a i n U t i l i t y i ( m ) is dropped, and this continues until enough room is created.
LAMeD requires messages to be associated with the w m property. Hence, it should be able to coexist with other message dropping policies in case the buffer contains different sets of messages—for instance, a set of messages for the sensed data collection application and a set of messages generated by another application (i.e., external messages as described in Section 2.4.2)—for various services provided by the OppNet. When the remaining buffer space is insufficient for an incoming message, Algorithm 2 is used to determine the set from which to drop a message. First, B E , the amount of buffer space allocated to external messages, is determined by Equation (7), where B is the size of the buffer and M is the number of different sets of messages in the buffer (assuming equal priority is given to every message set). Then external message set is selected if E , the size of the set, exceeds B E . Otherwise, the sensed data collection set is selected. Depending on the outcome of this algorithm, LAMeD is used to drop a message from the sensed data collection set while the appropriate dropping policy (e.g., FIFO) is used for external messages.
B E = ( 1 1 M ) B
Algorithm 2 The algorithm for selecting the message set from which to drop a message
Input: E , B E
Output: set from which to drop a message
1if E > B E then
2  Select the external message set;
3end
4if E > B E then
5  Select the sensed data collection message set;
6end
7return set from which to drop a message;

3.2.4. Phase 4: Message Replication Phases

In order to present the replication mechanisms of our proposed LASnF replication technique in this section, we adopt the terminologies “spray phase” and “focus phase” from SnF [43]. In the spray phase, message replication varies with current network conditions, while in the focus phase, only messages that meet a given criterion are replicated.
Spray Phase. Whenever two nodes encounter each other, each one attempts to replicate a message for which the other presents a higher forwarding utility. According to Definition 2, the message may first enter the spray phase.
Definition 2 (Replication in the spray phase).
Any message, m , that satisfies the condition ( q u o t a C o n t r o l m + w m ) < 1 (cf. Equation (8)) is replicated and forwarded to an encountered node, irrespective of the node’s forwarding utility, where h o m e W o r k D i s t is the Euclidean distance between the home and work locations of the node in custody of the message.
q u o t a C o n t r o l m = h o m e W o r k D i s t s r c D s t D i s t m
The h o m e W o r k D i s t property ensures that the value of q u o t a C o n t r o l m is higher for nodes that often travel longer distances. This allows the equation to indicate how far away the destination node is located with respect to spatial locality. By considering spatial locality in node movement, messages carried by a node that often travels longer distances exit the spray phase sooner, since there is a higher chance of encountering nodes with much better forwarding utilities. With the s r c D s t D i s t m property, the value of q u o t a C o n t r o l m decreases the farther apart the message custodian and destination node are located, while w m in Definition 2 increases with more copies of m in the network. This way, while m ’s current replication quota (i.e., the number of copies yet to be generated) increases with the distance between the custodian and destination, and reduces according to the progress the message has made in the network. This is because the property w m not only indicates the number of m ’s replicas currently available in the network, but also the cumulative forwarding utilities of the nodes that may be currently carrying the message. This allows for a more flexible quota in the spray phase that varies according to the forwarding utilities of encountered nodes.
Focus Phase. When the condition for the spray phase is not met (i.e., if q u o t a C o n t r o l m 1 ), the message enters the focus phase. Messages in the focus phase are replicated based on the criterion given in Definition 3.
Definition 3 (Replication in the focus phase).
A node i forwards to another node j one copy of a message m destined to node d m , if an only if [ U j ( d m ) > ( U i ( d m ) + q u o t a C o n t r o l m ) ] [ U j ( d m ) > m a x U i ( d m ) ] , where m a x U i ( d m ) is a property in the message header that is updated to the maximum forwarding utility among the nodes that have been forwarded a copy of m in the focus phase.
Instead of transferring m to node j when U j ( d m ) > U i ( d m ) , including q u o t a C o n t r o l m relatively relaxes the condition for messages whose source and destination nodes are farther apart. In other words, the larger the distance between the source and destination nodes of a message, the more copies are likely to be generated, and vice versa. The second condition, U j ( d m ) > m a x U i ( d m ) , ensures that the message is replicated to nodes with increasing forwarding utilities, hence, further reducing excessive replication. Note that unlike Spray and Focus where messages that have been transferred in the focus phase are deleted from the sender’s buffer, LASnF retains a copy, which may be replicated to other nodes if the proposed forwarding conditions are met. Hence, when the source and destination nodes are farther apart, more copies tend to be generated. Otherwise, a copy is generated only when a node with much higher forwarding utility is encountered. This allows for higher throughput, while controlling excessive transmission overhead.
Notice that neither phase gives a criteria for determining more suitable relays, as that is the responsibility of the forwarding utility in use. Rather, the replication phases proposed here try to adjust the number of copies forwarded per message to a more optimal value based on current network conditions. Hence, LARep, our proposed replication technique, is flexible enough to be incorporated into existing encounter-based routing protocols.

4. Evaluation

This section presents the evaluation methodology and experimental results for LARep.

4.1. Evaluation Methodology

While utilizing no replication technique and forwarding messages solely based on forwarding utilities of relay nodes may guarantee acceptable throughput, there is the risk of excessive transmission overhead and resource consumption. Although this can be controlled with fixed-quota replication, the number of copies cannot be adjusted to suit the requirements of each message. Simply put, some messages may be over-replicated and others may be under-replicated. This lack of flexibility makes it difficult to achieve an optimal trade-off between resource consumption and delivery guarantees. To show this, we evaluate the performance of routing without using a replication technique as well as routing with fixed-quota replication. In order to investigate the impact of our proposed message dropping policy and replication technique, we evaluate the performance of our proposed LAMeD (without incorporating any replication mechanism) and LARep (which includes LAMeD and our proposed message replication mechanisms). We also evaluate the performance of the variable-quota replication technique proposed by Iqbal and Chowdhury [57], namely the Adaptive Spraying Scheme—ADS for short.
ADS starts by spraying message copies and defines a switch value that permits messages to enter the focus phase without waiting for their replication quota to reach one. The switch value, S , of a message is given by Equation (9), where L and l are the initial replication quota generated at the source and remaining quota on the message, respectively, R is the reference value, T is the initial TTL of the message, H is the number of hops travelled by the message, and A is the area of the network. A message remains in the spray phase if an only if ( l > 1 ) ( t > S ) , where t is the remaining TTL of the message. Hence, a message enters the wait phase once the remaining TTL on it is below the switch value.
S = [ T 2 H 2 + R ( L l ) ] / A
We incorporate our proposed LAMeD, LARep and each of the message replication techniques selected for comparison into a base routing protocol and analyse their results based on selected performance evaluation metrics. PRoPHET is chosen as the base routing protocol with its configuration parameters according to the values given by Grasic et al. [34]. For configuration settings of the replication techniques, fixed-quota replication uses binary spraying, and we select L , the replication quota, as 2, 4 and 8, based on best overall performance from several trials. For ADS, the value of L and the reference value are taken as 8 and 10, respectively, which yield best overall performance from several trials. For LARep, r is taken as 10 m, and location-based information is maintained at hourly intervals in a location table of 24 time slots.
Since our performance evaluation is done through simulations, node mobility needs to portray realistic human movement properties. Although real-world traces represent actual movement scenarios, they are less suitable for evaluating message replication for OppNets in Smart City scenarios due to: (i) the lack of realistic node density and encounter frequencies portrayed in city-wide scenarios; and (ii) the inability to change network properties such as node population and geographical area without interfering with the encounter opportunities between nodes. Hence, we resort to using WDM, a synthetic mobility model that provides the desired level of flexibility and is also able to reproduce realistic properties of human movement.
For the remainder of this section, Section 4.1.1 presents the simulation set-up while the performance evaluation metrics for analysing the replication techniques under comparison are defined in Section 4.1.2.

4.1.1. Simulation Set-Up

We carry out simulation experiments in the ONE simulator. In order to simulate an OppNet for conveying data between sensors and gateways in a city, users moving according to WDM carry mobile nodes that act as data mules between static sources and static destinations placed in popular locations. User devices are assumed to be smartphones or similar portable devices equipped with GPS technology and a Bluetooth interface capable of transferring data at 2 MBps over 10 m. Each mobile node is limited to a free buffer space of 10 MB for routing-related tasks, since users may not be willing to shed most of their storage space on behalf of the network.
As shown in Figure 14, the simulation area, which is represented by a 21 KM × 11 KM terrain, consists of 32 districts. The simulation is set to run for a duration of 5 days, in order to observe the daily movement routines WDM models in working days. This period entails 1 day for warm-up (to ensure complete generation of encounter and location history), the next 3 days for message generation and routing tasks, and the last day for cool-down (to allow every message delivery attempt).
To simulate sensors and gateways in a city, a total of 96 static nodes are placed in popular locations to represent 64 sources and 32 destinations, respectively. Specifically, source nodes were located in home locations (representing residential areas) and along roads (for environmental sensors), while destination nodes were located in office and meeting spot locations (to represent work places and shopping malls). A message is generated at each source node to a randomly chosen destination node (to avoid bias) every hour, making a total of 4608 messages for the entire simulation. Considering the type of delay-tolerant applications mentioned in Section 1, the size of messages is uniformly distributed between 10 KB and 15 KB. Each message is assigned a TTL of 24 h, as we opt for deliveries to be done within a day.
We configure energy consumption for Bluetooth according to the module proposed by Silva et al. [63]. The initial energy of mobile nodes is set to 4800 Joules (which is enough to ensure that they do not run out of energy before the end of the simulation) and 0.08 mW is consumed every second for message transmission (i.e., sending or receiving messages). Since we are only interested in the energy spent due to replication decisions made by different proposals, we consider only energy expended in message transmissions. Hence, other sources of energy expenditure (such as energy consumed from device discovery, device discovery response, and energy consumed in idle state) are set to 0. Table 4 summarises the simulation parameters. For each result, we present the average of 10 trials with different random seeds and the 95% confidence interval.

4.1.2. Performance Evaluation Metrics

This section introduces the metrics, namely transmission overhead, throughput, average energy consumption and average delivery delay for the performance evaluation.
Transmission overhead. As shown in Equation (10), the transmission overhead represents the average number of transmissions required to deliver a message copy; where T is the total number of message transmissions, and V is the number of times messages were delivered. This is equivalent to the cost of delivering messages with a forwarding algorithm, since every transmission consumes energy on user devices.
T r a n s m i s s i o n   o v e r h e a d = ( T V ) / V
Throughput. As shown in Equation (11), throughput is the ratio between d , the total number of messages successfully delivered at their respective destinations, and g , the total number of messages generated. This signifies the message delivery efficiency of a forwarding algorithm, within assigned TTL.
T h r o u g h p u t = d / g
Average energy consumption. Energy consumption (in Joules) is the amount of initial energy expended at the end of the simulation. As shown in Equation (12), the average energy consumption is the mean energy consumed by nodes in the network, where n is the total number of nodes, and E i and e i are the initial energy and the remaining energy of the ith node, respectively. This gives an insight on how routing impacts on resource consumption.
A v e r a g e   e n e r g y   c o n s u m p t i o n = i = 1 n ( E i e i ) / n
Average delivery delay. Delivery delay is the time elapsed between message generation and delivery. As shown in Equation (13), the average delivery delay is the mean delivery delay in the network, where G i and D i are the generation time and the delivery time of the ith message, respectively. This gives an insight on how long it takes to deliver a message.
A v e r a g e   d e l i v e r y   d e l a y = i = 1 d ( D i G i ) / d

4.2. Results and Discussion

This section presents and discusses the simulation results of LAMeD, LARep and the replication techniques selected for comparison in two parts that are detailed in Section 4.2.1 and Section 4.2.2. The first subsection evaluates the proposals under high degree of spatial locality in the Skudai scenario described in Section 4.1.1, while the second subsection evaluates them under increasing data traffic in the Helsinki simulation area (i.e., the medium scenario) described in Section 2.4.1. Throughput, average delivery delay and message transmission overhead are recorded in the presence of external messages that are generated according to the parameters given in Section 2.4.2. For recording energy consumption, the simulations are repeated without external messages.

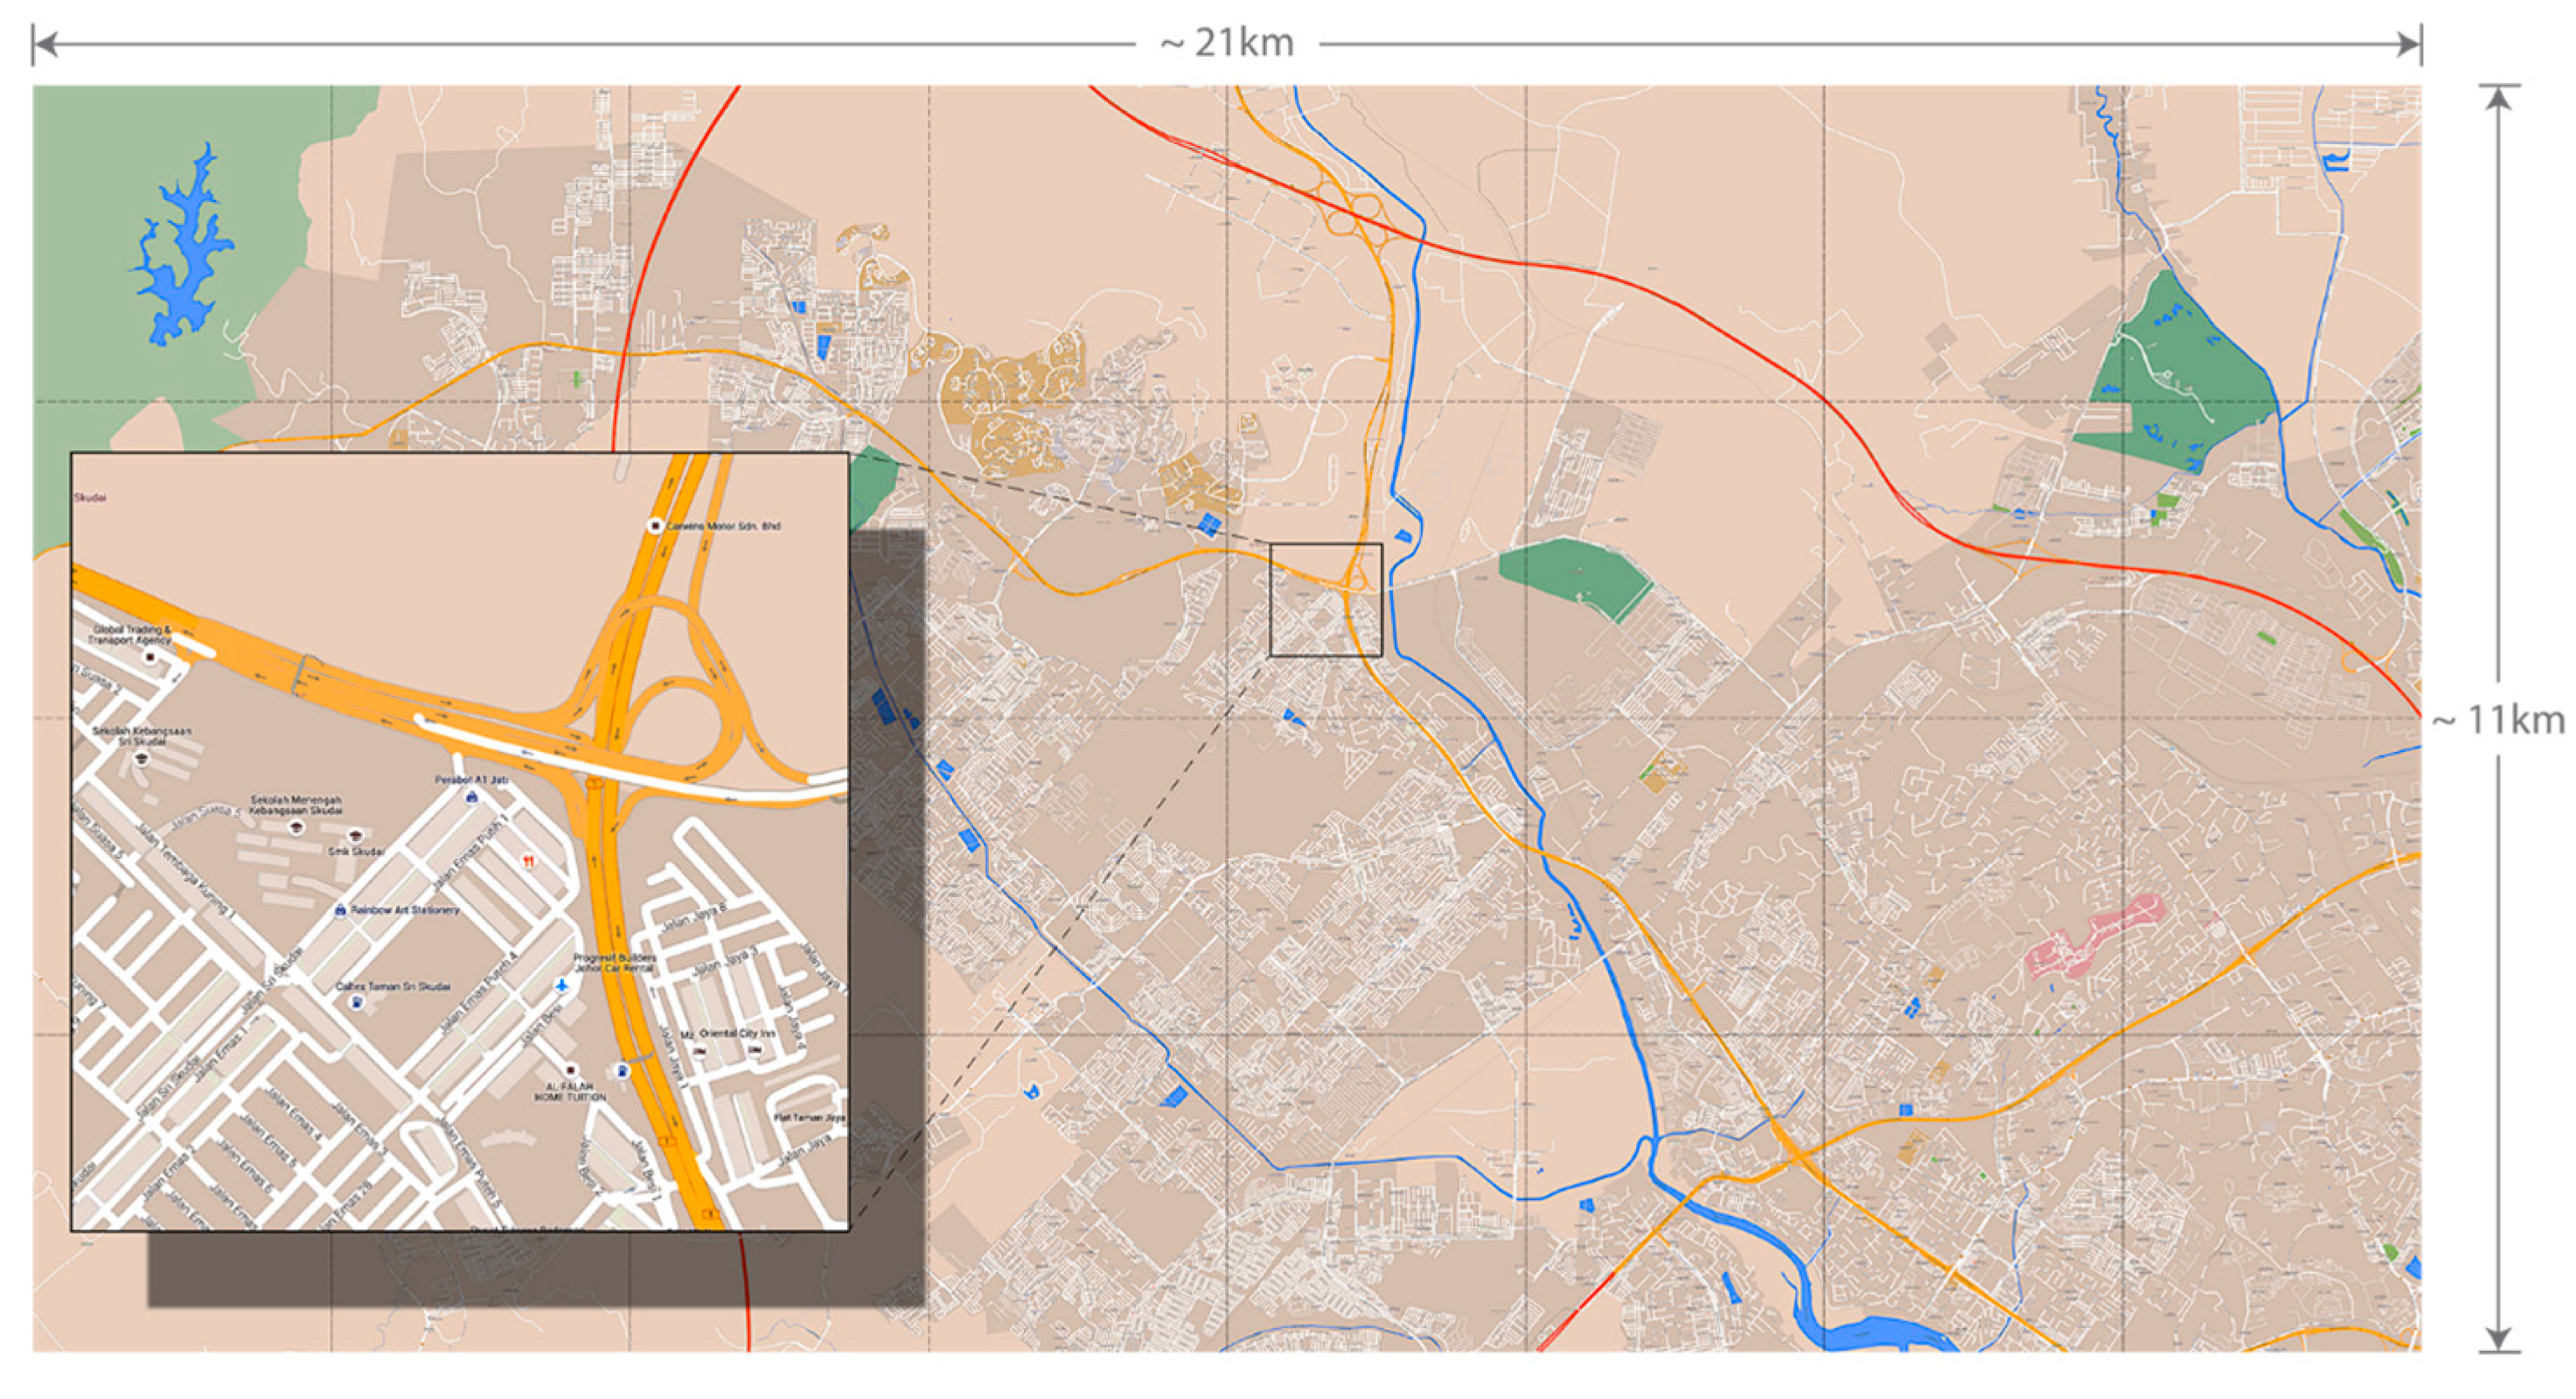
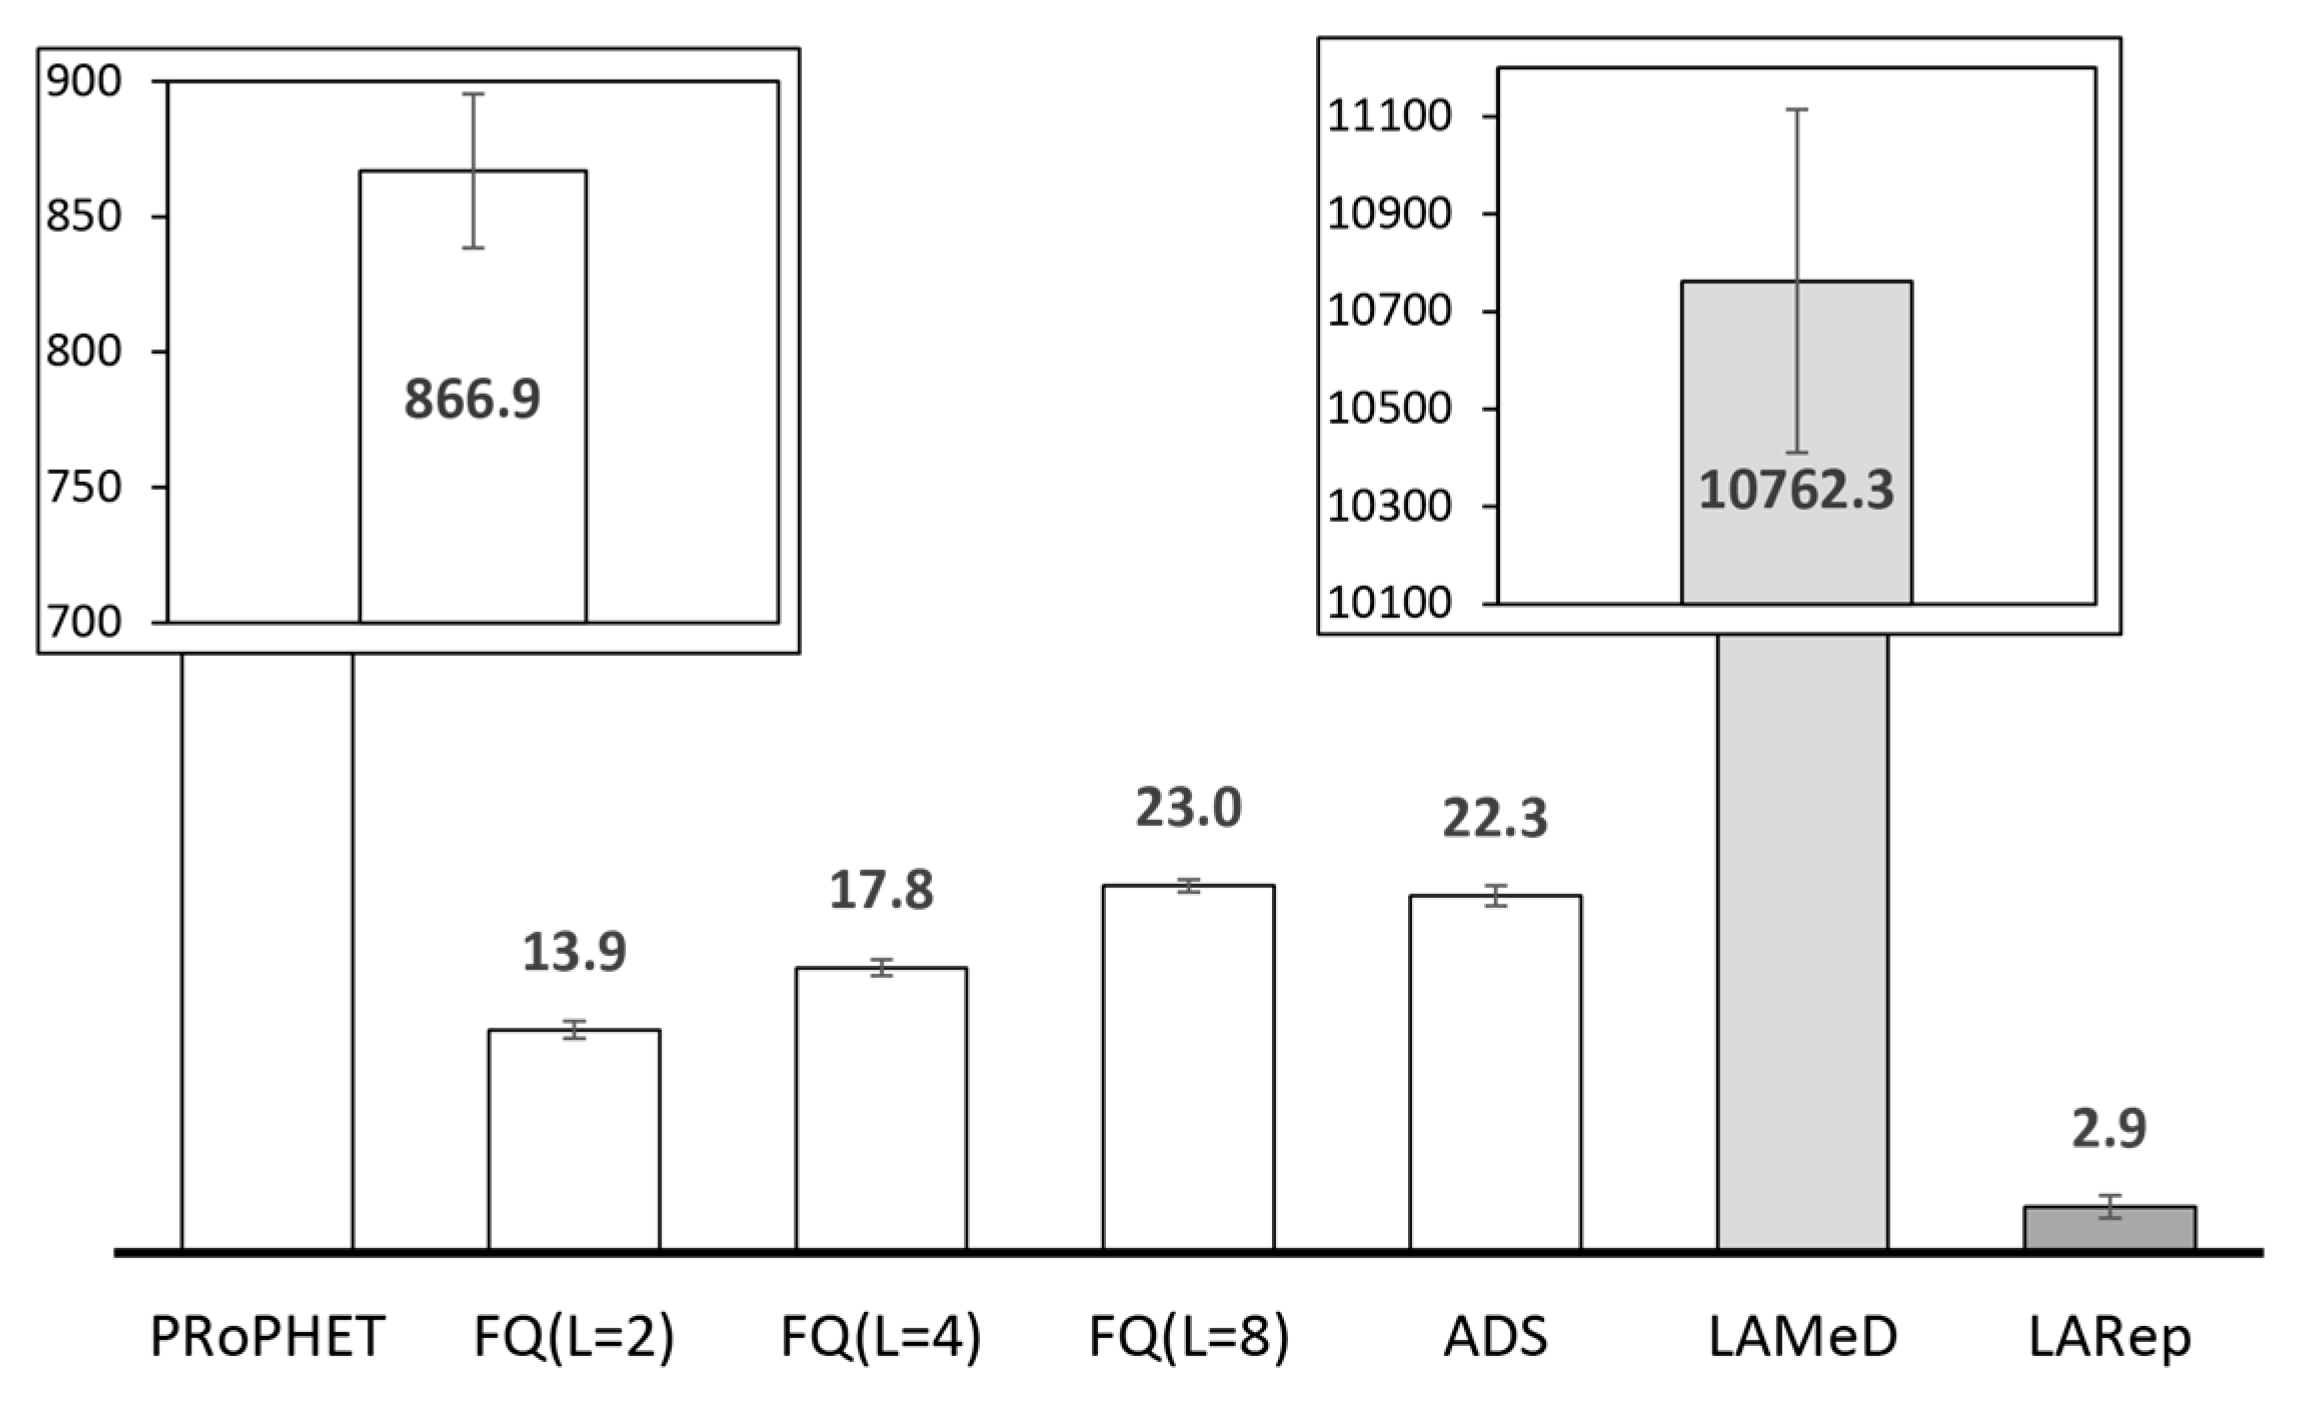
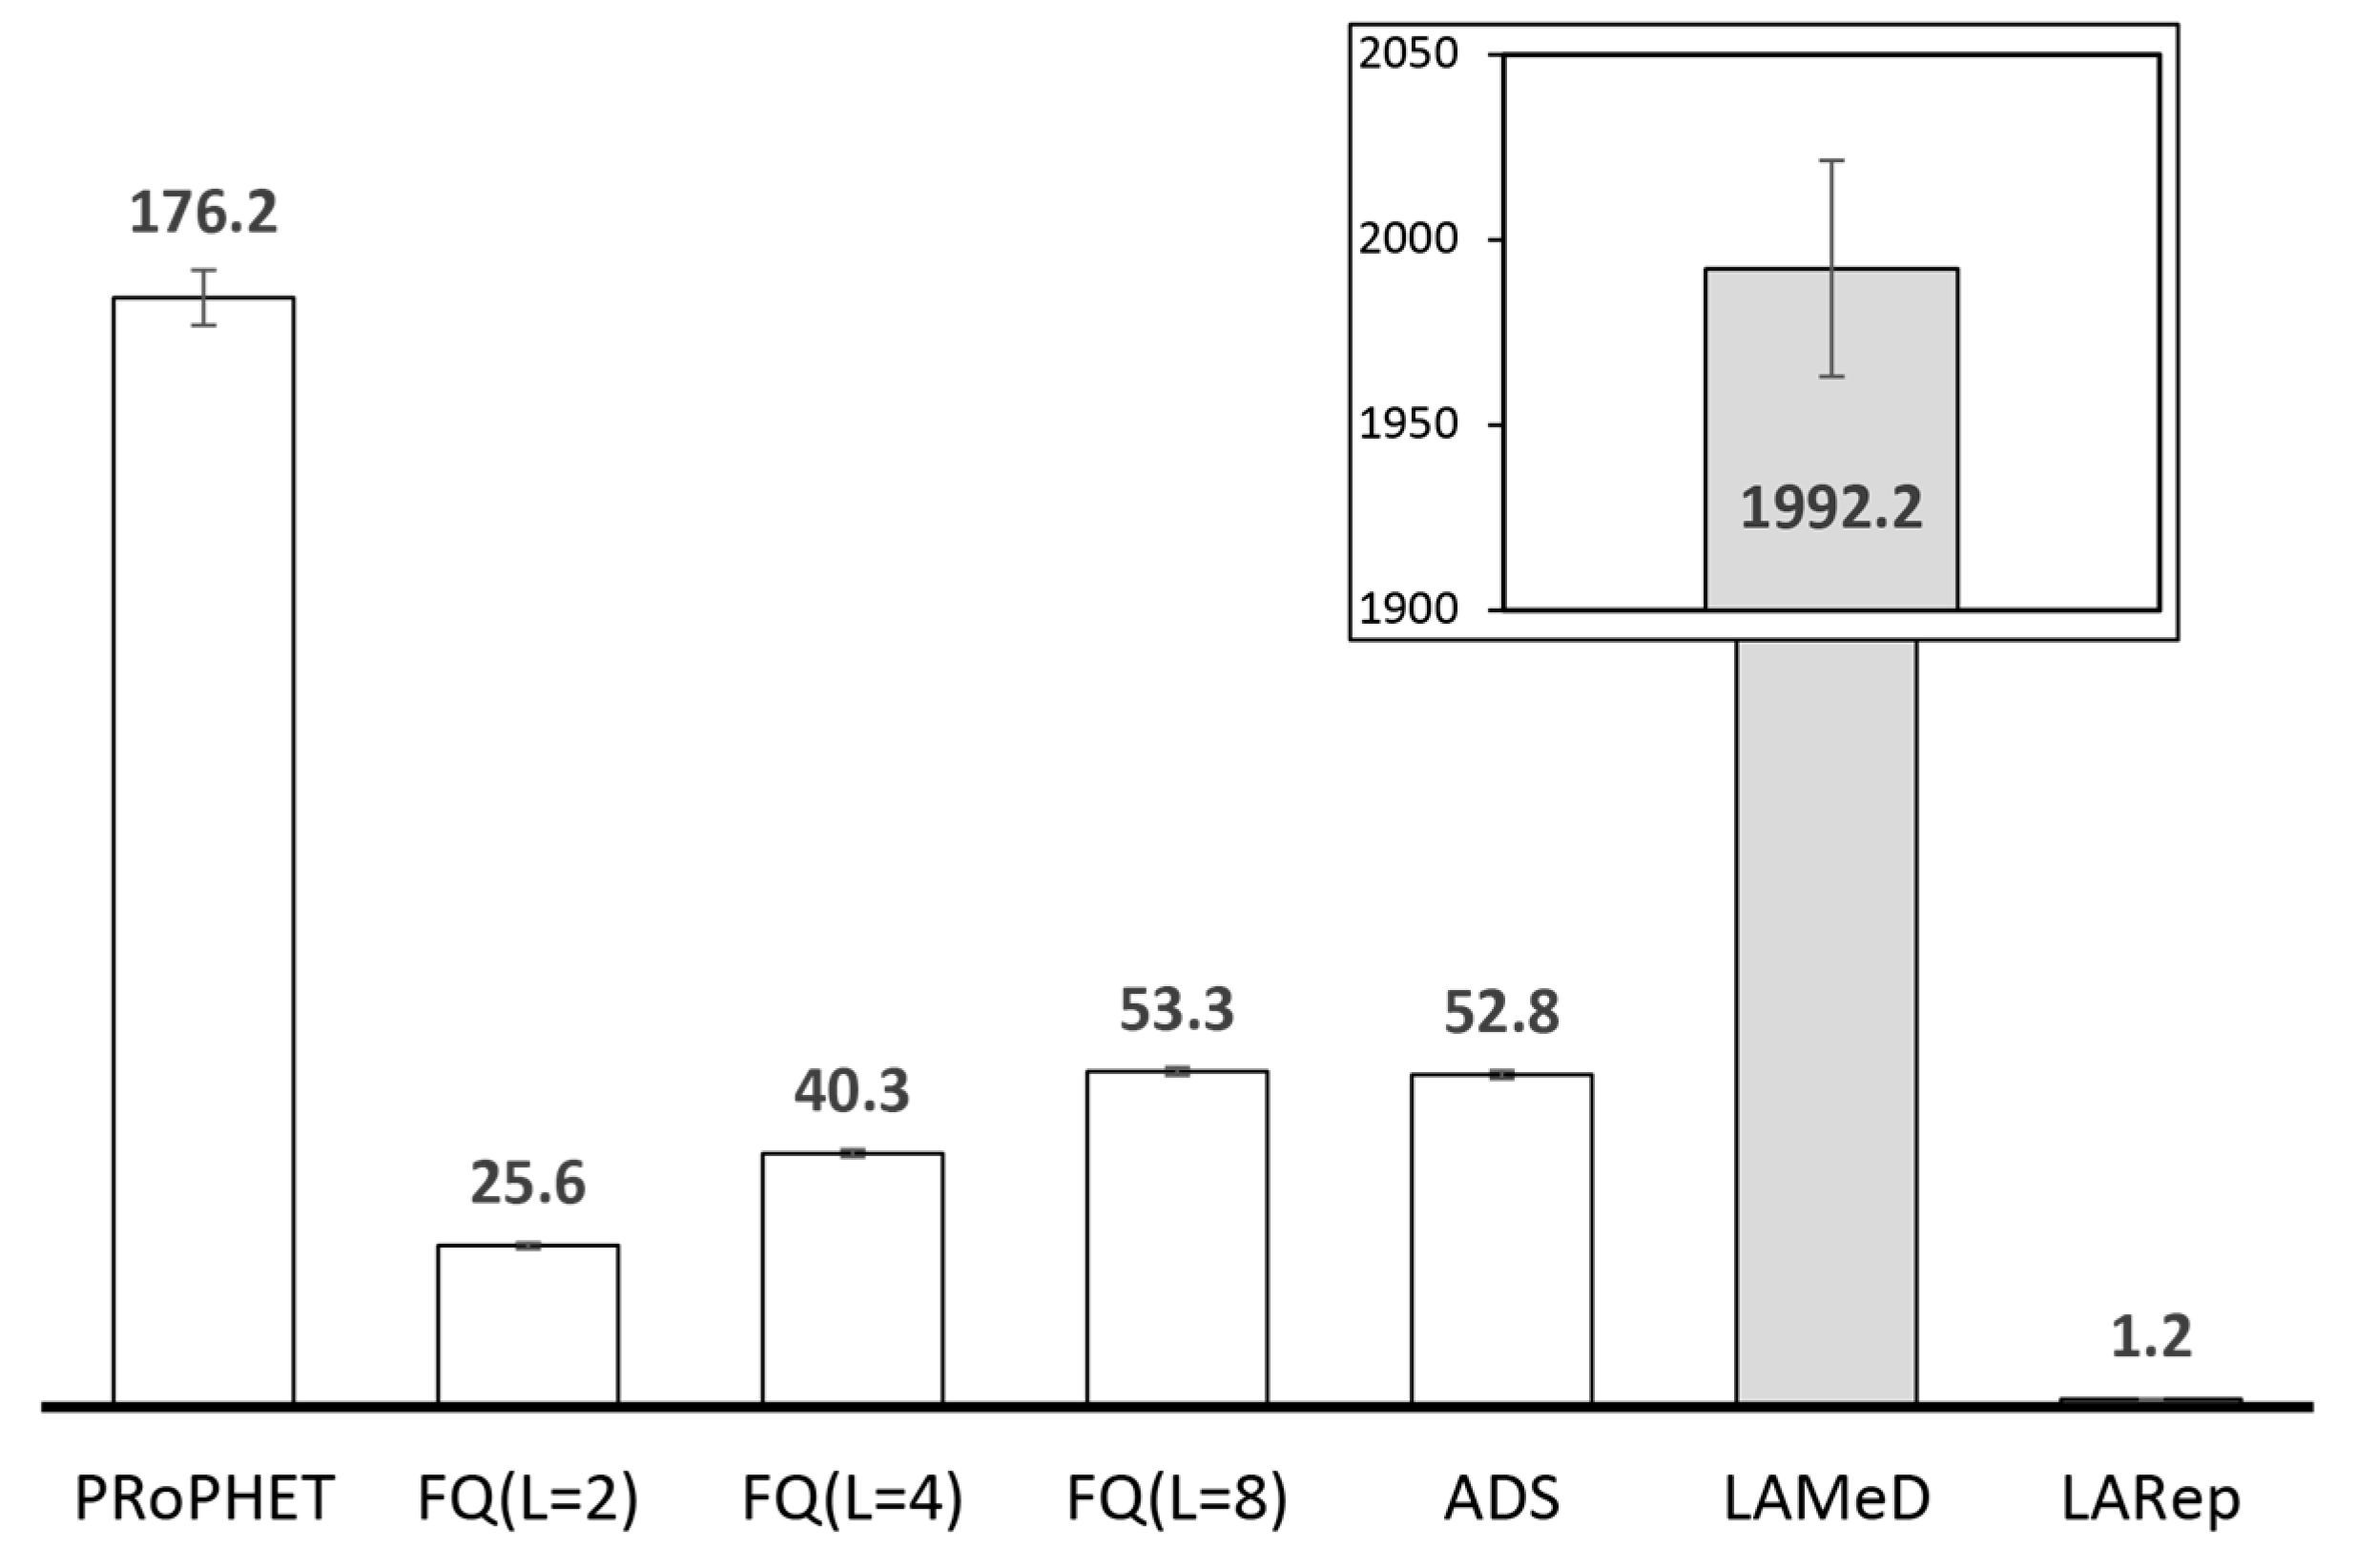
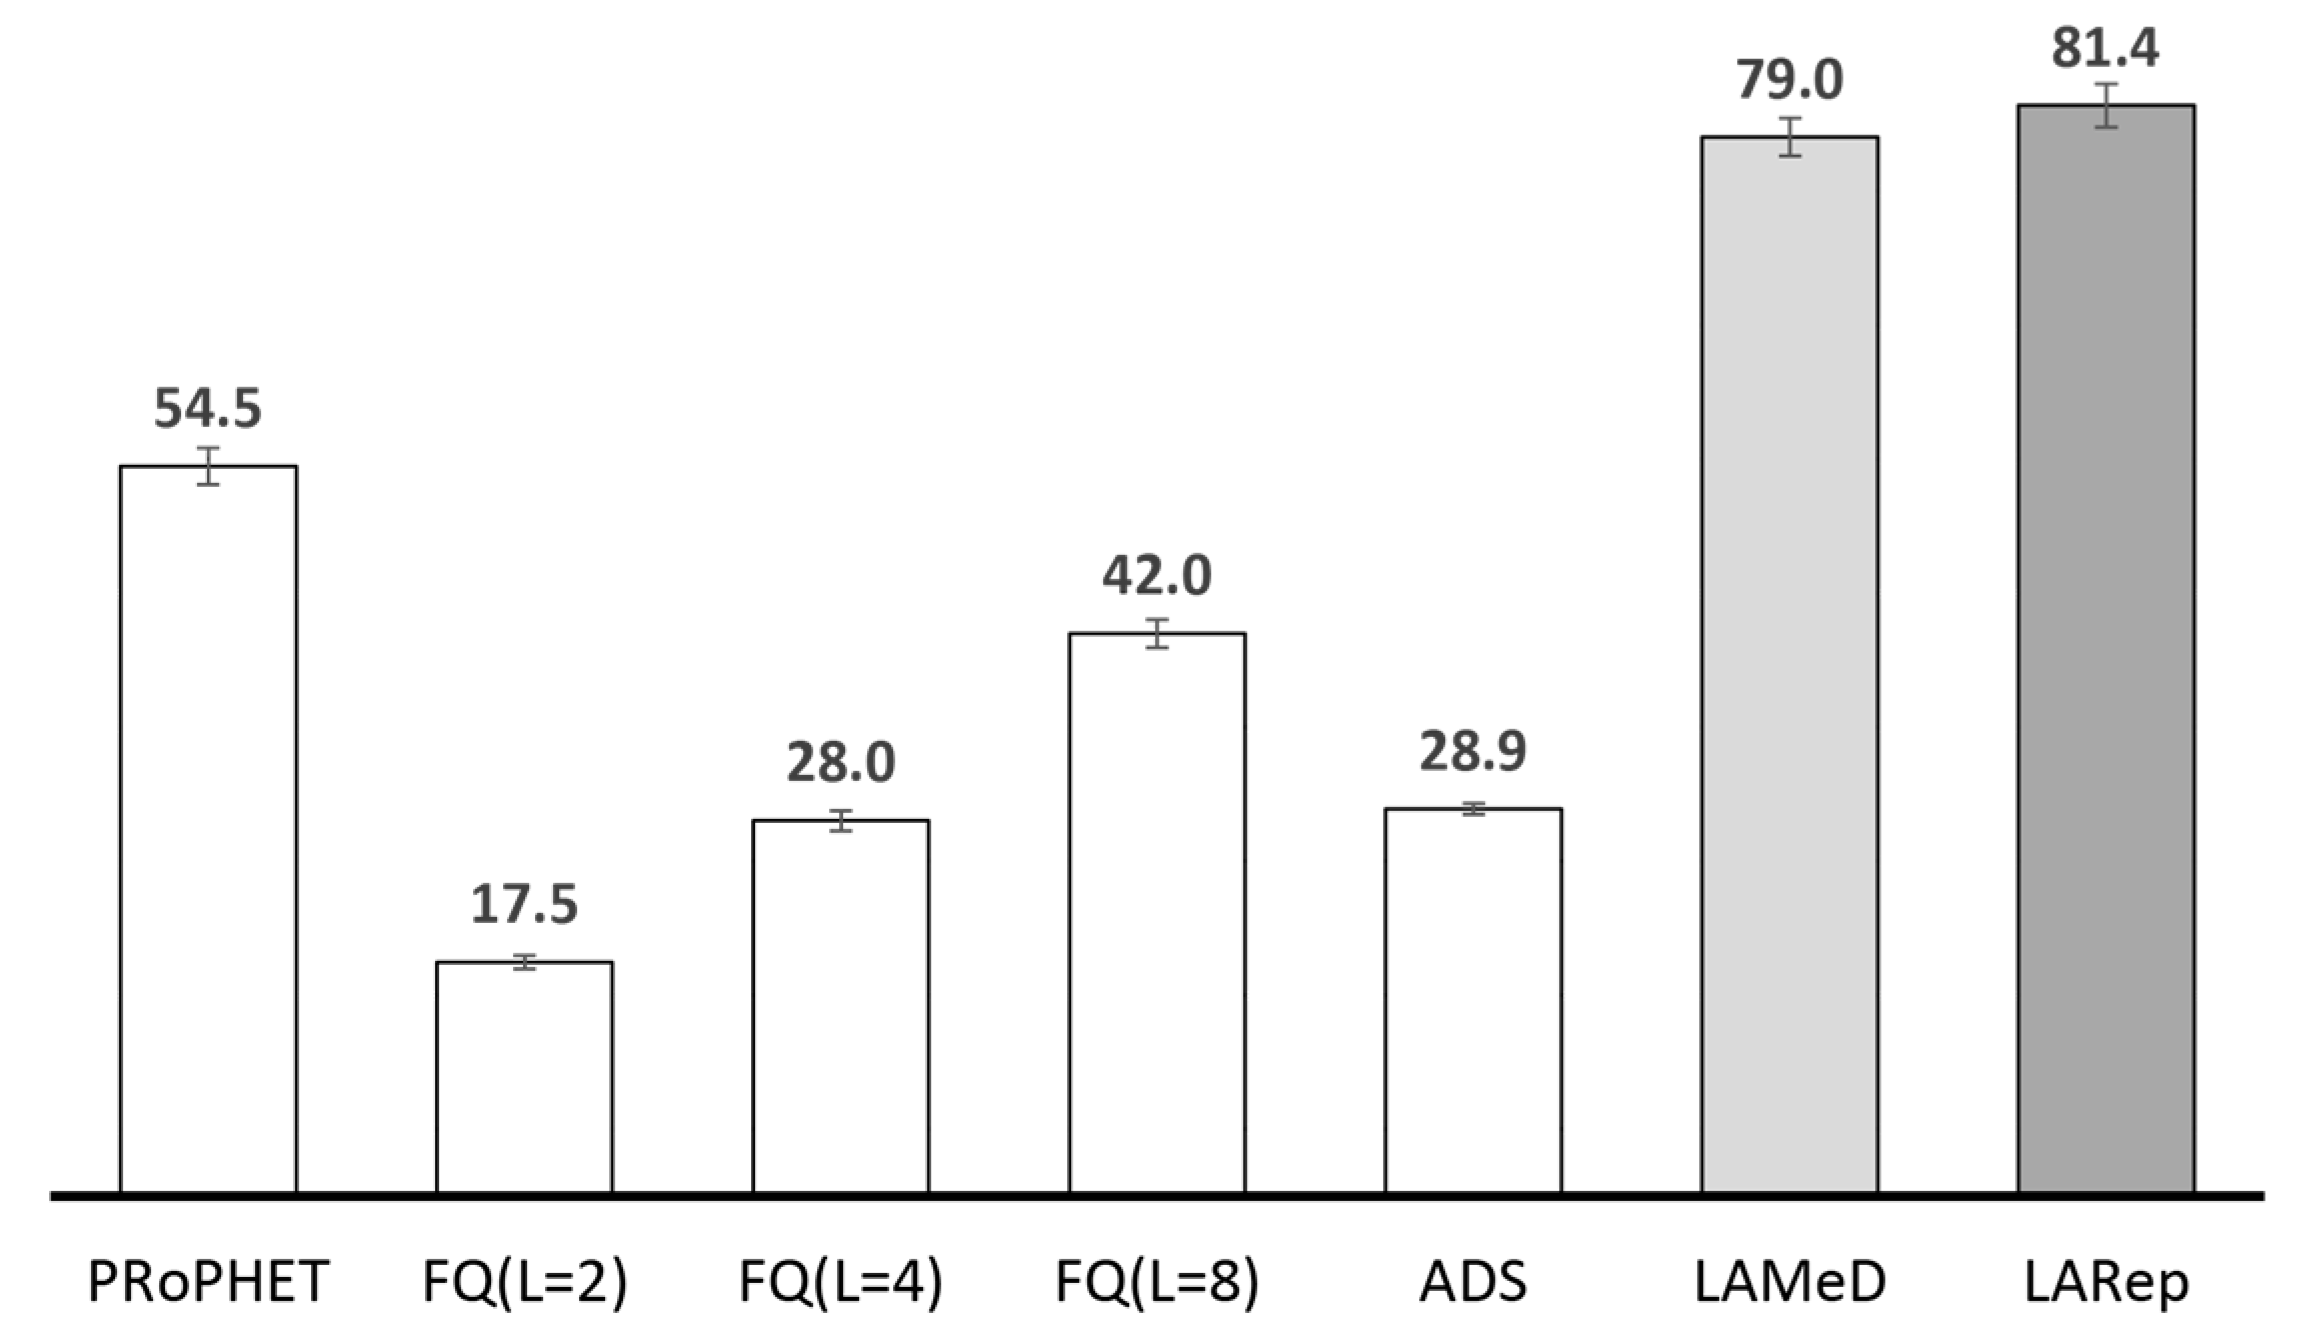
4.2.1. Performance Evaluation in the Skudai Scenario

The transmission overhead incurred and average energy consumed by the proposals are recorded in Figure 15 and Figure 16, respectively, while throughput and average delivery delay are recorded in Figure 17 and Figure 18, respectively. PRoPHET without a replication technique incurs a transmission overhead of 866.9. Using fixed replication quotas of 2, 4 and 8 results in 98.4%, 97.9% and 97.3% reduction in transmission overhead, respectively. With ADS, PRoPHET’s transmission overhead is reduced by 97.4%. While incorporating only LAMeD into PRoPHET increases transmission overhead by about 12 times, LARep (which includes our proposed replication mechanisms) achieves a reduction of 99.7%. In terms of energy consumption, PRoPHET consumes an average of 176.2 J without a replication technique. Using fixed replication quotas of 2, 4 and 8, reduces this value by 85.5%, 77.1% and 69.8%, respectively. With ADS, the average energy consumption is reduced by 70%. LAMeD alone consumes about 11 times more than PRoPHET, while LARep reduces PRoPHET’s average energy consumption by 99.3%.
PRoPHET gives a throughput of 54.5% without a replication technique. With fixed replication quotas of 2, 4 and 8, throughput drops by 67.9%, 48.6% and 22.9%, respectively. Also, utilizing ADS reduces throughput by 47%, while LAMeD and LARep increase throughput by 45% and 49.4%, respectively. In terms of delivery delay, PRoPHET without a replication technique records the lowest average at 6.1 h. With fixed replication quotas of 2, 4 and 8, average delivery delay increases by 11.5%, 21.3% and 25%, respectively. Also, utilizing ADS, LAMeD and LARep increases average delivery delay by 20%, 47.5% and 73.8%, respectively.
In summary, incorporating the replication techniques under comparison into PRoPHET routing protocol reduces transmission overhead and energy consumption, but only LARep increases throughput. LARep also records significantly lower transmission overhead and energy consumption. Average delivery delay on the other hand increases with throughput. We discuss these results and their implications in real-world scenarios next.
A. Routing without a Replication Technique
Most routing protocols do not utilize a replication technique in the sense that custodians are allowed to forward messages whenever relay nodes present better forwarding utilities. Replicating messages in this manner spontaneously increases delivery guarantees. Although simple to implement, the performance of this approach may vary under different network conditions. There is the tendency to generate excess copies of messages originating from nodes with relatively low forwarding utilities. Such cases are more likely in higher node population (since there may be more number of relay nodes with higher forwarding utilities) and degrees of spatial locality (as sources and destinations—i.e., sensors and their gateways—may be located in different local districts). Furthermore, there is no way to reduce or terminate replication of messages that already have enough copies in the network to guarantee delivery. Therefore, the issue when routing without a replication technique is the high risk of excessive transmission overhead and resource expenditure. In Figure 15 and Figure 16 for instance, routing without a replication technique records the highest transmission overhead and average energy consumption. The results show that transmission overhead and average energy consumption is reduced when the number of copies is controlled with a replication technique. Hence, allowing the forwarding utility and encounter opportunities alone to determine the number of message copies that are generated does not ensure acceptable resource consumption in OppNets for sensed data collection.
B. Routing with Fixed-Quota Replication
The message transmission overhead and resource utilization of PRoPHET without a replication technique justifies the need to control the number of message copies generated in the network. With fixed-quota replication, throughput increases with the number of message copies introduced in the network. As shown in Figure 17, increasing the quota from 2 to 4 increases throughput by 60%, while further increasing the quota from 4 to 8 causes an additional 50% improvement. Consequently, transmission overhead increases by 28.1% and 22.6%, respectively, and in terms of resource utilization, increases average energy consumption by 57.4% and 32.3%, respectively. These results signify two things. First, the choice of the message replication quota is a crucial determining factor of network performance. Unfortunately, it is difficult to determine the optimal quota under increasing node population and degrees of spatial locality. Furthermore, the optimal quota may vary, depending on current network conditions. Second, while increasing the message replication quota increases throughput, the overall performance does not seem to be improving at a rate that would catch up with LARep’s results anytime soon. By increasing the replication quota to 16 and 32, we observed that throughput rather appears to be converging towards a maximum value. Moreover, each increment incurs an additional transmission overhead and consumes more energy, which gradually approaches that of PRoPHET without a replication technique.
C. Routing with Variable-Quota Replication Using ADS and LARep
A noticeable trend is the relationship between message transmission overhead and energy consumption, such that incurring more of the former results in more of the latter. For instance, routing without a replication technique incurs the highest transmission overhead and also records the highest energy consumption as compared with utilizing a replication technique. With fixed-quota replication, more quota incurs more message transmission overhead and consumes more energy as well. It is also noticeable that more quota increases delivery guarantees, thereby resulting in more throughput. The flexibility lacking in fixed-quota replication can be achieved with variable-quota replication. The challenge however, is achieving this with realistic assumptions that comply with the characteristics of OppNets for sensed data collection. By terminating replication even before the quota is exhausted, ADS achieves a balance between fixed-quota’s message transmission overhead and throughput (i.e., both metrics are neither maximum nor minimum as compared with utilizing fixed replication quotas). While this relaxes the need for an optimal quota, the mechanism is based on a switch value that is derived from network area. Unfortunately, obtaining the area of a highly dynamic network on demand is impractical, especially without knowledge about global network parameters. Furthermore, the number of generated copies is still limited by the selected quota.
LARep records the lowest transmission overhead and highest throughput—incorporating it into PRoPHET reduces transmission overhead by 99.7% and increases throughput by 49.4%. LARep takes a different approach by replicating messages at different rates depending on their likelihood of delivery and progress towards the destination. Unlike existing variable-quota replication techniques, LARep is designed to cope with the characteristics of OppNets for sensed data collection, and replicates messages without the need for global knowledge about network parameters. As compared with replicating every message at the same rate, reducing the replication rate of some messages reduces transmission overhead as well as the number of failed transmissions. As shown in Figure 19, the number of failed transmissions corresponds with the energy expenditure of the proposals. This is because each failed transmission accounts for energy. Furthermore, more failed transmissions results in more re-transmission attempts, hence, more energy consumption. LARep records the lowest number of failed transmissions, thereby consuming the least energy in this aspect.
Reducing the replication of messages that have more chances of delivery also accounts for reduced transmission overhead due to less redundant transmissions. This can be observed from LARep’s ability to reduce the transmission overhead that LAMeD incurs mainly due to retaining messages with more chances of being delivered for longer periods. Our proposed replication mechanisms also introduce more copies of messages with less chances of delivery, thereby improving throughput significantly. Retaining some messages for longer periods also has an impact on the time taken to deliver messages as LARep records the highest average delivery delay at 10.6 hours. However, delivering messages within a half-day period is acceptable considering the delay-tolerant nature of the data involved.
D. Replication Techniques and Average Delivery Delay
It is also important to note that average delivery delay increases with more message copies (cf. Figure 18) and may be controversial to expected results. The computation of average delivery delay is unaware of message copies and treats multiple deliveries of the same message as deliveries of different messages. As a result, the average delivery delay increases when a destination node receives additional copies of a message that has already been delivered, which becomes more frequent with higher delivery guarantees. Hence, delay is incurred from retaining messages until more suitable relay nodes are encountered.
Take Figure 20 for example, which illustrates two scenarios that involve sending a message from source to destination. A maximum of 2 copies are generated in the first scenario, while the second scenario generates up to 4 copies. Also assume that 1 copy of the message is lost in each scenario. For the first scenario, the average delivery delay is only determined by the time taken to deliver the remaining copy. On the other hand, the average delivery delay in the second scenario is determined by the time taken to deliver each of the remaining 3 copies. Consequently, the average delivery delay is higher in the second scenario, even when the first copy of the message was delivered in less time. While this method of computing average delivery delay is reasonable for OppNet applications like interest-based or location-based data dissemination (i.e., it shows how long it takes for copies the message to reach interested or intended users), it may not be suitable for applications such as sensed data collection where a successful delivery is determined by receiving only one copy of the message. In order to prevent misleading results, whether or not the computation of average delivery delay considers multiple deliveries as unique deliveries needs to be based on the OppNet application at hand.
As shown in Figure 18, PRoPHET without a replication technique records the lowest average delivery delay. Without a replication technique, message loss due to buffer overflow is more frequent (especially when they are dropped according to the FIFO policy), thereby curbing most of the delay that results from retaining messages until better relay nodes are encountered. Fixed-quota replication reduces message loss due to buffer overflows by transferring custody of a message to a relay node in the focus phase (i.e., after the quota is exhausted). Hence, even when there are 8 copies of each message in the network, buffer overflow is still limited. In terms of delay however, more quota retains messages in node buffers for longer periods. While this utilizes more encounter opportunities to increase throughput, more average delivery delay is incurred each time the replication quota is increased. However, transferring custody of a message to a relay node in the focus phase also limits the throughput of fixed-quota replication (as compared with LARep) since better encounter opportunities that may arise afterwards are missed. On the other hand, retaining some messages for longer periods causes LAMeD to incur a higher average delivery delay, and the replication mechanisms in LARep introduces more delay by generating more copies of certain messages.

4.2.2. Performance Evaluation in the Helsinki Scenario

The Helsinki scenario is simulated under five different rates of message generation in order to analyse how the replication techniques respond to changes in data traffic. The scenario consists of 600 nodes, which include 80 source nodes and 36 destination nodes that are placed in popular locations to represent sensors and gateways, respectively. Each source node generates messages to a randomly chosen destination node at the following rates: (i) 1 message every 3 h; (ii) 1 message every 2 h; (iii) 1 message every hour; (iv) 2 messages every hour; and (v) 3 messages every hour. External messages are also generated at the same rate, with randomly selected nodes as source and destination. The value of L for fixed-quota and ADS is taken as 4 and other settings remain as that of Section 4.2.1. The results are recorded in Figure 21 and Figure 22—the former showing throughput and average delivery delay, and the latter showing transmission overhead and average energy consumption.
A. Throughput under Changing Data Traffic
Under less data traffic, buffer overflows are less frequent due to less buffer occupancy. Consequently, PRoPHET without a replication technique records relatively high throughput: since most messages remain in node buffers and are replicated whenever a more suitable relay node is encountered. However, as data traffic increases, buffer overflows become more frequent and the lack of a replication technique causes throughput to reduce more drastically. PRoPHET without a replication technique records the sharpest drop in throughput while incorporating a replication technique records more stable throughput values. From the lowest to the highest data traffic, PRoPHET without a replication technique experiences a 40.8% drop in throughput as compared with 16.5%, 19% and 21.2% for fixed-quota, LARep and ADS, respectively.
While controlling replication with a fixed quota results in the most stable throughput under different data traffic, delivery guarantees are limited and relatively low. ADS records slightly less throughput since the replication quota does not exceed the fixed value. LARep records the highest throughput among the replication techniques as data traffic increases. The results suggest that incorporating LAMeD into PRoPHET improves throughput while our proposed replication mechanisms regulate generated copies to sustain delivery guarantees.
B. Average Delivery Delay under Changing Data Traffic
Besides a reduction in throughput as data traffic rises, Figure 21 shows that average delivery delay also increases in the process. With other conditions remaining the same, higher data traffic increases buffer occupancy, which in turn reduces the chances of completing the forwarding transactions for an encounter opportunity. As a result, messages take longer to reach their destinations, thereby increasing average delivery delay.
The average delivery delay without a replication technique begins to surpass that of fixed-quota and ADS as data traffic increases. This is mainly due to fixed-quota and ADS also losing messages due to buffer overflow caused by higher data traffic. The differences in the delays of fixed-quota and ADS are relatively small, which is reasonable as they are both limited to generating 4 copies per message. As for our proposals, incorporating LAMeD into PRoPHET allows nodes to retain some messages (i.e., messages for which they can make better delivery contributions) for longer periods, thereby increasing average delivery delay. Further incorporating our proposed replication mechanisms reduces buffer occupancy and message loss by controlling replication. This is especially significant under less data traffic, as nodes can retain messages for longer periods of time in their buffers, consequently increasing average delivery delay. Higher data traffic however, increases message loss due to buffer overflows and reduces average delivery delay. This explains why the difference between the delays incurred by LAMeD and LARep reduces as data traffic increases.
C. Transmission Overhead and Average Energy Consumption under Changing Data Traffic
Figure 22 shows that transmission overhead reduces as data traffic increases. Nodes can retain messages in their buffers for longer periods of time under less data traffic due to less buffer occupancy. This results in more chances of replicating messages and increased transmission overhead. The replication techniques also retain their relative performance under different data traffic, with LARep incurring the lowest transmission overhead, followed by ADS, fixed-quota and PRoPHET without a replication technique, while LAMeD incurs the highest transmission overhead. Their performance in terms of average energy consumption corresponds to their transmission overhead. LARep records up to 96.4% reduction in energy consumption, as compared with 64.5% and 65.2% for fixed-quota and ADS, respectively.

5. Conclusions and Future Work

OppNets for sensed data collection are characterised by high node population, dynamicity and degrees of spatial locality inherent to user movement. Under these characteristics, forwarding messages without controlling the number of generated copies may result in excessive transmission overhead and resource consumption on portable handheld user devices. Since only one copy of each message may be insufficient, existing techniques for controlling message replication generate multiple copies, which may either be fixed or variable. However, limiting the number of message copies to a particular value is not flexible enough to adapt to the requirements of each message. Also, varying the replication of each message by allowing network properties (e.g., total number of nodes) or message parameters (e.g., TTL) to determine generated copies require careful selection, which may be impractical in the absence of global knowledge about the network. Another drawback of existing message replication techniques is their obliviousness to spatial locality inherent to user movement. High degrees of spatial locality in sensed data collection scenarios reduce encounter opportunities between nodes from different locations in the network, thereby degrading routing performance.
Our contribution in this regard is twofold:
  • We first established relevant characteristics of OppNets for sensed data collection introduced by the presence of portable handheld user devices, since existing message replication techniques are not specifically designed to cope with the characteristics. Then we investigated the impact of these characteristics on existing message replication techniques and suggested design guidelines that need to be observed in order to improve routing performance and feasibility in real-world implementation.
  • Next, we followed our design guidelines to propose a set of mechanisms that collectively form LARep, a message replication technique that can be incorporated into existing encounter-based routing protocols to reduce message transmission overhead without compromising throughput. LARep exploits the concept of spatial locality to replicate messages according to the proximity of nodes’ preferred locations in the network. This allows different messages to be replicated at varying rates, thereby achieving a near optimal quota for each, without requiring global knowledge about the network. LARep also introduces a locality aware policy for dropping messages, which further improves throughput. Incorporating LARep into PRoPHET reduced message transmission overhead, reduced energy consumption and increased throughput. Experiments in the ONE simulator showed that LARep achieves better performance as compared with existing message replication techniques.
We expect this work to motivate further research contributions. Future proposals should benefit from our design guidelines and lessons learned from this work, such as the best practice of including external messages when evaluating the performance of routing protocols and message replication techniques. Future work includes investigating the impact of LARep on different encounter-based routing protocols. Future work also includes investigating how LARep can be improved with learning mechanisms on sink nodes and feedbacks from gateways. Also, LARep requires GPS for obtaining location-based information. In reality, users may not be willing to always have the GPS on their devices turned on due to energy consumption. Furthermore, real-world implementation also raises the issue of unreliable GPS signal in geographically restricted locations. Future work could reduce the need for consistent GPS readings by incorporating prediction mechanisms that exploit the regularity embedded in human movement to infer node location.
Also, it would be interesting to observe the behaviour of our proposed LARep and compare its performance with existing solutions in a real-world trace. However, the open issues concerning message replication for OppNets in Smart City scenarios arise only when the node densities and encounter frequencies resemble the ones in city-wide scenarios. For instance, the scenario needs to portray the high number of encounters experienced due to high node population (e.g., during rush hours), high encounter frequency in popular places (e.g., bus stops and shopping malls), the large number of encounters that extremely popular devices (e.g., those carried by bus and taxi drivers) experience, and sufficient encounters between road side sensors and user devices. Distance and geographic area also play an important role in validating LARep since it exploits concepts of spatial locality inherent to user movement in urban environments. Hence, it is crucial to achieve a balance between node population and geographic area. A major condition is for the network to consist of different geographical districts, in which user movement is restricted (e.g., the 4 major districts in the Helsinki scenario). At the moment, publicly available datasets are unable to meet these conditions. Take the Dartmouth mobility trace [75] for instance, which is currently one of the largest publicly available contact datasets in terms of scale and number of monitored nodes [76]. The contact trace was collected in the Dartmouth College campus on 200 acres of land. Covering an area less than 1% of the Skudai scenario, it is fair to say that it does not portray spatial locality in a city. Moreover, the movement depicts that of a compact campus rather than a city. Hence, we have utilized WDM since it offers a scaled down version of a city (i.e., the node population can be adjusted in accordance with the geographical area to achieve a realistic density that portrays all the desirable movement properties in an urban environment) and have left evaluations in real-world traces for future work.

Author Contributions

Tekenate E. Amah conceived the original idea, designed the figures, implemented the proposals in the simulator and wrote the manuscript with input from all authors. Waldir Moreira and Antonio Oliveira-Jr contributed to the problem background the evaluation methodology. Aliyu M. Abali assisted with the simulation set up and helped carry out the experiments. Syed Othmawi Abd Rahman and Muhammad Hafiz Mohammed were involved in processing the experimental data. Maznah Kamat and Kamalrulnizam Abu Bakar aided in interpreting the results and supervised the findings of this work. All authors provided critical feedback and helped shape the research, analysis and manuscript.

Conflicts of Interest

The authors declare no conflict of interest.

References

  1. ITU-T Focus Group on Smart Sustainable Cities: An Overview of Smart Sustainable Cities and the Role of Information and Communication Technologies. Available online: http://www.itu.int/en/ITU-T/focusgroups/ssc/Documents/Approved_Deliverables/TR-Overview-SSC.docx (accessed on 2 September 2017).
  2. Gomez, C.; Paradells, J. Urban Automation Networks: Current and Emerging Solutions for Sensed Data Collection and Actuation in Smart Cities. Sensors 2015, 15, 22874–22898. [Google Scholar] [CrossRef] [PubMed] [Green Version]
  3. Clarke, R. Smart Cities and the Internet of Everything: The Foundation for Delivering Next-Generation Citizen Services. Available online: http://www.cisco.com/c/dam/en_us/solutions/industries/docs/scc/ioe_citizen_svcs_white_paper_idc_2013.pdf (accessed on 2 September 2017).
  4. Du, W.; Li, Z.; Liando, J.; Li, M. From Rateless to Distanceless: Enabling Sparse Sensor Network Deployment in Large Areas. IEEE/ACM Trans. Netw. 2016, 24, 2498–2511. [Google Scholar] [CrossRef]
  5. Mao, X.; Miao, X.; He, Y.; Li, X.; Liu, Y. CitySee: Urban CO2 monitoring with sensors. In Proceedings of the 31st Annual IEEE International Conference on Computer Communications, Orlando, FL, USA, 25–30 March 2012; pp. 1611–1619. [Google Scholar]
  6. Valerio, L.; Bruno, R.; Passarella, A. Cellular traffic offloading via opportunistic networking with reinforcement learning. Comput. Commun. 2015, 71, 129–141. [Google Scholar] [CrossRef]
  7. Baker, T.; Ngoko, Y.; Tolosana-Calasanz, R.; Rana, O.; Randles, M. Energy Efficient Cloud Computing Environment via Autonomic Meta-director Framework. In Proceedings of the 6th International Conference on Developments in eSystems Engineering, Abu Dhabi, United Arab Emirates, 16–18 December 2013; pp. 198–203. [Google Scholar]
  8. Aldawsari, B.; Baker, T.; England, D. Trusted Energy-Efficient Cloud-Based Services Brokerage Platform. Int. J. Intell. Comput. Res. 2015, 6, 630–639. [Google Scholar] [CrossRef]
  9. Baker, T.; Asim, M.; Tawfik, H.; Aldawsari, B.; Buyya, R. An energy aware service composition algorithm for multiple cloud based IoT applications. J. Netw. Comput. Appl. 2017, 89, 96–108. [Google Scholar] [CrossRef]
  10. Baker, T.; Al-dawsari, B.; Tawfik, H.; Reid, D.; Ngoko, Y. GreeDi: An energy efficient routing algorithm for big data on cloud. Ad Hoc Netw. 2015, 35, 83–96. [Google Scholar] [CrossRef]
  11. Ochiai, H.; Ishizuka, H.; Kawakami, Y.; Esaki, H. Agent based sensor data gathering for agricultural applications. IEEE Sens. J. 2011, 11, 2861–2868. [Google Scholar] [CrossRef]
  12. Tovar, A.; Friesen, T.; Ferens, K.; McLeod, B. A DTN wireless sensor network for wildlife habitat monitoring. In Proceedings of the 23rd Canadian Conference on Electrical and Computer Engineering, Calgary, AB, Canada, 2–5 May 2010; pp. 1–5. [Google Scholar]
  13. McDonald, P.; Geraghty, D.; Humphreys, I.; Farrell, S.; Cahill, V. Sensor Network with Delay Tolerance (SeNDT). In Proceedings of the 16th International Conference on Computer Communications and Networks, Honolulu, HI, USA, 13–16 August 2007; pp. 1333–1338. [Google Scholar]
  14. Velásquez-Villada, C.; Donoso, Y. Delay/Disruption Tolerant Network Based Message Forwarding for a River Pollution Monitoring Wireless Sensor Network Application. Sensors 2016, 16, 436. [Google Scholar] [CrossRef] [PubMed]
  15. Cheng, N.; Lu, N.; Zhang, N.; Shen, X.; Mark, J. Vehicle-assisted data delivery for smart grid: An optimal stopping approach. In Proceedings of the IEEE International Conference on Communications, Budapest, Hungary, 9–13 June 2013; pp. 6184–6188. [Google Scholar]
  16. Park, U.; Heidemann, J. Data muling with mobile phones for sensornets. In Proceedings of the 9th ACM Conference on Embedded Networked Sensor Systems, Seattle, WA, USA, 1–4 November 2011; pp. 162–175. [Google Scholar]
  17. Can, Z.; Demirbas, M. Smartphone-based data collection from wireless sensor networks in an urban environment. J. Netw. Comp. Appl. 2015, 58, 208–216. [Google Scholar] [CrossRef]
  18. Shi, F.; Adeel, U.; Theodoridis, E.; Haghighi, M.; McCann, J. OppNet: Enabling citizen centric urban IoT data collection through opportunistic connectivity service. In Proceedings of the IEEE 3rd World Forum on Internet of Things, Reston, VA, USA, 12–14 December 2016; pp. 723–728. [Google Scholar]
  19. Dimatteo, S.; Hui, P.; Han, B.; Li, V. Cellular Traffic Offloading through Wi-Fi Networks. In Proceedings of the IEEE 8th International Conference on Mobile Ad Hoc and Sensor Systems, Valencia, Spain, 17–22 October 2011; pp. 192–201. [Google Scholar]
  20. Petz, A.; Lindgren, A.; Hui, P.; Julien, C. Madserver: A server architecture for mobile advanced delivery. In Proceedings of the 7th ACM International Workshop on Challenged Networks, Istanbul, Turkey, 22–26 August 2012; pp. 17–22. [Google Scholar]
  21. Rebecchi, F.; Dias de Amorim, M.; Conan, V.; Passarella, A.; Bruno, R.; Conti, M. Data Offloading Techniques in Cellular Networks: A Survey. IEEE Commun. Surv. Tutor. 2015, 17, 580–603. [Google Scholar] [CrossRef]
  22. Wu, X.; Brown, K.; Sreenan, C. Analysis of smartphone user mobility traces for opportunistic data collection in wireless sensor networks. Pervasive Mob. Comput. 2013, 9, 881–891. [Google Scholar] [CrossRef]
  23. Wu, X.; Brown, K.; Sreenan, C. Exploiting Rush Hours for Energy Efficient Contact Probing in Opportunistic Data Collection. In Proceedings of the 31st International Conference on Distributed Computing Systems Workshops, Minneapolis, MN, USA, 20–24 June 2011; pp. 240–247. [Google Scholar]
  24. Aguilar, S.; Vidal, R.; Gomez, C. Opportunistic Sensor Data Collection with Bluetooth Low Energy. Sensors 2017, 17, 159. [Google Scholar] [CrossRef] [PubMed]
  25. Conti, M.; Boldrini, C.; Passarella, A. Context and resource awareness in opportunistic network data dissemination. In Proceedings of the 9th IEEE International Symposium on A World of Wireless, Mobile and Multimedia Networks, Newport Beach, CA, USA, 23–26 June 2008; pp. 1–6. [Google Scholar]
  26. Wang, W.; Amza, C. Motion-based routing for opportunistic ad-hoc networks. In Proceedings of the 14th ACM International Conference on Modeling, Analysis and Simulation of Wireless and Mobile Systems, Miami Beach, FL, USA, 31 October–4 November 2011; pp. 169–178. [Google Scholar]
  27. Picu, A.; Spyropoulos, T. Distributed stochastic optimization in opportunistic networks: the case of optimal relay selection. In Proceedings of the 5th ACM Workshop on Challenged Networks, Chicago, IL, USA, 20–24 September 2010; pp. 21–28. [Google Scholar]
  28. Amah, T.; Kamat, M.; Bakar, K.; Moreira, W.; Oliveira, A.; Batista, M. Spatial locality in pocket switched networks. In Proceedings of the 17th IEEE International Symposium on A World of Wireless, Mobile and Multimedia Networks, Coimbra, Portugal, 21–24 June 2016; pp. 1–6. [Google Scholar]
  29. Leguay, J.; Friedman, T.; Conan, V. Evaluating Mobility Pattern Space Routing for DTNS. In Proceedings of the 25th IEEE International Conference on Computer Communications, Barcelona, Spain, 23–29 April 2006; pp. 1–10. [Google Scholar]
  30. Mtibaa, A.; May, M.; Diot, C.; Ammar, M. Peoplerank: Social opportunistic forwarding. In Proceedings of the IEEE INFOCOM, San Diego, CA, USA, 14–19 March 2010; pp. 1–5. [Google Scholar]
  31. Hui, P.; Crowcroft, J.; Yoneki, E. Bubble Rap: Social-based forwarding in delay-tolerant networks. IEEE Trans. Mob. Comput. 2011, 10, 1576–1589. [Google Scholar] [CrossRef]
  32. Moreira, W.; Mendes, P.; Sargento, S. Opportunistic routing based on daily routines. In Proceedings of the IEEE International Symposium on a World of Wireless, Mobile and Multimedia Networks, San Francisco, CA, USA, 25–28 June 2012; pp. 1–6. [Google Scholar]
  33. Nguyen, H.; Giordano, S. Context information prediction for social-based routing in opportunistic networks. Ad Hoc Netw. 2012, 10, 1557–1569. [Google Scholar] [CrossRef]
  34. Grasic, S.; Davies, E.; Lindgren, A.; Doria, A. The evolution of a DTN routing protocol—Prophetv2. In Proceedings of the 6th ACM Workshop on Challenged Networks, Las Vegas, NV, USA, 19–23 September 2011; pp. 27–30. [Google Scholar]
  35. McNett, M.; Voelker, G. Access and mobility of wireless PDA users. ACM SIGMOBILE Mob. Comput. Commun. Rev. 2005, 9, 40–55. [Google Scholar] [CrossRef]
  36. Wang, S.; Liu, M.; Cheng, X.; Song, M. Routing in pocket switched networks. IEEE Wirel. Commun. 2012, 19, 67–73. [Google Scholar] [CrossRef]
  37. Hasan, S.; Schneider, C.; Ukkusuri, S.; González, M. Spatiotemporal patterns of urban human mobility. J. Stat. Phys. 2013, 151, 304–318. [Google Scholar] [CrossRef]
  38. Zhao, M.; Mason, L.; Wang, M. Empirical study on human mobility for mobile wireless networks. In Proceedings of the Military Communications Conference, San Diego, CA, USA, 16–19 November 2008; pp. 1–7. [Google Scholar]
  39. Zhu, K.; Li, W.; Fu, X. SMART: A Social and Mobile-Aware Routing Strategy for Disruption-Tolerant Networks. IEEE Trans. 2014, 63, 3423–3434. [Google Scholar] [CrossRef]
  40. Yu, C.; Bao, C.; Jin, H. Hierarchical Geographical Tags Based Routing Scheme in Delay/Disruption Tolerant Mobile Ad Hoc Networks. In Proceedings of the 1st International Conference on Human Centered Computing, Phnom Penh, Cambodia, 27–29 November 2014; Zu, Q., Hu, B., Gu, N., Seng, S., Eds.; Springer International Publishing: Cham, Switzerland, 2015; pp. 352–364. [Google Scholar]
  41. Spyropoulos, T.; Psounis, K.; Raghavendra, C. Single-copy routing in intermittently connected mobile networks. In Proceedings of the 1st Annual IEEE Communications Society Conference on Sensor and Ad Hoc Communications and Networks, Santa Clara, CA, USA, 4–7 October 2004; pp. 235–244. [Google Scholar]
  42. Jain, S.; Fall, K.; Patra, R. Routing in a delay tolerant network. In Proceedings of the 2004 conference on Applications, Technologies, Architectures, and Protocols for Computer Communications, Portland, OR, USA, 30 August–3 September 2004; pp. 145–158. [Google Scholar]
  43. Spyropoulos, T.; Psounis, K.; Raghavendra, C. Spray and focus: Efficient mobility-assisted routing for heterogeneous and correlated mobility. In Proceedings of the 5th Annual IEEE International Conference on Pervasive Computing and Communications Workshops, White Plains, NY, USA, 19–23 March 2007; pp. 79–85. [Google Scholar]
  44. Spyropoulos, T.; Psounis, K.; Raghavendra, C. Spray and wait: An efficient routing scheme for intermittently connected mobile networks. In Proceedings of the 2005 ACM SIGCOMM Workshop on Delay-Tolerant Networking, Philadelphia, PA, USA, 26 August 2005; pp. 252–259. [Google Scholar]
  45. Spyropoulos, T.; Turletti, T.; Obraczka, K. Routing in Delay Tolerant Networks Comprising Heterogeneous Node Populations. IEEE Trans. Mob. Comput. 2009, 8, 1132–1147. [Google Scholar] [CrossRef]
  46. Wang, E.; Yang, Y.; Chen, X.; Shen, C.; Han, L. The Improved Algorithm of Spray and Wait Routing Protocol in Delay Tolerant Network. Int. J. Adv. Comput. Technol. 2013, 5, 238–245. [Google Scholar]
  47. Sadat, N.; Tasnim, M. A Neighborhood Contact History Based Spraying Heuristic for Delay Tolerant Networks. In Proceedings of the 3rd International Conference on Informatics, Electronics & Vision, Dhaka, Bangladesh, 23–24 May 2014. [Google Scholar]
  48. Luo, G.; Zhang, J.; Huang, H.; Qin, K.; Sun, H. Exploiting intercontact time for routing in delay tolerant networks. Eur. Trans. Telecommun. 2013, 24, 589–599. [Google Scholar] [CrossRef]
  49. Lo, S.; Tsai, C.; Lai, Y. Quota-control routing in delay-tolerant networks. Ad Hoc Netw. 2014, 25, 393–405. [Google Scholar] [CrossRef]
  50. Niu, J.; Liu, M.; Liu, Y.; Shu, L.; Wu, D. A venues-aware message routing scheme for delay-tolerant networks. Wirel. Commun. Mob. Comput. 2015, 15, 1695–1710. [Google Scholar] [CrossRef]
  51. Huang, H.; Xiong, Z.; Wang, D. A Routing Strategy Based on Duplicates Adaptive Allocation and Rapid Spray in DTN. J. Comput. Inf. Syst. 2015, 11, 5681–5688. [Google Scholar]
  52. Iranmanesh, S.; Raad, R.; Chin, K. A Novel Destination-Based Routing Protocol (DBRP) in DTNs. In Proceedings of the 2012 International Symposium on Communications and Information Technologies, Gold Coast, QLD, Australia, 2–5 October 2012; pp. 325–330. [Google Scholar]
  53. Deok, S.; Won, Y. An Improved PRoPHET Routing Protocol in Delay Tolerant Network. Sci. World J. 2015. [Google Scholar] [CrossRef]
  54. Zhang, X.; Neglia, G.; Kurose, J.; Towsley, D. Performance Modeling of Epidemic Routing. Comput. Netw. Int. J. Comput. Telecommun. Netw. 2007, 51, 2867–2891. [Google Scholar] [CrossRef]
  55. Shin, K.; Kim, K.; Kim, S. Traffic management strategy for delay-tolerant networks. J. Netw. Comput. Appl. 2012, 6, 1762–1770. [Google Scholar] [CrossRef]
  56. Batabyal, S.; Bhaumik, P. Estimators for global information in mobile opportunistic network. Adv. Netw. Telecommun. Syst. 2013. [Google Scholar] [CrossRef]
  57. Iqbal, S.; Chowdhury, A. Adaptation of spray phase to improve the binary spray and Wait routing in Delay Tolerant Networks. Comput. Inf. Technol. 2012. [Google Scholar] [CrossRef]
  58. Miao, J.; Hasan, O.; Ben, S.; Brunie, L. A self-regulating protocol for efficient routing in mobile delay tolerant networks. Digit. Ecosyst. Technol. 2012. [Google Scholar] [CrossRef]
  59. You, L.; Li, J.; Wei, C.; Dai, C.; Xu, J.; Hu, L. A Hop Count Based Heuristic Routing Protocol for Mobile Delay Tolerant Networks. Sci. World J. 2014. [Google Scholar] [CrossRef] [PubMed]
  60. De Rango, F.; Amelio, S.; Fazio, P. Epidemic strategies in delay tolerant networks from an energetic point of view: Main issues and performance evaluation. J. Netw. 2015, 10, 4–14. [Google Scholar] [CrossRef]
  61. Keränen, A.; Ott, J.; Kärkkäinen, T. The ONE simulator for DTN protocol evaluation. In Proceedings of the 2nd International Conference on Simulation Tools and Techniques, Rome, Italy, 2–6 March 2009. [Google Scholar]
  62. Ekman, F.; Keränen, A.; Karvo, J.; Ott, J. Working Day Movement Model. In Proceedings of the 1st ACM SIGMOBILE workshop on Mobility models, Hong Kong, China, 26 May 2008; pp. 33–40. [Google Scholar]
  63. Silva, D.; Costa, A.; Macedo, J. Energy Impact Analysis on DTN Routing Protocols. In Proceedings of the 4th Extreme Conference on Communication, Zürich, Switzerland, 10–14 March 2012. [Google Scholar]
  64. Moreira, W.; Mendes, P.; Sargento, S. Social-aware opportunistic routing protocol based on user’s interactions and interests. Netw. Int. Archit. 2014. [Google Scholar] [CrossRef]
  65. Rajaei, A.; Chalmers, D.; Wakeman, I.; Parisis, G. GSAF: Efficient and flexible geocasting for opportunistic networks. In Proceedings of the 17th International Symposium on A World of Wireless, Mobile and Multimedia Networks, Coimbra, Portugal, 21–24 June 2016; pp. 1–9. [Google Scholar]
  66. Spyropoulos, T.; Psounis, K.; Raghavendra, C. Efficient Routing in Intermittently Connected Mobile Networks: The Multiple-copy Case. IEEE/ACM Trans. Netw. 2008, 16, 77–90. [Google Scholar] [CrossRef]
  67. Bjurefors, F.; Gunningberg, P.; Rohner, C.; Tavakoli, S. Congestion avoidance in a data-centric opportunistic network. In Proceedings of the ACM SIGCOMM workshop on Information-centric Networking, Toronto, ON, Canada, 19 August 2011; pp. 32–37. [Google Scholar]
  68. Soelistijanto, B.; Howarth, M. Transfer Reliability and Congestion Control Strategies in Opportunistic Networks: A Survey. IEEE Commun. Surv. Tutor. 2014, 16, 538–555. [Google Scholar] [CrossRef]
  69. Ren, Z.; Liu, W.; Zhou, X.; Fang, J.; Chen, Q. Summary-Vector-Based Effective and Fast Immunization for Epidemic-Based Routing in Opportunistic Networks. IEEE Commun. Lett. 2014, 18, 1183–1186. [Google Scholar] [CrossRef]
  70. Huang, J.; Chen, Y.; Tung, L.; Chen, L. Using known vectors to improve data dissemination in opportunistic networks. Int. J. Ad Hoc Ubiquitous Comput. 2014, 17, 59–69. [Google Scholar] [CrossRef]
  71. Moreira, W.; Mendes, P. Social-Aware Opportunistic Routing: The New Trend. In Routing in Opportunistic Networks; Woungang, I., Dhurandher, S., Anpalagan, A., Vasilakos, A., Eds.; Springer: New York, NY, USA, 2013; pp. 27–68. [Google Scholar]
  72. Spyropoulos, T.; Psounis, K.; Raghavendra, C. Multiple-Copy Routing in Intermittently Connected Mobile Networks. Available online: https://pdfs.semanticscholar.org/c265/5ff465df4ec85dc4bf5a1608a6d82fe919fb.pdf (accessed on 7 November 2017).
  73. Amah, T.; Kamat, M.; Abu Bakar, K.; Abd Rahman, S.; Mohammed, M.; Abali, A.; Moreira, W.; Oliveira, A. Collecting Sensed Data with Opportunistic Networks: The Case of Contact Information Overhead. Information 2017, 8, 108. [Google Scholar] [CrossRef]
  74. Cho, E.; Myers, S.; Leskovec, J. Friendship and Mobility: User Movement in Location Based Social Networks. In Proceedings of the 17th ACM SIGKDD International Conference on Knowledge Discovery and Data Mining, San Diego, CA, USA, 21–24 August 2011; pp. 1082–1090. [Google Scholar]
  75. Henderson, T.; Kotz, D.; Abyzov, I. The changing usage of a mature campus-wide wireless network. Comput. Netw. 2008, 52, 2690–2712. [Google Scholar] [CrossRef]
  76. Nunes, I.; Celes, C.; Silva, M.; Vaz de Melo, P.; Loureiro, A. GRM: Group Regularity Mobility Model. In Proceedings of the 20th ACM International Conference on Modeling, Analysis and Simulation of Wireless and Mobile Systems, Miami Beach, FL, USA, 21–25 November 2017. [Google Scholar]
Figure 1. A sample opportunistic network (OppNet) consisting of 11 nodes.
Information 08 00143 g001
Figure 2. Taxonomy of message replication techniques in OppNets.
Information 08 00143 g002
Figure 3. Movement scenarios used for investigating the impact of increasing node population and spatial locality on the performance of OppNet replication techniques (partitioned by a grid, the small, medium and large scenario consists of 1 region, 4 regions and 16 regions, which also corresponds to low, medium and high degree of spatial locality, respectively).
Information 08 00143 g003
Figure 4. Results when PRoPHET utilizes single-copy replication (SC) and fixed-quota replication (FQ) under the large scenario: (a) without external messages (b) in the presence of external messages, i.e., messages generated by other applications and routed using PRoPHET without a replication technique (for external messages, a randomly selected source node generates a message between 10 KB and 100 KB to a randomly selected destination node at every 1 to 5 min interval).
Information 08 00143 g004
Figure 5. Transmission overhead under different node populations in the small scenario with PRoPHET (using no replication technique).
Information 08 00143 g005
Figure 6. PRoPHET’s throughput (in %) without summary vector exchange and with summary vector exchange in the small scenario.
Information 08 00143 g006
Figure 7. The number of messages replicated per hour with n-Epidemic (n = 3) under the (a) small (b) medium and (c) large scenario.
Information 08 00143 g007
Figure 8. Average difference between the sending nodes’ and receiving nodes’ forwarding utilities for messages traversing 0, 1, 2 and 3 regions, under (a) low (b) medium and (c) high degree of spatial locality, with PRoPHET using fixed-quota replication (L = 8).
Information 08 00143 g008aInformation 08 00143 g008b
Figure 9. Average hop count and percentage of remaining TTL of delivered messages traversing 0, 1, 2 and 3 regions under high locality with PRoPHET.
Information 08 00143 g009
Figure 10. Percentage of successful delivery for messages traversing 0, 1, 2 and 3 regions under high degree of spatial locality with SnF (L = 8).
Information 08 00143 g010
Figure 11. Functional block diagram of Locality Aware Replication (LARep).
Information 08 00143 g011
Figure 12. Structure of the location table.
Information 08 00143 g012
Figure 13. Map of a fictional city.
Information 08 00143 g013
Figure 14. The Skudai simulation area (map data provided by OpenStreetMap, 2015).
Information 08 00143 g014
Figure 15. Transmission overhead in the Skudai scenario.
Information 08 00143 g015
Figure 16. Average energy consumption (in Joules) in the Skudai scenario.
Information 08 00143 g016
Figure 17. Throughput (in %) in the Skudai scenario.
Information 08 00143 g017
Figure 18. Average delivery delay (in hours) in the Skudai scenario.
Information 08 00143 g018
Figure 19. Number of failed transmissions (aka. aborted messages in ONE simulator) in the Skudai scenario.
Information 08 00143 g019
Figure 20. Multiple deliveries of the same message and its impact on average delivery delay.
Information 08 00143 g020
Figure 21. Throughput and average delivery delay under increasing data traffic in the Helsinki scenario.
Information 08 00143 g021
Figure 22. Transmission overhead and average energy consumption under increasing data traffic in the Helsinki scenario.
Information 08 00143 g022
Table 1. Simulation parameters for the small, medium and large scenarios.
ParameterValue(s)
Total simulation time (days)5
Warm-up period (days)1
Cool-down period (days)1
Wireless communication interfaceBluetooth
Transmission range (m)10
Transmission rate (MBps)2
Buffer size (MB)10
Message size (KB)10 to 15
Message TTL (days)1
Number of scenarios3
Simulation area (Km2)4.5 × 3.4, 9 × 6.8 & 18 × 13.6
Number of nodes19, 76 & 304
Ave. message generation rate/node1 message every 10 to 15 min
Battery capacity (Joules)4800
Receive/transmit energy (mW/s)0.08
Table 2. Replication approaches for reducing transmission overhead and their main features.
Replication ApproachAcceptable Performance Does Not RequireSuitable under IncreasingScenario Adaptability
(Frequent) Metadata TransmissionGlobal KnowledgeDegrees of Spatial LocalityNode Population
Gossiping [54]××
Timer threshold [54]××
VACCINE [54]×××
Shin et al. [55]××××
Iqbal & Chowdhury [57]××
Miao et al. [58]×××
Batabyal & Bhaumik [56]×××
Lo et al. [49]××
You et al. [59]×××
Deok & Won [53]×××
Huang et al. [51]×
De Rango et al. [60]×××
Our proposal (LARep)
Table 3. Recording location information in the location table with PoiTrace.
Time SlotLocationGPS CoordinatesLocation Reference
Δ t 1 a ( x a , y a ) x a , y a
Δ t 2 b ( x b , y b ) x a , y a
Δ t 3 c ( x c , y c ) x a , y a
Δ t 4 d ( x d , y d ) x d , y d
Δ t 5 e ( x e , y e ) x e , y e
Δ t 6 f ( x f , y f ) x e , y e
Table 4. Simulation parameters for the performance evaluation.
ParameterValue
Total simulation time (days)5
Warm-up period (days)1
Cool-down period (days)1
Wireless communication interfaceBluetooth
Transmission range (m)10
Transmission rate (MBps)2
Buffer size (MB)10
Message size (KB)10 to 15
Message TTL (days)1
Number of nodes1349
Ave. message generation rate/node1 message/h
Battery capacity (Joules)4800
Receive/transmit energy (mW/s)0.08

