Article

Evaluating an Augmented Reality Educational Application for Earthquake Preparedness Among International Visitors and Newly Arrived Foreign Residents in Japan †

by
Gowit Chanaken
1,* and
Osamu Uchida
2,*
1
Graduate School of Science and Technology, Tokai University, Hiratsuka 259-1292, Japan
2
Tokai University Research and Information Center, Hiratsuka 259-1292, Japan
*
Authors to whom correspondence should be addressed.
This article is a revised and expanded version of a paper entitled “Design and Implementation of an Augmented Reality System for Raising Disaster Awareness Among Thai Tourists in Japan”, which was presented at the 2024 5th International Conference on Computational Science & Information Management (ICoCSIM), Melbourne, Australia, 28–29 October 2024.
Information 2026, 17(8), 716; https://doi.org/10.3390/info17080716
Submission received: 18 June 2026 / Revised: 15 July 2026 / Accepted: 20 July 2026 / Published: 23 July 2026
(This article belongs to the Collection Augmented Reality Technologies, Systems and Applications)

Abstract

Japan is one of the most earthquake-prone countries in the world. The 2011 Great East Japan Earthquake alone caused nearly 20,000 deaths and missing persons. International visitors and newly arrived foreign residents in Japan may face heightened risk during earthquakes, as limited prior experience with earthquakes and limited Japanese-language proficiency can restrict access to essential safety information. In addition, because disaster-preparedness education is often insufficient in countries with low disaster risk, they may be especially vulnerable in emergencies. This study designed, developed, and evaluated an augmented reality (AR) application intended to provide earthquake-preparedness and survival guidance in the Japanese context. The application was evaluated using a pre-test/post-test design with 40 participants from 10 countries, who completed a 14-item multiple-choice disaster-preparedness knowledge test and a user satisfaction survey. Participants’ knowledge scores improved significantly from the pre-test to the post-test (t(39) = 8.20, p < 0.001), with a large effect size (Cohen’s d = 1.30), and participants reported high satisfaction (4.55/5, SD = 0.61). These results suggest the potential of AR as an accessible educational approach for enhancing earthquake-preparedness knowledge among international visitors and newly arrived foreign residents in earthquake-prone regions.

1. Introduction

Natural disasters frequently affect Japan, with earthquakes being among the most common and destructive hazards, often resulting in substantial loss of life and severe infrastructure damage. Over the years, Japan has established effective disaster preparedness strategies through systematic education, routine emergency drills, and widespread access to technologies that support rapid information dissemination and timely response [1,2]. However, international visitors to Japan do not necessarily possess the same level of preparedness or familiarity with earthquake-related emergency procedures. The number of international visitors to Japan reached approximately 42.68 million in 2025, an increase of 15.8% over the previous year and the highest figure on record [3]. The number of foreign residents in Japan also reached approximately 4.13 million at the end of 2025, exceeding four million for the first time [4]. As these numbers continue to grow, addressing this gap has become increasingly important, highlighting the need for accessible and effective approaches to provide disaster-related education for visitors and newly arrived foreign residents during their stay or early period of residence in Japan.
Many international visitors to Japan come from regions where earthquakes occur infrequently, such as Hong Kong, Thailand, Singapore, Australia, and many European countries. In addition, a survey of foreign residents in the Tokyo Metropolitan Area reported that more than 80% rarely take part in disaster drills or other organized disaster preparedness activities [5]. As a result, many visitors and newly arrived foreign residents have limited awareness and practical knowledge for responding to earthquake situations. Language barriers further compound these challenges. Because a large portion of disaster-related information in Japan is distributed mainly in Japanese, it is less accessible to non-Japanese speakers. These limitations may prevent international visitors from obtaining or fully understanding essential emergency guidance during critical situations.
To address these challenges, this study investigates the potential of augmented reality (AR) technology as an innovative educational approach for enhancing knowledge related to earthquake preparedness among international visitors to Japan. AR integrates interactive visual content with contextual information, allowing users to understand complex concepts in a more intuitive, engaging, and memorable manner [6]. These characteristics make AR particularly suitable for communicating disaster preparedness knowledge to users with diverse backgrounds and varying levels of prior experience. In addition, the proposed AR application delivers interactive educational content directly to users’ personal devices, enabling flexible access to disaster preparedness education across different locations and travel contexts.
Therefore, the primary objective of this study is to design, develop, and evaluate an AR application intended to educate international visitors and newly arrived foreign residents in Japan about earthquake preparedness and survival strategies relevant to Japan. The application aims to present essential safety information in a user-friendly and engaging format that supports effective knowledge acquisition. To evaluate its effectiveness, this study examines changes in participants’ disaster-preparedness knowledge before and after using the application and collects user feedback regarding satisfaction, usability, and overall system effectiveness. The findings are expected to demonstrate the potential of AR as an accessible educational approach for enhancing knowledge related to earthquake preparedness among international visitors and newly arrived foreign residents in earthquake-prone regions.
This study builds on our previous work, in which an AR-based disaster awareness application was designed and implemented for Thai tourists visiting Japan [7]. That earlier study focused primarily on identifying the needs of Thai tourists, designing the application interface and system architecture, and demonstrating the feasibility of AR-based disaster education for this specific user group. In contrast, the present study extends the scope of the previous work by evaluating a refined AR educational application with a broader group of international visitors and newly arrived foreign residents in Japan. The present study also adopts a more systematic evaluation design, including validated research instruments, a pre-test/post-test knowledge assessment, user satisfaction analysis, and effect size estimation.

2. Related Work

Numerous researchers have explored the application of augmented reality (AR) and virtual reality (VR) technologies in disaster preparedness and emergency response to improve accessibility, user engagement, and situational awareness. These technologies have demonstrated considerable potential in delivering immersive learning experiences and supporting more effective dissemination of disaster-related knowledge.
The educational use of AR is not limited to disaster preparedness. In education in general, the interactive characteristics of AR have been reported to support learning. Akçayır and Akçayır [8] reviewed 68 studies on the educational use of AR and found that the most frequently reported advantage was improved learning achievement. Garzón et al. [9] conducted a meta-analysis of 61 studies published between 2012 and 2018 and reported that AR has a positive effect on learning, and that visualization, interactivity, and increased interest are among the main benefits of AR. Ibáñez and Delgado-Kloos [10] reviewed the use of AR in science, technology, engineering, and mathematics (STEM) education and reported that AR applications improve learner engagement and performance, particularly for tasks that require the understanding of complex spatial information. These findings suggest that the interactivity of AR is a key factor in its educational effectiveness, and this characteristic has also been applied to disaster preparedness education.
Several studies have focused on the use of AR as an educational medium for disaster preparedness. For example, De León Aguilar et al. [11] proposed a mobile AR interface that simplifies disaster preparedness guidelines through interactive visual elements. Their study incorporated object detection and machine learning techniques to provide context-aware guidance and improve the accessibility of disaster education for diverse users. Similarly, Yamashita et al. [12] demonstrated the use of AR for earthquake preparedness by simulating falling furniture to help users identify safe areas in indoor environments, contributing to more practical disaster response training. Manimegalai et al. [13] extended AR to weather forecasting, enabling users to visualize real-time environmental information through interactive simulations, an approach relevant to early hazard awareness and disaster preparedness.
In addition to educational applications, AR has been adopted to support navigation and emergency response. Mantoro et al. [14] integrated AR with pathfinding algorithms such as A* and Dijkstra to optimize evacuation routes during emergency situations and provide real-time navigation support. Mannuru et al. [15] developed an AR navigation system that overlays route guidance onto real-world environments to improve situational awareness and support safe decision-making. Likewise, Ahn and Han [16] introduced RescueMe, an AR-based indoor evacuation framework that utilizes personalized movement data to generate adaptive evacuation routes and improve user safety during emergencies.
AR and VR are closely related immersive technologies, and they are often discussed together in the context of the digital transformation of education. Papanastasiou et al. [17] reviewed the effects of both technologies on students in K-12 and higher education and reported that they support the development of skills required in the digital era. VR-based approaches have also shown effectiveness in disaster training and emergency management. Bhookan et al. [18] investigated serious VR games for disaster survival education by simulating earthquake scenarios, allowing users to repeatedly practice emergency responses in a controlled environment. Orji et al. [19] reviewed the application of AR and VR technologies in safety-related domains and highlighted their ability to improve training outcomes, user engagement, decision-making, and collaboration. Patel et al. [20] proposed immersive AR/VR simulations to enhance disaster response training. In addition, Romagnoli et al. [21] examined edge-supported VR environments and discussed how emerging digital infrastructures can improve responsiveness and user experience in immersive applications.
Although previous studies have demonstrated the effectiveness of AR and VR technologies in disaster training, evacuation support, and simulation-based learning, most existing approaches focus primarily on local residents, emergency responders, or controlled training environments. Limited attention has been given to delivering disaster preparedness education to international visitors through mobile platforms that support accessibility across language and cultural differences.
Our previous study addressed this research direction by designing and implementing an AR-based disaster awareness application for Thai tourists in Japan [7]. The study identified knowledge gaps among Thai tourists, incorporated their media preferences into the application design, and developed a prototype using Unity and Vuforia with marker-based AR interaction, multilingual presentation, 3D models, text, audio, and video content. However, that work focused mainly on the design, implementation, and feasibility of the system for Thai tourists. Further empirical evaluation with a broader international population and validated research instruments remained necessary.
Building on this prior work, the present study proposes and evaluates a refined mobile AR educational application designed to enhance knowledge related to earthquake preparedness among international visitors and newly arrived foreign residents in Japan. Unlike systems developed in prior studies that emphasize simulation or navigation, the proposed approach focuses on delivering accessible and interactive disaster preparedness education directly through personal mobile devices. This approach aims to support practical knowledge acquisition and broaden access to disaster education for highly mobile populations.

3. Materials and Methods

3.1. Development of the AR Educational Application

The AR educational application evaluated in this study was developed by refining and extending the prototype presented in our previous study [7]. The application was designed and developed by the first author under the supervision of the second author, and no external developers were involved. In the previous work, we designed and implemented an AR-based disaster awareness application for Thai tourists in Japan, using survey results to identify knowledge gaps and media preferences and to guide the design of the user interface, AR content, and marker-based interaction. Although the prototype was initially built for Thai tourists, an English version was also developed during that previous work in anticipation of broader future deployment. As a result, the application used in the present study provides educational content in both English and Thai, allowing participants to select the language version most suitable for them. The present study extends that prototype for a broader group of international visitors and newly arrived foreign residents in Japan and evaluates its educational effectiveness and user satisfaction through a structured empirical study. The development process was divided into several stages, each employing specific tools and techniques outlined below.

3.1.1. Model Creation

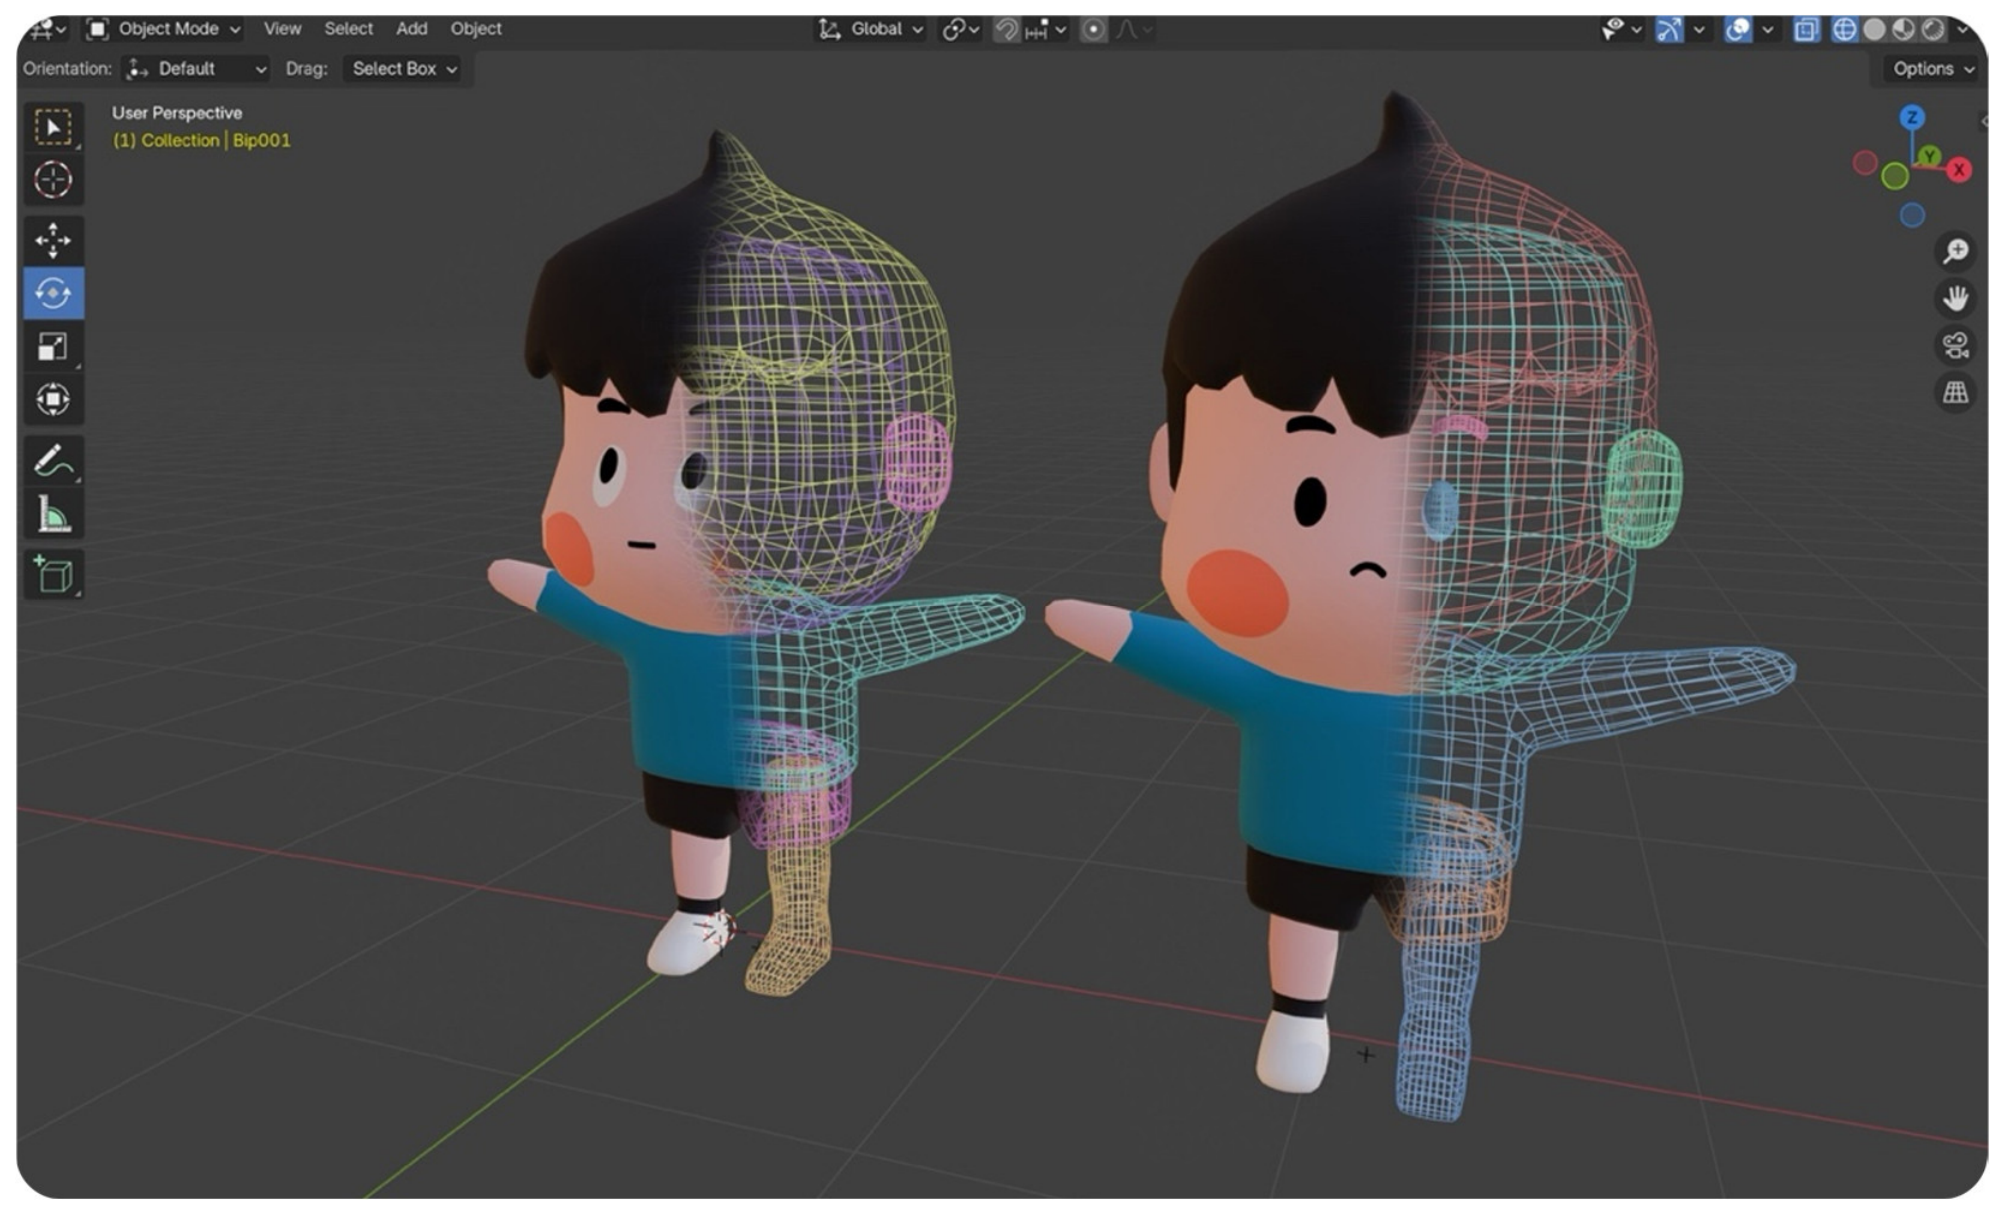
Blender, an open-source 3D modeling software, was utilized to design the main character, a virtual guide character who serves as the primary educational assistant within the application. The modeling process emphasized creating an appealing and approachable character to maximize user engagement. Rigging, which involves constructing the skeletal structure of the character, was applied to facilitate smooth and realistic animations. Blender’s comprehensive features enabled an efficient workflow for modeling and rigging, resulting in high-quality visual assets (Figure 1).

3.1.2. Animation Development

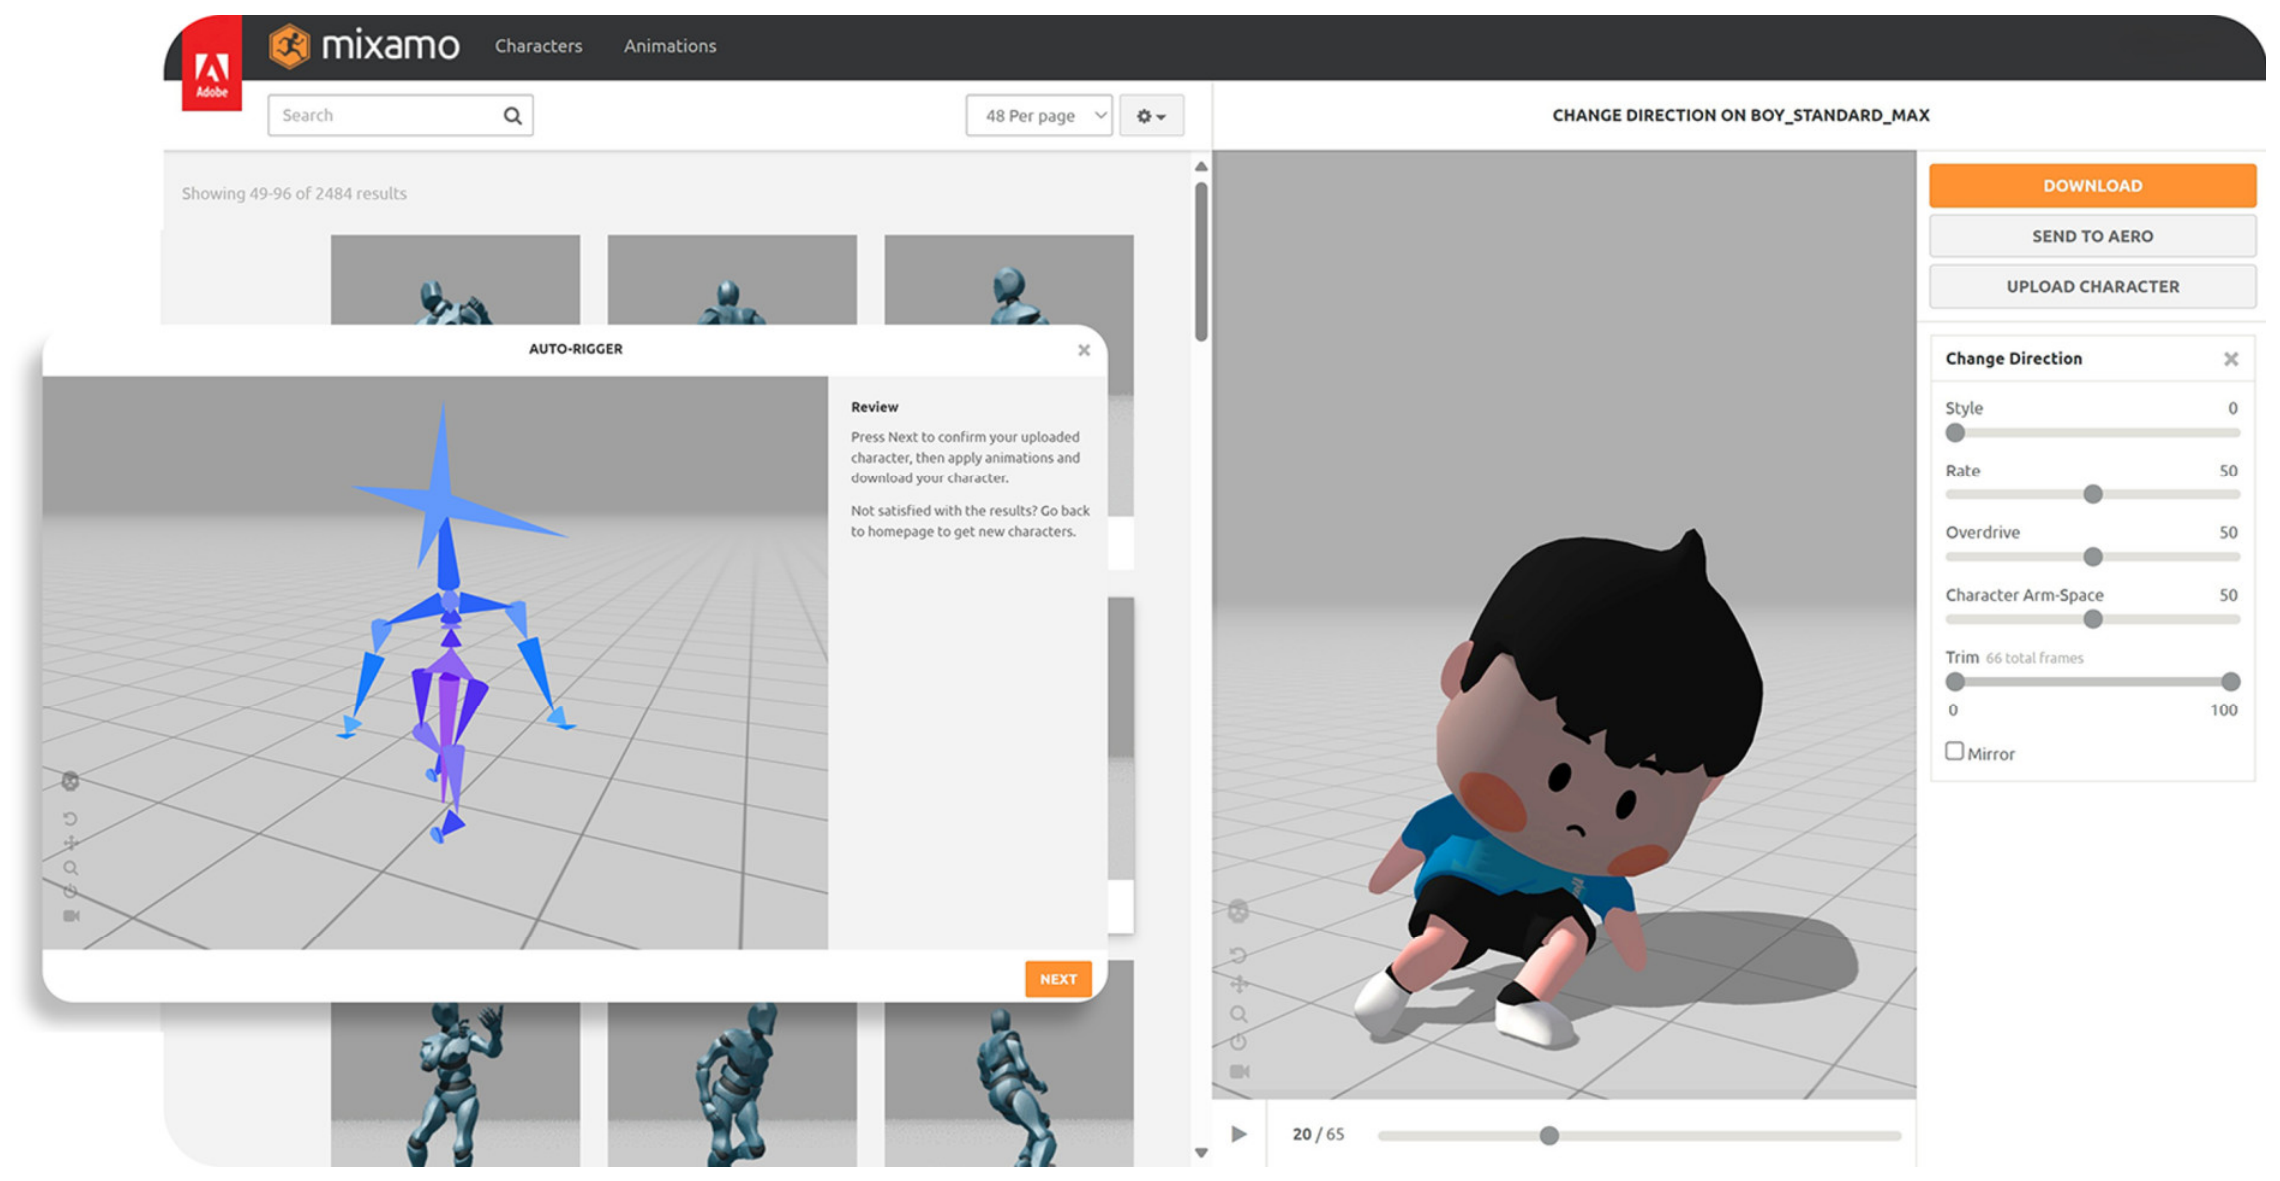
Animations were developed using Adobe Mixamo, an online platform that provides a library of pre-built animation sequences. The process began with uploading the character model to Mixamo, where automatic rigging adjustments were made to comply with the platform’s standards. Various animations—such as walking, running, and pointing—were selected and customized to align with the educational goals of the application. These animations were exported in FBX format to enable seamless integration with Unity (Figure 2). They were intended to improve user engagement and facilitate intuitive understanding of earthquake preparedness procedures.

3.1.3. Image Target Creation and AR Integration

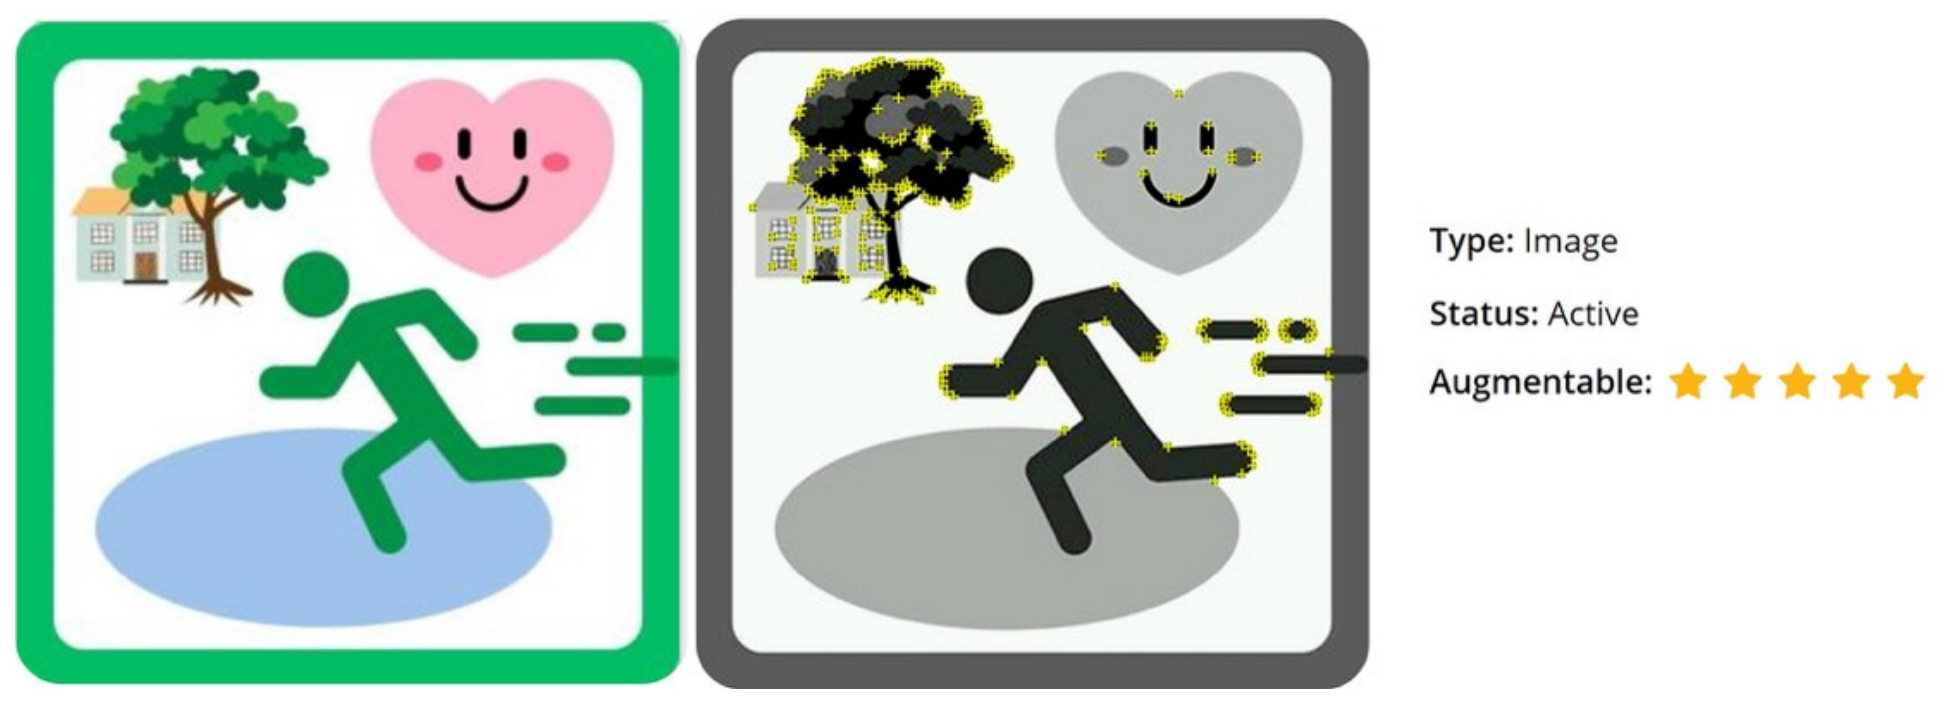
Vuforia (Version 11.4), a high-performance AR software development kit (SDK), was selected due to its robust capabilities and strong compatibility with Unity. Image Targets were used as anchors to display 3D models within the physical environment (Figure 3). These target images were carefully curated and optimized according to Vuforia’s image target evaluation criteria to improve recognition accuracy and tracking stability, ensuring fast and accurate recognition by mobile device cameras. Preliminary testing under different lighting conditions was conducted to confirm stable target recognition.

3.1.4. Unity Integration

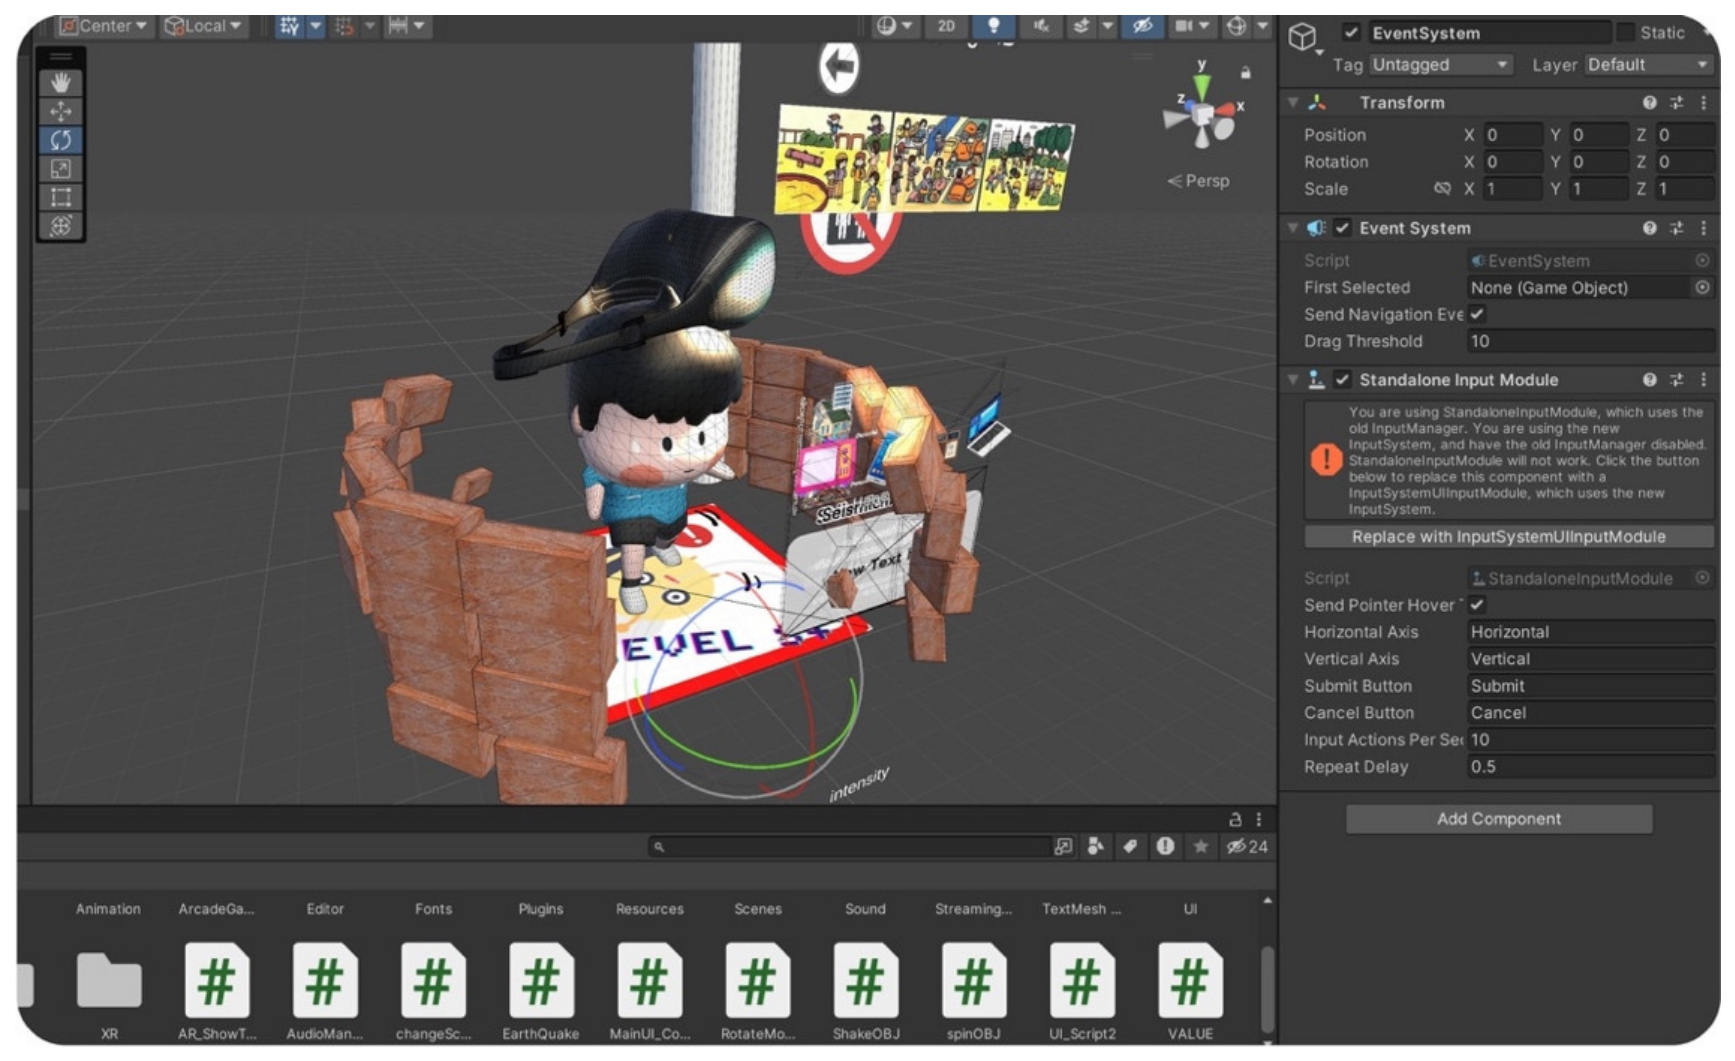
Unity, a widely used game development engine, integrated all components into a functional AR application. The 3D models, animations, and Image Targets were imported and configured within Unity (Figure 4) to respond to user interactions, such as pointing a smartphone camera at designated markers. C# scripts were developed to manage AR behaviors, including animation control, object visibility, and interaction logic. Unity’s multi-platform support enabled efficient development and optimization of the application for a wide range of mobile devices.

3.1.5. Application Testing

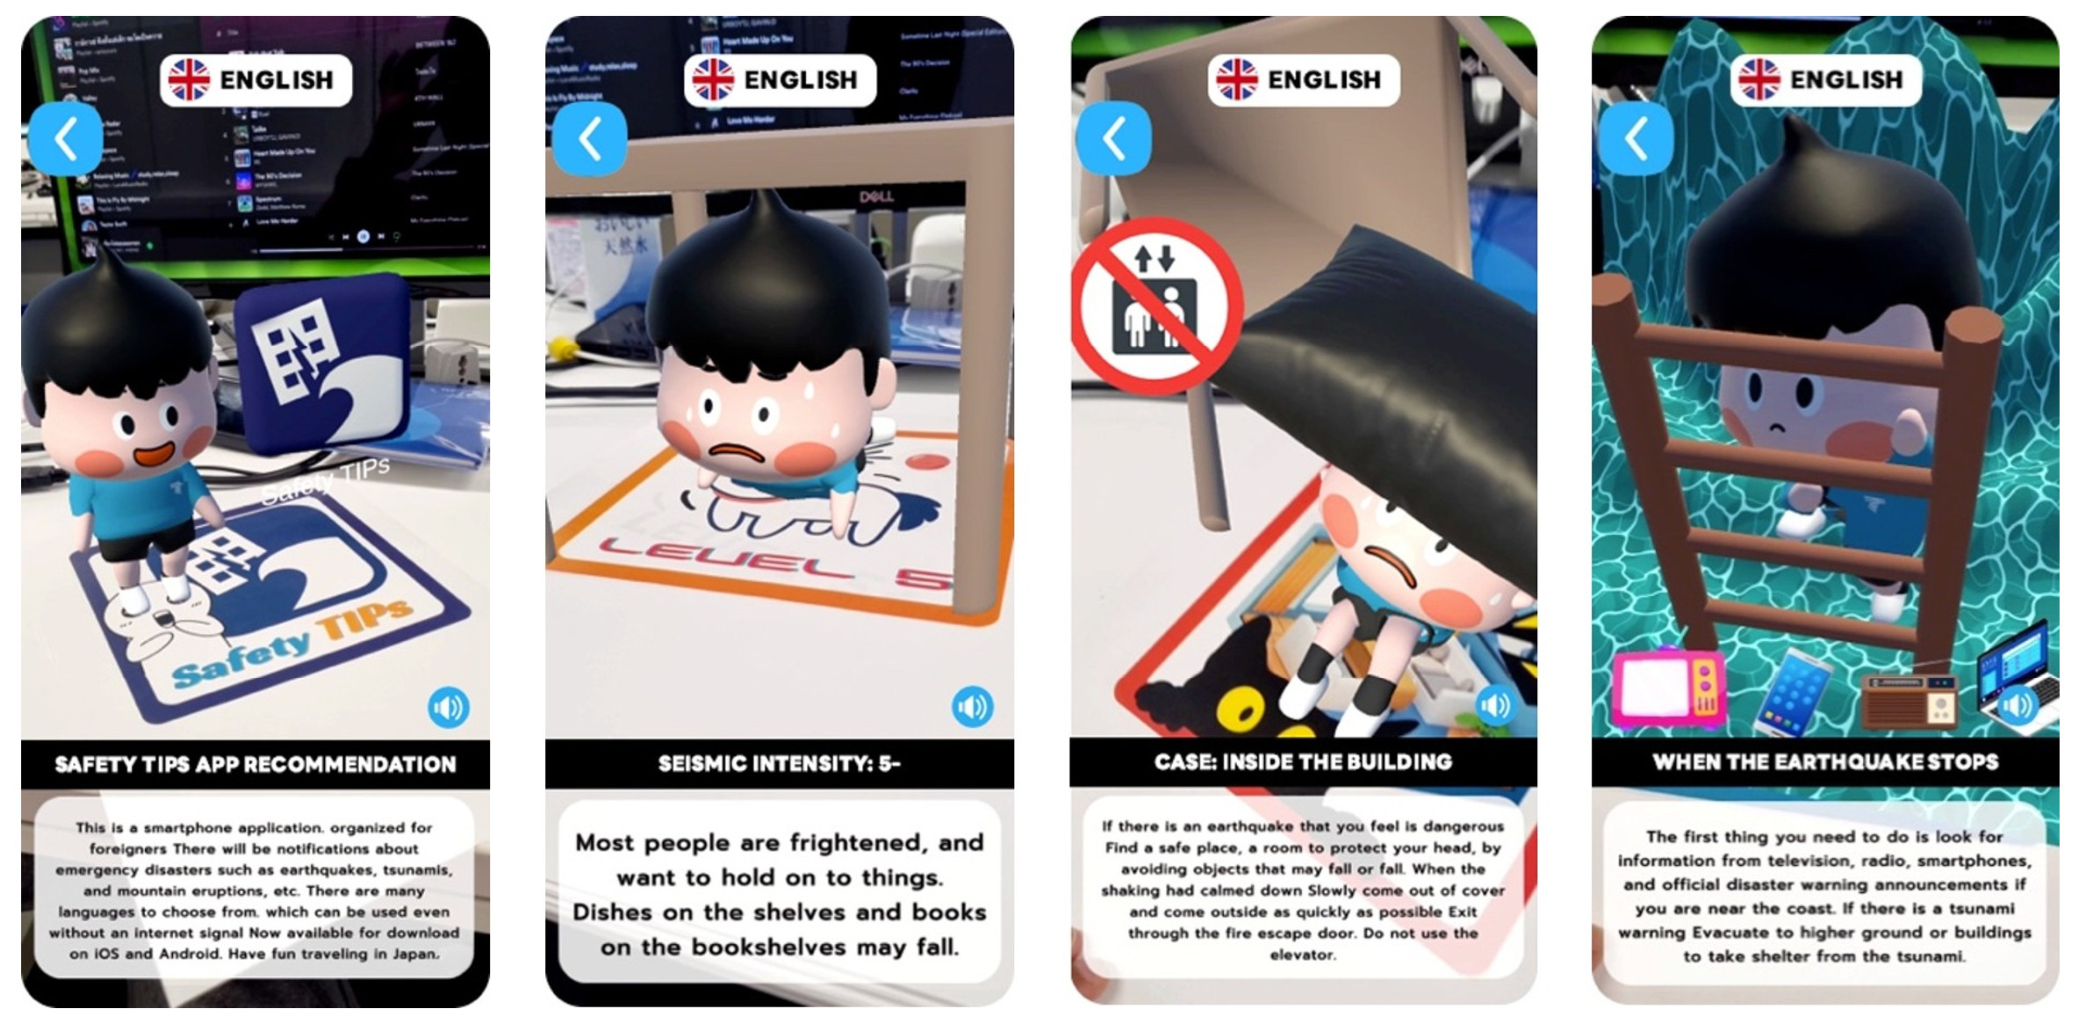
Following the completion of the application structure, iterative testing was performed to identify and resolve technical issues such as animation inconsistencies, recognition delays, and image processing errors. Feedback from initial user testing informed further refinements, ensuring that the final version of the application met its educational objectives, delivered a smooth user experience, and operated reliably across diverse environmental conditions. Initial user feedback was also collected to identify opportunities for improving multilingual accessibility, interaction design, and overall usability. An example of the application screen after development is shown in Figure 5.

3.2. Participants and Sampling

The target population for this study consisted of international visitors and newly arrived foreign residents in Japan, defined here as foreign nationals who had been residing in Japan for two years or less at the time of the study. This criterion was adopted to focus on individuals who were relatively new to Japan and therefore more likely to have limited prior experience with earthquakes and limited familiarity with Japanese disaster-response procedures, while still being accessible for in-person participation. Participants were recruited through online announcements and public recruitment conducted via Japanese online platforms. Individuals who were interested in participating registered through the provided system and selected a preferred study location based on their convenience.
Data collection was conducted at Tokai University across two campuses: the Shonan Campus in Hiratsuka, Kanagawa, and the Shinagawa Campus in Minato, Tokyo. A total of 40 participants from 10 countries were recruited using convenience sampling, a non-probability sampling method selected due to its practicality and accessibility for recruiting international visitors and newly arrived foreign residents [22]. The participant group included individuals from China (n = 14), Thailand (n = 13), Cameroon (n = 3), Myanmar (n = 3), South Korea (n = 2), the United States (n = 1), South Sudan (n = 1), Iceland (n = 1), Indonesia (n = 1), and Laos (n = 1).
No restrictions were imposed regarding gender to encourage participant diversity. Participants aged 18 years and older were eligible to participate in the study. The ages of the recruited participants ranged from 18 to 44 years. Convenience sampling was considered appropriate because the objective of this study was to evaluate the effectiveness and usability of the proposed AR-based educational application in a real-world setting rather than to estimate population-level characteristics.
Although convenience sampling enabled efficient participant recruitment under practical constraints, this approach may introduce selection bias and limit the generalizability of the findings [23]. Therefore, the results should be interpreted within the context of exploratory evaluation, and future studies may consider adopting probability-based sampling methods and larger participant groups to improve representativeness.

3.3. Research Instruments

The primary research instrument employed in this study was a structured questionnaire designed to collect demographic information, evaluate participants’ knowledge of earthquake preparedness, and assess user satisfaction with the proposed AR application. The questionnaire consisted of three parts to ensure systematic and consistent data collection throughout the experiment.

3.3.1. Part 1: Demographic Information

This part collected participants’ demographic information, including age, gender, and nationality. The collected data were used to characterize the participant population, as summarized in Section 3.2, and to support interpretation of the experimental findings.

3.3.2. Part 2: Knowledge Assessment (Pre-Test/Post-Test)

To evaluate the educational effectiveness of the AR application, a pre-test/post-test design was adopted to measure changes in participants’ earthquake preparedness knowledge before and after interacting with the application.
The knowledge assessment consisted of 14 multiple-choice questions developed to evaluate understanding of earthquake preparedness concepts and survival strategies relevant to Japan. The assessment instrument was validated by four Japanese disaster management experts using the Item–Objective Congruence (IOC) index [24] to ensure content validity.
Participants completed the pre-test before using the application to establish baseline knowledge. After interacting with the AR application, participants completed the same questionnaire as a post-test to measure knowledge improvement resulting from the educational intervention.
This design enabled a direct comparison between knowledge levels before and after the intervention and supported the evaluation of the application’s educational effectiveness [25].

3.3.3. Part 3: User Satisfaction and Feedback Survey

User satisfaction with the AR application was evaluated using a structured questionnaire based on a five-point Likert scale [26]. Participants rated their experience across five satisfaction levels ranging from 1 (Very Dissatisfied) to 5 (Very Satisfied), presented in Table 1.
The survey consisted of 14 evaluation items designed to assess aspects including usability, clarity of educational content, engagement, accessibility, and overall user experience. Participants were also provided with an optional open-ended section to submit comments and suggestions for future improvement.
Mean satisfaction scores were interpreted using five equal-width intervals on the five-point scale: 1.00–1.80 = Very Dissatisfied, 1.81–2.60 = Dissatisfied, 2.61–3.40 = Neutral, 3.41–4.20 = Satisfied, and 4.21–5.00 = Very Satisfied.
The combination of quantitative and qualitative feedback enabled comprehensive evaluation of both the educational effectiveness and user experience of the proposed AR application.

3.4. Design and Validation of Research Instruments

3.4.1. Content Validity Assessment

To ensure that the research instruments accurately reflected the objectives of this study, content validity was evaluated by a panel of four subject matter experts. The Item–Objective Congruence (IOC) index [24] was used to assess the degree of agreement between each questionnaire item and the intended research objectives. The evaluation criteria are presented in Table 2.
The IOC index was calculated using the following formula,
IOC = i = 1 N R i N ,
where N is the number of experts and R i is the score given by the expert i (−1 = not congruent, 0 = uncertain, 1 = clearly congruent).
Following previous recommendations [24], items with IOC values greater than or equal to 0.50 were considered acceptable for use in the study.

3.4.2. Content Validity Results

  • Part 1: Demographic Information. This part contained three questions used to collect participant demographic information. All items achieved an IOC value of 1.00, indicating excellent content validity and requiring no revision.
  • Part 2: Knowledge Assessment. Initially, this part contained 15 multiple-choice questions intended to assess earthquake preparedness knowledge. During expert evaluation, some items were identified as redundant and did not satisfy the predefined acceptance criteria. Based on expert recommendations, one item was removed, resulting in a final set of 14 questions. All remaining items achieved an IOC value of 1.00, demonstrating excellent alignment with the study objectives.
  • Part 3: User Satisfaction Survey. This part consisted of 14 items designed to evaluate user satisfaction with the AR application, including usability, content clarity, engagement, and overall experience. All items achieved an IOC value of 1.00, indicating excellent content validity. Therefore, no modifications were required.

3.5. Experimental Procedure and Data Collection

Experimental sessions were conducted with the 40 participants described in Section 3.2 at the Shonan and Shinagawa campuses of Tokai University. Data collection was conducted 13–28 May 2026, after approval had been obtained from the Institutional Ethics Committee of Tokai University.
Before participation, all individuals received an explanation of the study objectives, experimental procedures, and data handling policies. Participants were required to read and sign an informed consent form prior to participation.

3.5.1. Experimental Procedure

The experiment consisted of four sequential stages designed to evaluate the educational effectiveness of the AR application.
  • Step 1: Demographic Survey and Pre-Test. Participants first completed a demographic questionnaire that collected information including age, gender, and nationality. Subsequently, participants completed a pre-test consisting of 14 multiple-choice questions to assess their baseline knowledge of earthquake preparedness and survival strategies relevant to Japan.
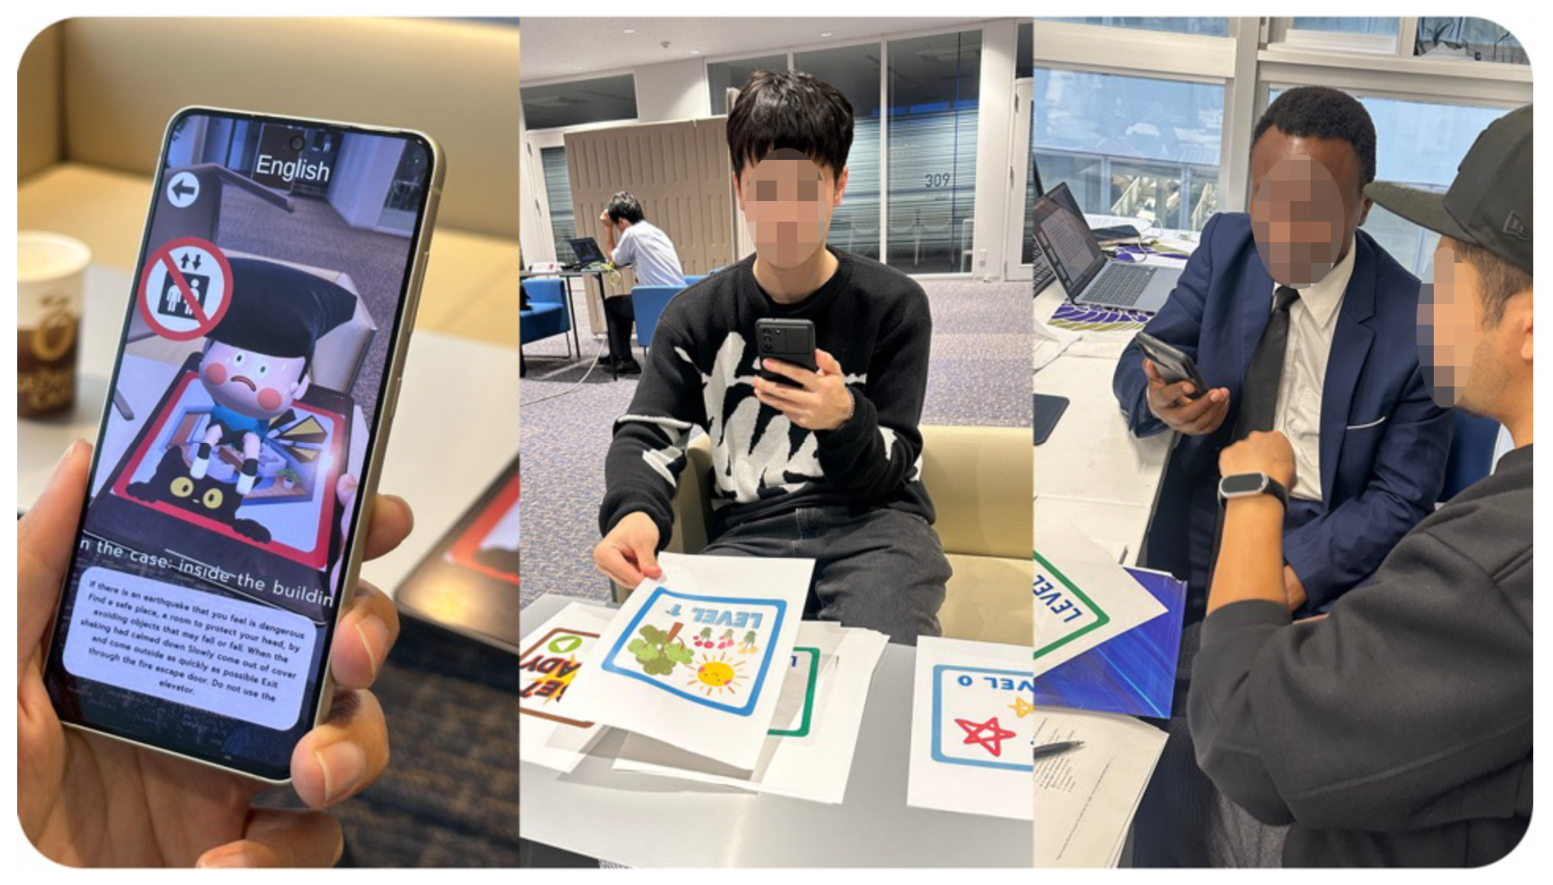
  • Step 2: Interaction with the AR Application. After completing the pre-test, participants used the AR application developed in this study. The session was facilitated by the first author. Before using the application, participants received standardized instructions regarding the purpose of the application and its basic operation. They then accessed interactive educational content related to earthquake preparedness, including disaster awareness information and survival guidance. Participants were asked to complete the learning activities presented in the application in a predefined order. The session lasted approximately 10–15 min. The facilitator provided technical assistance only when necessary and did not provide explanations or hints related to the knowledge-test items. This procedure supported a flexible and interactive learning experience (Figure 6).
  • Step 3: Post-Test. Following completion of the AR learning session, participants completed the same 14-item questionnaire as a post-test to measure changes in knowledge after interacting with the application.
  • Step 4: Satisfaction Survey and Feedback Collection. Participants completed a satisfaction questionnaire consisting of 14 items based on a five-point Likert scale. The questionnaire evaluated aspects including usability, content clarity, engagement, accessibility, and overall user experience. Participants were also given the opportunity to provide optional qualitative comments and suggestions for future improvements to the application.

3.5.2. Completion and Participant Compensation

Upon completing all study procedures, participants received a compensation voucher valued at 2000 Japanese yen as appreciation for their participation. No participants withdrew from the study during the data collection process. Participants were additionally asked for permission regarding photography for possible use in academic presentations and research documentation.
This structured procedure ensured consistent data collection while maintaining participant understanding, comfort, and voluntary participation throughout the study.

3.6. Data Analysis

The data collected in this study were analyzed using both descriptive and inferential statistical methods to evaluate participant characteristics, educational outcomes, and user satisfaction.

3.6.1. Descriptive Statistics

Descriptive statistics were used to summarize demographic characteristics and satisfaction survey responses. Measures including frequency, percentage, mean, and standard deviation were calculated to provide an overview of participant profiles and overall satisfaction with the AR application [27].

3.6.2. Knowledge Assessment Analysis (Pre-Test and Post-Test Comparison)

To evaluate the educational effectiveness of the AR application, a paired sample t-test was conducted to compare participants’ knowledge scores before and after using the application.
The paired sample t-test evaluates whether the mean difference between two related measurements is statistically significant and is calculated using the following equation,
t = d ¯ S d n ,
where d ¯ is the mean difference between pre-test and post-test scores, S d is the standard deviation of the differences, and n is the number of participants. A significance level of 0.05 was adopted for statistical testing [27].

3.6.3. Effect Size Analysis

To determine the magnitude of knowledge improvement following the intervention, effect size was calculated using Cohen’s d for paired samples. The effect size was calculated using
d = d ¯ S d .
Effect sizes were interpreted according to conventional criteria [28]:
d 0.20 : Small effect
d 0.50 : Medium effect
d 0.80 : Large effect
This analysis complements statistical significance testing by quantifying the practical impact of the educational intervention.

4. Results

4.1. Pre-Test and Post-Test Analysis

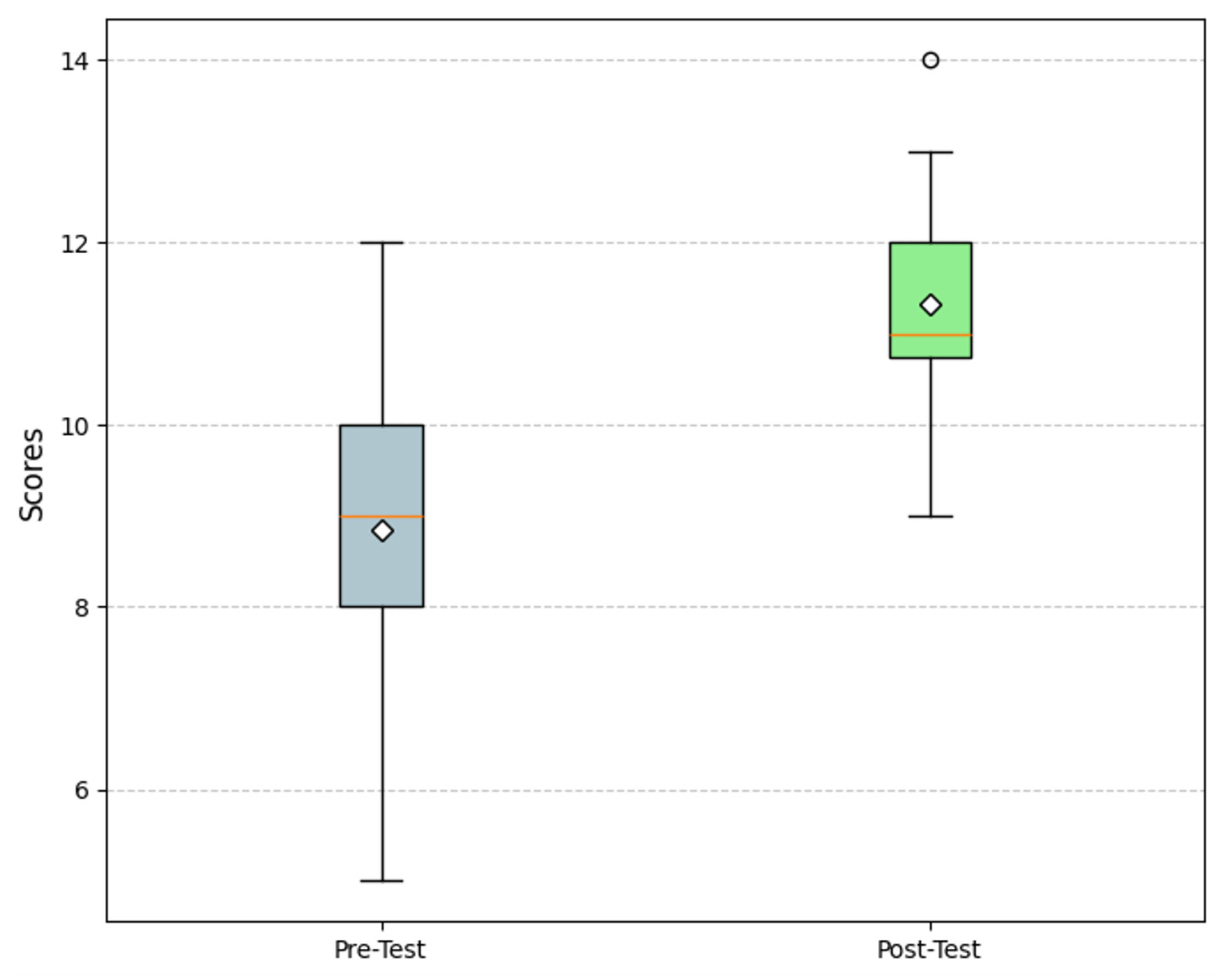
After using the AR application, participants demonstrated a clear improvement in knowledge related to earthquake preparedness. The mean pre-test score was 8.85 (SD = 1.61), indicating moderate baseline knowledge before the intervention. Following interaction with the AR application, the mean post-test score increased to 11.32 (SD = 1.19), suggesting improved understanding and reduced variability in participant performance.
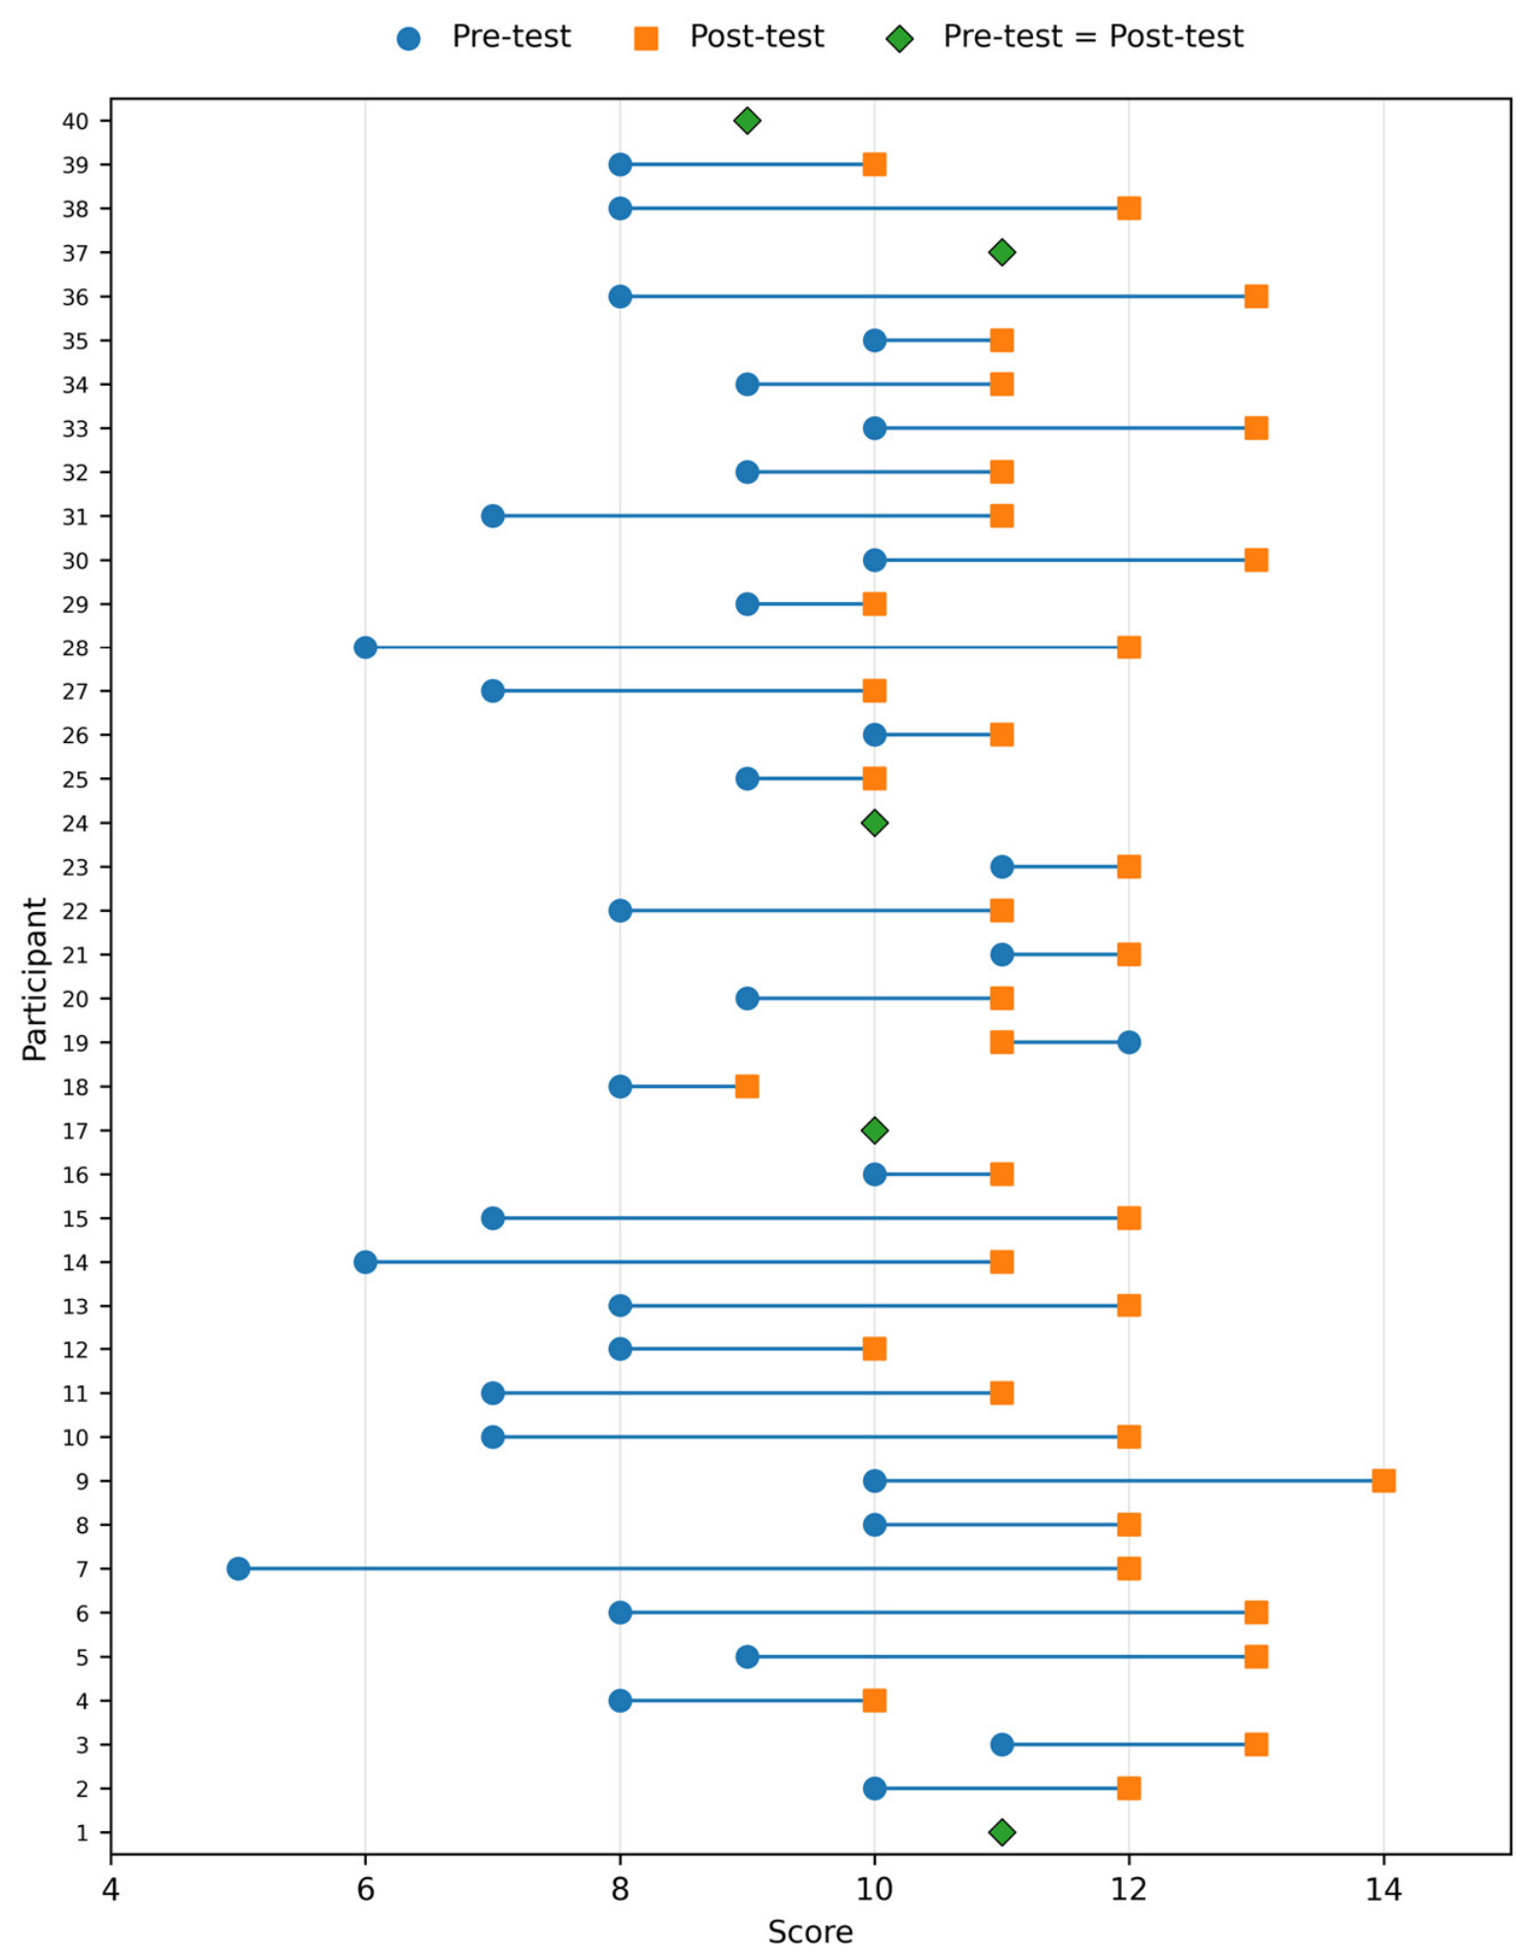
Figure 7 presents a dumbbell plot of paired pre-test and post-test scores for each participant. Each horizontal line connects the pre-test and post-test scores of the same participant, allowing individual changes after using the AR application to be visually compared. For the five participants whose pre-test and post-test scores were identical, a single diamond marker is used instead of overlapping circle and square markers. The plot shows that most participants achieved higher post-test scores than pre-test scores, indicating an overall improvement in earthquake-preparedness knowledge.
A paired sample t-test was conducted to compare pre-test and post-test scores. The analysis revealed a statistically significant increase in participants’ knowledge after using the AR application ( t 39 = 8.20 ,   p < 0.001 ). These findings indicate that the educational intervention enhanced participants’ knowledge related to earthquake preparedness.
Figure 8 presents a box plot comparing score distributions before and after the intervention. The post-test scores exhibited a higher median and a narrower interquartile range compared with the pre-test scores, suggesting not only improved knowledge but also greater consistency among participants following the learning experience.
To further evaluate the practical significance of the observed improvement, effect size analysis was conducted using Cohen’s d for paired samples. The calculated effect size was d = 1.30 , indicating a large practical effect according to conventional interpretation criteria. This result suggests that the AR application produced a substantial educational impact on earthquake preparedness learning.
Table 3 presents the number and percentage of participants who answered each question correctly in the pre-test and the post-test. The largest improvements were observed for Question 11 (the emergency telephone number in Japan, from 50.0% to 100.0%), Question 2 (the highest level of seismic intensity, from 20.0% to 65.0%), Question 12 (the disaster alert application designed for foreigners in Japan, from 55.0% to 95.0%), and Question 4 (the number of levels in the seismic intensity scale, from 45.0% to 77.5%). These items concern factual information specific to Japan that participants were unlikely to have encountered in their home countries, which suggests that the proposed AR application was particularly effective for conveying practical, Japan-specific knowledge. In contrast, the items that showed smaller improvements, such as Questions 5, 7, 13, and 14, already had high correct answer rates in the pre-test (82.5% to 97.5%), leaving limited room for improvement.
These findings demonstrate that the proposed AR application effectively enhanced participants’ understanding of earthquake preparedness and contributed to more consistent learning outcomes across users.

4.2. Satisfaction Score Analysis

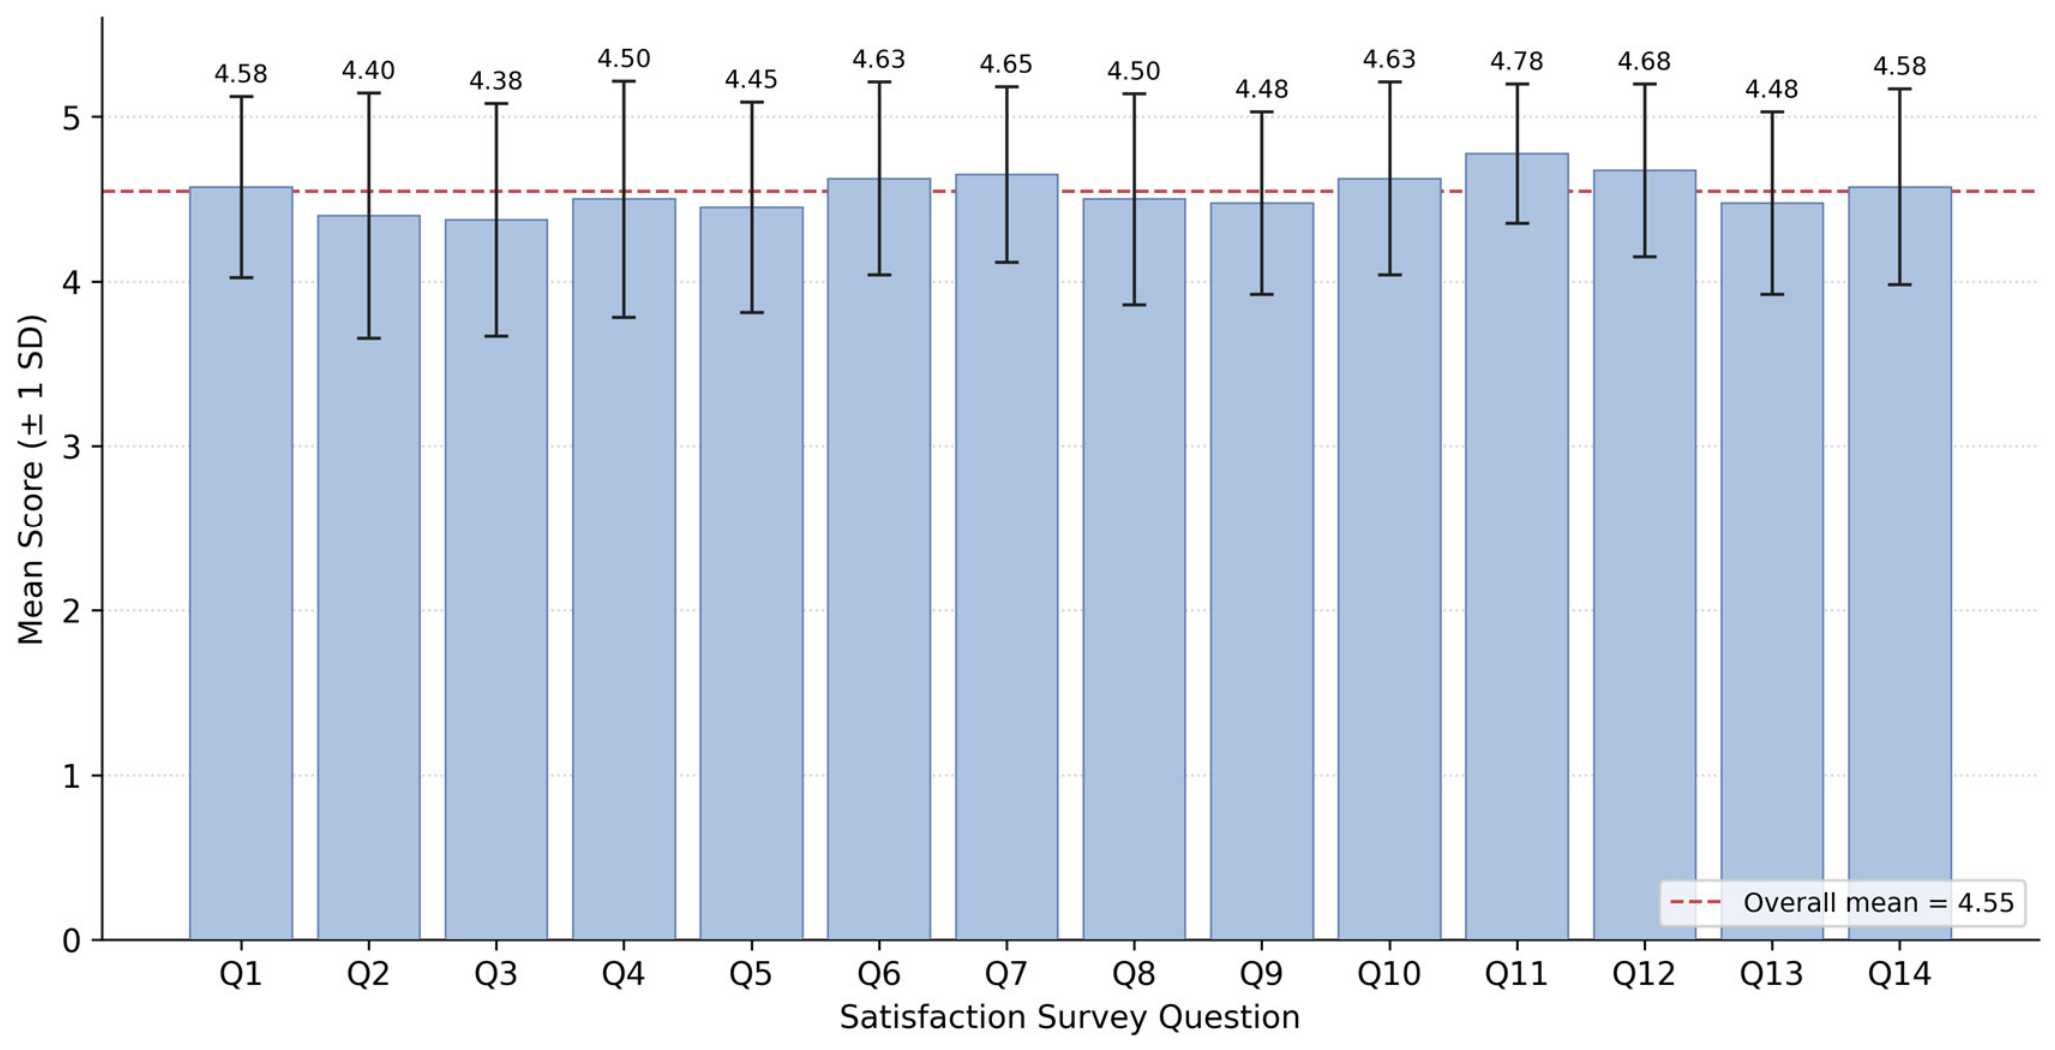
The overall mean satisfaction score for the AR application was 4.55 (SD = 0.61), placing it within the “Very Satisfied” category according to the predefined five-level interpretation criteria. This result indicates that participants generally perceived the application positively and considered it effective, engaging, and useful for earthquake preparedness learning. The mean scores and standard deviations for each survey question are presented in Table 4 and illustrated in Figure 9.
Among the 14 evaluation items, the highest mean score was observed for Question 11: “Helps you understand safety procedures” (Mean = 4.78, SD = 0.42), indicating that participants strongly agreed that the application effectively improved their understanding of appropriate responses during earthquake situations. High scores were also observed for Question 12: “Helps you feel more prepared for disasters” (Mean = 4.68, SD = 0.53) and Question 7: “Clarity and quality of audio narration” (Mean = 4.65, SD = 0.53). These findings suggest that participants valued both the educational effectiveness and the quality of content delivery provided by the proposed AR application.
The lowest mean score was recorded for Question 3: “Speed of data loading and AR display” (Mean = 4.38, SD = 0.70), followed by Question 2: “Accessibility of various functions” (Mean = 4.40, SD = 0.74). Although these scores remained within the Very Satisfied category, they suggest that loading performance, responsiveness, and the accessibility of the application’s functions may represent areas for future optimization.
Overall, the satisfaction survey results demonstrated highly positive user perceptions regarding usability, educational content, AR experience, and engagement. These findings indicate that the application successfully delivered an effective and satisfying learning experience for international visitors.
In addition to quantitative evaluation, qualitative feedback revealed several opportunities for future improvement. Of the 40 participants, 17 provided open-ended comments. The most frequent suggestion was to expand multilingual support, such as French, Spanish, and Chinese (n = 6), followed by reducing reliance on physical AR markers (n = 2) and improving animation quality (n = 2). Other suggestions, each mentioned by one participant, included improving scanning continuity, enhancing voice naturalness, enlarging text elements, introducing avatar customization features, and expanding educational content such as emergency preparedness kits. These suggestions provide practical directions for future system development and may further improve accessibility and user experience in future versions of the application.

4.3. Summary

The results demonstrated that the proposed AR application effectively enhanced participants’ knowledge related to earthquake preparedness. Participants showed a statistically significant increase in knowledge scores after using the application, with the mean score improving from 8.85 (SD = 1.61) in the pre-test to 11.32 (SD = 1.19) in the post-test ( t 39 = 8.20 ,   p < 0.001 ). The calculated effect size (Cohen’s d = 1.30) further indicated a large practical impact of the educational intervention.
In addition to knowledge improvement, user evaluation results revealed a high level of satisfaction with the application, with an overall mean satisfaction score of 4.55 out of 5.00 (SD = 0.61), corresponding to the Very Satisfied category. Participants responded positively to the usability, educational content, and interactive learning experience provided by the system.
Overall, these findings suggest that the proposed AR application can serve as an effective educational approach for delivering knowledge related to earthquake preparedness to international visitors and newly arrived foreign residents, and highlight the potential of AR-supported digital learning for disaster preparedness education.

5. Discussion

The findings of this study demonstrate the effectiveness of the proposed AR application in enhancing participants’ knowledge related to earthquake preparedness. Compared with baseline performance, participants showed a statistically significant improvement in knowledge after interacting with the application, with scores increasing from 8.85 (SD = 1.61) in the pre-test to 11.32 (SD = 1.19) in the post-test ( t 39 = 8.20 ,   p < 0.001 ). Furthermore, the calculated effect size (Cohen’s d = 1.30) indicated a large practical effect, suggesting that the educational intervention produced meaningful learning outcomes.
One possible explanation for these outcomes is the immersive and interactive nature of AR technology. Unlike conventional educational approaches such as printed materials or passive media, AR allows users to interact with educational content through visual and contextual experiences, potentially improving comprehension and information retention. These findings are consistent with previous studies that reported positive effects of AR on educational engagement and knowledge transfer [6]. They are also in line with systematic reviews and meta-analyses of AR in education, which report that AR improves learning achievement and that visualization, interactivity, and increased interest are among its main benefits [8,9,10]. The present results extend this evidence to disaster preparedness education for international visitors and newly arrived foreign residents, a population that has received limited attention in previous AR studies.
The present findings can also be compared with previous studies that applied AR and VR to disaster preparedness [11,12,18]. Those studies focused mainly on simulating disaster situations or supporting evacuation behavior, and they primarily targeted local residents or emergency responders. In contrast, the present study focused on delivering factual and procedural knowledge specific to Japan, such as the seismic intensity scale, the emergency telephone number, and disaster alert applications, to users who are unfamiliar with the Japanese disaster context. The item-level results support this interpretation: the largest improvements were observed for items concerning Japan-specific information, whereas items on general earthquake responses, which participants were more likely to know beforehand, showed smaller gains. This suggests that AR-based mobile learning may be particularly suited to conveying context-specific knowledge to newcomers, complementing simulation-based approaches reported in previous work.
User satisfaction results further supported the effectiveness of the proposed approach. The overall satisfaction score reached 4.55 out of 5.00 (SD = 0.61), corresponding to the Very Satisfied category. Participants particularly responded positively to the usefulness of earthquake information, understanding of safety procedures, and perceived disaster preparedness benefits. This suggests that interactive learning experiences may contribute to higher acceptance and engagement in disaster education.
Qualitative feedback additionally revealed several opportunities for improvement. Participants recommended expanding multilingual support, improving accessibility, reducing dependence on physical AR markers, improving voice quality, enhancing animation quality, and introducing additional customization and educational content. These findings indicate that user-centered refinement may further improve the effectiveness and inclusiveness of future AR educational systems.
Although the results are encouraging, several limitations should be acknowledged. The study employed convenience sampling and involved a relatively limited sample size (n = 40). In addition, participant distribution across countries was not balanced, and only short-term learning outcomes were evaluated. The study population was also limited to foreign nationals who had been residing in Japan for two years or less; while this focus is appropriate for individuals who are relatively new to Japan and likely to have limited earthquake experience, it may limit the generalizability of the findings to short-term tourists or to visitors with longer residence. Furthermore, because this study used a one-group pre-test/post-test design without a control group and administered the same knowledge test before and after the intervention, possible testing effects cannot be fully excluded. Participants’ prior experience with AR technology was also not measured, and the novelty of the technology may have contributed to their engagement and high satisfaction ratings. Previous AR studies have similarly suggested that the novelty of the technology may influence learners’ motivation and engagement, highlighting the need for studies conducted over longer periods [29]. Future longitudinal studies should incorporate repeated learning sessions, a control group receiving equivalent content in a conventional format, and a delayed post-test. Such studies would help distinguish the educational contribution of AR from that of the learning content itself and assess longer-term knowledge retention. These limitations should be considered when interpreting the findings of the present study.

6. Conclusions and Future Work

6.1. Conclusions

This study designed, developed, and evaluated an augmented reality (AR) application intended to enhance knowledge related to earthquake preparedness among international visitors and newly arrived foreign residents in Japan. The findings demonstrated that the proposed application significantly enhanced participants’ knowledge related to earthquake preparedness, with average scores increasing from 8.85 (SD = 1.61) before use to 11.32 (SD = 1.19) after use. Statistical analysis confirmed that this improvement was significant ( p < 0.001 ) and associated with a large practical effect (Cohen’s d = 1.30).
In addition to educational effectiveness, participants reported a high level of satisfaction, with an overall satisfaction score of 4.55 out of 5.00 (SD = 0.61), indicating a highly positive user experience. These findings suggest that AR technology has strong potential as an accessible educational medium for disaster preparedness and may support more effective dissemination of safety information to international visitors and newly arrived foreign residents.
The results also suggest how digital delivery approaches supported by mobile technologies may expand access to disaster education and contribute to enhancing knowledge related to earthquake preparedness among highly mobile populations.

6.2. Future Work

Future development of the proposed application should consider the following directions:
  • Multilingual Support: Expand language availability beyond the current implementation to support broader international accessibility, including languages suggested by participants.
  • Interaction Improvements: Reduce dependence on physical AR markers and explore more seamless and continuous interaction methods.
  • Content Expansion: Introduce additional disaster-related educational content, such as emergency preparedness kits and extended survival guidance.
  • Personalization Features: Support avatar customization and adaptive presentation to accommodate diverse user preferences.
  • Usability Enhancement: Improve interface accessibility through larger text, more natural voice narration, and enhanced animation quality.
  • Long-Term and Large-Scale Evaluation: Conduct future studies with larger and more diverse participant populations and evaluate long-term knowledge retention.

Author Contributions

Conceptualization, G.C. and O.U.; methodology, G.C.; investigation, G.C.; writing—original draft preparation, G.C.; writing—review and editing, O.U.; supervision, O.U.; project administration, O.U. All authors have read and agreed to the published version of the manuscript.

Funding

This research received no external funding.

Institutional Review Board Statement

The study was conducted in accordance with the Declaration of Helsinki and approved by the Institutional Ethics Committee of Tokai University (protocol code 226049, 3 April 2026) for studies involving humans.

Informed Consent Statement

Informed consent was obtained from all subjects involved in the study.

Data Availability Statement

The data presented in this study are available from the corresponding author upon reasonable request. The data are not publicly available due to privacy and ethical restrictions related to human participants.

Conflicts of Interest

The authors declare no conflicts of interest.

References

  1. Shaw, R.; Shiwaku, K.; Kobayashi, H.; Kobayashi, M. Linking experience, education, perception and earthquake preparedness. Disaster Prev. Manag. 2004, 13, 39–49. [Google Scholar] [CrossRef] [Scilit]
  2. Gavari-Starkie, E.; Casado-Claro, M.-F.; Navarro-González, I. The Japanese Educational System as an International Model for Urban Resilience. Int. J. Environ. Res. Public Health 2021, 18, 5794. [Google Scholar] [CrossRef] [Scilit] [PubMed]
  3. Japan National Tourism Organization. Japan-Bound Statistics: Number of Foreign Visitors to Japan (December 2025 Estimates). Available online: https://www.jnto.go.jp/news/press/20260121_monthly.html (accessed on 13 July 2026).
  4. Immigration Services Agency of Japan. Number of Foreign Residents as of the End of 2025. Available online: https://www.moj.go.jp/isa/publications/press/13_00062.html (accessed on 13 July 2026).
  5. Adu-Gyamfi, B.; Shaw, R. Risk Awareness and Impediments to Disaster Preparedness of Foreign Residents in the Tokyo Metropolitan Area, Japan. Int. J. Environ. Res. Public Health 2022, 19, 11469. [Google Scholar] [CrossRef] [Scilit] [PubMed]
  6. Zhang, J.; Li, G.; Huang, Q.; Feng, Q.; Luo, H. Augmented Reality in K–12 Education: A Systematic Review and Meta-Analysis of the Literature from 2000 to 2020. Sustainability 2022, 14, 9725. [Google Scholar] [CrossRef] [Scilit]
  7. Chanaken, G.; Uchida, O. Design and Implementation of an Augmented Reality System for Raising Disaster Awareness Among Thai Tourists in Japan. In Proceedings of the 2024 5th International Conference on Computational Science & Information Management (ICoCSIM), Melbourne, Australia, 28–29 October 2024; pp. 72–77. [Google Scholar] [CrossRef] [Scilit]
  8. Akçayır, M.; Akçayır, G. Advantages and Challenges Associated with Augmented Reality for Education: A Systematic Review of the Literature. Educ. Res. Rev. 2017, 20, 1–11. [Google Scholar] [CrossRef] [Scilit]
  9. Garzón, J.; Pavón, J.; Baldiris, S. Systematic Review and Meta-Analysis of Augmented Reality in Educational Settings. Virtual Real. 2019, 23, 447–459. [Google Scholar] [CrossRef] [Scilit]
  10. Ibáñez, M.-B.; Delgado-Kloos, C. Augmented Reality for STEM Learning: A Systematic Review. Comput. Educ. 2018, 123, 109–123. [Google Scholar] [CrossRef] [Scilit]
  11. De León Aguilar, S.; Matsuda, Y.; Yasumoto, K. Mobile AR Interface for Instruction-Based Disaster Preparedness Guidelines. In Proceedings of the 2023 14th International Conference on Mobile Computing and Ubiquitous Network (ICMU), Kyoto, Japan, 29 November–1 December 2023; pp. 1–7. [Google Scholar] [CrossRef] [Scilit]
  12. Yamashita, N.; Taki, H.; Soga, M. A Learning Support Environment for Earthquake Disaster with a Simulation of Furniture Falling by Mobile AR. In Proceedings of the 2012 International Conference on Information Technology Based Higher Education and Training (ITHET), Istanbul, Turkey, 21–23 June 2012; pp. 1–5. [Google Scholar] [CrossRef] [Scilit]
  13. Manimegalai, R.; Arawind, S.; Sri Rajiv Jegan, G.V.; Gomathi, B. ARWeather: Weather Forecasting and Visualization using Augmented Reality. In Proceedings of the 2023 International Conference on Intelligent Systems for Communication, IoT and Security (ICISCoIS), Coimbatore, India, 9–11 February 2023; pp. 585–590. [Google Scholar] [CrossRef] [Scilit]
  14. Mantoro, T.; Alamsyah, Z.; Ayu, M.A. Pathfinding for Disaster Emergency Route Using Sparse A* and Dijkstra Algorithm with Augmented Reality. In Proceedings of the 2021 7th International Conference on Computing, Engineering and Design (ICCED), Sukabumi, Indonesia, 5–6 August 2021; pp. 1–6. [Google Scholar] [CrossRef] [Scilit]
  15. Mannuru, N.R.; Kanumuru, M.; Sharma, S. Mobile AR Application for Navigation and Emergency Response. In Proceedings of the 2022 International Conference on Computational Science and Computational Intelligence (CSCI), Las Vegas, NV, USA, 14–16 December 2022; pp. 1137–1142. [Google Scholar] [CrossRef] [Scilit]
  16. Ahn, J.; Han, R. RescueMe: An Indoor Mobile Augmented-Reality Evacuation System by Personalized Pedometry. In Proceedings of the 2011 IEEE Asia-Pacific Services Computing Conference (APSCC), Jeju, Republic of Korea, 12–15 December 2011; pp. 70–77. [Google Scholar] [CrossRef] [Scilit]
  17. Papanastasiou, G.; Drigas, A.; Skianis, C.; Lytras, M.; Papanastasiou, E. Virtual and Augmented Reality Effects on K-12, Higher and Tertiary Education Students’ Twenty-First Century Skills. Virtual Real. 2019, 23, 425–436. [Google Scholar] [CrossRef] [Scilit]
  18. Bhookan, N.S.; Murde, M.S.; Thakur, D.P.; Jadhav, H.B. Disaster Survival Training Using Virtual Reality. In Proceedings of the 2020 5th International Conference on Computing, Communication and Security (ICCCS), Patna, India, 14–16 October 2020; pp. 1–4. [Google Scholar] [CrossRef] [Scilit]
  19. Orji, J.; Hernandez, A.; Selema, B.; Orji, R. Virtual and Augmented Reality Applications for Promoting Safety and Security: A Systematic Review. In Proceedings of the 2022 IEEE 10th International Conference on Serious Games and Applications for Health (SeGAH), Sydney, Australia, 10–12 August 2022; pp. 1–7. [Google Scholar] [CrossRef] [Scilit]
  20. Patel, M.; Amin, H.; Pandey, G.; Wadmare, G. Enhancing Disaster Response Training through Immersive AR/VR Simulations. In Proceedings of the 2023 6th International Conference on Advances in Science and Technology (ICAST), Mumbai, India, 8–9 December 2023; pp. 69–74. [Google Scholar] [CrossRef] [Scilit]
  21. Romagnoli, L.; Proietti Mattia, G.; Beraldi, R. A Study on Energy Efficiency in Edge-assisted VR Applications with Meta Quest 2 for Disaster Management. In Proceedings of the 2023 International Conference on Information and Communication Technologies for Disaster Management (ICT-DM), Cosenza, Italy, 13–15 September 2023; pp. 1–7. [Google Scholar] [CrossRef] [Scilit]
  22. Leedy, P.D.; Ormrod, J.E. Practical Research: Planning and Design, 12th ed.; Pearson: New York, NY, USA, 2019. [Google Scholar]
  23. Etikan, I.; Musa, S.A.; Alkassim, R.S. Comparison of Convenience Sampling and Purposive Sampling. Am. J. Theor. Appl. Stat. 2015, 5, 1–4. [Google Scholar] [CrossRef] [Scilit]
  24. Rovinelli, R.J.; Hambleton, R.K. On the Use of Content Specialists in the Assessment of Criterion-Referenced Test Item Validity. Tijdschr. Onderwijsres. Dutch J. Educ. Res. 1977, 2, 49–60. [Google Scholar]
  25. Dimitrov, D.M.; Rumrill, P.D., Jr. Pretest–Posttest Designs and Measurement of Change. Work 2003, 20, 159–165. [Google Scholar] [CrossRef] [Scilit]
  26. Kusmaryono, I.; Wijayanti, D.; Maharani, H.R. Number of Response Options, Reliability, Validity, and Potential Bias in the Use of the Likert Scale in Education and Social Science Research: A Literature Review. Int. J. Educ. Methodol. 2022, 8, 625–637. [Google Scholar] [CrossRef] [Scilit]
  27. Tuckman, B.W. Conducting Educational Research, 5th ed.; Harcourt Brace College Publishers: Fort Worth, TX, USA, 1999. [Google Scholar]
  28. Cohen, J. Statistical Power Analysis for the Behavioral Sciences, 2nd ed.; Lawrence Erlbaum Associates: Hillsdale, NJ, USA, 1988. [Google Scholar]
  29. Di Serio, Á.; Ibáñez, M.B.; Delgado-Kloos, C. Impact of an Augmented Reality System on Students’ Motivation for a Visual Art Course. Comput. Educ. 2013, 68, 586–596. [Google Scholar] [CrossRef] [Scilit]
Figure 1. Creating 3D objects with Blender software (Version 5.2.0 LTS).
Information 17 00716 g001
Figure 2. Creating motion with Adobe Mixamo presets.
Information 17 00716 g002
Figure 3. Example images for use as target images.
Information 17 00716 g003
Figure 4. Developing research tools using Unity software (Version 2021.3.45f2).
Information 17 00716 g004
Figure 5. Example of a smartphone screen after development.
Information 17 00716 g005
Figure 6. Participants using the AR application through smartphones.
Information 17 00716 g006
Figure 7. Dumbbell plot of paired pre-test and post-test knowledge scores for each participant. Participants whose pre-test and post-test scores were identical (n = 5) are shown with a single diamond marker.
Information 17 00716 g007
Figure 8. Distribution of Pre-Test and Post-Test Scores.
Information 17 00716 g008
Figure 9. Average Satisfaction Score per Question. Error bars represent ± 1 standard deviation.
Information 17 00716 g009
Table 1. Levels and meanings of satisfaction responses.
LevelMeaning
5Very Satisfied
4Satisfied
3Neutral
2Dissatisfied
1Very Dissatisfied
Table 2. Rating system for IOC evaluation.
RateMeaning
+1The question is congruent with the research objectives.
0The question’s congruence with the research objectives is uncertain.
−1The question is not congruent with the research objectives.
Table 3. Number of participants who answered each knowledge assessment question correctly in the pre-test and the post-test (n = 40).
QuestionPre-Test
n (%)
Post-Test
n (%)
Change (%pt)
1. Do you know what Seismic Intensity means?27 (67.5)33 (82.5)+15.0
2. Which level of seismic intensity is the highest intensity level?8 (20.0)26 (65.0)+45.0
3. Which level of seismic intensity is the lowest intensity level?11 (27.5)15 (37.5)+10.0
4. How many levels are there in Seismic Intensity?18 (45.0)31 (77.5)+32.5
5. At which Seismic Intensity level might people feel shaking but without any damage?37 (92.5)40 (100.0)+7.5
6. What should you do first when an earthquake occurs?27 (67.5)33 (82.5)+15.0
7. What should you avoid being close to during an earthquake?33 (82.5)34 (85.0)+2.5
8. What should an emergency kit for earthquakes include?18 (45.0)22 (55.0)+10.0
9. What should you do if you are outdoors when an earthquake occurs?33 (82.5)37 (92.5)+10.0
10. What should you do if you are in a hazardous area after an earthquake?24 (60.0)27 (67.5)+7.5
11. If you encounter injuries during an earthquake in Japan, which number should you contact?20 (50.0)40 (100.0)+50.0
12. Which app can provide disaster alerts in Japan and is designed for foreigners?22 (55.0)38 (95.0)+40.0
13. What should shelter locations after an earthquake in Japan be like?36 (90.0)38 (95.0)+5.0
14. What should shelter locations after an earthquake in Japan be like?39 (97.5)40 (100.0)+2.5
Table 4. Mean Scores for Satisfaction Survey Questions.
QuestionMeanSDMinMax
1. Ease of use and navigation4.58 0.5535
2. Accessibility of various functions4.400.7425
3. Speed of data loading and AR display4.380.7035
4. English and Thai language support4.500.7235
5. The process of scanning AR markers4.450.6435
6. Three-dimensional character animations and gestures4.630.5935
7. Clarity and quality of audio narration4.650.5335
8. Visual quality of text and information4.500.6435
9. Realism of AR technology used4.480.5535
10. Usefulness and accuracy of earthquake info4.630.5935
11. Helps you understand safety procedures4.780.4245
12. Helps you feel more prepared for disasters4.680.5335
13. Overall satisfaction with the application4.480.5535
14. Recommending this app to others4.580.5935
Overall4.550.6125
Disclaimer/Publisher’s Note: The statements, opinions and data contained in all publications are solely those of the individual author(s) and contributor(s) and not of MDPI and/or the editor(s). MDPI and/or the editor(s) disclaim responsibility for any injury to people or property resulting from any ideas, methods, instructions or products referred to in the content.