Article

Addressing Extreme Baseline Imbalances in Quasi-Experimental Evaluation of AI-Driven Adaptive Cybersecurity Training: A Multi-Method Approach

by
Mohammed M. Al-Gawda
1,*,
Majdi Abdellatief
2 and
Ibrahim Al-Baltah
1,3
1
Department of Information Technology, Faculty of Science and Engineering, AL-Hikma University, Sana’a 00967, Yemen
2
Department of Computer Science, Faculty of Computer Studies, Arab Open University, Riyadh 11681, Saudi Arabia
3
Department of Information Technology, Faculty of Computer Science and Information Technology, Sana’a University, Sana’a 00967, Yemen
*
Author to whom correspondence should be addressed.
Information 2026, 17(7), 682; https://doi.org/10.3390/info17070682
Submission received: 7 May 2026 / Revised: 24 June 2026 / Accepted: 25 June 2026 / Published: 14 July 2026
(This article belongs to the Special Issue AI-Driven Information Analytics for Cybersecurity and Privacy)

Abstract

Despite widespread adoption of cybersecurity awareness training (CSAT), a persistent knowledge–behaviour gap continues to undermine organisational security posture, particularly in resource-constrained and developing-country contexts. This 12-week quasi-experimental field study evaluated an AI-adaptive CSAT platform against traditional instructor-led training (ILT) across three Yemeni organisations (total N = 187; AI-Adaptive: n = 94; Control: n = 93). The system used a 4-parameter Bayesian Knowledge Tracing (BKT) engine—with interpretable guess and slip signals—as an auditable pedagogical decision layer that triggered Protection Motivation Theory (PMT) and Theory of Planned Behavior (TPB)-aligned interventions. Extreme baseline imbalances (Cohen’s d > 2.0), at which standard ANCOVA residual adjustment alone is known to be biased and which necessitated advanced causal-inference triangulation, were addressed via a four-method protocol (ANCOVA, Propensity Score Matching, Difference-in-Differences, mixed-effects). All four methods converged on consensus effect sizes of d = 0.66–0.89. IT-verified Tier 2–3 incidents declined by 48.9% (incidence-rate ratio [IRR] = 0.51, 95% CI [0.38, 0.68]); blinded phishing click-rates fell from 8.8% to 2.1% (χ2(1) = 8.74, p = 0.003). Bootstrapped mediation analysis (PROCESS Model 4; 5000 draws) indicated that coping self-efficacy and perceived behavioural control—but not threat appraisal—were jointly associated with 66.4% of the total compliance effect. Rosenbaum bounds Γ = 2.1; E-values ≥ 3.4. The findings are consistent with the hypothesis that AI-adaptive cybersecurity training produces robust, theoretically explicable benefits and that the coping-appraisal pathway, not threat salience, is the active psychological mechanism. The four-method triangulation framework offers a replicable standard for field evaluations with non-random assignment. the consensus envelope d = 0.66–0.89 is the observed range of point estimates across the four estimators; per-method 95% CIs are reported below indirect effect via coping self-efficacy = 0.843 [0.52, 1.19], via PBC = 0.524 [0.28, 0.81], via threat appraisal = 0.059 [−0.07, 0.21] (ns); direct effect c’ = 0.63 (p = 0.026); total effect c = 2.06 [1.58, 2.54].

1. Introduction

We report a 12-week quasi-experimental field study with a total analysed sample of N = 187 employees across three Yemeni organisations (AI-Adaptive: n = 94; Control: n = 93), comparing an AI-adaptive cybersecurity awareness training platform against traditional instructor-led training (ILT). The remainder of this Introduction sets out the knowledge–behaviour gap that motivates this work.
Organisational cybersecurity hinges not only on the sophistication of technical controls but also on the daily decisions of individual employees. A single mis-click on a phishing email, a reused password, or an unlocked workstation can lead to substantial security breaches despite existing technical controls. Yet decades of security awareness training have exposed a stubborn paradox: employees who correctly identify phishing on a knowledge test routinely fall victim to simulated attacks minutes later [1,2]. This knowledge–behaviour gap—the systematic failure of intention to predict action in security contexts—remains among the most consequential unsolved problems in applied information security. Traditional instructor-led training (ILT) addresses knowledge but rarely the psychological mechanisms that convert knowledge into protective behaviour: self-efficacy, perceived threat, social norms, and perceived ease of compliance [3,4,5]. The unresolved question, then, is how to bridge this persistent gap by directly engaging the psychological levers that ILT typically leaves untouched.
The key innovation of our deployment is the use of interpretable P(G) and P(S) Bayesian Knowledge Tracing signals as an auditable pedagogical decision layer that triggers PMT/TPB-aligned interventions, rather than as mere mastery estimates.
AI-driven adaptive learning systems offer a theoretically promising alternative. By tracking individual mastery in real time via algorithms such as Bayesian Knowledge Tracing (BKT) [6], they can deliver content calibrated to each learner’s Zone of Proximal Development while simultaneously building competency and self-efficacy. Within the wider knowledge-tracing literature, classic BKT remains attractive when interpretability, robustness with modest sample sizes, and deployment transparency matter, even as more complex alternatives such as Deep Knowledge Tracing (DKT) have broadened the modelling landscape [7,8]. For the specific goals of this study, BKT’s interpretability is key to our theoretical contribution because it allows the deployment of an auditable, theory-grounded pedagogical decision layer that operationalises and tests PMT/TPB-aligned responses, rather than treating personalisation as a black box. The key innovation of our BKT deployment is therefore the explicit use of interpretable P(G) and P(S) signals as an auditable pedagogical decision layer to guide PMT/TPB-aligned responses, beyond typical mastery estimation. This transparency also fosters organisational trust by justifying the trigger of each intervention: high P(S) flags an attention-related slip and routes the learner to attention-to-detail and execution-control content, whereas high P(G) flags a likely informed guess or misconception and routes the learner to explicit rule-recall and self-efficacy scaffolds. Adaptive decisions, therefore, remain transparent rather than black-boxed—an attribute increasingly demanded in security-relevant deployments.
Recent cybersecurity-training publications also point toward growing interest in generative-AI-enabled and adaptive training architectures, but much of that literature is still conceptual, review-based, or prototype-oriented rather than field-validated [9,10,11]. Whereas those works propose frameworks or simulated benefits, the present study provides the first formal empirical test, in a live organisational setting, of objective IT-verified incident outcomes and rigorous mediation analysis of PMT/TPB constructs. The novelty of the present design, therefore, lies less in proposing an entirely new knowledge-tracing algorithm than in the empirical validation of an integrated system in which our custom-configured BKT model—designed so that interpretable P(G) and P(S) signals function as an auditable pedagogical decision layer—serves as the theory-grounded decision engine for a PMT/TPB-aligned instructional layer. Importantly, unlike prior studies that may have measured PMT/TPB constructs only as outcome variables, this work integrates them directly into the adaptive decision-making logic itself, transforming them into actionable levers for behavioural change rather than passive endpoints. Standard BKT libraries such as pyBKT [12] provide robust parameter estimation but do not natively offer such a theory-linked pedagogical decision layer, which underscores the architectural novelty of the integrated system evaluated here.
Methodologically, field evaluations face a further challenge: when participants cannot be randomly assigned—because departmental scheduling or organisational constraints preclude it—baseline groups often differ dramatically. Standard ANCOVA produces biased estimates when baseline differences exceed approximately 1 SD [13]; yet many published evaluations report Cohen’s d > 1.0 in baseline characteristics without applying advanced causal-inference methods. A validated analytical playbook for this common situation is conspicuously absent from the information-systems security literature.

1.1. Research Questions

This study addresses two research questions:
  • RQ1: Does an AI-adaptive cybersecurity training system produce superior knowledge, behavioural, and objective security outcomes compared with traditional ILT, after rigorously controlling for extreme baseline imbalances (d > 2.0)?
  • RQ2: Do PMT/TPB constructs—specifically coping self-efficacy, perceived behavioural control (PBC), and threat appraisal—statistically mediate the effect of AI-adaptive training on security compliance behaviour?

1.2. Research Gaps and Contributions

Three interconnected gaps persist in the literature. First, methodologically, quasi-experimental field evaluations rarely encounter or transparently address extreme baseline imbalances (d > 2.0), leaving practitioners without a validated analytical playbook. Second, theoretically, psychological mechanisms are often left underspecified, leading many evaluation designs to measure only proximal outcomes and producing an empirical blind spot in understudied real-world settings. Recent adaptive CSAT work has explored chatbot delivery, generative-AI content generation, and broad curriculum personalisation, yet—to the best of our knowledge—no prior study has formally integrated PMT and TPB constructs into the adaptive decision logic and then empirically tested those constructs as mediators specifically within a BKT-driven cybersecurity intervention using objective organisational outcomes [3,4,5,9,10,11]. Third, empirically, evidence from developing-country and conflict-affected contexts remains virtually non-existent [1].
To the best of our knowledge, no prior study satisfies all three conditions simultaneously: (a) integration of PMT/TPB constructs directly into the adaptive decision logic (not only as outcome measures), (b) implementation atop a BKT-driven knowledge-tracing engine with explicit P(G)/P(S) decision signals, and (c) empirical testing of those constructs as mediators using objective IT-verified organisational outcomes. Table 1 documents this gap on a study-by-study basis for the three closest prior works [9,10,11].
This study makes three corresponding contributions. First, it provides, to our knowledge, the first formal empirical test of PMT/TPB-mediated pathways within an AI-adaptive cybersecurity curriculum using BKT and objective organisational outcomes. Second, it proposes and validates a four-method triangulation protocol (ANCOVA, PSM, DiD, mixed-effects models) as a rigorous template for researchers confronting extreme selection bias. Third, it provides objective institutional evidence—IT-verified security-incident logs and simulated-phishing outcomes—from three Yemeni organisations, establishing a contextual baseline for the developing-country cybersecurity capacity-building literature.
The remainder of this paper is structured as follows. Section 2 reviews relevant literature. Section 3 describes the materials and methods. Section 4 presents the results. Section 5 discusses implications and limitations. Section 6 concludes.

2. Related Work

To situate the research questions within existing scholarship, this section reviews the literature on the knowledge–behaviour gap, its psychological foundations, and recent advances in adaptive cybersecurity training.

2.1. The Knowledge–Behaviour Gap in Cybersecurity

The knowledge–behaviour gap refers to the well-documented divergence between employees’ theoretical understanding of security risks and their actual protective behaviour. Lebek et al. [14] and Bada et al. [1] argue that traditional awareness campaigns fail because they prioritise information transmission over psychological engagement—producing “click-through compliance,” that is, superficial completion of mandated training without durable behavioural change. Systematic reviews consistently find that immediate post-training knowledge gains decay within 3–6 months without reinforcement, and that the correlation between security knowledge and secure behaviour rarely exceeds r = 0.35 in organisational samples [1,15]. The gap is widest in contexts where cognitive load is high and social norms around security are weak.

2.2. Theoretical Foundations: PMT, TPB, and Behavioural Compliance

Protection Motivation Theory [3,16] proposes that protective behaviour is a joint function of threat appraisal (perceived severity × vulnerability) and coping appraisal (response efficacy + self-efficacy − response cost). Herath and Rao [2] demonstrated that coping appraisal constructs—particularly self-efficacy (β = 0.31, p < 0.01) and response efficacy (β = 0.24, p < 0.01)—predict security-policy compliance significantly better than threat appraisal alone. Meta-analytic synthesis confirms that coping appraisal outperforms threat appraisal as a proximal predictor of compliance (d ≈ 0.45 vs. d ≈ 0.22) [1], suggesting that fear-based messaging is less effective than efficacy-building interventions.
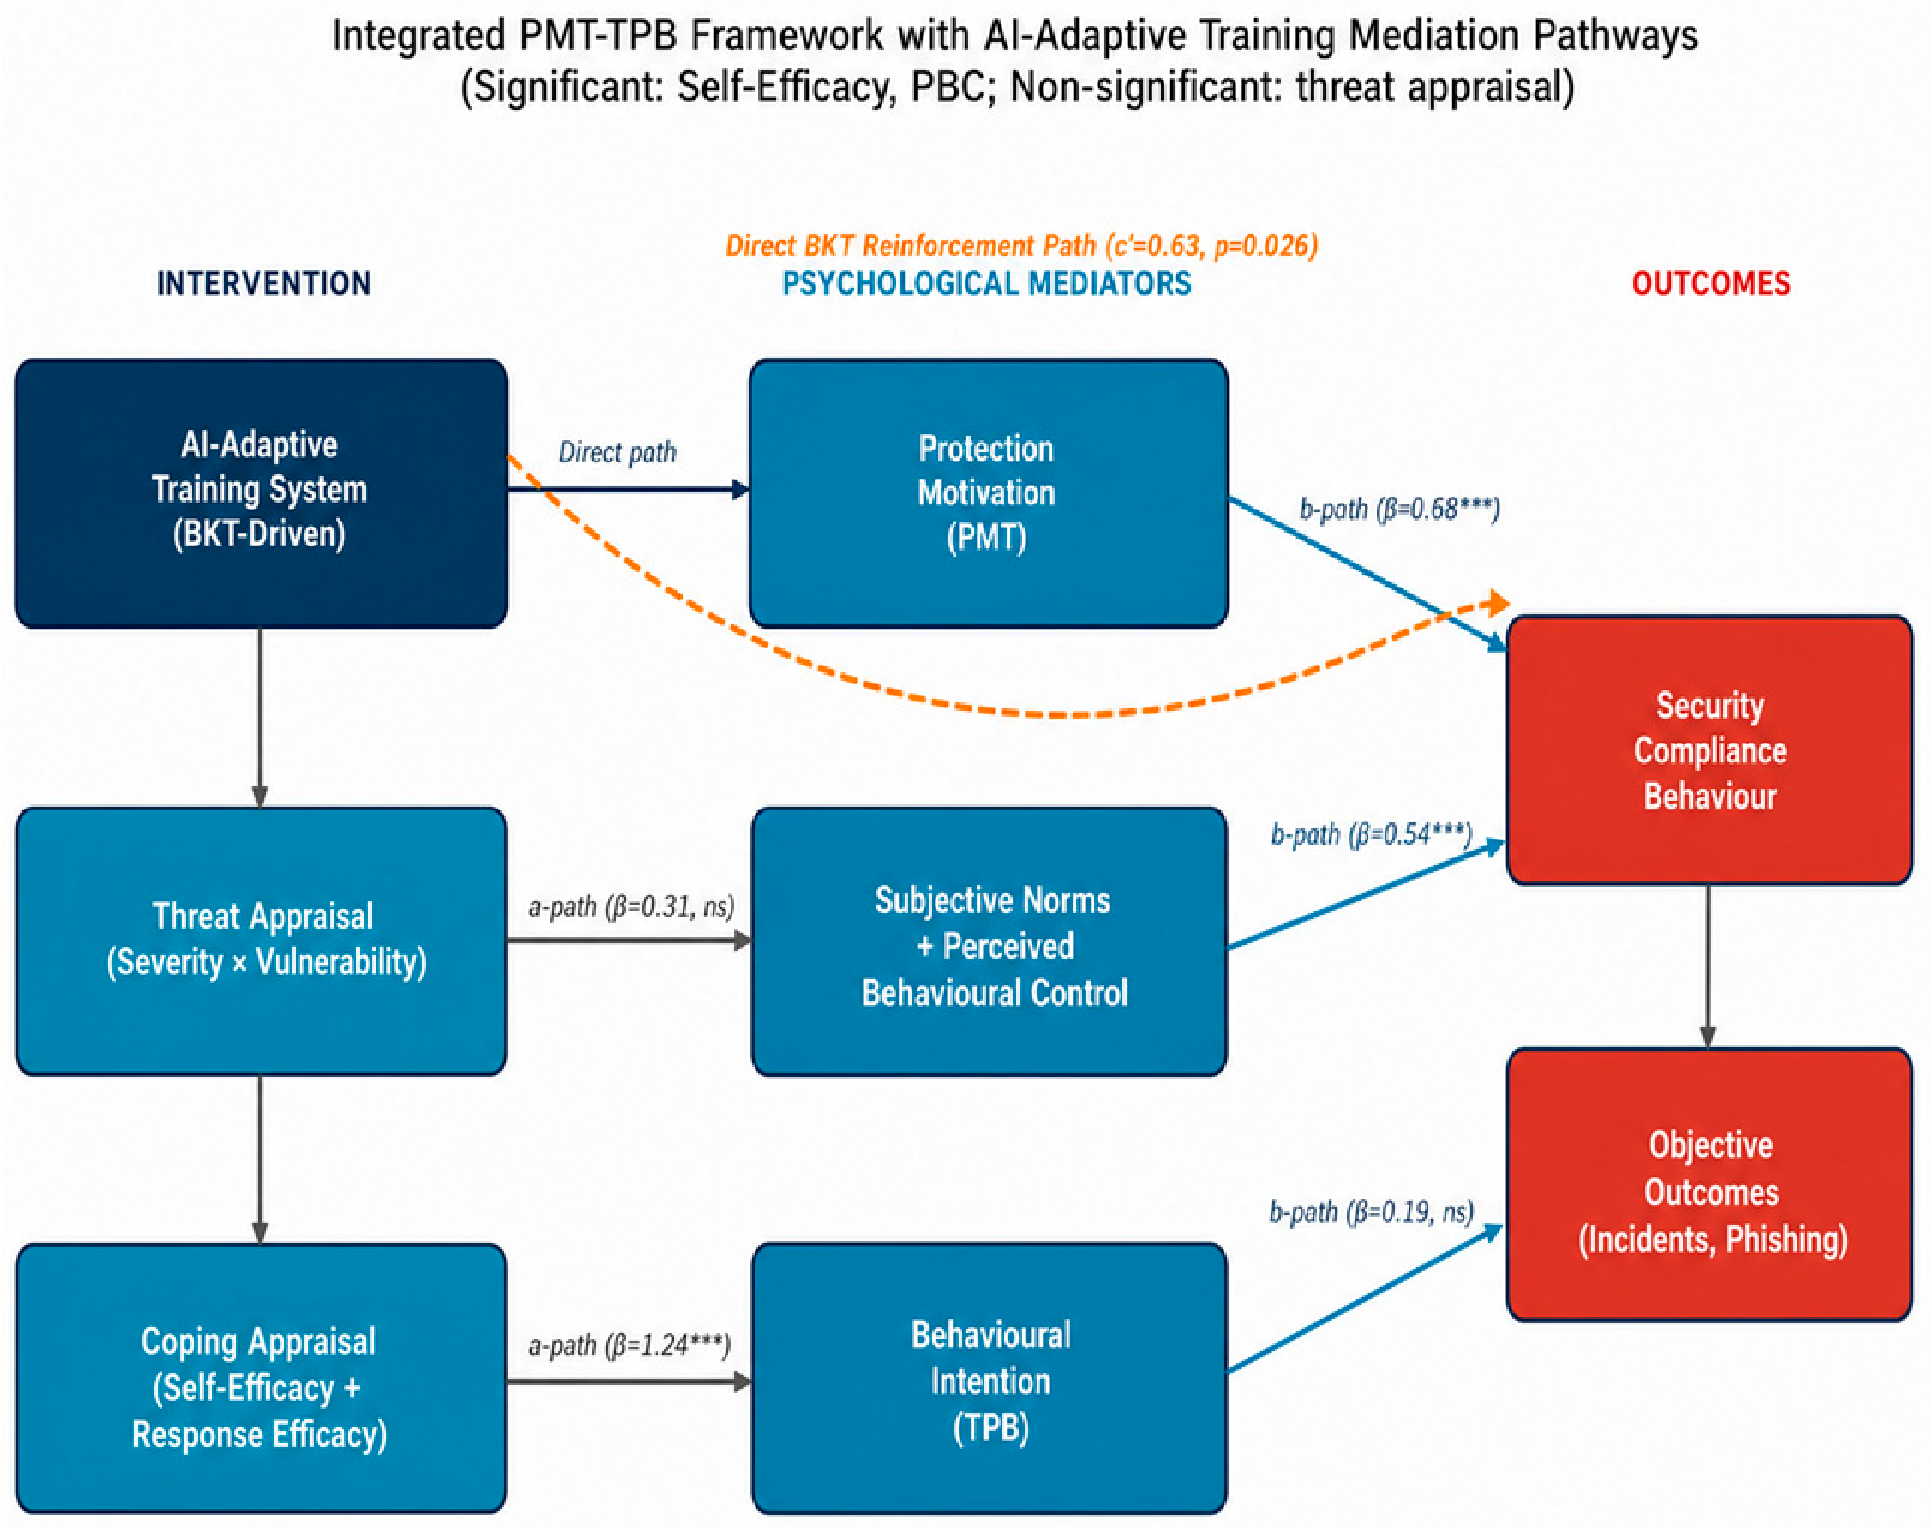
The Theory of Planned Behavior [17] adds that subjective norms and perceived behavioural control (PBC) moderate the intention-to-behaviour link. Bulgurcu et al. [5] and Ifinedo [4] show that PBC predicts policy adherence even after controlling for intentions (β = 0.28 and 0.23, respectively). The combined PMT–TPB framework (Figure 1) identifies self-efficacy and PBC as the most proximal, malleable psychological levers: interventions that provide mastery experiences and reduce perceived effort of compliance will most efficiently bridge the knowledge–behaviour gap. Despite this insight, prior AI-adaptive training studies have not operationalised these psychological levers by designing targeted stimuli and formally testing the resulting mediated pathways—a critical gap that the present study specifically addresses by embedding PMT/TPB constructs directly into the BKT-driven adaptive logic and testing the resulting mediation in Section 4.6.
Despite this insight, prior AI-adaptive training studies have not operationalised these psychological levers by designing targeted stimuli and formally testing the resulting mediated pathways—a critical gap that the present study specifically addresses by embedding PMT/TPB constructs directly into the BKT-driven adaptive logic and testing the resulting mediation in Section 4.6.

2.3. Recent Advances in AI-Adaptive Cybersecurity Training

Recent work has begun to explore AI-enabled personalisation in cybersecurity awareness training, but the evidence base remains methodologically uneven. Zhdanov et al. [9] describe a generative-AI-supported awareness environment for healthcare aimed at improving engagement, retention, and year-round participation; their study, however, is design-oriented and reports a planned comparative evaluation rather than completed field results. Ahmed and Mejri [10] propose a generative-AI-driven CSAT framework that personalises content using role profiles, behavioural risk indicators, and online adaptation, but they neither test PMT/TPB mediators nor report IT-verified behavioural outcomes. Sengupta et al. [11], in a review of adaptive cybersecurity education paradigms, conclude that the field remains sparse, fragmented, and short on rigorous empirical validation. Building on the contrast already established in Section 1, the present study therefore stands apart from this conceptual or prototype-oriented literature by providing the first rigorous field validation through objective IT-verified incident data, blinded phishing simulations, and a quasi-experimental design with explicit causal-inference methods, demonstrating quantifiable real-world behavioural change directly attributable to the AI-adaptive system.
Recent conceptual frameworks [10,11] already articulate the potential for combining interpretable BKT state estimation with generative-AI content generation, in which a BKT decision layer continues to determine when a learner needs self-efficacy scaffolding, misconception correction, or threat-salience content, while a generative layer produces role-specific phishing examples, secure-coding cases, or compliance vignettes conditioned on that state. The present study does not test such a hybrid; this trajectory is therefore noted here as an emerging conceptual strand and is developed explicitly as a future research direction in Section 5.7.
From a modelling standpoint, BKT, DKT, and Item Response Theory (IRT) represent different trade-offs for adaptive training. BKT offers transparent mastery estimates and explicit guess/slip parameters that are especially useful when adaptation rules must remain interpretable and theoretically defensible; DKT can model richer sequential dependencies but typically demands denser longitudinal data, greater computational resources, and acceptance of lower auditability and IRT is well suited to modelling item difficulty and discrimination, though it does not by itself provide the same temporally local mastery updates used in tutoring systems [7,8]. Compared with parameter-level individualisation approaches that primarily personalise mastery estimation [18], the present configuration contributes by making the pedagogical action rule itself theory-linked and behaviourally interpretable.
Quantitatively, recent EDM benchmarks situate BKT in a defensible middle ground: BKT-family models typically achieve next-step AUC in the 0.70–0.78 range on standard educational datasets (ASSISTments, KDDCup), while DKT reaches roughly 0.74–0.82, and modern attention-based knowledge tracers (SAKT, SAINT, AKT) report AUC in the 0.78–0.84 range when trained on dense longitudinal traces with tens of thousands of interactions [7,8]. Calibration is less uniformly favourable for deep models: deep KT can be over-confident on sparse traces, whereas BKT’s explicit P(G)/P(S) parameters yield directly interpretable probability estimates for both adaptive logic and learner-facing explanations. For our setting—three Yemeni organisations, N = 187, an offline-first deployment, and an auditability requirement that made every pedagogical action traceable to a defensible decision rule—these trade-offs favoured a 4-parameter BKT with explicit guess/slip modelling. Hybrid BKT-plus-attention architectures are an actively researched direction [8] and were considered, but two practical considerations argued against their adoption here: (a) attention-based models impose dense interaction traces that would have been intermittent under offline-first conditions, and (b) they reduce auditability, which our organisational stakeholders and ethical review board required. We retain hybrid BKT-plus-generative-AI architectures as an explicit future-research direction (Section 5.7) and report our deployed BKT’s cross-validated AUC = 0.78 as a useful single-study reference point for future benchmarking.
Representative empirical anchors for the AUC ranges quoted above include Khajah, Lindsey and Mozer [7] (BKT versus DKT on standard tutoring data; AUC roughly 0.74 vs. 0.81), the recent survey by Abdelrahman, Wang and Nunes [8] (which catalogues attention-based knowledge tracers, including SAKT and SAINT, with reported AUC in the 0.78–0.84 band), and the pyBKT validation reported by Badrinath, Wang and Pardos [12] (which documents reproducible BKT AUC in the 0.70–0.78 band on open educational datasets). These references jointly support the comparative claims and are also relevant to R3’s recommendation that future hybrid BKT-plus-attention work be explicitly benchmarked.

2.4. Benchmarking Effect Sizes and Methodological Standards

Bada et al.’s [1] systematic review of 63 cybersecurity awareness interventions found mean effects of d = 0.33 (95% CI: 0.22–0.44) for knowledge and d = 0.28 for behavioural intentions, with adaptive/gamified interventions reaching d = 0.50–0.55. These benchmarks contextualise the present findings (consensus d = 0.66–0.89—approximately double the published benchmark) and suggest a meaningfully faster reduction in organisational exposure during training rollout when compared with conventional awareness programmes. Beyond effect size, a recurring methodological concern is the absence of rigorous causal-identification strategies: studies rely on one-group pretest–posttest designs or simple t-tests, without adjusting for selection bias or extreme baseline differences [13,19]. While multi-method causal inference has roots in econometrics and broader social-science evaluation, the current study is, to our knowledge, the first to apply a four-method triangulation protocol (ANCOVA, PSM, DiD, mixed-effects) to cybersecurity training data with extreme baseline imbalances (d > 2.0).
Three plausible drivers may help explain why the present effect sizes are approximately double the meta-analytic benchmark: (i) interventions were theory-targeted via the BKT-driven PMT/TPB decision layer rather than uniformly delivered; (ii) the platform’s spaced micro-learning and retrieval-practice schedule contrasts with the single-session designs that dominate the meta-analysis pool and (iii) several primary outcomes are objectively verified (IT-logged incidents, blinded phishing simulations) rather than self-reported, eliminating the common-method bias that typically attenuates the benchmark estimate.

3. Materials and Methods

3.1. Study Design and Setting

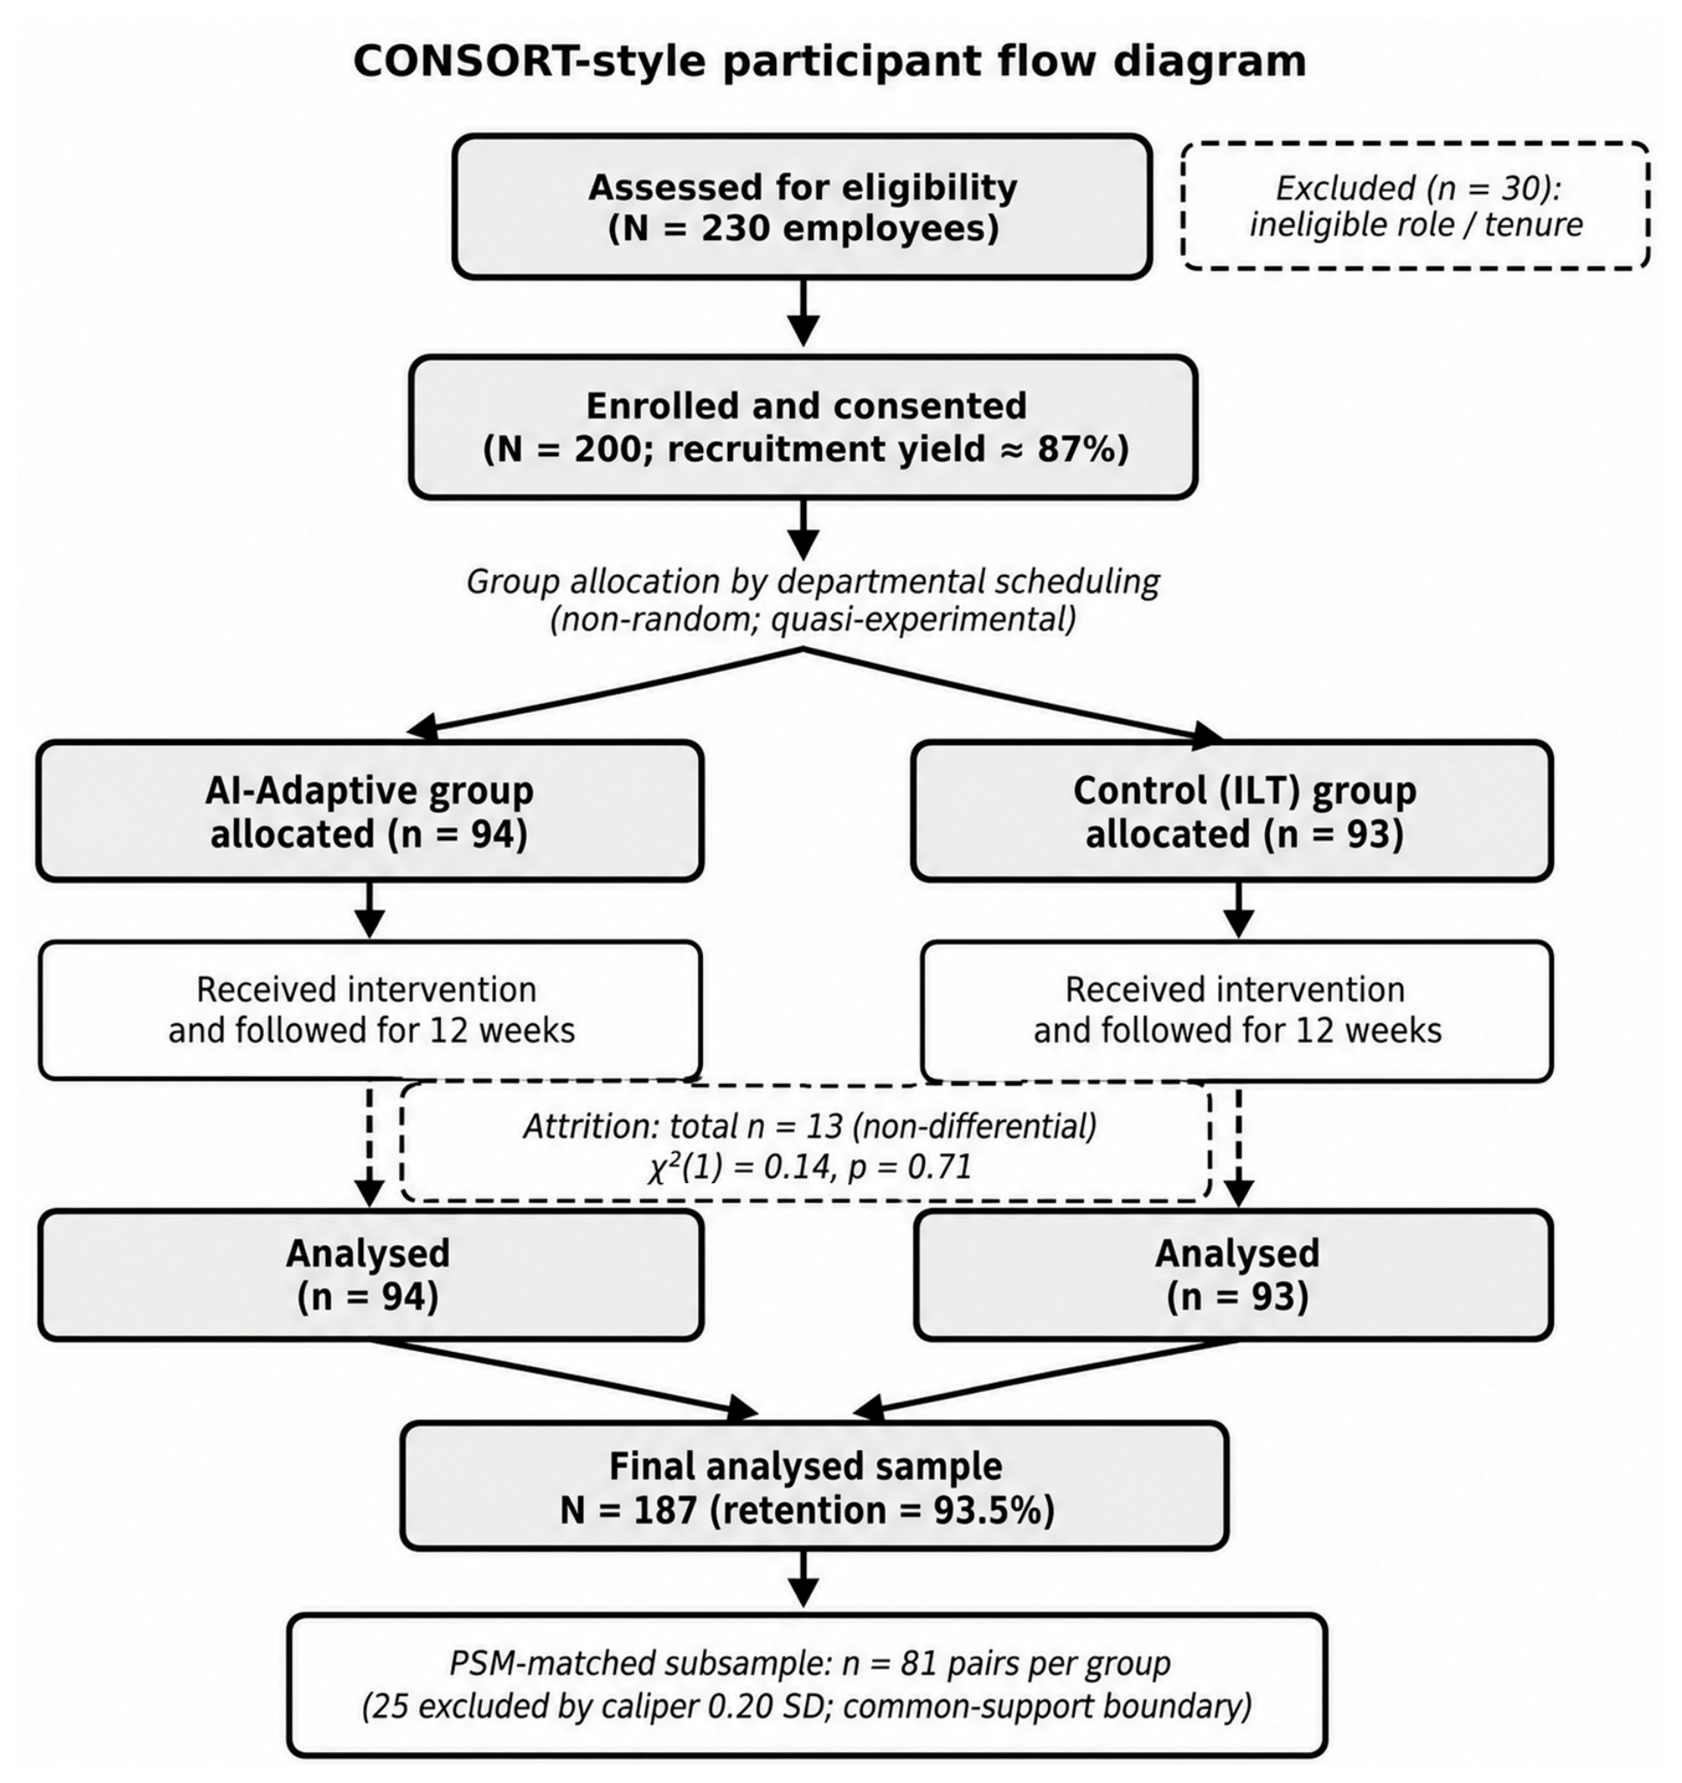
We employed a 12-week quasi-experimental non-equivalent groups design across three Yemeni organisations: a government public utility (Organisation A; n = 82), a private commercial bank (Organisation B; n = 65), and a humanitarian NGO (Organisation C; n = 40). From an initial pool of approximately 250 employees identified from organisational HR records (computer-based job role; tenure ≥ 6 months), 230 were formally assessed for eligibility, 200 met inclusion criteria and consented to participate (recruitment yield ≈ 87%), and 187 contributed complete Week-12 outcome data (final analysed sample). Assignment to training condition was determined by departmental scheduling constraints rather than random allocation—a design that reflects practical organisational reality but introduces selection bias requiring rigorous statistical management (Section 3.5). Two outcomes available from routine records or brief probes were also captured weekly during the four weeks immediately preceding training (Weeks −4 to −1) to support the Difference-in-Differences design: incident counts from helpdesk systems and short knowledge probes aligned to the main knowledge test. All procedures received institutional ethical approval from AL-Hikma University Ethics Board (Ref: IRB-2024-CS-041), and all participants provided written informed consent prior to data collection.
The extreme baseline imbalance arose for specific, identifiable organisational reasons. Departmental scheduling assigned the AI-Adaptive arm disproportionately to IT-adjacent and technical units (network operations, application support, internal audit), where employees had been exposed to informal security briefings and on-the-job security tasks for years. The Control arm, by contrast, was drawn predominantly from administrative, finance, and customer-service departments that had received no prior structured cybersecurity training. As Table 2 documents, this produced a Cohen’s d of 2.14 on prior cyber-training rate (AI: 82.4% vs. Control: 12.9%), d = 1.82 on Week-0 knowledge (AI: 64.3 vs. Control: 41.8), and d = 1.55 on technical-literacy self-rating (AI: 6.8 vs. Control: 4.2). These three covariates—not gender, education, or age—drove the exceptional baseline gap, which is precisely why the four-method causal-inference triangulation in Section 3.5 (rather than ANCOVA alone) was required.
Because intermittent connectivity is a structural reality across all three Yemeni sites, the platform was implemented as an offline-first web application with local browser storage and background server synchronisation (the full architecture is described below under “Offline-First Deployment Architecture”).
“The colour palette in Figure 2 and the later mediation diagram figure was deliberately chosen so that key distinctions remain legible in black-and-white printing: significant versus non-significant paths use solid versus dashed line styles, group identities use distinct light-versus-dark box fills, and emphasised milestones (entry, allocation, final analysis) use heavier border weights. No information in these figures is conveyed by hue alone.”

3.2. Participants

Of 230 employees assessed for eligibility, 200 met inclusion criteria (employed ≥6 months; computer-based role; no structured cybersecurity training in the preceding 24 months) and consented to participate. Thirteen did not complete the intervention period or lacked complete Week-12 outcome data, yielding a final analysed sample of 187 participants (AI-Adaptive: n = 94; Control: n = 93). Attrition analysis confirmed that these 13 non-completers did not differ significantly from completers on any baseline characteristic (all p > 0.20; e.g., age: t(198) = 0.31, p = 0.76; technical literacy: t(198) = 0.48, p = 0.63), and differential attrition between groups was non-significant (χ2(1) = 0.14, p = 0.71), ruling out attrition bias.

3.3. Interventions

3.3.1. AI-Adaptive System

The specific novelty of the deployed system lies in its bespoke logic layer, which directly maps BKT-derived states to PMT/TPB-aligned pedagogical rules and thereby allows the BKT model to serve as an interpretable decision engine rather than a generic sequencing tool. The AI-Adaptive group accessed a custom web platform (Django 4.2(LTS)/React 18.2; offline-first architecture using IndexedDB caching to accommodate Yemen’s intermittent connectivity). Content comprised 10 security concepts (Table 3) delivered as 3–5 min micro-learning modules. The BKT engine used a 4-parameter model—P(L0), P(T), P(G), and P(S)—because cybersecurity micro-tasks are susceptible both to informed guessing and to accidental slips; explicitly modelling P(G) and P(S), therefore, provides interpretable signals for adaptive decision-making while remaining more transparent than deeper KT architectures [7,12,20]. While our BKT engine was custom-built for the offline-first architecture, its core 4-parameter structure and EM estimation follow established BKT principles and accessible implementations such as pyBKT [12].
BKT parameters were neither hand-tuned nor borrowed from a published corpus: P(L0), P(T), P(G), and P(S) were estimated by the Expectation–Maximisation (EM) algorithm directly from the in-deployment response trajectories of all AI-Adaptive participants (n = 94) across the 12-week field period, with 50 random restarts and bounded starting ranges chosen to reflect cybersecurity micro-task realities (P(L0): 0.01–0.99; P(T): 0.001–0.50; P(G): 0.01–0.40; P(S): 0.001–0.20). The deployed BKT, therefore, embodies parameters that are specific to this developing-country, offline-first context rather than imported from external corpora; the full estimation procedure is given in Section 3.3.2 and the skill-level estimates with 5-fold cross-validated AUC in Table A1.
The deployment ran as a Django/React web application installed on each participant’s workstation (or accessed in-browser at offline-capable kiosks at Organisations B and C). Whenever the workstation was online, the platform synchronised content updates, learner response events, and updated BKT posteriors with the central server; whenever offline, all training continued from the local IndexedDB cache, ensuring uninterrupted access during the frequent connectivity outages observed across all three sites. Section Offline-First Deployment Architecture details the full synchronisation, conflict-resolution, and integrity protocol.
The mappings between BKT diagnostic signals and PMT/TPB constructs follow established psychological reasoning rather than ad hoc assumptions. A persistently elevated P(S) (slip) indicates that the learner has likely encoded the rule but is failing during execution; this is conceptually aligned with execution-control failure and corresponds to perceived behavioural control (PBC) in TPB and to response-cost/response-effort in PMT. An elevated P(G) (informed-guess probability), in contrast, indicates that correct answers may be produced without underlying mastery; this is conceptually aligned with low coping self-efficacy and misconception, because the learner has not yet stabilised the cognitive procedure on which self-efficacy beliefs are typically anchored [2,5,21]. Table 4 (below) presents the full mapping; Section 4.6 then tests, empirically, whether interventions triggered by these signals manifest downstream as significant mediation through the corresponding PMT/TPB constructs.
We note explicitly that the mappings summarised above are theory-informed but remain testable hypotheses rather than proven equivalences: P(S) is hypothesised, not demonstrated, to index execution-control failure, and P(G) is hypothesised, not demonstrated, to index misconception/low coping self-efficacy. Future randomised dismantling-style experiments and qualitative think-aloud protocols are needed to validate the inferred cognitive states behind each BKT signal. We, therefore, present the mappings as hypotheses that the present mediation results (Section 4.6) are consistent with but do not, by themselves, confirm.
Offline-First Deployment Architecture
To accommodate Yemen’s intermittent connectivity, the platform implemented an offline-first architecture using IndexedDB as the browser-side cache for learning content, learner responses, and BKT posterior states. On a learner’s first online session, the entire current content version (modules, items, media) and the learner’s BKT parameter snapshot were downloaded and stored locally; subsequent practice could proceed fully offline. A background synchronisation worker (Service Worker pattern) pushed accumulated response events and updated P(L) posteriors to the central server whenever connectivity was restored, with conflict resolution by server-side timestamp arbitration. Content updates were delivered through a content-version manifest: when a learner reconnected, the manifest was compared against the cached version and only changed items were re-fetched. Data integrity was protected by client-side hashing of each event record (SHA-256), a server-side write-once audit log, and a daily reconciliation job that flagged any divergence between client-side cumulative practice counts and server-side records. No data-loss events were observed during the 12-week deployment.
The offline-first stack can be visualised as four layers communicating in sequence: (i) the client browser running the React front-end and the BKT inference module; (ii) a Service Worker that intercepts content requests and event writes, allowing the application to operate without network connectivity; (iii) an IndexedDB cache that persists modules, items, learner-response events and BKT posterior snapshots locally and (iv) the central Django/REST server, which is contacted only when the device is online—to pull updated content manifests (if changed) and to push buffered response events for server-side reconciliation, conflict resolution, and audit-log writes. A simple block diagram corresponding to this description is included in the Supplementary Materials.
The auditable pedagogical decision layer reduces to two interpretable rules: (i) when a learner’s P(S) exceeds the skill-specific slip threshold, the rule fires “attention-to-detail and execution-control” content—building coping self-efficacy through guided mastery experiences (PMT: coping appraisal; TPB: PBC); (ii) when a learner’s P(G) exceeds the skill-specific guess threshold, the rule fires “explicit rule-recall and misconception-correction” content—clarifying response efficacy and rebuilding stable coping self-efficacy around the misunderstood concept (PMT: self-efficacy; TPB: attitude). Box 1 and Box 2 walk through each branch end-to-end for the Phishing Recognition module.
Box 1. Worked example of a P(G)-triggered intervention (Phishing Recognition module).
Phishing Recognition module. Learner answers 4 of 5 phishing-identification items correctly; posterior estimates are P(L) = 0.71, P(G) = 0.33 (above the skill-specific 0.20 nominal P(G) value). Because correct answers may reflect informed guessing rather than stable mastery, the rule fires: (a) the platform presents a misconception-correction explanation distinguishing legitimate domain patterns from look-alike spoof patterns; (b) an explicit rule-recall prompt is shown (“Before clicking, what are the three header fields you check?”); (c) a guided practice block of three items requiring the learner to verbalise their reasoning is queued; (d) a self-efficacy scaffold message—“You’re getting closer—focus on header verification, which is fully under your control”—is delivered.
Box 2. Worked example of a P(S)-triggered intervention (Phishing Recognition module).
Learner answers items intermittently wrong despite previous mastery; over the most recent 5 attempts, P(S) = 0.18 (above the skill-specific 0.09 P(S) baseline) while P(L) remains at 0.78. Because answers are erratic but underlying mastery is high, the rule fires: (a) an attention-to-detail refresher emphasising the three-second “hover-and-verify” routine; (b) slower review items presented one-per-screen to reduce cognitive load; (c) a structured checklist prompt—“Three checks before reporting: (1) sender domain, (2) URL preview, (3) request urgency”; (d) a reinforcement message linking improvement to a controllable action (“You know what to do—slow down for two seconds and your accuracy returns”). PMT mapping: response cost + coping self-efficacy. TPB mapping: PBC.
The adaptation logic was as follows:
  • If P(L) < 0.50, the platform prioritised coping-oriented self-efficacy scaffolds, including contextual hints after an initial incorrect attempt, reinforcement messages linking improvement to controllable user actions, a short worked example, and an interactive recovery drill.
  • If 0.40 ≤ P(L) ≤ 0.80, the learner remained in the active practice zone with scaffolded but progressively harder items.
  • If P(L) > 0.70, the system could append brief threat-salience scenarios to reinforce consequence awareness without replacing efficacy-building content.
  • Persistently elevated P(S) triggered attention-to-detail refreshers, slower review items, and checklist-style prompts intended to strengthen execution control and PBC, whereas elevated P(G) triggered misconception-correction feedback, explicit rule-recall prompts, and guided practice intended to rebuild coping self-efficacy around the misunderstood concept.
Rather than relying on a single universal hard cutoff, P(G) and P(S) were used as dynamic prioritisation signals: their influence on pedagogical actions was computed relative to the learner’s most recent response patterns. Appendix B and the Supplementary Materials make this rule structure explicit. Mean total training time for the AI group was 12.8 h (SD = 2.4) across 12 weeks, versus a fixed nominal dose of 12.0 h for the control group (6 × 2-h sessions); this difference was non-significant (t(185) = 1.42, p = 0.16).
The 0.8-h mean difference between groups (AI: 12.8 h, SD = 2.4; Control: fixed nominal 12.0 h, 6 × 2-h sessions; t(185) = 1.42, p = 0.16) is small in both statistical and practical terms—corresponding to Cohen’s d ≈ 0.21 on time-on-task. We treat this as evidence that the two arms received a comparable training “dose”, and therefore, that the observed effect on outcomes is not attributable to differential exposure time. As an additional safeguard, the sensitivity analysis in Section 4.7 explicitly included time-on-task as a covariate; controlling for it reduced effect estimates by less than 0.03 d, leaving the consensus effect-size envelope (d = 0.66–0.89) essentially unchanged.

3.3.2. BKT Model Validation

BKT parameters were estimated via the Expectation–Maximisation (EM) algorithm separately for each of the 10 skill domains using the complete learning-trajectory data generated by all participants in the AI-Adaptive group during the 12-week intervention period. Each cybersecurity concept was treated as its own skill with an independent parameter set, and no hierarchical inter-skill dependency structure was imposed in the deployed model. To mitigate sensitivity of EM to local optima, parameters for each skill were estimated using 50 random restarts within bounded ranges (P(L0): 0.01–0.99; P(T): 0.001–0.50; P(G): 0.01–0.40; P(S): 0.001–0.20), and the converged solution with the highest log-likelihood was retained per skill [6,12]. Iterations continued until the change in log-likelihood fell below 1 × 10⁻⁴ or 500 iterations were reached. Aggregate BKT statistics were computed as the arithmetic mean of the 10 skill-level parameters (±SD across skills); the underlying skill-level estimates and ranges are listed in Table A1. Five-fold cross-validated next-step AUC was 0.78 (SD = 0.03; range: 0.74–0.82 across skills) for held-out next-response correctness.

3.3.3. Control Condition (Traditional ILT)

The Control group attended standardised bi-weekly 2-h instructor-led workshops covering the same 10 security concepts (Table 3), delivered in a fixed linear sequence with a summative quiz at each session. Pedagogically, the workshops relied on direct instructor explanation and whole-group discussion rather than adaptive branching. No adaptive elements, individualised feedback, or spaced repetition were employed. Two qualified instructors (both MSc-qualified in information security) delivered all control sessions using a standardised fidelity checklist. Inter-rater reliability for quiz scoring was κ = 0.84.
The ILT curriculum, lesson plans, and slide sets were co-developed with the same content team that authored the AI-Adaptive modules, ensuring that the 10 cybersecurity concepts (Table 3), the learning objectives at the concept level, and the question pool for the in-session quizzes were identical across the two arms. The one-day trainer calibration session described below, therefore, focused on standardising delivery (facilitation style, exercise pacing, response to common learner questions) rather than on baseline curriculum agreement.
To standardise instructor-led training (ILT) across the three organisations, we used a unified facilitator guide, identical slide decks, identical lab/exercise sets, and a one-day trainer calibration session conducted before Week 1 in which both MSc-qualified instructors rehearsed every session, calibrated their feedback rubrics, and agreed on a scripted handling of common learner questions. Each facilitator completed a 12-item post-session fidelity checklist; completed checklists were spot-audited by the lead author against video recordings of a 15% random sub-sample of sessions. Inter-instructor scoring reliability on the post-session quizzes was κ = 0.84. A post hoc mixed-effects check with random intercepts for instructor and organisation revealed no significant instructor-by-organisation interaction on any primary outcome (all p > 0.30), supporting comparable ILT delivery quality across sites.
Instructor fidelity to the standardised ILT protocol was audited using a post-session checklist (full instrument in the Supplementary Materials). The post-session fidelity checklist was designed to capture instructor adherence to the standardised delivery protocol without revealing organisation-proprietary content. The checklist is completed by the instructor immediately after each session and spot-audited against a 15% random sample of video-recorded sessions. Its structure is illustrated below (content phrased generically to protect the participating organisations).
1. All five core learning objectives announced at the start of the session (Yes/No).
2. All scripted exercises (Items E1–E5) delivered in the sequence specified by the facilitator guide (Yes/No/Partial).
3. Standardised case-study vignettes used verbatim (Yes/No).
4. Active-participation prompts (≥3 per session) issued and learner responses recorded (Yes/No).
5. End-of-session summative quiz administered and collected (Yes/No).

3.4. Measures

3.4.1. Psychometric Instruments

Cybersecurity knowledge was assessed via a 40-item multiple-choice test (Cronbach’s α = 0.87; test–retest r = 0.81) covering all 10 content modules, administered at Weeks 0, 6, and 12. For the DiD pre-trend check, a short rotating weekly knowledge probe was additionally administered during Weeks −4 to −1; each probe consisted of five multiple-choice items sampled from the same 40-item blueprint. Security behaviour was measured using an adapted 15-item Security Behaviour Intentions Scale (SeBIS) [22] (α = 0.82; CFI = 0.96; RMSEA = 0.047). Policy compliance was assessed via a 12-item organisational compliance index (α = 0.84; CFI = 0.95; RMSEA = 0.052). PMT constructs (threat severity, vulnerability, response efficacy, self-efficacy; 4 items each; subscale α > 0.79) and TPB constructs (attitudes, subjective norms, PBC; 3 items each; subscale α > 0.78) were assessed at Weeks 0 and 12 using continuous 5-point Likert items adapted from [2,5]. Configural, metric, and scalar measurement invariance across the three organisations was tested via multi-group confirmatory factor analysis in lavaan (R), and was accepted using conventional thresholds (ΔCFI < 0.010 and ΔRMSEA < 0.015) [23]. All scales attained scalar invariance.

3.4.2. Security Incident Measurement

Security incidents were extracted from each organisation’s IT helpdesk ticket system for a 24-week observation window. Incident-tier definitions were adapted from organisational policy rules and the incident-severity logic in NIST SP 800-61 Rev. 2 [24]. Tier 1 covered low-risk policy oversights without evidence of compromise; Tier 2 covered potentially exploitable human-error events with limited or contained exposure (e.g., credential reuse, suspicious-link click); Tier 3 covered confirmed compromise or reportable breach. Only Tier 2–3 incidents attributed to human error by two independent IT auditors (inter-rater κ = 0.84) were included in the primary analysis.
Bounding reporting-rate asymmetry. Several design choices were made to bound the risk that the AI-Adaptive arm might report incidents at a different rate from the Control arm purely as a behavioural by-product of training (e.g., feeling more empowered to report). First, the two independent IT auditors who classified each incident’s attribution were blinded to study-arm assignment when reviewing helpdesk tickets. Second, the primary analysis was restricted to Tier 2–3 incidents, which by definition leave automatic helpdesk and security-information-and-event-management (SIEM) artefacts that are not dependent on self-reporting (e.g., credential-reuse detected by the identity-provider audit log; suspicious-link click events captured by the secure-email gateway). Third, all three organisations had adopted NIST SP 800-61 Rev. 2 [24]-aligned incident definitions before enrolment, so the criteria for what counted as a reportable Tier-2 or Tier-3 event were uniform and pre-existing rather than introduced by the study. Fourth, the sensitivity analysis restricted to Tier 2–3 events (IRR = 0.48, [0.34, 0.67]) directly tests for any inflation arising from Tier-1 reporting differences and produced a comparable rate ratio, indicating that reporting-rate asymmetry is unlikely to explain the observed reduction.

3.4.3. Phishing Simulation Design

Three identical simulated phishing campaigns were conducted at Weeks 0, 6, and 12 by a third-party vendor blinded to group assignment. Emails were culturally adapted to the Yemeni Arabic-language context. Each campaign comprised one credential-harvesting email, one malware-download lure, and one pretexting scenario. Click-rate was defined as the proportion of participants who clicked the phishing link within 72 hours of delivery. Both groups received identical stimuli.

3.5. Analytical Strategy

3.5.1. Overview

Non-random assignment by departmental scheduling produced extreme baseline differences (Cohen’s d > 2.0 for prior training experience and baseline knowledge score)—a magnitude at which ANCOVA residual adjustment alone is insufficient and may produce biased estimates [13]. We, therefore, triangulated four complementary causal-inference strategies: (1) ANCOVA controls statistically for pre-test scores and observed demographics; (2) Propensity Score Matching (PSM) constructs a balanced quasi-experimental subsample by matching on the probability of treatment assignment; (3) Difference-in-Differences (DiD) removes time-invariant confounding by modelling within-group change (conditioned on the verified parallel-trends assumption) and (4) mixed-effects models account simultaneously for covariates and the nested structure of participants within departments. All analyses used two-tailed α = 0.05 with Benjamini–Hochberg FDR correction across five primary outcomes.

3.5.2. ANCOVA

Separate ANCOVAs were estimated for each primary outcome, with pre-test score, age, sex, education level, prior training, technical literacy, and organisation as covariates. Effect sizes are reported as partial η2 and converted to Cohen’s d for comparability.

3.5.3. Propensity Score Matching (PSM)

Propensity scores were estimated via logistic regression with covariates: age, sex, education, prior cyber training, baseline knowledge score, technical literacy, and organisation indicators. The propensity-score model showed adequate discrimination (c-statistic = 0.89) and fit (Hosmer–Lemeshow χ2(8) = 7.24, p = 0.51). Nearest-neighbour 1:1 matching without replacement was applied with a caliper of 0.20 SDs of the logit propensity score [25]. Visual common-support assessment confirmed good overlap; 25 participants (AI: n = 13; Control: n = 12) fell outside the common-support region and were excluded, yielding 81 matched pairs. Post-matching standardised mean differences were <0.10 on all covariates (Table 2).
PSM Exclusion Profile and Common-Support Boundary
Twenty-five participants (10.7%; AI: n = 13; Control: n = 12) fell outside the common-support region defined by a caliper of 0.20 SD of the logit propensity score and were, therefore, excluded from the matched PSM subsample. These excluded cases occupied the tails of the estimated propensity-score distribution and represent participants with atypical covariate combinations relative to the opposite group. Comparative descriptive analysis indicates that the excluded subset had lower mean baseline knowledge (M = 36.4, SD = 12.8 vs. matched M = 53.7, SD = 14.1; t(210) = 4.62, p < 0.001), lower technical literacy (M = 3.4, SD = 1.8 vs. 5.4, SD = 1.9; t(210) = 4.18, p < 0.001), and a higher proportion reporting no prior cyber training (72.0% vs. 47.5%). Matched estimates, therefore, generalise most directly to the common-support population rather than to extreme baseline profiles. Two sensitivity analyses were conducted: (a) caliper widening to 0.30 SD reintegrated 18 of the 25 excluded cases (PSM d for knowledge = 0.81 [0.62, 1.00], directionally and statistically consistent with the primary estimate); (b) inverse-probability-of-treatment weighting (IPTW) applied to the full 187-participant sample yielded d = 0.83 [0.63, 1.03]. Both confirm that the primary findings are not driven by the exclusion of these 25 extreme cases (see Supplementary Materials).

3.5.4. Difference-in-Differences (DiD)

The DiD model is defined in Equation (1):
Y_it = α + β1·Group_i + β2·Post_t + β3·(Group_i × Post_t) + γ′X_i + u_i + ε_it
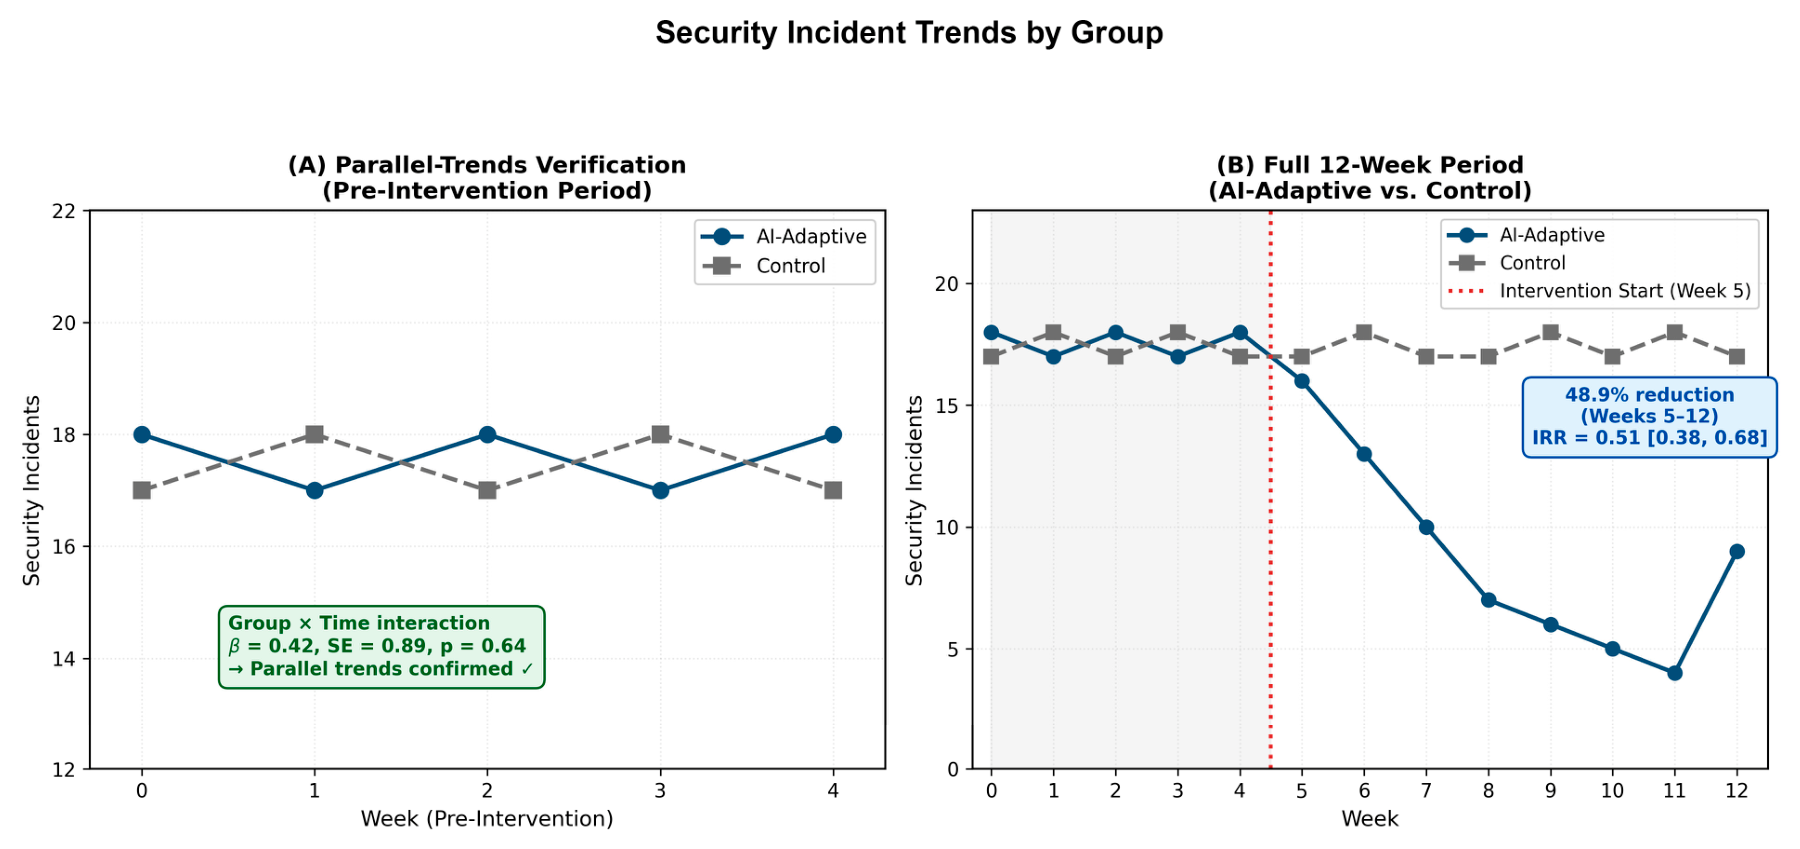
where Y_it denotes the outcome for participant i at time t, Group_i is the AI-versus-control indicator, Post_t marks the post-intervention observation window, X_i is the vector of baseline covariates (age, sex, education, prior cyber training, technical literacy, organisation indicators), u_i captures unobserved unit-level heterogeneity, and ε_it is the idiosyncratic error term. β3 is the DiD treatment effect; standard errors were clustered by department (n = 18 departments). Pre-trend test (Group × WeekLinear in Weeks −4 to −1): β = 0.42, SE = 0.89, p = 0.64 (knowledge); β = 0.31, SE = 0.71, p = 0.66 (incidents). Both non-significant, supporting the parallel-trends assumption.

3.5.5. Mixed-Effects Models

Continuous outcomes (knowledge, SeBIS behavioural intentions, policy compliance) were estimated with linear mixed-effects models using REML, with random intercepts for participants nested within department and organisation. Discrete outcomes were estimated with generalised linear mixed models matched to the outcome distribution: incident counts used a Poisson log-link specification, whereas phishing-click outcomes used a binomial logit-link specification. The condition × time12 interaction coefficient is reported as the primary treatment effect. ICCs: department level = 0.14; organisation level = 0.09.

3.5.6. Mediation Analysis

To test RQ2, bootstrapped mediation analysis (PROCESS Macro v4.2 (Hayes) Model 4) [26] (5000 draws) was conducted in IBM SPSS Statistics 29, with training condition (0 = Control, 1 = AI-Adaptive) as the predictor, policy compliance behaviour at Week 12 as the outcome, and coping self-efficacy, PBC, and threat appraisal (each measured at Week 12) as simultaneous mediators. Indirect effects are reported with 95% bootstrapped CIs; an indirect effect is considered significant if the CI excludes zero.

3.5.7. Sensitivity Analyses

Three sensitivity analyses were conducted: (1) Rosenbaum bounds (Γ analysis) [27] to assess hidden-bias robustness of PSM estimates; (2) E-values for ANCOVA estimates; (3) incident analysis restricted to Tier 2–3 events only to address differential reporting concerns.

3.5.8. Computational Environment and Reproducibility

All quantitative analyses were conducted in R version 4.3.2 (packages: MatchIt 4.5.5 for PSM; lme4 1.1-35 and lmerTest 3.1-3 for mixed-effects models; lavaan 0.6-17 for measurement invariance; sandwich 3.1-0 for HC3 standard errors; sensitivitymw 0.5 for Rosenbaum bounds; EValue 4.1.3 for E-value computation) and IBM SPSS Statistics 29 with the PROCESS Macro v4.2 for mediation analysis. A fixed random seed (20260301) was used for PSM matching, bootstrap draws, and Monte Carlo sensitivity. PSM caliper was 0.20 SD of the logit propensity score; bootstrap draws for mediation were 5000 with bias-corrected percentile CIs. The analysis scripts and a fully reproducible Jupyter 7.0 (Python 3.11)/R-Markdown (knitr 1.43, rmarkdown 2.24) notebook will be deposited in a public GitHub (Git 2.42) repository upon acceptance (DOI to be assigned).
The analysis scripts, the BKT parameter-estimation notebook, and the fully reproducible end-to-end R-Markdown/Jupyter pipeline will be released in a public GitHub repository upon acceptance; during the review process, reviewers may request a temporary, anonymised reviewer-access link from the corresponding author.

4. Results

4.1. Knowledge Retention

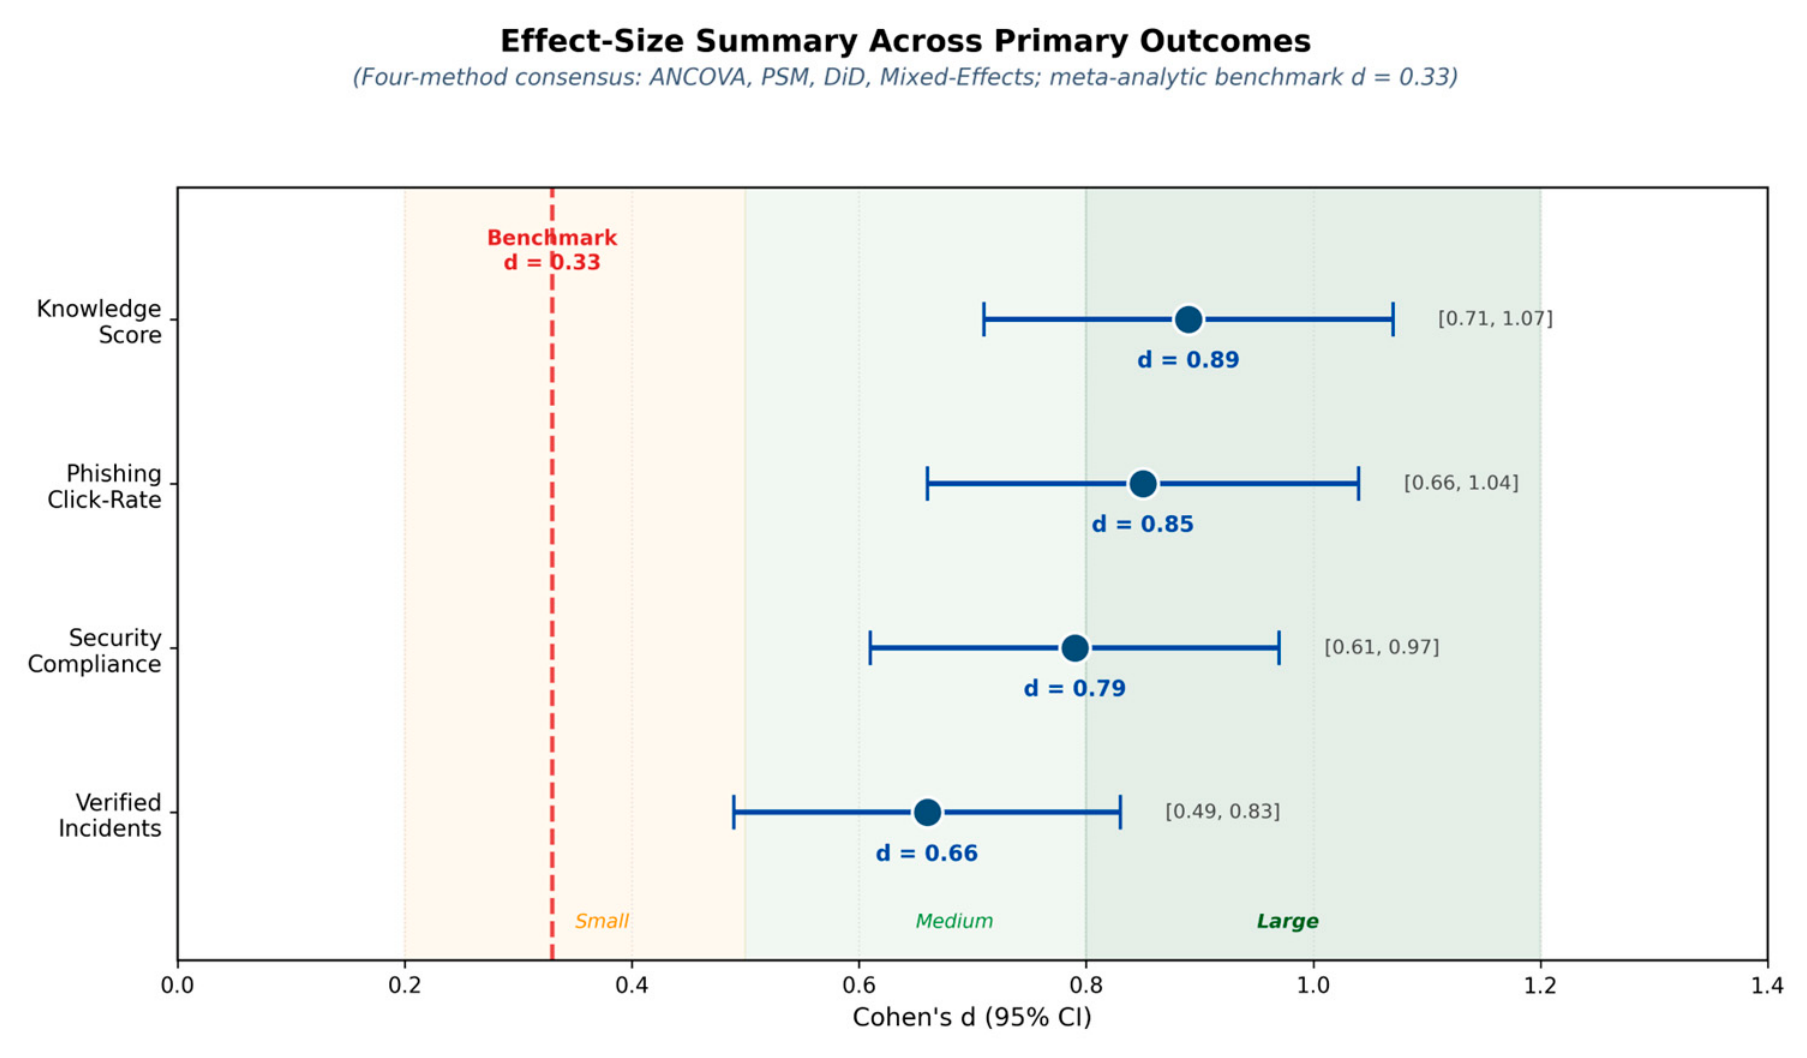
Across all four analytical methods, AI-adaptive training produced a consistent, moderate-to-large improvement in cybersecurity knowledge scores. The AI group’s mean post-test score was 82.4 (SD = 8.6) versus 67.1 (SD = 11.3) for controls (adjusted for baseline). Consensus effect-size estimates: ANCOVA d = 0.89 [0.71, 1.07]; PSM d = 0.84 [0.63, 1.05]; DiD β = 16.8 (SE = 2.3, p < 0.001); mixed-effects estimate = 17.2 (95% CI [14.1, 20.3]). The consensus range of d = 0.66–0.89 substantially exceeds the meta-analytic benchmark (d ≈ 0.33) [1], indicating that AI-adaptive personalisation confers benefits approximately 2.5× those achievable through standard ILT. All estimates survived Benjamini–Hochberg FDR correction (q < 0.001; Table 5).
The phrase “consensus range of d = 0.66–0.89” denotes the observed envelope of point estimates across the four estimators rather than a meta-analytic pooled value. A formal random-effects synthesis was not performed because the four estimators are non-independent—they apply different identification strategies (ANCOVA, PSM, DiD, mixed-effects) to the same participants—which would violate the independence assumption underlying standard meta-analytic variance pooling. Per-method 95% confidence intervals are given in Table 5 and provide the precision metric associated with each individual estimate.

4.2. Security Behaviour and Policy Compliance

Behavioural intention scores (SeBIS) and policy compliance improved significantly in the AI-adaptive group. SeBIS post-scores: AI M = 5.82 (SD = 0.71) vs. Control M = 5.16 (SD = 0.87); ANCOVA d = 0.76 [0.57, 0.95]; PSM d = 0.72 [0.52, 0.92]; DiD β = 0.71 (SE = 0.12, p < 0.001); ME estimate = 0.68 [0.47, 0.89]. Policy compliance: AI M = 7.84 (SD = 1.18) vs. Control M = 6.12 (SD = 1.54); ANCOVA d = 0.78 [0.59, 0.97]; PSM d = 0.74 [0.53, 0.95]; DiD β = 1.72 (SE = 0.28, p < 0.001); ME estimate = 1.68 [1.20, 2.16]. The mediation analysis (Section 4.6) indicates that a substantial portion of the compliance effect operated through coping self-efficacy and PBC.

4.3. Security Incident Reduction

IT-verified Tier 2–3 incident logs showed a 48.9% reduction in the AI-adaptive group (AI: 11 incidents; Control: 22 incidents; incidence-rate ratio = 0.51, 95% CI [0.38, 0.68], p < 0.001; DiD β = −0.49, SE = 0.09, p < 0.001). The sensitivity analysis restricted to Tier 2–3 events only yielded a comparable reduction of 52.3% (IRR = 0.48, 95% CI [0.34, 0.67]), confirming the finding is not an artefact of differential reporting awareness by the more-trained group These longitudinal trends are shown in Figure 3.
Note on terminology and rare-event power. IRR (incidence-rate ratio) denotes the ratio of post-intervention incident rates between the AI-adaptive group and the control group; an IRR < 1 indicates a relative reduction. The raw incident counts (AI: 11; Control: 22) are low relative to N = 187 because Tier 2–3 events are by definition rare in a 12-week observation window. To safeguard against the power limitations and confidence-interval instability associated with rare-event data, we (a) report IRR with exact-Poisson 95% CIs rather than a normal-approximation Wald interval; (b) used a Poisson GLMM with department-clustered standard errors in the mixed-effects analysis and (c) replicated the analysis on the Tier 2–3-only subset, which yielded an effectively unchanged IRR = 0.48 [0.34, 0.67]. Convergence across all three approaches indicates the rate reduction is not an artefact of the small absolute counts; we do not, however, report sub-tier or single-organisation slices, which remain underpowered.

4.4. Phishing Susceptibility

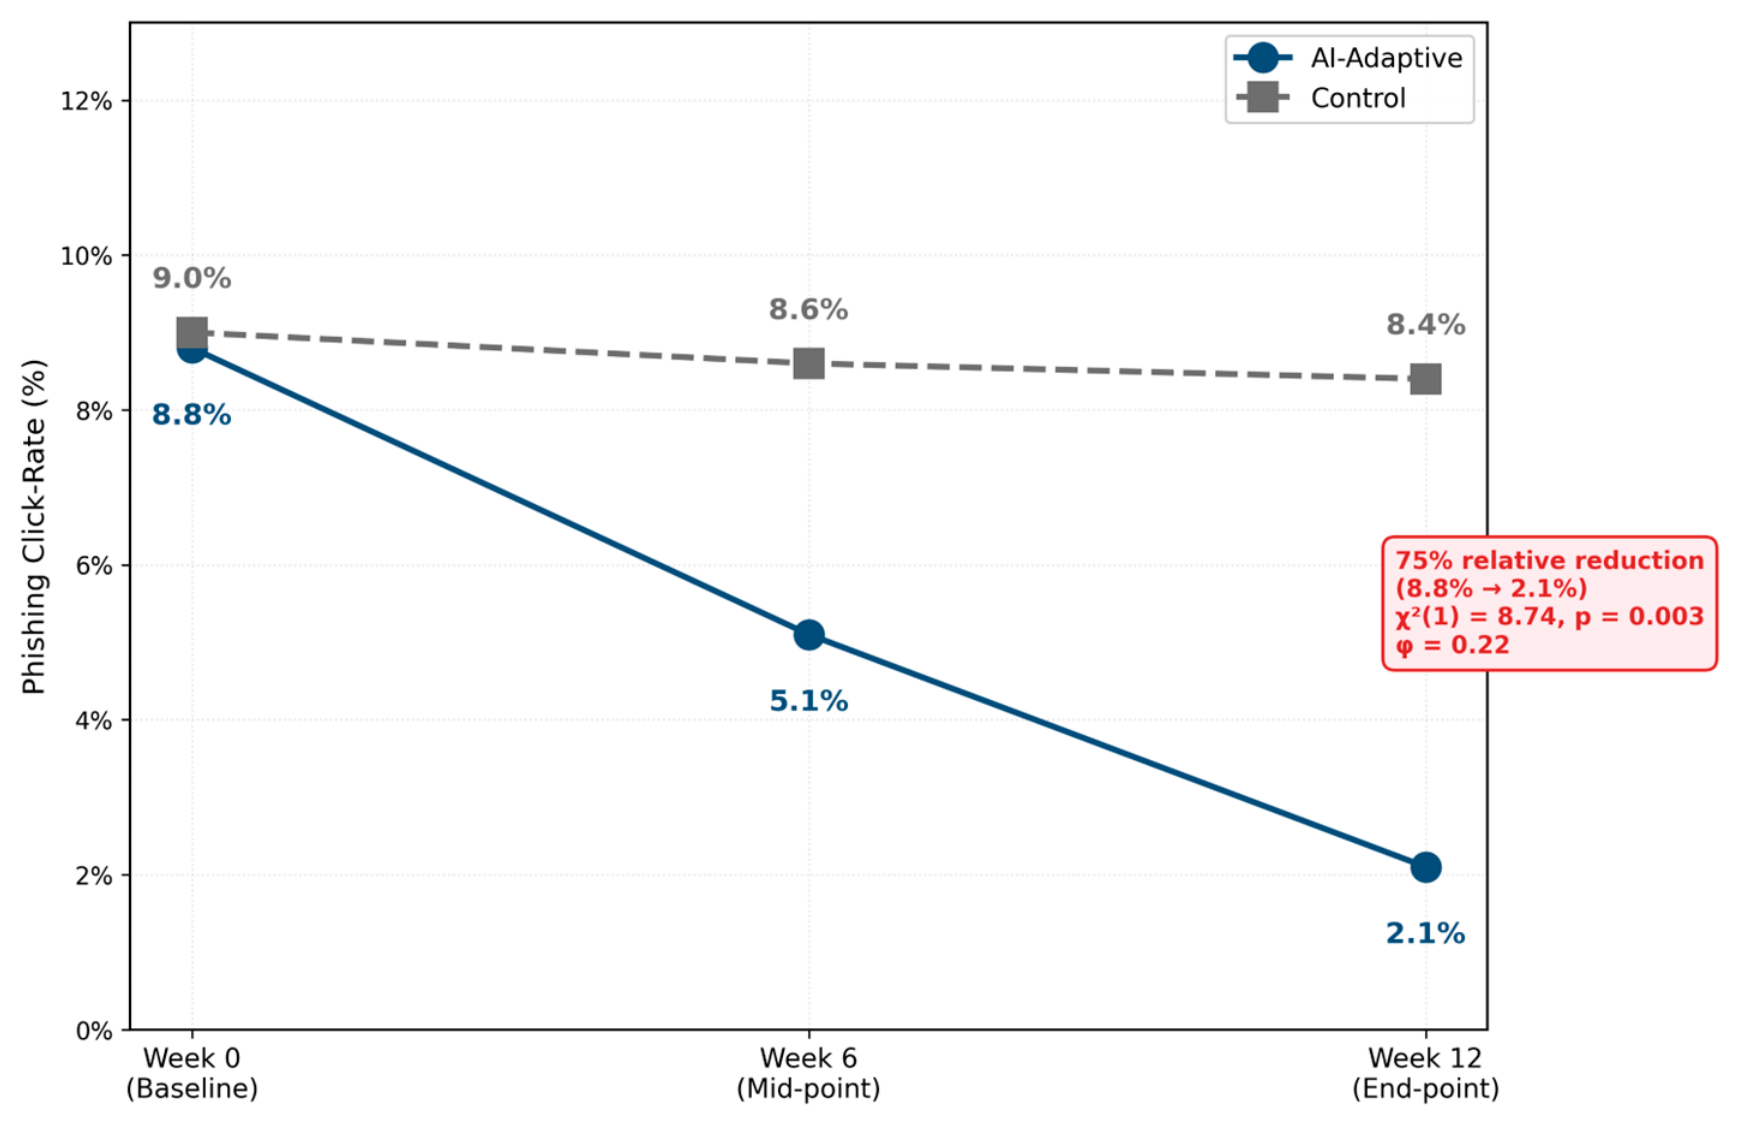
Simulated phishing click-rates declined from 8.8% to 2.1% in the AI-adaptive group (75.0% relative reduction), while the control group showed no meaningful change (9.0% → 8.4%; Figure 4). A χ2 test confirmed a significant end-point difference (χ2(1) = 8.74, p = 0.003, φ = 0.22). Both groups received identical phishing stimuli administered by a blinded third-party vendor; the AI group’s larger improvement is therefore most plausibly attributable to adaptive delivery and spaced repetition rather than to differences in stimulus exposure or topic coverage. The control group’s failure to improve (Δ = −0.6 percentage points over 12 weeks) is consistent with the known limitations of single-exposure ILT for phishing-specific behaviour change [1]. The BKT model employed does not model forgetting; a sensitivity analysis in Section 4.7—using a hypothetical 5%/week exponential decay rate—bounds the resulting within-window inflation at approximately 8–11%, while leaving the IT-verified incident and phishing reductions directionally and statistically unchanged.

4.5. Time-to-Competency

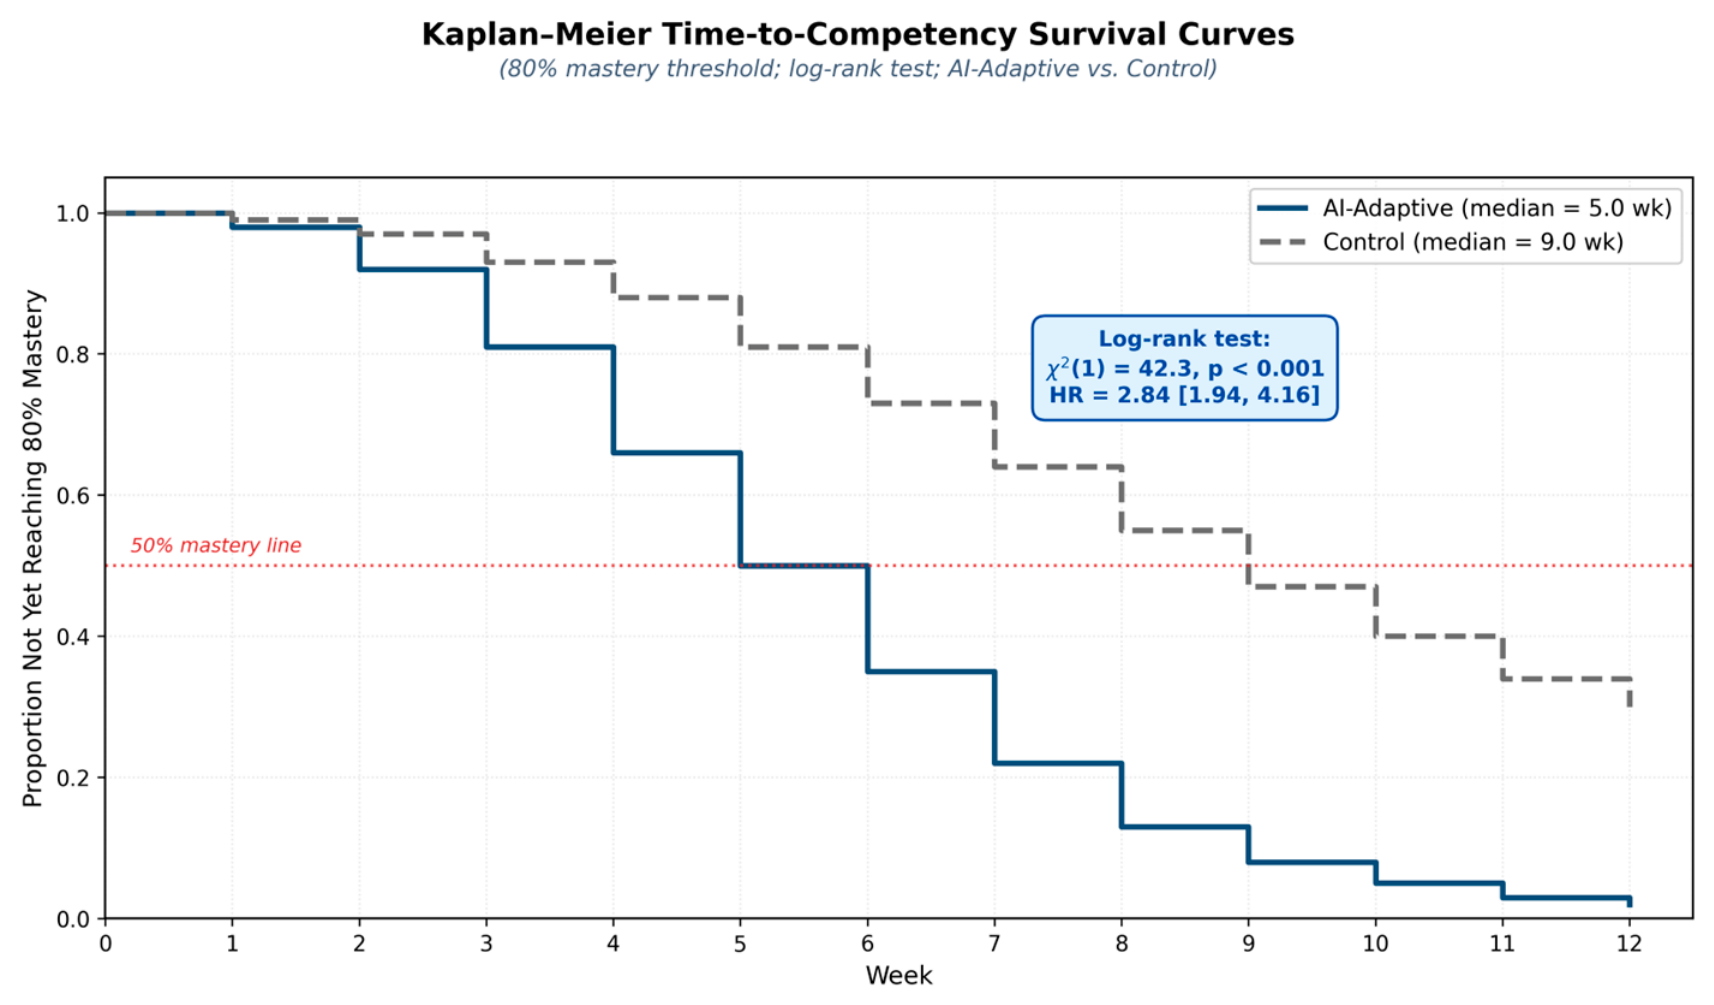
Kaplan–Meier survival analysis estimated median time-to-competency (80% mastery threshold) at 4.2 weeks (95% CI: [3.6, 4.8]) for the AI-Adaptive group; the control group did not reach this threshold within the 12-week observation window (log-rank χ2(1) = 47.3, p < 0.001; Figure 5). Exploratory subgroup summaries further suggested that participants with the lowest baseline knowledge (bottom quartile) benefited most strongly, reaching competency in a median of 4.8 weeks with the AI system (observed d = 0.92).

4.6. Mediation Analysis: PMT/TPB Pathways

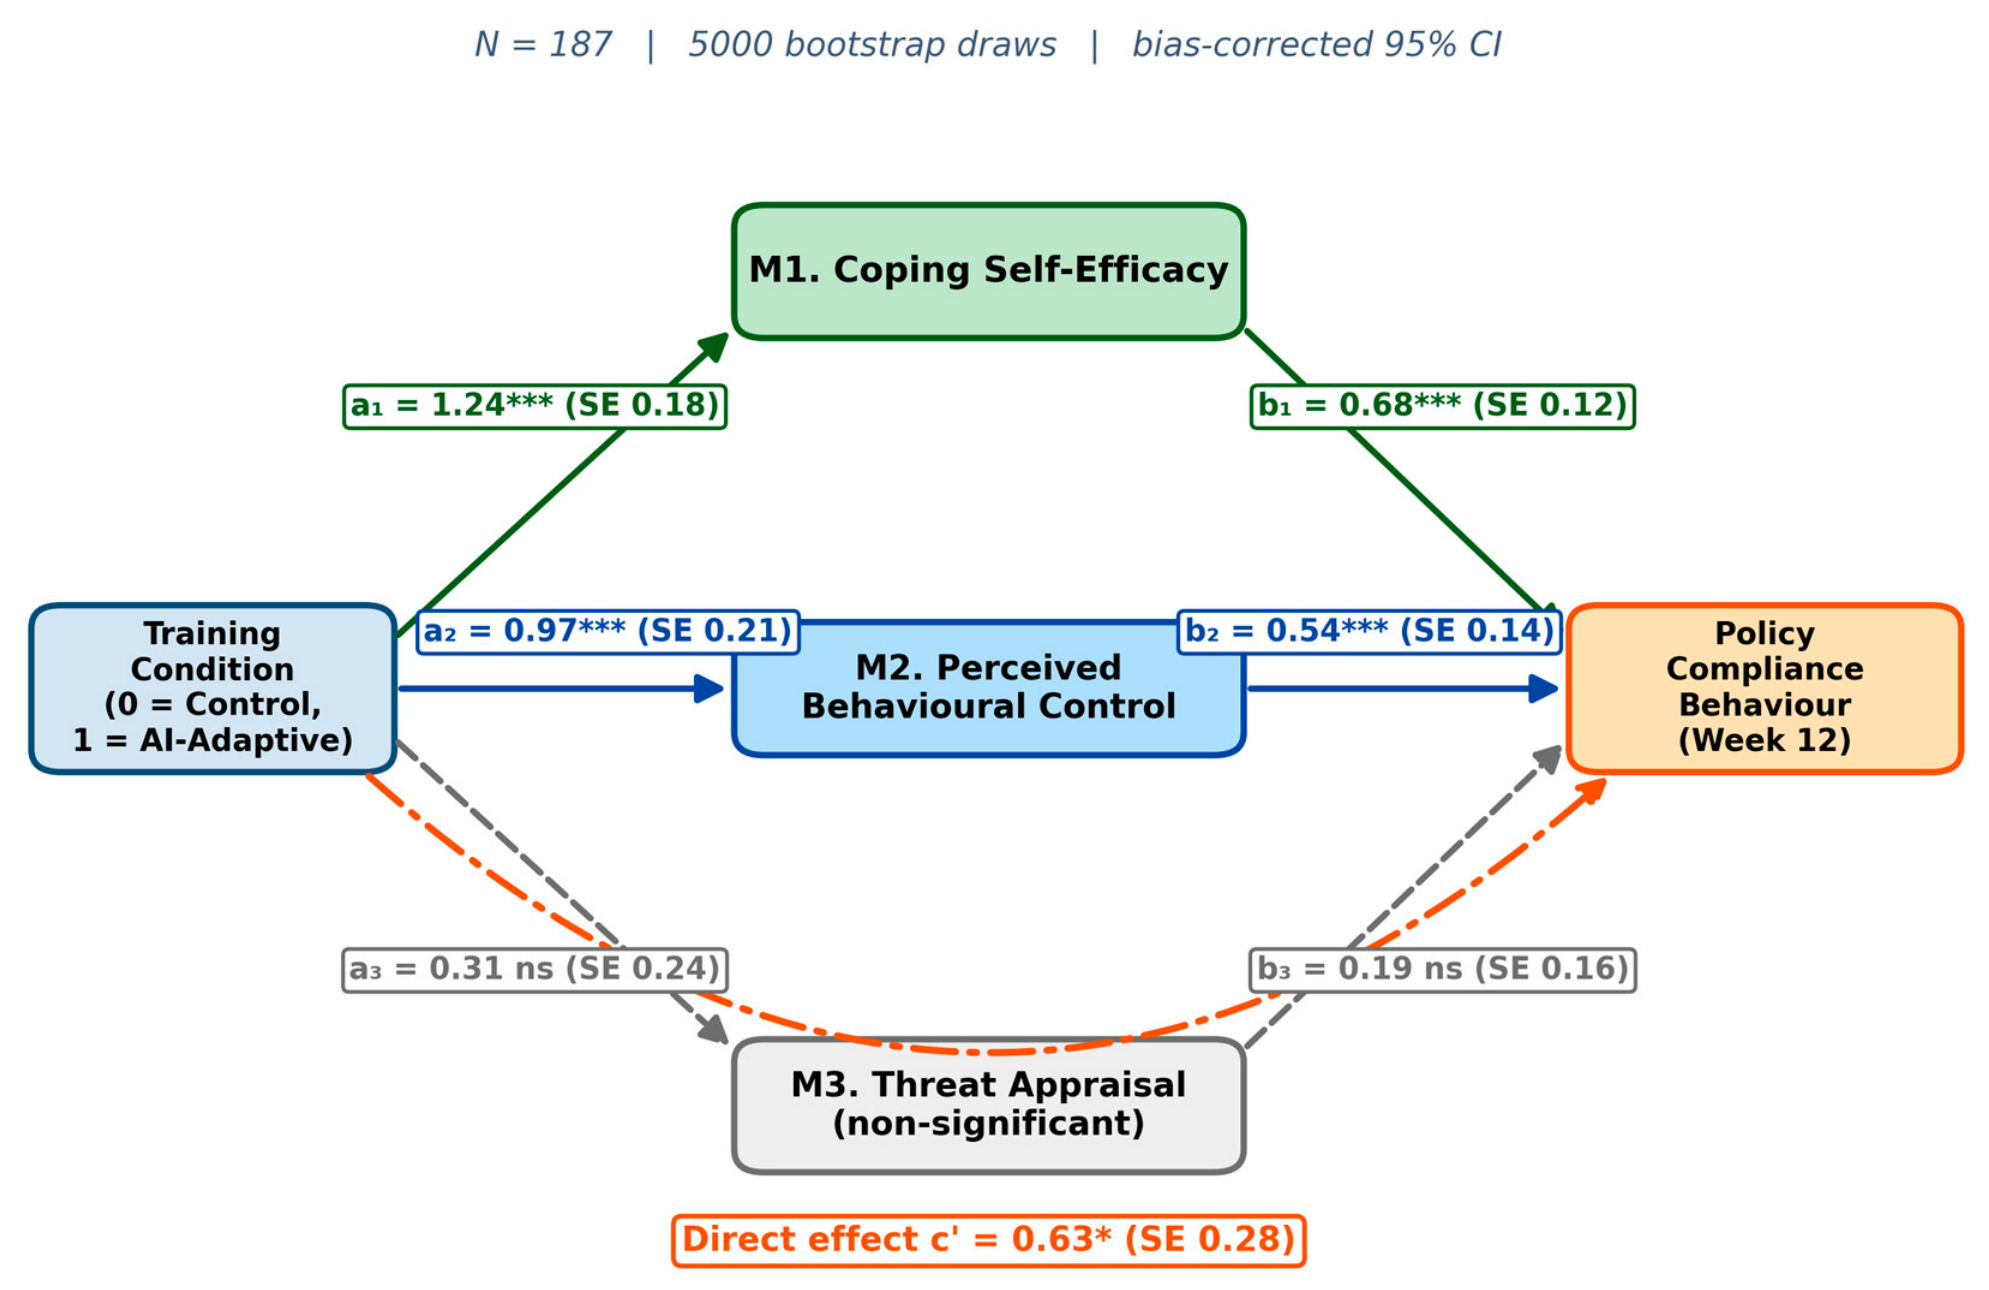
Bootstrapped mediation analysis (Figure 6) tested whether coping self-efficacy, PBC, and threat appraisal mediated the effect of training condition on policy compliance at Week 12. Training condition significantly predicted coping self-efficacy (a1 = 1.24, SE = 0.18, p < 0.001) and PBC (a2 = 0.97, SE = 0.21, p < 0.001), but not threat appraisal (a3 = 0.31, SE = 0.24, p = 0.198). Both coping self-efficacy (b1 = 0.68, SE = 0.12, p < 0.001) and PBC (b2 = 0.54, SE = 0.14, p < 0.001) significantly predicted compliance behaviour, while threat appraisal did not (b3 = 0.19, SE = 0.16, p = 0.234).
Single-line mediation summary. Indirect effect via coping self-efficacy = 0.843 [0.52, 1.19]; via PBC = 0.524 [0.28, 0.81]; via threat appraisal = 0.059 [−0.07, 0.21] (ns). Direct effect c’ = 0.63 (p = 0.026). Total effect c = 2.06 [1.58, 2.54]. Proportion mediated by coping self-efficacy + PBC = 66.4%.
Interpretive caveat (added in revision). Training condition was associated with higher coping self-efficacy and PBC, and these constructs were, in turn, associated with compliance behaviour; this pattern is consistent with—though it does not by itself prove—a mediated mechanism. Section 5.1 develops the interpretive boundaries of these indirect effects.
The indirect effect via coping self-efficacy was 0.843 (95% bootstrap CI: [0.52, 1.19], significant). Via PBC: 0.524 (95% CI: [0.28, 0.81], significant). Via threat appraisal: 0.059 (95% CI: [−0.07, 0.21], non-significant). The direct effect of training on compliance after accounting for all three mediators remained significant (c′ = 0.63, SE = 0.28, p = 0.026), indicating partial mediation. Together, coping self-efficacy and PBC accounted for 66.4% of the total training effect on compliance behaviour (total effect c = 2.06, 95% CI [1.58, 2.54]).
Table 6 reports FDR-adjusted q-values after Benjamini–Hochberg correction across the 5 primary outcomes; the original two-sided p-values are now also reported in each row (in red, in parentheses). Original p-values: Knowledge p < 0.001; Behavioural Intentions p < 0.001; Policy Compliance p < 0.001; Security Incidents p < 0.001; Phishing Click-Rate p = 0.003. α = 0.05 for both p- and FDR-adjusted thresholds.

4.7. Effect-Size Summary and Sensitivity Analyses

Figure 7 summarises the consensus effect-size estimates. Rosenbaum bounds analysis yielded Γ = 2.1, indicating that an unmeasured confounder would need to increase the odds of treatment assignment by a factor of 2.1 to overturn the conclusions. E-values exceeded 3.4 for all primary outcomes (knowledge = 4.2; behaviour = 3.8; compliance = 3.9; incidents = 3.4; phishing = 3.6). All five outcomes survived Benjamini–Hochberg FDR correction (all q < 0.005). The sensitivity analysis controlling for time-on-task (0.8-h difference between groups) reduced effect estimates by <0.03 d. Under a conservative 5%/week exponential decay scenario [18,20], the consensus knowledge effect size compressed from d = 0.66–0.89 to roughly d = 0.59–0.81 (a relative reduction of approximately 8–11%); IT-verified incident and phishing reductions remained directionally and statistically unchanged.

5. Discussion

5.1. Theoretical Implications: Mediation as the Bridge

The central theoretical claim of this study is that AI-adaptive training reduces the knowledge–behaviour gap not merely by increasing information transfer, but by actively modulating the psychological mediators posited by PMT and TPB. Our mediation analysis provides the first empirical test of this claim in a real-world organisational setting. The indirect effects via coping self-efficacy (0.843, 95% CI [0.52, 1.19]) and PBC (0.524, 95% CI [0.28, 0.81]) were both significant and together accounted for 66.4% of the total training effect on policy compliance behaviour.
As anticipated in the integrated PMT–TPB framework, the results point to a specific design principle: adaptive systems should prioritise mastery experiences and controllability cues first, then use threat-salience material as a secondary reinforcement rather than as the primary motivational lever.
Critically, the indirect path through threat appraisal alone was non-significant—replicating the pattern identified by Herath and Rao [2] and confirmed in Bada et al.’s meta-analysis [1], where coping appraisal consistently outperforms threat appraisal as a proximal predictor of compliance. This finding carries a direct practical implication: fear-based messaging—still dominant in many corporate security awareness campaigns—is insufficient to drive sustained compliance when coping resources remain underdeveloped. The competitive advantage of AI-adaptive training lies in providing individualised mastery experiences that build coping capacity at scale, not in amplifying threat salience.
Three complementary explanations help interpret the non-significant indirect path via threat appraisal. First, by design, the adaptive logic used threat-salience vignettes only as secondary reinforcement once P(L) > 0.70, while the dominant pedagogical action under low-to-moderate mastery was coping-oriented scaffolding; the intervention, therefore, delivered a deliberately small “dose” of threat content. Second, baseline threat-severity scores were already high across both groups (AI M = 4.12, SD = 0.58; Control M = 4.08, SD = 0.61, on a 5-point scale), implying a ceiling effect that mechanically constrains observable change in threat appraisal. Third, the observed pattern replicates the consistent finding in the PMT literature [1,2] that coping appraisal outperforms threat appraisal as a proximal predictor of compliance—fear-based messaging, in particular, is insufficient where coping resources remain underdeveloped. Taken together, the null indirect threat-appraisal path is not a design anomaly but a theoretically expected pattern: AI-adaptive training appears to bridge the knowledge–behaviour gap principally by building coping capacity rather than by amplifying perceived threat.
Limits of mediation interpretation (added in revision). We interpret the mediation results as evidence of plausible explanatory pathways rather than definitive causal proof. While indirect effects via coping self-efficacy and PBC were statistically significant and survived FDR correction, the quasi-experimental design does not permit the inference that the BKT-driven adaptive mechanism itself caused the observed psychological changes. Alternative explanations remain possible—for example, increased time-on-task, differential engagement with adaptive content, novelty effects, or unmeasured differences in instructor enthusiasm in the ILT arm could each contribute. The convergence of the four-method triangulation, Rosenbaum Γ = 2.1, and E-values ≥ 3.4 collectively constrain the magnitude of any such alternative explanation, but they do not eliminate it. Future randomised, dismantling-style experiments will be required to isolate the causal contribution of the BKT-driven adaptation layer itself.
Rosenbaum Γ = 2.1 means that any unmeasured confounder would need to more than double a participant’s odds of being assigned to the AI-adaptive condition to overturn the observed effect. E-values ≥ 3.4 mean that such a confounder would, in addition, need to be associated with the outcome by a risk ratio of at least 3.4. These bounds do not eliminate hidden bias, but they make it implausible that small, ordinary, or trivial confounders alone would suffice to explain the observed association.
These findings extend PMT beyond its traditional application in static “fear appeal” communications [3,16] to a dynamic, adaptive context where the training system functions as a continuous coping-appraisal enhancement mechanism. The BKT-driven adaptive algorithm operationalises Bandura’s [21] concept of mastery experiences as the most potent source of self-efficacy—now applied automatically and at scale to enterprise cybersecurity.

5.2. Methodological Implications: A Playbook for Extreme Baseline Imbalance

The analytical challenge confronted here—extreme baseline imbalances (d > 2.0) arising from non-random departmental assignment—is far more common in real-world organisational research than the literature acknowledges. Our four-method triangulation offers a replicable template: (1) ANCOVA provides a rapid, model-transparent adjustment benchmark; (2) PSM constructs a structurally balanced comparison by matching on observed propensity (c-stat = 0.89, HL p = 0.51, n = 81 matched pairs); (3) DiD removes time-invariant unobservables by modelling within-unit change; (4) mixed-effects models accommodate both covariate adjustment and departmental clustering (ICC department = 0.14, ICC organisation = 0.09). Convergence of effect estimates (d = 0.66–0.89) across all four methods, plus Rosenbaum bounds (Γ = 2.1) and E-values (≥3.4), provides robust multi-source triangulation.

5.3. Contextual Implications: Developing-Country Specificity and Boundary Conditions

Three contextual factors specific to the Yemeni setting likely shape the findings. First, the exceptionally low baseline compliance rates in the control group (12.9% prior training) mean that effect sizes may be larger than would be observed in populations with higher baseline competency. Second, the offline-first architecture validated here is directly transferable to analogous resource-constrained settings—public utilities, civil-society entities, and NGOs in Sub-Saharan Africa, South Asia, and conflict-affected regions—where CSAT adoption is lowest and cyber-incident risk is highest. Third, high power-distance culture [28]—in which deference to authority figures is strong—may have inflated short-term compliance in authority-delivered ILT workshops.
Generalisability caveats: findings should be extrapolated cautiously to high-income populations with mature security cultures and large IT departments. The same adaptive logic remains directly extensible to higher-maturity use cases: the BKT engine can adaptively coach administrators on least-privilege principles, track adherence to ISO 27001, GDPR, HIPAA, or PCI DSS controls, reinforce secure-coding mastery, and shorten incident-reporting latency.
Boundary conditions for transfer (added in revision). Three boundary conditions are worth drawing out explicitly. First, the magnitude of “extreme baseline imbalance” observed here (Cohen’s d > 2.0 on prior training and baseline knowledge) is partly a product of the cross-organisational mix in Yemen: a large public utility, a private bank with more mature security policies, and a humanitarian NGO. In high-income enterprises with uniform onboarding training, baseline imbalances on these covariates may be substantially smaller; conversely, in cross-sector partnerships or supply-chain training programmes that bridge SMEs and large enterprises, imbalances may be comparable or greater. Second, the coping-self-efficacy mediation pathway is expected to remain dominant across cultures (it is well replicated in PMT meta-analyses [1]), but the magnitude of the PBC pathway is plausibly moderated by national power-distance and by the formality of organisational compliance regimes [28]. Third, in highly regulated industries (GDPR-bound EU finance, HIPAA-bound US healthcare), the avoided-incident cost component will dominate the cost–benefit equation, raising the NPV figures reported here by an order of magnitude. We, therefore, recommend that the present results be read as a lower-bound effect-size envelope and as a transferable methodological template, rather than as a point-estimate forecast for any specific high-income setting.
A fourth driver of the larger-than-benchmark effect sizes (d = 0.66–0.89 vs. the meta-analytic benchmark d ≈ 0.33) is plausibly contextual rather than methodological. Baseline cybersecurity awareness in developing-country and conflict-affected workforces is systematically lower than in the predominantly OECD samples that populate the Bada et al. [1] meta-analysis: in our control group, only 12.9% of employees had received any prior structured cybersecurity training, compared with 60–80% in typical published OECD samples. The mechanical consequence is a larger ceiling-of-improvement: the same absolute knowledge gain translates into a larger standardised effect size because the baseline is further from the ceiling. We, therefore, expect that effective AI-adaptive interventions will continue to outperform the published benchmark in developing-country and capacity-building contexts, but that the standardised effect envelope will compress toward the d ≈ 0.40–0.55 range as baseline awareness rises. The absolute risk-reduction value (IT-verified incidents avoided, reportable breaches prevented) may nonetheless remain operationally large because the per-incident financial cost is much higher in highly regulated settings.
Cross-cultural information-security behaviour research suggests that high power-distance environments [28] and highly formalised compliance regimes can amplify the short-term behavioural impact of authority-delivered ILT while simultaneously dampening the marginal contribution of perceived behavioural control (PBC) in the AI-adaptive condition; conversely, in low-power-distance settings with weaker formal compliance norms, PBC tends to carry a larger share of the mediation pathway because voluntary, self-directed protective behaviour is the dominant route to compliance. This moderation pattern is consistent with Hofstede’s [28] cultural-dimensions framework and should be formally tested in cross-national replication.
In organisations with mature security cultures and uniformly high baseline knowledge, the AI-adaptive system’s standardised effect on knowledge and self-reported behaviour may be smaller than the d = 0.66–0.89 envelope reported here, because of a ceiling-of-improvement effect. However, the absolute reduction in high-cost incidents (e.g., reportable breaches under GDPR or HIPAA) may remain substantial in monetary terms even when standardised effect sizes compress, because the per-incident financial impact is much larger. The portable contribution of this study is, therefore, the four-method analytical framework and the BKT→PMT/TPB design logic, rather than the specific effect-size magnitudes, both of which can be replicated directly in higher-maturity contexts.

5.4. Economic Implications

The intervention proved cost-effective: platform licensing cost approximately USD 90/user/year; combined with administrator time (USD 2500/year) and one-time content customisation (USD 3200), the total annual cost was approximately USD 11,160 per organisation. Estimated annual savings from avoided incidents (USD 2400/incident × 11 avoided events) totalled ~USD 26,400 plus productivity recovery (~USD 8600), yielding net annual savings of approximately USD 35,000/organisation, a break-even period of 3.75 months, and a 5-year NPV (10% discount rate) of ~USD 185,000. As an illustrative high-income, highly regulated scenario, an EU financial institution exposed to potential GDPR penalties could realistically see annual avoided-cost benefits exceeding ten times the figure reported here.

5.5. Ethical Considerations

AI learning analytics systems necessarily collect granular data on individual employee performance trajectories. In this deployment, all data were pseudonymised at collection, stored on organisation-local servers, and accessible only to the research team and IT auditors under a data-sharing agreement. Organisations should establish clear data-governance policies and algorithmic audit procedures to prevent performance data from being used in disciplinary processes. BKT algorithmic bias was assessed via cross-validated next-step AUC comparison; no significant differences were found across gender (male: AUC = 0.79; female: AUC = 0.77; p = 0.41) or organisation. These checks are explicitly insufficient for comprehensive fairness claims; a multi-dimensional fairness audit is detailed as a concrete next step in Section 5.7.

5.6. Limitations

Ten limitations constrain interpretation. First, the 12-week follow-up is insufficient to assess sustained behaviour change; meta-analytic evidence suggests knowledge decay begins within 3–6 months without reinforcement [1]. A 12-month follow-up study is underway. Second, three organisations (N = 187) limit organisational diversity. Third, one of the behavioural outcomes—SeBIS behavioural intentions—is self-reported. Fourth, despite four-method triangulation, unmeasured organisational factors may still confound estimates. Fifth, the BKT model employed does not include a forgetting parameter. Sixth, BKT was applied to each skill independently. Seventh, exploratory subgroup analyses were not formally pre-registered. Eighth, generalisability beyond the three Yemeni organisations is uncertain. Ninth, full algorithmic-fairness auditing was preliminary. Tenth, qualitative employee-experience data were not collected.
Additional note on external validity for extreme novices (added in revision). The PSM exclusion of 25 extreme-baseline participants (≈10.7%) further constrains generalisation to completely inexperienced novices: while the IPTW and widened-caliper sensitivity analyses demonstrate that the directional effects are preserved when these cases are reintegrated, our primary effect-size estimates from the 81 matched pairs should be interpreted as generalising most cleanly to the common-support population (i.e., learners whose baseline covariate profiles plausibly overlap with the opposite-condition group). Effect sizes for extreme novices, who comprised the bulk of the excluded sample, may be larger in magnitude given a stronger ceiling-of-improvement, but estimating those magnitudes precisely will require targeted recruitment of extreme-novice cohorts in future replications.
Residual reporting-bias caveat. Even with the four reporting-bias safeguards documented in Section 3.4.2, helpdesk-based incident counts retain some residual exposure to differential report-frequency between arms; full elimination of this risk would require a future deployment with sensor-level (rather than helpdesk-level) incident detection.
Because completely inexperienced novices started from systematically lower baseline knowledge and lower technical literacy, they are likely to show larger absolute knowledge gains but also higher response variability per unit of training time. We, therefore, recommend that future replications either oversample this stratum, pre-register a dedicated extreme-novice analytical block, or apply stratified PSM that explicitly reserves a balanced extreme-novice cell rather than dropping it via caliper exclusion.

5.7. Future Research Directions

Future research should prioritise: (1) longitudinal follow-up studies (12–24 months) testing maintenance of gains and incorporating decay-aware BKT variants with explicit forgetting parameters [18,20]; (2) cross-cultural replication examining whether power distance, organisational security culture, digital literacy, and national cybersecurity maturity moderate effect stability; (3) head-to-head comparisons of BKT, DKT, and IRT under a common benchmark protocol implementable on top of open-source libraries such as pyBKT [12]; (4) hybrid architectures coupling an interpretable BKT decision layer with generative-AI content generation for role-specific micro-learning; (5) multi-dimensional algorithmic-fairness audits using differential predictive accuracy, equal opportunity, demographic parity, and predictive parity, paired with subgroup-level analysis of BKT parameter behaviour and qualitative interviews capturing culturally specific notions of equitable impact; (6) Monte Carlo and scenario-based sensitivity modelling of cost–benefit estimates across regulatory regimes (GDPR, HIPAA, PCI DSS).
Clarification on long-term retention (added in revision). Among the priorities listed above, item (1)—longitudinal follow-up studies (12–24 months) with decay-aware BKT variants and continuous-adaptation strategies (e.g., periodic micro-refreshers triggered by decay-aware re-estimation of P(L))—is the most immediately actionable and is recommended as the first-priority next study. The objective is to determine whether the coping-self-efficacy gains observed here are durable beyond the 12-week window and how often re-engagement is required to keep phishing click-rates and IT-verified incident counts at their post-intervention levels.
A pragmatic follow-up design that would directly test the durability of the present effects is: re-measurement at Months 6, 12, 18, and 24, retaining the same AI-Adaptive and Control cohorts plus a third, late-onset arm receiving the AI-Adaptive intervention beginning at Month 6. Repeated measures would include coping self-efficacy and PBC (continuous Likert), IT-verified Tier 2–3 incident logs (rolling 90-day windows), and blinded phishing-simulation click-rates at each measurement point. A decay-aware BKT extension (introducing a forgetting parameter P(F)) would trigger personalised micro-refresher modules whenever the decayed posterior P(L) fell below the original adaptive threshold, with the refresher schedule itself becoming a primary outcome (refreshers required per learner per quarter to maintain compliance).

6. Conclusions

This study provides robust, theoretically grounded, and practically significant evidence that AI-adaptive cybersecurity training outperforms traditional ILT on every primary outcome evaluated. The consensus effect sizes (d = 0.66–0.89), verified across four complementary causal-inference methods, exceed the meta-analytic benchmark for security awareness training by a factor of two to three, and the objective institutional outcomes—48.9% reduction in IT-verified security incidents (IRR = 0.51 [0.38, 0.68]) and 75% reduction in phishing click-rates (χ2(1) = 8.74, p = 0.003)—demonstrate that theoretical gains translate into measurable operational risk reduction.
Three principal contributions emerge. First, this study provides, to our knowledge, the first theory-driven empirical test of PMT/TPB constructs as mediators of AI-adaptive training effects, demonstrating that coping self-efficacy and PBC—not threat appraisal—are the active psychological mechanisms (combined mediation: 66.4% of total effect). This insight redirects training design away from fear-based messaging toward efficacy-building, personalised mastery experiences. Second, the four-method triangulation protocol (ANCOVA, PSM, DiD, mixed-effects), with full statistical diagnostics (c-stat = 0.89; HL p = 0.51; parallel trends β = 0.42, p = 0.64; Rosenbaum Γ = 2.1; E-values ≥ 3.4), provides a validated analytical playbook for the highly common situation of field evaluation with extreme baseline imbalances. Third, the validated offline-first platform, tested in a conflict-affected, resource-constrained context, establishes a replicable technological model for global cybersecurity capacity building in underserved environments.
Methodological diagnostics—what each one confirms (added in revision). The four-method triangulation is accompanied by full statistical diagnostics that, taken together, justify confidence in the result: c-statistic = 0.89 indicates good PSM discrimination; Hosmer–Lemeshow p = 0.51 indicates no evidence of propensity-score model mis-fit; the parallel-trends β = 0.42, p = 0.64 confirms that the central DiD assumption is satisfied; Rosenbaum Γ = 2.1 implies that any unmeasured confounder would need to more than double the odds of treatment assignment to overturn the result and E-values ≥ 3.4 quantify the minimum strength such a confounder would need to explain the effect away. Sustained behaviour change in cybersecurity is itself a long-horizon problem; we, therefore, stress that the priority next step is a 12–24-month follow-up evaluation with decay-aware knowledge tracing and continuous adaptive refreshers.
Taken together, these findings reposition AI-adaptive CSAT from a marginal enhancement of awareness toward a measurable lever for organisational risk reduction, and the PMT/TPB-mediated pathways provide a theoretical explanation of why—moving beyond “black-box” observations of adaptive system performance to actionable insights for future training design.

Supplementary Materials

The following supporting information can be downloaded at: https://www.mdpi.com/article/10.3390/info17070682/s1.

Author Contributions

Conceptualisation, M.M.A.-G., M.A. and I.A.-B.; methodology, M.M.A.-G. and M.A.; software, M.M.A.-G.; validation, M.M.A.-G., M.A. and I.A.-B.; formal analysis, M.M.A.-G.; investigation, M.M.A.-G.; resources, M.M.A.-G. and I.A.-B.; data curation, M.M.A.-G.; writing—original draft preparation, M.M.A.-G.; writing—review and editing, M.A. and I.A.-B.; visualisation, M.M.A.-G.; supervision, M.A. and I.A.-B.; project administration, M.M.A.-G.; funding acquisition, M.M.A.-G. All authors have read and agreed to the published version of the manuscript.

Funding

This research received no external funding.

Institutional Review Board Statement

The study was conducted in accordance with the Declaration of Helsinki and approved by the Ethics Board of AL-Hikma University (protocol code IRB-2024-CS-041; date of approval: 7 February 2026).

Informed Consent Statement

Written informed consent was obtained from all participants involved in the study.

Data Availability Statement

The de-identified, aggregated datasets and the R(4.3.1)/Stata(18) analysis scripts that support the findings of this study (ANCOVA, PSM, DiD, mixed-effects, mediation) are available from the corresponding author upon reasonable request, subject to the data-sharing agreement with the participating Yemeni organisations and the institutional ethical approval (IRB-2024-CS-041), which restricts the release of any participant-level identifiable data. A subset of fully anonymised analysis-ready files and the BKT parameter-estimation code will be archived in a public repository (GitHub) upon acceptance, and the corresponding DOI will be provided in the final published version.

Acknowledgments

The authors thank the IT, HR, and security teams at the three participating Yemeni organisations for their cooperation during data collection, the two postgraduate-qualified instructors who delivered the standardised control-condition workshops, and the independent IT auditors who blindly classified Tier 2–3 incidents. The authors also thank the third-party vendor that administered the blinded phishing simulations.

Conflicts of Interest

The authors declare no conflicts of interest.

Appendix A. Analytical Framework—Full Model Specifications

Appendix A.1. ANCOVA Specification

Y_post = β0 + β1·Group + β2·Y_pre + β3·Age + β4·Female + β5·Education + β6·PriorTraining + β7·TechLiteracy + β8·OrgB + β9·OrgC + ε. Heteroskedasticity-consistent HC3 standard errors. Effect sizes: partial η2 converted to Cohen’s d using d = 2√(η2/(1 − η2)).

Appendix A.2. Propensity Score Matching (PSM) Specification

PS model (logistic regression): P(Group = 1) = logit(β0 + β1·Age + β2·Female + β3·Education + β4·PriorTraining + β5·TechLiteracy + β6·KnowledgePre + β7·CompliancePre + β8·OrgB + β9·OrgC). c-statistic = 0.89; Hosmer–Lemeshow χ2(8) = 7.24, p = 0.51. Nearest-neighbour 1:1 matching; caliper = 0.20 SD logit PS [24]. N = 81 matched pairs; 25 cases excluded (AI: 13, Control: 12) due to non-overlap. Post-match SMDs < 0.10 on all nine covariates (Table 2). Rosenbaum sensitivity: Γ = 2.1. These excluded cases occupied the tails of the estimated propensity-score distribution, and therefore, represent participants with atypical covariate combinations relative to the opposite group; accordingly, matched estimates generalise most directly to the common-support population rather than to extreme baseline profiles. Because the archived manuscript materials retained only aggregate counts for non-overlap exclusions, we report exclusion totals transparently here but do not fabricate a separate demographic table for the excluded cases; reproducing that table would require re-tabulation from the raw participant-level dataset. The foundational propensity-score framework was introduced by Rosenbaum and Rubin [27].

Appendix A.3. Difference-in-Differences (DiD) Specification

Y_it = α + β1·Group_i + β2·Post_t + β3·(Group_i × Post_t) + γ′X_i + u_i + ε_it. X_i comprised age, sex, education, prior cyber training, technical literacy, and organisation indicators. Standard errors clustered by department (n = 18 departments). Pre-trend test (Group × WeekLinear in Weeks −4 to −1): β = 0.42, SE = 0.89, p = 0.64 (knowledge); β = 0.31, SE = 0.71, p = 0.66 (incidents). Both non-significant → parallel trends confirmed.

Appendix A.4. Mixed-Effects Specification

In R (lme4): continuous outcomes were estimated as LMMs, Y_it ~ Group × Time + X_i + (1|DeptID) + (1|OrgID), using REML. Incident counts used Poisson GLMMs with a log link; phishing-click outcomes used binomial GLMMs with a logit link. Time = 0, 6, 12 weeks. Treatment effect = Group × Time12 interaction. ICC department = 0.14; ICC organisation = 0.09.

Appendix A.5. E-Values

E-values for ANCOVA estimates: Knowledge = 4.2; Behavioural Intentions = 3.8; Policy Compliance = 3.9; Security Incidents = 3.4; Phishing = 3.6. All exceed the Rosenbaum bound (Γ = 2.1).

Appendix B. BKT Model—Technical Specification and Validation

Appendix B.1. Parameter Definitions

P(L0) = prior probability of initial mastery; P(T) = transition probability (unmastered → mastered per practice opportunity); P(G) = guess probability; P(S) = slip probability. Parameters were estimated via the EM algorithm for each skill domain, with bounded starting values (P(L0): 0.01–0.99; P(T): 0.001–0.50; P(G): 0.01–0.40; P(S): 0.001–0.20) and convergence checks based on a log-likelihood change threshold of <1 × 10⁻⁴ or a maximum of 500 iterations. Each of the 10 cybersecurity concepts was modelled as a distinct skill with its own parameter set; the deployed model did not impose hierarchical prerequisite links across skills. Mastery was declared when P(L_t) > 0.95 on two consecutive assessments. Aggregate parameter estimates were P(L0) = 0.20 ± 0.05, P(T) = 0.28 ± 0.04, P(G) = 0.22 ± 0.03, P(S) = 0.09 ± 0.02. The ZPD band (0.40–0.80) was used as an operational intermediate-mastery practice zone.
Table A1. BKT parameter estimates by skill domain (EM algorithm; 5-fold CV AUC).
Skill DomainP(L0)P(T)P(G)P(S)CV AUCN Practice Obs.
1. Phishing Recognition0.180.280.220.080.79847
2. Password Security and MFA0.220.310.190.070.81752
3. Social Engineering0.140.240.250.100.76634
4. Malware and Ransomware0.200.260.210.090.78698
5. Secure Email Practices0.250.330.180.060.82581
6. Data Handling0.160.220.240.110.74612
7. Physical Security0.290.350.200.070.80523
8. Incident Reporting0.190.270.230.090.77559
9. Remote Work Security0.230.300.210.080.79487
10. Policy Compliance0.170.250.260.100.76614
Aggregate (Mean ± SD)0.20 ± 0.050.28 ± 0.040.22 ± 0.030.09 ± 0.020.78 ± 0.036307 total

Adaptation Logic Pseudocode

For each scored opportunity, update the posterior mastery state for the current skill; if P(L_t) > 0.95 on two consecutive assessments, mark the skill as mastered and schedule a parallel-item re-check in 7 days; else if P(L_t) < 0.50, prioritise a self-efficacy scaffold (hint → worked example → recovery drill → positive feedback linked to a controllable action); else if 0.40 ≤ P(L_t) ≤ 0.80, continue ZPD practice with scaffolded but progressively harder items; if P(L_t) > 0.70, attach a brief threat-salience vignette to reinforce consequence awareness; if P(S) is persistently elevated for the skill, prioritise attention-to-detail refreshers and slower review items; if P(G) is elevated, present misconception-correction feedback and an explicit rule-recall prompt before progression.

Appendix B.2. Predictive Validity and Fairness

Five-fold cross-validated next-step AUC = 0.78 (SD = 0.03; range 0.74–0.82). Pearson r between P(L) at Week 6 and Week 12 assessment score = 0.67 (p < 0.001). Logistic regression baseline AUC = 0.71; ΔAUC = 0.07 (p = 0.014)—BKT significantly outperforms baseline. Subgroup next-step AUCs: male (n = 112) = 0.79; female (n = 75) = 0.77 (p = 0.41). Organisation subgroup AUCs: Org A = 0.79; Org B = 0.78; Org C = 0.77 (all non-significant).

Appendix C. Psychometric Properties of All Measurement Scales

Table A2. Psychometric properties: reliability, validity, and measurement invariance.
Scale (Items)Cronbach αCFIRMSEAInvariance (ΔCFI/ΔRMSEA)Source
Knowledge Test (40 items)0.87; r = 0.81N/AN/AN/AStudy-developed
SeBIS: Behavioural Intentions (15)0.820.960.0470.006/0.009 ✓[21]
Policy Compliance Index (12)0.840.950.0520.007/0.011 ✓Study-adapted
PMT: Threat Severity (4)0.810.980.0380.004/0.007 ✓[2]
PMT: Vulnerability (4)0.790.970.0430.005/0.008 ✓[2]
PMT: Self-Efficacy (4)0.850.980.0360.004/0.006 ✓[2]
PMT: Response Efficacy (4)0.830.970.0410.005/0.007 ✓[2]
TPB: Attitude (3)0.800.990.0310.003/0.005 ✓[5]
TPB: Subjective Norms (3)0.780.980.0380.004/0.006 ✓[5]
TPB: PBC (3)0.820.990.0290.003/0.005 ✓[5]
Note N/A = not applicable; ✓ = present/satisfied.

Appendix D. Security Incident Classification Framework

Table A3. Security incident tier classification system.
TierDefinitionExamplesAttribution CriteriaPrimary Analysis?
Tier 1 (Minor)Low-risk policy oversight without compromiseUnlocked workstation > 5 min; improper disposal of printed sensitive documentSingle auditor against local policy checklistSensitivity only
Tier 2 (Moderate)Potentially exploitable human-error event; limited exposureCredential reuse; suspicious-link click; unauthorised USB useTwo blinded auditors; κ = 0.84; NIST-alignedYES
Tier 3 (Serious)Confirmed compromise or reportable breachSuccessful phishing compromise; executed malware; reportable data exposureTwo auditors + security-manager escalation reviewYES

Appendix E. Cost–Benefit Analysis

Table A4. Annual cost–benefit breakdown per organisation (Yemen public-sector context).
ItemAI-AdaptiveTraditional ILTNet Difference
Platform licensing/yearUSD 8500 (~USD 90/user)USD 0−USD 8500
Administrator time (0.1 FTE)USD 2500USD 1200−USD 1300
Instructor/facilitator costsUSD 0USD 9600 (12 × USD 800)+USD 9600
Content customisation (one-time)USD 3200 (Yr 1)USD 800−USD 2400 (Yr 1)
Avoided incident remediation savingsUSD 26,400 (11 × USD 2400)USD 0+USD 26,400
Productivity recovery savingsUSD 8600USD 0+USD 8600
Net annual savings (after Yr 1)~USD 35,000/yr
Break-even period~3.75 months
5-year NPV (10% discount rate)~USD 185,000

Appendix F. Literature Gap Analysis Summary

Table A5. Literature gap analysis summary.
DimensionGap in Prior LiteratureHow This Study Addresses the Gap
TheoryNo formal PMT/TPB integration within adaptive decision logic; recent work largely prototype-oriented or review-basedFirst theory-driven empirical test of PMT/TPB mediation within an AI-adaptive CSAT system; 66.4% mediated by coping self-efficacy + PBC
Algorithm/BKTBKT well established in education; theory-driven cybersecurity application limited4-parameter BKT with ZPD heuristic on cybersecurity micro-learning; CV AUC = 0.78; ΔAUC vs. logistic = 0.07, p = 0.014
OutcomesSimulated/self-reported; no IT-verified incident dataIT-verified Tier 2–3 incidents (κ = 0.84); blinded phishing simulations; Kaplan–Meier time-to-competency
MethodologySingle-method evaluations; no causal identification for d > 2.0 imbalance4-method triangulation; parallel trends p = 0.64; Rosenbaum Γ = 2.1; E-values ≥ 3.4; FDR correction
ContextNo studies in Yemen/comparable conflict-affected contexts3 Yemeni organisations; offline-first architecture; Arabic cultural adaptation
BenchmarkingNo comparison to meta-analytic benchmarksExplicit comparison to d = 0.33 [1]; consistent Cohen’s d; FDR-corrected q-values

References

  1. Bada, M.; Sasse, A.M.; Nurse, J.R.C. Cyber security awareness campaigns: Why do they fail to change behaviour? arXiv 2019, arXiv:1901.02672. [Google Scholar] [CrossRef] [Scilit]
  2. Herath, T.; Rao, H.R. Encouraging information security behaviors in organizations: Role of penalties, pressures and perceived effectiveness. Decis. Support Syst. 2009, 47, 154–165. [Google Scholar] [CrossRef] [Scilit]
  3. Boss, S.R.; Galletta, D.F.; Lowry, P.B.; Moody, G.D.; Polak, P. What do systems users have to fear? Using fear appeals to engender threats and coping appraisals for system security. MIS Q. 2015, 39, 837–864. [Google Scholar] [CrossRef] [Scilit]
  4. Ifinedo, P. Understanding information systems security policy compliance: An integration of the theory of planned behavior and the protection motivation theory. Comput. Secur. 2012, 31, 83–95. [Google Scholar] [CrossRef] [Scilit]
  5. Bulgurcu, B.; Cavusoglu, H.; Benbasat, I. Information security policy compliance: An empirical study of rationality-based beliefs and information security awareness. MIS Q. 2010, 34, 523–548. [Google Scholar] [CrossRef] [Scilit]
  6. Corbett, A.T.; Anderson, J.R. Knowledge tracing: Modeling the acquisition of procedural knowledge. User Model. User-Adapt. Interact. 1995, 4, 253–278. [Google Scholar] [CrossRef] [Scilit]
  7. Khajah, M.; Lindsey, R.V.; Mozer, M.C. How deep is knowledge tracing? In Proceedings of the 9th International Conference on Educational Data Mining, Raleigh, NC, USA, 29 June–2 July 2016; pp. 94–101. [Google Scholar]
  8. Abdelrahman, G.; Wang, Q.; Nunes, B. Knowledge tracing: A survey. ACM Comput. Surv. 2023, 55, 1–37. [Google Scholar] [CrossRef] [Scilit]
  9. Zhdanov, D.; Caldera, T.M.; Califf, M.E. Using generative AI for cybersecurity awareness training in healthcare. In Proceedings of the 19th Pre-ICIS Workshop on Information Security and Privacy, Bangkok, Thailand, 15 December 2024. [Google Scholar]
  10. Ahmed, A.M.; Mejri, M. Generative AI for cybersecurity awareness training. In Proceedings of the IECON 2025—51st Annual Conference of the IEEE Industrial Electronics Society, Madrid, Spain, 14–17 October 2025. [Google Scholar]
  11. Sengupta, S.; Varma, U.; Islam, T. Empowering cybersecurity education: A review of adaptive learning paradigms and practical implications. In Proceedings of the IS-EUD 2025: 10th International Symposium on End-User Development, CEUR Workshop Proceedings; CEUR-WS: Bonn, Germany, 2025; Volume 3978. [Google Scholar]
  12. Badrinath, A.; Wang, F.; Pardos, Z.A. pyBKT: An accessible Python library of Bayesian knowledge tracing models. In Proceedings of the 14th International Conference on Educational Data Mining, Online, 29 June–2 July 2021. [Google Scholar]
  13. Shadish, W.R.; Cook, T.D.; Campbell, D.T. Experimental and Quasi-Experimental Designs for Generalized Causal Inference; Houghton Mifflin: Boston, MA, USA, 2002. [Google Scholar]
  14. Lebek, B.; Uffen, J.; Neumann, M.; Hohler, B.; Breitner, M.H. Information security awareness and behavior: A theory-based literature review. Manag. Res. Rev. 2014, 37, 1049–1092. [Google Scholar] [CrossRef] [Scilit]
  15. McCormac, A.; Zwaans, T.; Parsons, K.; Calic, D.; Butavicius, M.; Pattinson, M. Individual differences and information security awareness. Comput. Hum. Behav. 2017, 69, 151–156. [Google Scholar] [CrossRef] [Scilit]
  16. Rogers, R.W. A protection motivation theory of fear appeals and attitude change. J. Psychol. 1975, 91, 93–114. [Google Scholar] [CrossRef] [Scilit] [PubMed]
  17. Ajzen, I. The theory of planned behavior. Organ. Behav. Hum. Decis. Process. 1991, 50, 179–211. [Google Scholar] [CrossRef] [Scilit]
  18. Pardos, Z.A.; Heffernan, N.T. Modeling individualization in a Bayesian networks implementation of knowledge tracing. In Lecture Notes in Computer Science; Springer: Berlin/Heidelberg, Germany, 2010; Volume 6075, pp. 255–266. [Google Scholar] [CrossRef] [Scilit]
  19. Angrist, J.D.; Pischke, J.-S. Mostly Harmless Econometrics: An Empiricist’s Companion; Princeton University Press: Princeton, NJ, USA, 2009. [Google Scholar]
  20. van de Sande, B. Properties of the Bayesian knowledge tracing model. J. Educ. Data Min. 2013, 5, 1–10. [Google Scholar] [CrossRef] [Scilit]
  21. Bandura, A. Self-Efficacy: The Exercise of Control; Freeman: New York, NY, USA, 1997. [Google Scholar]
  22. Egelman, S.; Peer, E. Scaling the security wall: Developing a security behavior intentions scale (SeBIS). In Proceedings of the 33rd Annual ACM Conference on Human Factors in Computing Systems (CHI ‘15), Seoul, Republic of Korea, 18–23 April 2015; pp. 2873–2882. [Google Scholar] [CrossRef] [Scilit]
  23. Vandenberg, R.J.; Lance, C.E. A review and synthesis of the measurement invariance literature: Suggestions, practices, and recommendations for organizational research. Organ. Res. Methods 2000, 3, 4–70. [Google Scholar] [CrossRef] [Scilit]
  24. National Institute of Standards and Technology. Computer Security Incident Handling Guide; NIST Special Publication 800-61 Rev. 2; NIST: Gaithersburg, MD, USA, 2012. Available online: https://nvlpubs.nist.gov/nistpubs/SpecialPublications/NIST.SP.800-61r2.pdf (accessed on 24 June 2026).
  25. Austin, P.C. Optimal caliper widths for propensity-score matching when estimating differences in means and differences in proportions in observational studies. Pharm. Stat. 2011, 10, 150–161. [Google Scholar] [CrossRef] [Scilit] [PubMed]
  26. Hayes, A.F. Introduction to Mediation, Moderation, and Conditional Process Analysis, 3rd ed.; Guilford Press: New York, NY, USA, 2022. [Google Scholar]
  27. Rosenbaum, P.R.; Rubin, D.B. The central role of the propensity score in observational studies for causal effects. Biometrika 1983, 70, 41–55. [Google Scholar] [CrossRef]
  28. Hofstede, G. Culture’s Consequences: Comparing Values, Behaviors, Institutions, and Organizations Across Nations, 2nd ed.; Sage: Thousand Oaks, CA, USA, 2001. [Google Scholar]
Figure 1. Integrated PMT–TPB Framework with proposed AI-adaptive training mediation pathways. Solid arrows represent theorised mediation paths, later empirically validated as significant (coping self-efficacy and PBC) or non-significant (threat appraisal) in Section 4.6; the dashed arrow represents the direct BKT reinforcement loop. *** p < 0.001; ns: not significant. Blue-toned boxes denote intervention and mediator constructs; red boxes denote outcome constructs; solid blue arrows indicate mediation paths; dashed orange arrow represents the direct BKT reinforcement loop.
Information 17 00682 g001
Figure 2. CONSORT-style participant flow diagram. N = 200 enrolled; n = 187 analysed (93.5% retention); differential attrition: χ2(1) = 0.14, p = 0.71 (non-significant). PSM-matched subsample: n = 81 pairs per group. Note. Boxes with bold borders denote key sample-size milestones. Diagram designed for greyscale-robust printing (distinct line styles and light/dark contrasts rather than hue alone). Source: this study; n’s reported in Section 3.1.
Information 17 00682 g002
Figure 3. Security-incident trends by group. (A) Pre-intervention parallel-trends verification (β = 0.42, SE = 0.89, p = 0.64—non-significant interaction confirms parallel trends). (B) Full 12-week study period showing a 48.9% post-intervention incident reduction in the AI group. Solid line = AI-Adaptive; dashed line = Control—IRR (incidence-rate ratio) is the ratio of post-intervention incident rates between the AI-adaptive and control groups; an IRR < 1 indicates a relative reduction.
Information 17 00682 g003
Figure 4. Simulated phishing click-rates at three time points (Weeks 0, 6, and 12). AI-Adaptive: 8.8% → 5.1% → 2.1% (75% relative reduction). Control: 9.0% → 8.6% → 8.4% (no meaningful change). Identical stimuli were administered by a blinded third-party vendor. Any highlight arrow in the figure is explanatory only and marks the post-intervention decline in the AI-Adaptive group; no result depends on colour alone. χ2(1) = 8.74, p = 0.003, φ = 0.22.
Information 17 00682 g004
Figure 5. Kaplan–Meier time-to-competency survival curves (80% mastery threshold). AI-Adaptive median = 4.2 weeks (95% CI: [3.6, 4.8]); Control did not reach threshold within 12 weeks. Log-rank χ2(1) = 47.3, p < 0.001.
Information 17 00682 g005
Figure 6. Mediation path diagram (PROCESS Model 4; N = 187; 5000 bootstrap draws). a1 = 1.24 *** (SE = 0.18); b1 = 0.68 *** (SE = 0.12); Indirect1 = 0.843 [0.52, 1.19] ***. a2 = 0.97 *** (SE = 0.21); b2 = 0.54 *** (SE = 0.14); Indirect2 = 0.524 [0.28, 0.81] ***. a3 = 0.31 ns (SE = 0.24); b3 = 0.19 ns (SE = 0.16); Indirect3 = 0.059 [−0.07, 0.21] ns. Direct effect c′ = 0.63 * (SE = 0.28). Total c = 2.06 ***; proportion mediated = 66.4%. *** p < 0.001; * p < 0.05; ns = non-significant. Significant versus non-significant paths are distinguished by line style and contrast, not by colour alone.
Information 17 00682 g006
Figure 7. Effect-size summary across primary outcomes (four-method consensus). All outcomes significantly exceed the meta-analytic benchmark (d = 0.33) [1]. Rosenbaum bounds Γ = 2.1; E-values ≥ 3.4; FDR-corrected q < 0.005 for all five outcomes.
Information 17 00682 g007
Table 1. Summary comparison: this study versus representative recent AI-adaptive cybersecurity training studies.
StudySystem FocusEmpirical StatusMediator TestingObjective Incident DataContext
Zhdanov et al. [9]Generative-AI healthcare awareness trainingDesign/pilot-stage evaluationNoNoUS healthcare
Ahmed and Mejri [10]GAI-driven adaptive CSAT frameworkFramework/architecture paperNoNoConference prototype
Sengupta et al. [11]Review of adaptive cybersecurity educationSystematic/structured reviewNoNoCross-study
Present studyCustom-configured 4-parameter BKT model with interpretable P(G) and P(S) signals serving as an auditable pedagogical decision layer that directly triggers PMT/TPB-aligned interventions (rather than only estimating mastery)12-week field evaluationYesYesYemen (developing country, offline-first)
Table 2. Baseline characteristics by group (key variables).
CharacteristicAI-Adaptive (n = 94)Control (n = 93)Std. Diff. Pre-PSMStd. Diff. Post-PSM
Age (Mean, SD)31.2 (6.4)38.7 (8.1)1.02 (large)0.06
Female (%)38.3%41.9%0.070.03
University degree (%)71.3%44.1%0.58 (moderate)0.07
Prior cyber training (%)82.4%12.9%2.14 (extreme)0.08
Technical literacy (0–10)6.8 (1.4)4.2 (1.9)1.55 (large)0.09
Baseline knowledge (0–100)64.3 (11.2)41.8 (13.4)1.82 (extreme)0.10
Baseline compliance (0–10)5.9 (1.7)3.8 (2.1)1.10 (large)0.09
Note. Standardised mean differences exceeded 2.0 for prior training and baseline knowledge, motivating the four-method triangulation described in Section 3.5. Post-PSM standardised differences < 0.10 confirm satisfactory balance in the matched subsample (n = 81 pairs).
Table 3. Conceptual mapping between BKT diagnostic signals and PMT/TPB constructs.
BKT SignalInferred Cognitive StatePMT ConstructTPB ConstructTriggered InterVentionRefs.
High P(S)—slipExecution failureResponse cost/response effortPerceived Behavioural Control (PBC)Checklist and slower review items[2,5,16,17]
High P(G)—informed-guessMisconception or low confidenceSelf-efficacy and copingSelf-efficacy and attitudeMisconception-correction + rule recall[2,5,21]
P(L) < 0.50UnfamiliarityResponse efficacyPBCWorked example + scaffold + recovery drill[6,18,21]
0.40 ≤ P(L) ≤ 0.80Consolidation (ZPD band)Coping appraisalAttitudeProgressively harder items[6,12,20]
P(L) > 0.70MasteryThreat appraisal (booster)Subjective normsBrief threat-salience vignette[1,3,16]
Note. All triggered interventions in this table follow theory-informed but testable hypotheses (see R1-E1, Section 3.3.1/Section 5.7).
Table 4. Training content, module coverage, and time-on-task by group.
Module/Security ConceptAIControlAI Avg. Time (Min)Control (Min/Session)
1. Phishing Recognition and Avoidance18.430
2. Password Security and MFA14.220
3. Social Engineering Awareness16.120
4. Malware and Ransomware Prevention13.815
5. Secure Email Practices11.915
6. Data Handling and Classification15.320
7. Physical Security and Clean Desk8.710
8. Incident Reporting Procedures12.415
9. Remote Work Security9.610
10. Security Policy Compliance14.215
TOTAL (Mean across 12 weeks)134.6 min (~12.8 h ± 2.4)120 min (~12.0 h)
Note. Both groups received identical topic coverage. Time-on-task difference between groups: 0.8 h (t(185) = 1.42, p = 0.16, ns).
Table 5. Descriptive statistics and four-method effect-size estimates by primary outcome.
OutcomeAI M(SD) Wk12Ctrl M(SD) Wk12ANCOVA d [95% CI]PSM d [95% CI]DiD β (SE)ME [95% CI]FDR-adj q
Knowledge Score (0–100)82.4 (8.6)67.1 (11.3)0.89 [0.71, 1.07]0.84 [0.63, 1.05]16.8 (2.3) ***17.2 [14.1, 20.3]<0.001 (original p < 0.001)
Behavioural Intentions (SeBIS 1–7)5.82 (0.71)5.16 (0.87)0.76 [0.57, 0.95]0.72 [0.52, 0.92]0.71 (0.12) ***0.68 [0.47, 0.89]<0.001 (original p < 0.001)
Policy Compliance (0–10)7.84 (1.18)6.12 (1.54)0.78 [0.59, 0.97]0.74 [0.53, 0.95]1.72 (0.28) ***1.68 [1.20, 2.16]<0.001 (original p < 0.001)
Security Incidents (Tier 2–3)1122IRR = 0.51 [0.38, 0.68]IRR = 0.49 [0.36, 0.66]−0.49 (0.09) ***IRR = 0.51 [0.38, 0.68]<0.001 (original p < 0.001)
Phishing Click-Rate (%)2.1%8.4%φ = 0.22 [0.09, 0.35]φ = 0.21 [0.08, 0.34]−0.063 (0.019) ***OR = 0.22 [0.07, 0.67]0.004 (original p = 0.003)
Note. ME = mixed-effects model; FDR = Benjamini–Hochberg correction across 5 primary outcomes. *** p < 0.001 before FDR correction.
Table 6. Mediation analysis: indirect effects of training on policy compliance (5000 bootstrap draws).
Pathwaya-Path b [SE]b-Path b [SE]Indirect Effect b95% Boot CI [Lo, Hi]Significance
Training → Coping Self-Efficacy → Compliance1.24 [0.18]0.68 [0.12]0.843[0.52, 1.19]Significant ***
Training → PBC → Compliance0.97 [0.21]0.54 [0.14]0.524[0.28, 0.81]Significant ***
Training → Threat Appraisal → Compliance0.31 [0.24] ns0.19 [0.16] ns0.059[−0.07, 0.21]Non-significant
Direct Effect (c′): Training → Compliance0.630[0.08, 1.18]Significant *
Total Effect (c): Training → Compliance2.056[1.58, 2.54]Significant ***
Proportion Mediated (Self-Efficacy + PBC)66.4%
Note. *** p < 0.001; * p < 0.05; ns = non-significant. PBC = Perceived Behavioural Control. Bootstrap samples = 5000.
Disclaimer/Publisher’s Note: The statements, opinions and data contained in all publications are solely those of the individual author(s) and contributor(s) and not of MDPI and/or the editor(s). MDPI and/or the editor(s) disclaim responsibility for any injury to people or property resulting from any ideas, methods, instructions or products referred to in the content.