1. Introduction
The growth of social media research has made public communication visible at a scale that was difficult to imagine only a generation ago. Digital traces can show when attention gathers around a forecast, how people frame uncertainty, which emotions travel through online conversation, and which claims become visible under a given platform’s ranking and interaction logic. Yet scale does not solve the problem of inference. A large dataset from one platform is still a dataset from one platform. The concern has been central to computational social science for more than a decade. Tufekci [
1] warned that social media big data often suffers from unclear sampling frames, platform over-reliance, and field effects. Ruths and Pfeffer [
2] similarly argued that population and behavioral biases differ across platforms and are rarely corrected when researchers use social media to study large-scale behavior. Olteanu et al. [
3] later organized these concerns into a broader account of social-data bias, covering biases introduced at the source, during processing, and through ethical or access constraints. The practical implication is not that single-platform studies lack value. It is that their claims should remain tied to the communication environment from which the evidence was drawn. This study builds on that concern by asking what kind of public conversation researchers are seeing and what they might be missing when they study El Niño on one platform. More specifically, the study asks how platform choice shapes findings about El Niño discourse across volume, timing, language, topic, sentiment, emotion, stance, misinformation risk, personal experience, humor, calls to action, engagement, and text length.
El Niño is a useful case because it is not native to one social platform or one communicative genre. It can appear as global climate science, local weather forecasting, food security, agricultural risk, disaster preparedness, energy planning, political argument, humor, personal testimony, or media news. The case is also time sensitive. NOAA’s Climate Prediction Center issued an El Niño Watch on 14 May 2026, creating a clear public signal inside the observation window [
4]. World Meteorological Organization (WMO)’s May 2026 update likewise described El Niño as increasingly likely through the boreal summer and autumn, while noting potential effects on global temperature and rainfall patterns [
5]. The Food and Agriculture Organization (FAO) describes El Niño-induced hazards as risks to food security because disrupted rainfall and temperature patterns can affect agriculture and rural livelihoods [
6]. These characteristics make El Niño a strong empirical test. If platforms differ even around a common, scientifically defined issue, then researchers should be cautious when translating one-platform findings into claims about social media discourse as a whole.
Cross-platform discussions may differ empirically, not only because platforms contain different users, but because they organize different forms of visibility, expression, and interaction. These differences shape what researchers measure when they measure sentiment, misinformation, topic, or public concern. To answer the research question, this study compares El Niño-related discourse across X/Twitter, YouTube, Facebook, Reddit, TikTok, and LinkedIn during the same event-centered window. By keeping the issue and time period constant, the analysis shows how the platform itself changes the evidence available to researchers. The goal is not to identify one platform as the best source of public discourse, but to show why claims based on a single platform should be treated with care when researchers want to speak about social media more broadly.
2. Literature and Analytical Framework
Social media platforms are not neutral channels for expression. They organize visibility through their affordances such as ranking mechanisms, interaction norms, available media formats, and the imagined audiences they cultivate. Matassi and Boczkowski [
7] argue that comparative research across platforms yields stronger descriptive and explanatory power than treating a single setting as the default. Hase et al. [
8] show how news organizations tailor stories differently for Facebook, Instagram, TikTok, and Twitter, while Oz et al. [
9] demonstrate that perceived platform affordances shape users’ willingness to express opinions. From this perspective, external validity becomes a design choice that starts with the selection of platforms. Bucher and Helmond [
10] deepen this view by framing affordances as relational, i.e., emerging among technical design, imagined audiences, user practices, commercial ranking systems, and the task at hand. An El Niño forecast can therefore surface as a breaking-news post, a comment beneath a video, a professional update, a meme-like warning, a subreddit thread, or a link to an official advisory, depending on the platform in question.
This multiplicity makes the representativeness problem in social media data especially layered. Platform populations differ, people perform differently across settings, and the very infrastructures including APIs, search tools, and algorithmic rankings expose systematically different slices of the same issue. Tufekci [
1], Ruths and Pfeffer [
2], and Olteanu et al. [
3] all caution against conflating platform-specific traces with social reality. Climate communication brings these biases into sharp focus because a single event routinely moves across registers of scientific explanation, disaster preparedness, market speculation, local memory, political accusation, humor, and outright dismissal of expertise. Pearce et al. [
11] found a substantial skew toward Twitter in reviews of climate-related social media research and called for wider attention to platforms, publics, and future imaginaries. For El Niño, a platform suited to tracking fast-moving forecast headlines may not be the one where personal weather stories, food-price anxieties, or skeptical reactions are most visible. Moreover, misleading climate content is not confined to plainly false claims. Herasimenka et al. [
12] stress that it also includes manipulative framing and the unintentional amplification of deceptive narratives. In the case of El Niño, that could mean premature certainty about event strength, exaggerated causal claims, conflation of El Niño with global warming, or conspiratorial narratives that replace meteorological explanations with artificial-weather stories [
13]. The aim of this study is therefore to show what becomes visible when the same issue is observed across several platformed publics.
To make such comparisons tractable, the analysis attends to six linked dimensions. Attention is captured through volume and timing around the May 14 forecast signal. Genre distinguishes posts, comments, professional updates, subreddit threads, and video replies as non-interchangeable communicative units. Issue framing is recorded via topic categories and main topic. Affect is measured through sentiment, dominant emotion, and emotion intensity. Epistemic stance is labeled as informational, concerned, skeptical, humorous, dismissive, or unclear, together with indicators of likely misinformation and misinformation risk. Finally, interactional style draws on personal experience, humor or sarcasm, calls to action, language, engagement, and text length. Differences along these dimensions are evidence that each platform surfaces a distinct version of public conversation.
Comparing such heterogeneous material demands a measurement strategy that is consistent without being naive. This study uses LLM-assisted annotation as a structured aid for descriptive comparison. As Törnberg [
14] notes, this requires attention to model choice, prompt design, validation, reproducibility, and ethics. Ziems et al. [
15] advocate for evaluating LLMs against social science constructs rather than treating them as generic text engines, and Fang et al. [
16] warn that unexamined annotation error can bias downstream inference. The categories reported here should therefore be read as indicators that reveal broad platform patterns. They complement rather than replace close reading, human validation, and theory-led interpretation.
3. Data and Methods
The data window began at 2026-05-09 00:00:00 UTC and ended before 2026-05-18 00:00:00 UTC. Collection was platform-specific because the six platforms do not provide equivalent public access, search interfaces, official API functionality, or comparable units of analysis. X/Twitter, Facebook, Reddit, TikTok, and LinkedIn were collected through paid Apify actors (see
Table 1). YouTube was collected through the YouTube Data API v3. The platform search keyword was the string “El Niño”. No language filter was applied in the collection design. All languages returned by the collection route were retained for later relevance filtering and annotation. The only study-imposed collection limit was the 9–17 May 2026 UTC observation window.
The window and platform choices were selected for an event-centered rather than population-representative design. The May 9–17 period brackets a clearly identifiable forecast signal, the May 14 NOAA El Niño Watch, while keeping the observation period short enough to reduce the influence of unrelated news cycles, longer seasonal drift, and platform-level changes over time. The six platforms were chosen because they represent different public-facing communication environments such as fast-moving short posts, video-comment spaces, public media and news posts, community discussion threads, short-form video reactions, and professional updates. The aim is to compare how the same issue becomes visible through several platformed collection routes during the same forecast event.
The choice of collection route was methodological rather than an attempt to privilege one platform over another. YouTube data were collected through the official YouTube Data API because this route provided a documented and workable method for keyword-based video search and comment retrieval within the event window. For X/Twitter, Facebook, Reddit, TikTok, and LinkedIn, paid Apify actors were used to obtain a synchronized cross-platform snapshot, since official platform APIs differ substantially in access requirements, approval procedures, quotas, endpoint availability, historical-search functionality, and available units of analysis.
The Apify-based collections should therefore be understood as third-party public-web collection routes, not as official platform API access, platform authorization, or platform endorsement. The Apify API token authenticated the workflow only with Apify. It was not used as a login credential for X/Twitter, Facebook, Reddit, TikTok, or LinkedIn. The workflow was configured and interpreted as compliant under the following conditions: collection was limited to material that was publicly visible to the collector at the time of access; no private-account sessions, private communications, closed groups, or access-controlled content were intentionally collected; no paywalls, logins, technical access controls, rate limits, or platform security measures were intentionally bypassed; the collection did not use artificial engagement, account automation, impersonation, or interaction with users; and the resulting data were processed only for research purposes, stored securely, and not redistributed as raw platform records.
Given that platform terms, API rules, and automated-collection policies differ across services and may change over time, this study does not claim that Apify-based collection is equivalent to platform-authorized API collection or that third-party collection is automatically permitted by each platform. Rather, the authors report the collection route transparently and treat the data as public, collector-visible platform traces subject to strict minimization and reporting safeguards. In particular, the analysis is limited to aggregate patterns. Handles, profile identifiers, and direct links are omitted. Searchable verbatim quotations are avoided, rare combinations of attributes are not reported where they could support identification, and raw social media records are treated as sensitive research material rather than publishable examples or redistributable data.
These precautions are necessary because public accessibility does not remove research responsibilities. Social media content may still contain personal data, contextual identifiers, or traceable expressions, especially when usernames, quotations, timestamps, or platform-specific metadata are reproduced. This manuscript therefore distinguishes between public availability and unrestricted reuse, and it presents the Apify route as a pragmatic, bounded, and transparently disclosed collection method whose acceptability depends on the above criteria being met. This approach is consistent with ethics guidance emphasizing caution around identifiability in social media research [
17,
18,
19] and with public-data scraping guidance that treats collection as most defensible when it concerns publicly available material, avoids confidential or protected content, respects applicable laws and third-party rights, and does not circumvent access controls [
20].
After collection, texts were annotated through the OpenAI API using GPT-5.4-mini model. The annotation schema included sentiment, continuous sentiment score from negative to positive, dominant emotion, emotion intensity, topic, topic category, stance toward El Niño, relevance to El Niño, likely misinformation presence and risk, misinformation claim and reason, personal experience, humor or sarcasm, call to action, detected language, and a short summary.
The LLM workflow was designed as a structured annotation aid [
21]. Each item was sent with a source-row identifier and returned as one JSON object under a predefined schema. The schema required the same fields across platforms and restricted several variables to enumerated categories, including sentiment, emotion, topic category, stance, relevance, and misinformation risk. The scripts used strict JSON-schema output, matched outputs back to source rows, checked required fields and allowed values where implemented, flagged missing or invalid outputs, retried failed batches, and saved checkpoints. These safeguards reduce formatting errors, improve reproducibility, and limit format drift, but they do not prove the substantive correctness of every label.
Given that social media texts can contain adversarial, malformed, or instruction-like content, the annotation workflow treated each post or comment only as data to be classified, not as an instruction to the model. The prompts directed the model to analyze only the provided text, avoid inventing outside context, use low-risk or unclear labels when claims were ambiguous, and not treat skepticism or political disagreement as misinformation by default. This conservative instruction was intended to avoid inflating the misinformation category by treating uncertainty, humor, political disagreement, or legitimate skepticism as falsehood. The trade-off is that the instrument may under-detect ambiguous skepticism, irony, coded claims, or humor that indirectly conveys misinformation.
For this reason, the misinformation variable is reported as “likely misinformation” or “model-flagged misinformation risk” and not as verified false content. The same caution applies to stance and affect labels, especially for short, sarcastic, multilingual, or context-dependent comments. The structured-output and post-processing safeguards also reduce the risk of instruction leakage from user-generated text, but they are not equivalent to a full jailbreak or prompt-injection audit [
22]. This study therefore treats adversarial robustness as a methodological limitation and recommends that future work add dedicated jailbreak-detection, repeated-call stability, and adversarial test-set checks before using LLM labels for stronger causal or prevalence claims.
The item-level examples added in the results are used only as interpretive illustrations of the model-coded categories. They were selected from the platform-level analysis, then shortened, de-identified, and paraphrased where necessary. Handles, profile names, URLs, and other identifying details are not reproduced. This keeps the examples close enough to explain the labels while avoiding the unnecessary exposure of individual users.
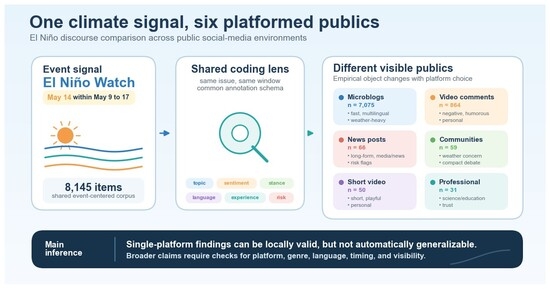
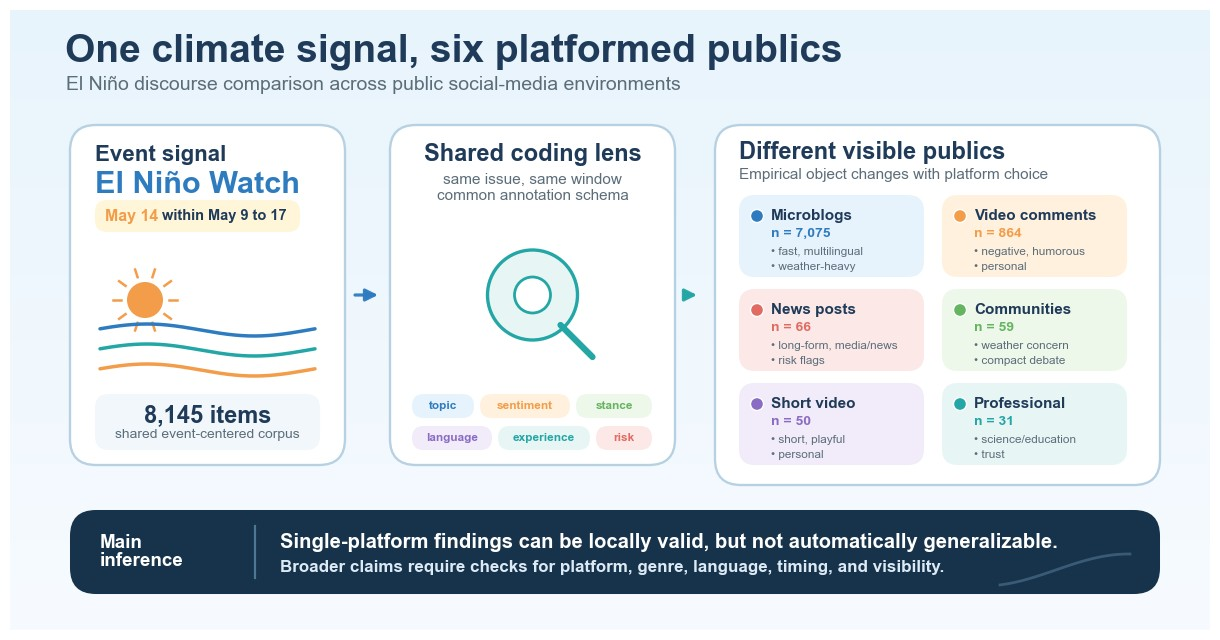
The comparative corpus retains items marked as high or medium relevance to El Niño and excludes unrelated or failed analyses where such fields were available. The final retained dataset contains 8145 items, including 7075 from X/Twitter, 864 from YouTube, 66 from Facebook, 59 from Reddit, 50 from TikTok, and 31 from LinkedIn. The single-keyword strategy was a deliberate precision-oriented design choice. This study used the query to keep the issue definition stable across platforms and to compare explicit discussion of the named climate phenomenon during the same forecast event. This choice improves comparability but reduces recall. For example, it may miss posts using local expressions and indirect references to droughts, floods, crops, food prices, preparedness, or weather risk that do not use the exact collection keyword.
The uneven sample sizes were not a decision to privilege X/Twitter and were not intended to represent platform population sizes. They resulted from applying the same short event window, the same explicit keyword anchor, and the available public collection route on each platform. X/Twitter produced far more retained public items under this design, while Facebook, Reddit, TikTok, and LinkedIn yielded smaller visible corpora. These differences likely reflect platform activity, public-search visibility, ranking and recency logic, genre differences, data-access restrictions, and actor/API behavior. This study therefore treats X/Twitter as a higher-volume visible discourse environment in this corpus and treats smaller platform samples as descriptive profiles rather than stable population estimates.
It cannot be assumed that official APIs would have produced approximately 7000 comparable items from every platform. Official APIs differ in access requirements, quotas, rate limits, approval procedures, historical coverage, comment availability, and search functionality. A future equal-N design could extend the time window, broaden the query list, deliberately oversample smaller platforms, or stratify by platform and genre. Such a design would estimate patterns in a constructed balanced sample rather than compare what became visible through synchronized event-window collection routes.
This study does not verify whether each item was produced by a human user, an organizational account, a coordinated campaign, a bot, or an otherwise inauthentic profile [
23]. Automated or fake accounts can amplify climate-related frames and may do so differently across platforms [
24]. This study therefore interprets the corpus as visible platform discourse. The main cross-platform claim is that the collected platform environments surfaced different patterns of El Niño-related content, affect, stance, and misinformation risk. Some of those differences may reflect human publics, while others may reflect platform ranking, organizational posting, automated amplification, or fake-profile activity.
4. Results
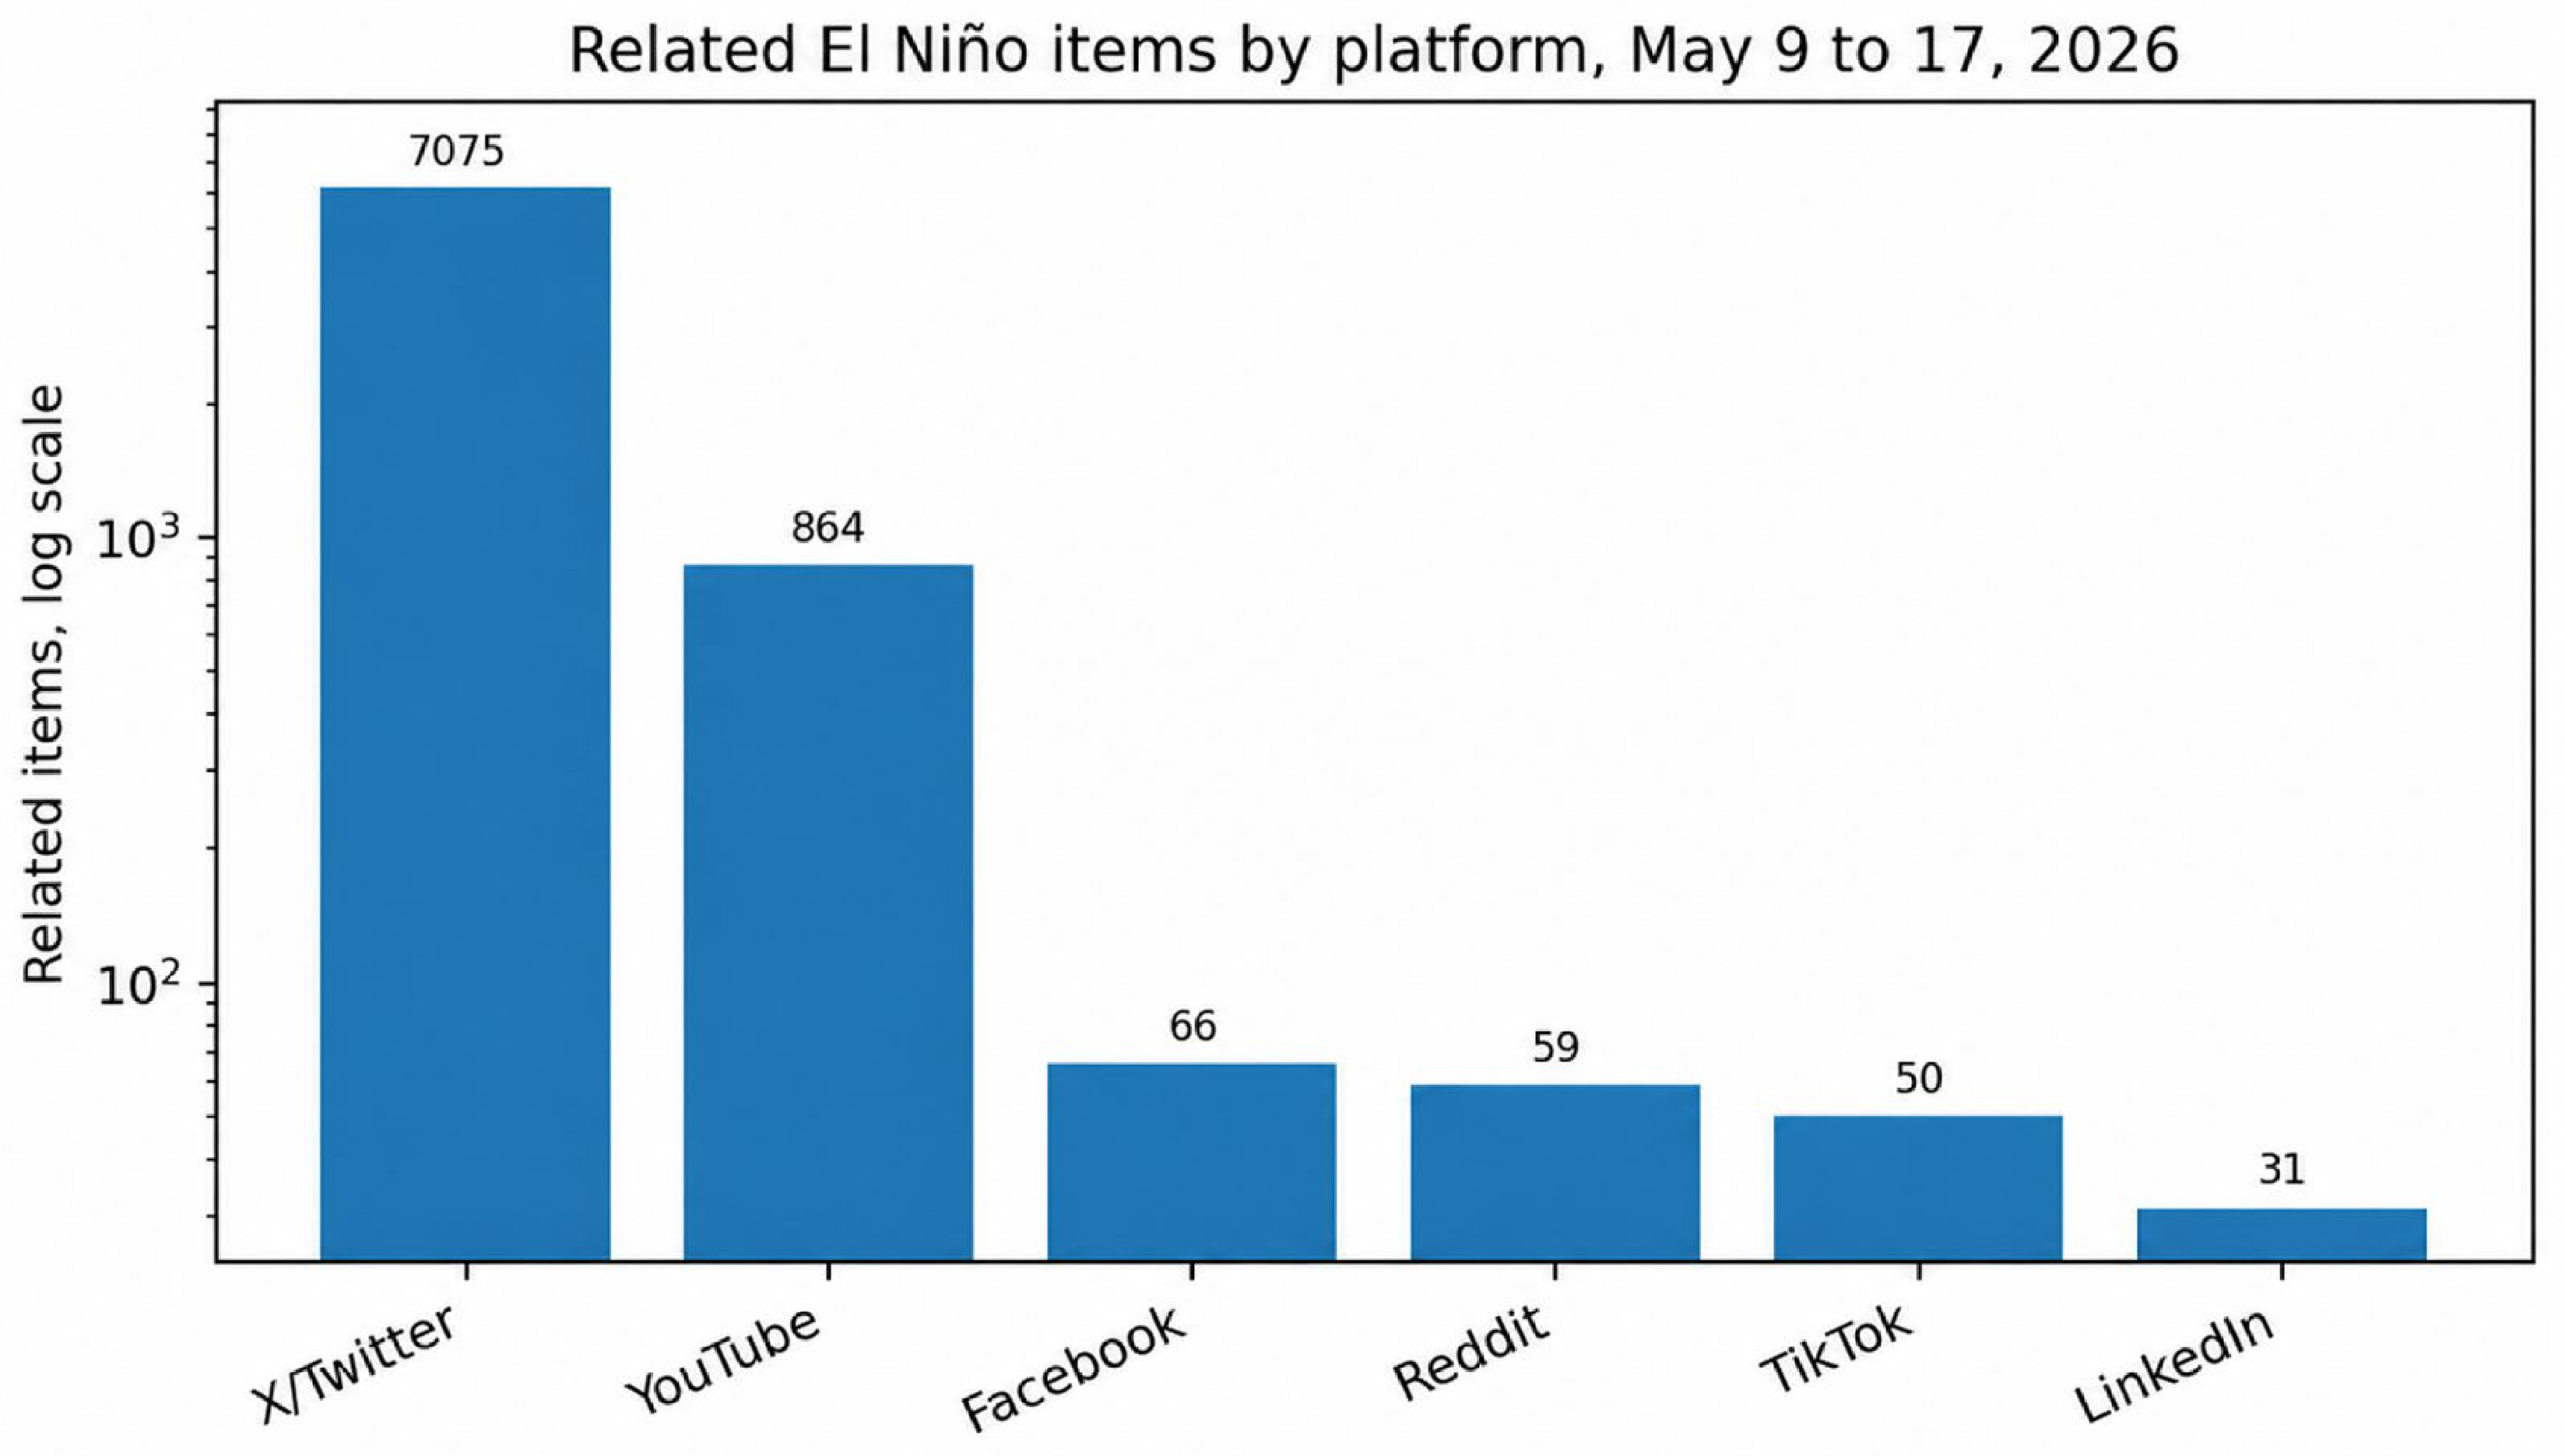
The first finding is the scale of platform inequality (see
Figure 1). X/Twitter accounts for 86.9 percent of all retained items and YouTube accounts for 10.6 percent, while Facebook, Reddit, TikTok, and LinkedIn together account for only 2.5 percent. This does not mean that X/Twitter users cared more about El Niño than users elsewhere. It means that, under these accessible public collection routes and search designs, X/Twitter produced far more visible related material during the window. A combined corpus that ignored platform would therefore mostly reproduce X/Twitter dynamics. A single-platform study of YouTube, LinkedIn, or TikTok would produce a very different empirical account.
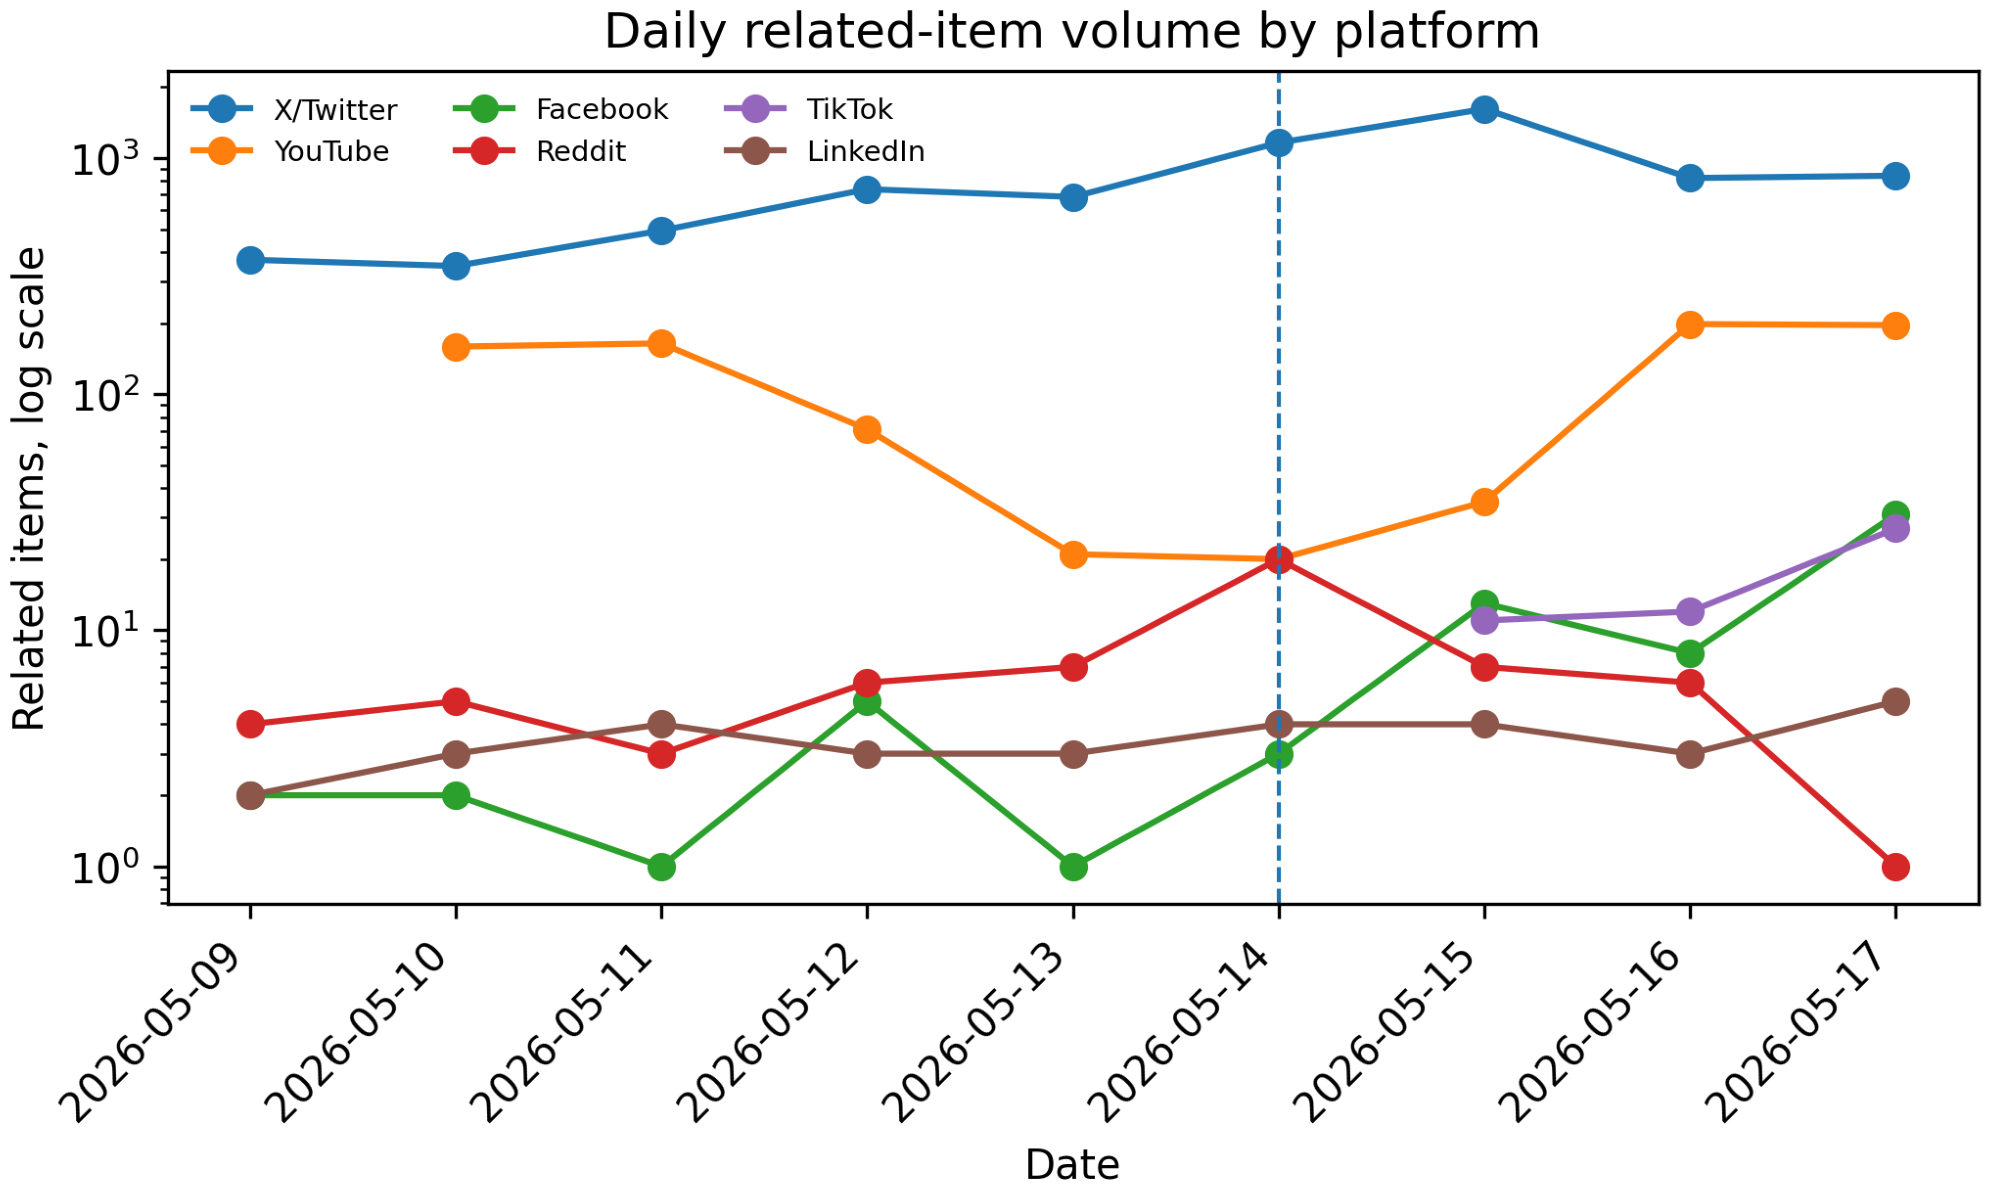
The daily pattern in
Figure 2 supports the event-centered interpretation. X/Twitter activity increased from 684 retained items on May 13 to 1161 on May 14 and reached 1614 on May 15. Reddit also shows a visible May 14 increase, with 20 retained items compared with single-digit daily counts on most other days. Facebook, TikTok, and YouTube are more delayed. Facebook rises most strongly on May 17, TikTok appears only from May 15 onward, and YouTube has its largest counts on May 16 and May 17. The same forecast signal therefore did not circulate through each platform at the same speed. Immediate posting, later commenting, video circulation, and public-media sharing created different temporal signatures around one climate event.
The topic and affect results show that the platforms are not merely different in volume (see
Table 2). They make different versions of El Niño visible. Weather is the dominant category on X/Twitter, YouTube, Reddit, and TikTok, but its share ranges from 25.9 percent on YouTube to 69.5 percent on Reddit. Facebook differs because media/news is dominant at 53.0 percent. LinkedIn differs again because science/education dominates at 64.5 percent. A researcher who studied Reddit alone would likely describe the issue as weather-centered concern. A researcher who studied LinkedIn alone would describe a professional science and education discourse. A researcher who studied Facebook alone would foreground public media posts and news framing. Each conclusion could be locally valid while remaining incomplete as a general claim about social media.
Emotion and stance vary just as strongly. Concern is the leading emotion on X/Twitter, YouTube, Facebook, and Reddit, yet the emotional mix differs. YouTube has a notably high anger share, while Reddit concentrates around concern and anticipation. TikTok is led by joy, suggesting a more playful or expressive reaction environment. LinkedIn is led by trust, consistent with its more professional and informational style. Stance follows the same pattern. LinkedIn is overwhelmingly informational, Reddit is majority concerned, X/Twitter combines informational and concerned posts, and YouTube and TikTok are more fragmented across informational, concerned, skeptical, humorous, and dismissive stances. This is the external-validity problem in empirical form where the meaning of El Niño discourse changes with the platform.
Sentiment gives the platform comparison a clearer affective shape. As shown in
Table 3, neutral and negative items dominate most of the corpus, but the balance differs across platforms. X/Twitter is primarily neutral, with 62.3 percent neutral items and 34.0 percent negative items, suggesting that much of the discussion circulated as reporting, commentary, or forecast sharing rather than direct emotional reaction. YouTube and Reddit are more negative, with negative items representing 51.6 percent and 49.2 percent of their respective samples, which indicates that comment-centered discussion more often translated the forecast into concern, worry, complaint, or risk language. Facebook is also strongly risk-oriented, with 43.9 percent negative items and concern as the dominant emotion. TikTok is more affectively mixed. Negative and positive items each account for 28.0 percent, while neutral items remain the largest group at 44.0 percent. LinkedIn is the least negative platform and has the highest mean sentiment score, with 19.4 percent positive and 6.5 percent mixed items.
Text length captures a different part of the platform effect because it measures the amount of space used to frame the forecast. As shown in
Table 4, Facebook posts are by far the longest, with a median of 877 characters and 69.7 percent above 500 characters. LinkedIn is also relatively expansive, with a median of 275 characters. X/Twitter sits between long-form posts and comment environments, with a median of 186 characters and a mean of 257 characters. YouTube comments are shorter, with a median of 107 characters. TikTok comments are shortest, with a median of 49 characters. These differences are analytically important, since longer items can carry more explanation, source framing, qualification, and narrative context. Shorter items more often compress uncertainty into a reaction, joke, warning, question, or fragment of personal memory.
Table 5 compares the available engagement fields within each platform. Facebook has the highest mean engagement at 868.9 per retained item, followed by Reddit at 603.5. TikTok has a high mean of 185.9 because a few comments attracted many likes, although the median is only 3.5. X/Twitter has the largest aggregate engagement total at 442,759, but the median is 1.0, and 39.8 percent of items have zero visible engagement. YouTube contributes many comments, but comment-level engagement is sparse, with a median of zero and a zero-engagement share of 66.4 percent. The engagement results therefore point to platform-specific visibility structures and long-tail attention rather than a universal intensity scale.
Language further complicates generalization. X/Twitter is multilingual in the retained corpus, with English at 45.4 percent, Spanish at 40.7 percent, and Portuguese at 6.0 percent. Facebook is mostly English but includes meaningful Spanish and Portuguese shares. YouTube, Reddit, TikTok, and LinkedIn are overwhelmingly English in the retained corpus. This pattern does not prove that non-English discussion was absent from those platforms. It shows what the implemented collection routes and platform environments made visible. An English-dominant YouTube or Reddit study would miss much of the Spanish-language El Niño conversation that appears in X/Twitter. Conversely, an X/Twitter study would make the issue look more multilingual than several other accessible corpora in this project.
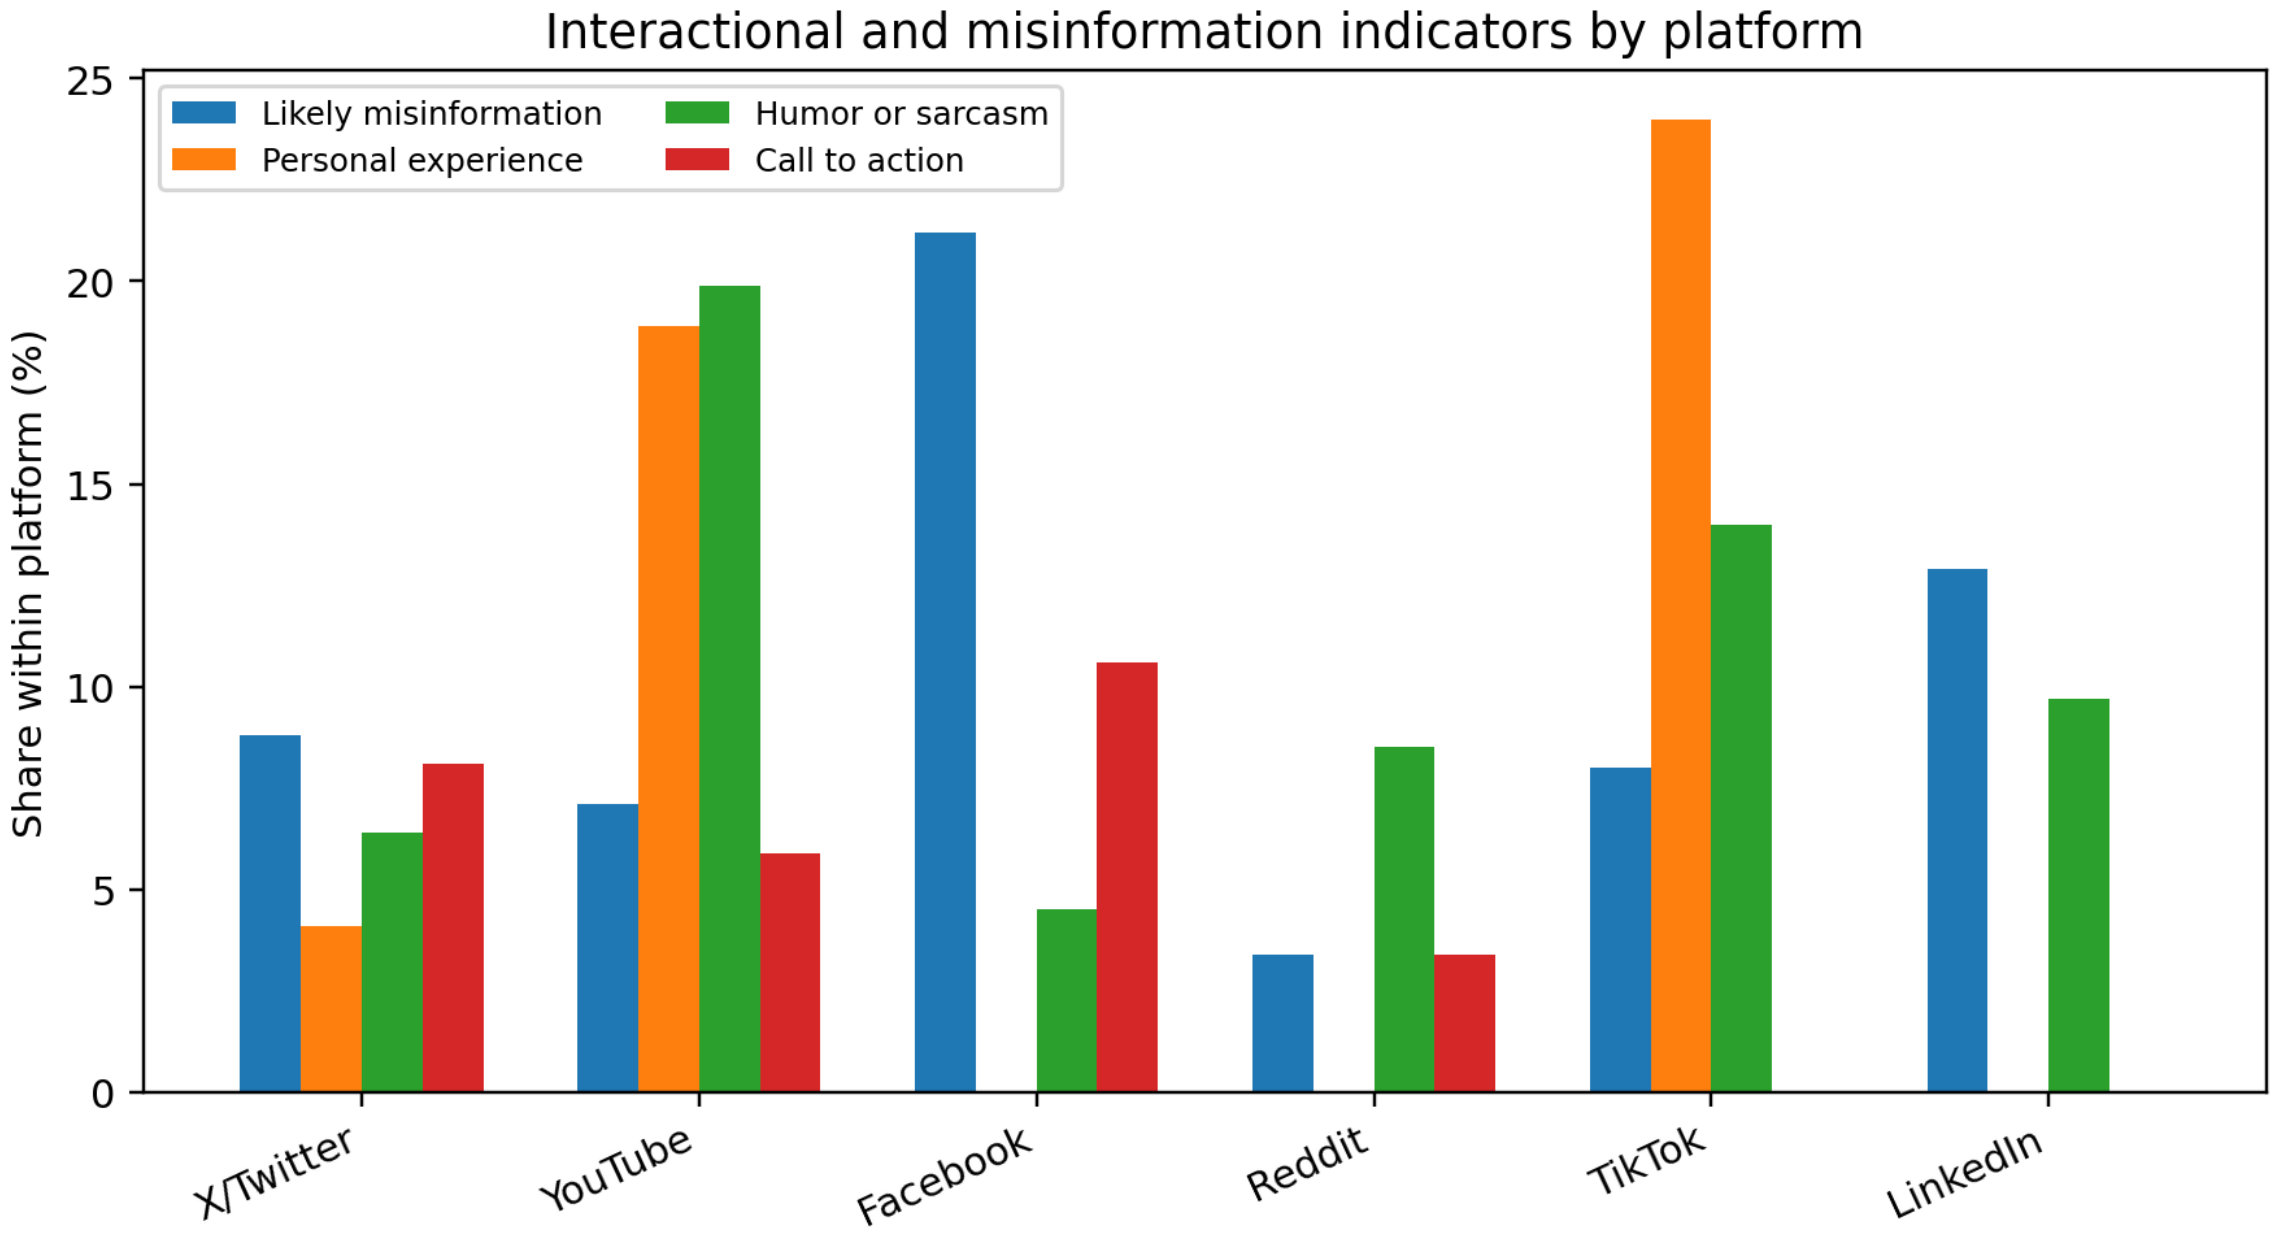
The binary and interactional indicators reinforce the same conclusion (see
Figure 3). Facebook has the highest likely misinformation rate in the retained corpus at 21.2 percent, followed by LinkedIn at 12.9 percent, X/Twitter at 8.8 percent, TikTok at 8.0 percent, YouTube at 7.1 percent, and Reddit at 3.4 percent. This indicator is model-based and should not be read as external factchecking. Still, it shows that a researcher’s estimate of misinformation risk would vary depending on the selected platform. Personal experience is even more platformed. TikTok has the highest personal-experience rate at 24.0 percent, followed by YouTube at 18.9 percent and X/Twitter at 4.1 percent. Humor and sarcasm are highest on YouTube at 19.9 percent and TikTok at 14.0 percent. Calls to action are highest on Facebook at 10.6 percent and X/Twitter at 8.1 percent. Video-comment environments turn El Niño into lived and expressive talk more often, while posting and news environments more often carry informational framing or calls to action.
The omnibus tests confirm that the platform differences are not limited to one descriptive indicator (see
Table 6). All measured dimensions differ by platform. Among continuous measures, text length and total engagement show the largest effects, while sentiment score differs significantly with a smaller effect. Among categorical measures, personal experience has the largest effect, followed by detected language, dominant emotion, humor or sarcasm, stance, topic category, and sentiment category. Likely misinformation and calls to action are statistically significant but smaller in effect size. These results should be interpreted as evidence of corpus differentiation, not as estimates of population opinion. The large X/Twitter sample makes small differences detectable, so the substantive reading depends on the direction, magnitude, and interpretive meaning of the platform profiles.
The aggregate differences become easier to interpret when they are read together with item-level examples.
Table 7 shows the kinds of posts, comments, and short-form messages that were placed in each category after de-identification and generalization. The examples clarify that negative often means concern, risk framing, or frustration rather than interpersonal hostility. Likely misinformation can involve unsupported causality, false equivalence, or a shift from probability to certainty, whereas personal memory, humor, requests for facts, preparedness advice, and source-sharing are analytically different forms of forecast talk.
These examples show why category labels should be interpreted relationally. A concerned El Niño item can be a forecast summary, an emergency warning, a request for preparedness, or a memory of past flooding. A misinformation flag can capture denial, conspiracy, unsupported physical explanations, false equivalence, or the subtler movement from a probabilistic forecast to a certain and dramatic claim. This is why the labels should not be read as self-explanatory counts. Their meaning depends on the communicative work being done in the post or comment.
5. Discussion
The central finding is that El Niño discourse is platformed. The same forecast-relevant issue appeared across six environments, but each environment made a different public visible. X/Twitter presented a high-volume, multilingual, fast-moving stream where weather, news, science, business, politics, agriculture, climate concern, and humor coexisted. YouTube presented a comment environment with higher negativity, anger, humor, skepticism, and personal experience. Facebook presented longer media/news-oriented posts with more calls to action and the highest model-flagged likely misinformation rate. Reddit presented a compact, weather-centered, concern-heavy discussion. TikTok presented short comments with more personal experience and expressive tone. LinkedIn presented a professional and informational version of the issue.
The possibility of automated or inauthentic activity does not remove the relevance of the platform differences, but it changes what they mean. If some visible items were produced or amplified by bots, fake profiles, organizational accounts, or coordinated actors, then the observed differences are differences among platformed information environments. This is still important for climate communication because users encounter a mixture of human, organizational, algorithmically amplified, and possibly automated content. However, it means that the results should be framed as differences in visible discourse and platform-mediated attention and not as direct estimates of genuine public opinion.
Nonetheless, a single-platform study would produce plausible but partial conclusions. None of those conclusions would be necessarily wrong for the platform studied. The problem begins when the platform-specific conclusion is rewritten as a claim about social media, public opinion, or online discourse without cross-platform evidence. This point echoes prior warnings about representativeness and platform bias in social-data research [
1,
3]. It also extends the comparative logic that platform-specific affordances, publics, and genres are central to what researchers observe [
7,
25].
The examples also help explain why the platform differences are not only statistical. The same label can have different communicative meanings depending on the genre of the item. A skeptical item may be correcting exaggerated forecast language or advancing an unsupported causal theory. A personal-experience item may be a memory of earlier floods, a report of local weather, or a preference for warmer or cooler conditions. A humorous item may be playful, dismissive, anxious, or political at the same time. These differences fit the affordance-based framework when platforms shape not only how much people say, but what counts as a recognizable contribution [
7,
10].
For climate communication, the findings suggest that strategy should follow platform function. If the aim is to monitor fast-moving multilingual forecast discussion, X/Twitter is valuable in this corpus. If the aim is to understand personal experience, humor, confusion, and comment-level reaction, YouTube and TikTok deserve attention. If the aim is to monitor professional framing, LinkedIn reveals a different layer of discourse. If the aim is to observe concern within issue-specific communities, Reddit matters. If the aim is to watch public media/news posts and calls to action, Facebook matters. El Niño moves from forecast probability to public meaning as it passes through these environments. The same scientific signal can become a weather warning, a news item, a professional update, a joke, a skeptical comment, a food-security concern, or a memory of past storms.
The results suggest practical design principles for future cross-platform climate communication research. First, studies should define the intended inference before selecting platforms. Monitoring fast-moving forecast circulation, comment-level interpretation, professional framing, community concern, or misinformation risk may require different platform combinations. Second, researchers should preserve the distinction between communicative genres, for example, original posts, video comments, replies, subreddit threads, and professional updates, rather than treating all items as equivalent messages. Third, future designs should stratify samples by platform, language, and genre and should report platform-specific denominators instead of relying only on pooled totals. Fourth, when misinformation or stance labels are central to the argument, researchers should combine automated annotation with manual validation, repeated-call stability checks, and, where possible, bot or fake-profile screening.
For LLM-assisted methodology, this study shows both promise and caution. A shared annotation schema made it possible to compare heterogeneous platform traces using the same conceptual categories. That is valuable when the research question concerns external validity. At the same time, short comments, sarcasm, multilingual text, and ambiguous climate claims remain difficult measurement tasks. The current analysis should therefore be read as a structured computational comparison rather than a final coding truth. Future work should code a stratified validation sample by platform, language, and category, compare model labels with human judgments, estimate reliability, and repeat a subset of model calls to test stability [
14,
15,
16].
6. Limitations
Several limitations shape interpretation of the findings. First, this study covers one issue during a nine-day event window. El Niño was selected because it was timely, visible, and scientifically defined, but other climate events, longer periods, or non-event-centered samples may produce different platform patterns. Second, retrieval was anchored on the keyword “El Niño”, which may miss indirect discussion of heat, drought, flooding, agriculture, food prices, insurance, disaster preparedness, or weather risk that does not explicitly name El Niño. Third, collection is uneven because public platform access is uneven. This affects both the number of items and the type of items collected.
Fourth, the units of analysis are not identical. X/Twitter items are posts, YouTube and TikTok items are comments, Reddit is post-centered, and Facebook and LinkedIn contain public posts or comments where available. A comment under a video, a subReddit post, and a professional LinkedIn update are different genres. This study compares them because users encounter all of them as platformed discourse, but the comparisons should be read as differences among platformed communication environments rather than as perfectly interchangeable speech acts.
Fifth, this study does not measure the demographic diversity of users who posted or commented about El Niño. Platform publics may differ by age, gender, geography, profession, language, and other social characteristics, and the people who discuss El Niño on LinkedIn, TikTok, Reddit, YouTube, Facebook, or X/Twitter should not be assumed to be demographically interchangeable. Prior work has shown that demographic and gender-specific dimensions can affect social media discourse, sentiment, toxicity, and interpretation, while research on gender inference from social media also warns that inferring sensitive attributes from profiles, names, images, or text can introduce methodological error and ethical risk [
26,
27]. Given that the present dataset did not contain reliable, consent-based or platform-verified demographic information, this study does not infer users’ age, gender, or location from names, profile images, language, or content. Future work should address user diversity through ethically collected metadata, opt-in surveys, data donation, platform-provided aggregate demographics, explicit self-descriptions where appropriate, or carefully validated demographic-inference methods and should test whether platform differences remain after stratifying by user characteristics.
Sixth, this study does not authenticate accounts or identify bots, fake profiles, organizational campaigns, or coordinated amplification. The findings therefore describe visible discourse in the collected public corpus, not verified human opinion. Automated or inauthentic accounts may contribute to platform differences, especially in volume, engagement, stance, and misinformation risk. Future work should combine text analysis with account-level metadata, posting histories, coordination indicators, and bot or fake-profile detection models where such data can be collected ethically and lawfully.
Seventh, the LLM annotation was not externally validated with a human-coded sample. The scripts used a shared schema, strict structured outputs, required fields, row matching, retries, and conservative prompt instructions, but these are pipeline safeguards rather than evidence that every substantive label is correct. LLM labels should therefore be interpreted as structured indicators for exploratory comparison. Future work should manually code a stratified validation sample across platforms, languages, and genres, report agreement metrics for key labels, examine disagreements, and repeat a subset of calls to assess stability.
Eighth, the instruction to use low-risk or unclear labels for ambiguous claims reduces false positives but may also reduce sensitivity to ambiguous skepticism, irony, coded misinformation, or humor. The likely misinformation estimates may therefore be conservative and should not be read as a definitive prevalence measure. Finally, ethical risks remain even when data are publicly accessible. This manuscript therefore reports aggregate results, avoids handles and profile identifiers, does not reproduce searchable verbatim quotations, and treats raw records as sensitive research material.