1. Introduction
The quality and usability of institutional websites have become central to the effectiveness of digital public services and the promotion of digital inclusion. As governments and organisations increasingly rely on online platforms to communicate with citizens and deliver services, the performance of these digital interfaces directly affects access to information, participation in public initiatives, and the overall perception of institutional credibility. In particular, platforms dedicated to territorial management and regional development must address complex challenges related to heterogeneous user profiles, varying levels of digital literacy, and the need to communicate information clearly and accessibly [
1,
2,
3].
In this context, a substantial body of research has focused on evaluating website quality and its relationship to user satisfaction. Studies examining digital government portals and institutional platforms consistently demonstrate that user satisfaction depends not only on the availability of services but also on the perceived quality of information, usability of the interface, and effectiveness of interaction mechanisms [
4,
5,
6]. Among the evaluation frameworks proposed in the literature, the WebQual 4.0 model has become one of the most widely adopted instruments for measuring perceived website quality, particularly due to its ability to translate subjective user perceptions into structured analytical dimensions.
Complementary research has examined how specific attributes of digital platforms influence user satisfaction. Previous studies highlight that website quality dimensions, particularly usability, information quality and service interaction, play a central role in shaping user perceptions and satisfaction with online services. Reliable and accessible information is therefore critical to ensuring the effectiveness of digital platforms, especially in contexts where users depend on online systems for information and access to services [
7,
8]. For example, Leite et al. [
9] emphasise that the reliability and accessibility of online information are essential factors when evaluating the effectiveness of institutional digital platforms, particularly in contexts where citizens rely on online resources for decision-making and access to services. These findings reinforce the importance of combining perceptual evaluation models with structured decision-support methods that translate user expectations into actionable design improvements.
Empirical studies using models such as the End-User Computing Satisfaction (EUCS) model show that dimensions such as content quality, information accuracy, interface clarity, and ease of navigation significantly affect users’ evaluations of digital platforms [
10,
11,
12]. These findings suggest that user satisfaction arises from a multidimensional interplay among system functionality, information quality, and the experiential aspects of digital interaction.
Despite the extensive use of such evaluation frameworks, several authors highlight important limitations in existing approaches. In many cases, traditional website evaluation models focus primarily on measuring perceived quality, without offering mechanisms to identify the relative importance of specific attributes or to translate user perceptions into actionable design priorities [
13,
14]. Consequently, organisations may obtain diagnostic insights about user perceptions but still lack structured tools to guide the prioritisation of technical improvements.
To address this limitation, several studies propose integrating perceptual evaluation models with decision-support methodologies that operationalise the “voice of the user”. In this regard, the Kano Model has emerged as an important framework for identifying how different attributes influence satisfaction and dissatisfaction. Unlike traditional linear approaches to service quality, the Kano model recognises that user satisfaction is influenced by heterogeneous categories of attributes, including essential requirements, performance factors and attractive features that may unexpectedly enhance the user experience.
When combined with technical prioritisation frameworks such as Quality Function Deployment (QFD), the Kano model enables organisations to translate user expectations into structured design requirements. This integration has been successfully applied in several domains, including financial services, product design, and industrial engineering, where it has proven effective in aligning user needs with technical development processes [
15,
16,
17,
18,
19,
20,
21,
22,
23]. However, despite its potential, the application of this integrated methodological framework remains relatively limited in digital public services and institutional platforms.
Another dimension that has received increasing attention in recent years concerns the divergence between user evaluations and those conducted by usability experts. Research on human–computer interaction indicates that users typically identify practical obstacles related to navigation, information clarity, and task completion, whereas expert evaluators tend to detect structural usability issues, heuristic inconsistencies, and interface design flaws [
24,
25,
26]. This divergence reflects different evaluation paradigms and highlights the importance of combining participatory and expert-driven assessment methods.
In the public sector, such methodological complementarity is particularly relevant. Participatory approaches emphasise the role of citizens as co-producers of public services, while expert evaluation contributes technical rigour and methodological consistency in identifying design limitations [
27,
28,
29,
30]. Nevertheless, empirical studies comparing these two perspectives remain scarce, especially in digital platforms dedicated to territorial development and regional revitalisation.
Against this background, the present study addresses two interrelated gaps in the literature. First, it addresses the need for integrated methodological approaches that link perceptual quality evaluation to structured prioritisation of technical improvements. Second, it contributes to the limited empirical evidence comparing user-centred evaluation with expert-based usability inspection in institutional digital platforms.
To this end, the study proposes the integrated application of three complementary methods, WebQual 4.0, the Kano Model and Quality Function Deployment (QFD), combined with a heuristic expert evaluation of the Interior+ website, an institutional platform designed to support the revitalisation of rural communities. Rather than focusing on the novelty of each method individually, the study’s contribution lies in the operational integration of these approaches, enabling a systematic connection among user perceptions, quality prioritisation, and technical recommendations, while also allowing a comparative analysis between user-based and expert-based evaluations.
Based on the theoretical framework and the identified gaps, the following research questions and working hypotheses are formulated:
RQ1. How do different attributes of usability and quality of information influence user satisfaction and dissatisfaction?
RQ2. How does the Kano–WebQual–QFD integration contribute to a consistent technical prioritisation against the heuristic evaluation of the experts?
RQ3. To what extent do the problems identified by users differ from those identified by experts, and what are the implications of this divergence?
To guide the study, the following testable hypotheses are formulated:
H1a. Essential attributes such as usability, responsiveness and information clarity are associated with higher dissatisfaction when absent.
H1b. The integrated process (Kano—WebQual—QFD) generates a prioritisation of requirements that is consistent with at least 70% of the critical recommendations identified by the experts.
H1c. There are statistically significant differences between the problems identified by users and experts, reflecting different evaluation paradigms. These hypotheses guide the analysis and provide the basis for the discussion on methodological complementarity.
The contributions are tripartite: (i) we propose a replicable, documented protocol applicable to institutional websites; (ii) we present empirical evidence on how different attributes influence satisfaction and technical priorities; (iii) we provide a comparative analysis between user assessment and expert inspection, highlighting complementarities and practical implications for the design of digital platforms oriented towards territorial inclusion.
2. Theoretical Background
The evaluation of digital service quality has evolved significantly over the past three decades, reflecting the growing complexity of online interactions and the increasing centrality of digital platforms in organisational communication and service delivery. Early conceptualisations of service quality, particularly the SERVQUAL model proposed by Parasuraman, Zeithaml and Berry [
31], provided the theoretical foundation for analysing user perceptions of service performance by measuring the gap between expectations and perceived outcomes. Although originally developed for face-to-face service environments, SERVQUAL strongly influenced subsequent models designed for digital contexts. As digital services expanded, researchers adapted these principles to account for characteristics specific to online environments, including system availability, interface usability, information quality and responsiveness [
32]. These adaptations gave rise to a series of specialised frameworks for evaluating the quality of digital platforms and their impact on user satisfaction.
Within the field of information systems, several empirical studies have confirmed that perceived quality of digital services is a critical determinant of user satisfaction, trust and continued use intention. Research across institutional websites, e-government platforms, and organisational portals consistently identifies usability, information reliability, and interaction quality as central determinants of positive user experiences [
4,
11,
33]. These findings highlight the need for analytical models capable of capturing both technical system characteristics and subjective user perceptions.
Among the various frameworks proposed for this purpose, WebQual 4.0 stands out as one of the most widely adopted models for evaluating website quality from the user perspective. Developed by Barnes and Vidgen [
34], the model operationalises the evaluation of websites through three core dimensions: usability, information quality and interaction quality. By structuring subjective perceptions into measurable indicators, WebQual enables researchers and practitioners to analyse the digital user experience systematically.
However, assessing usability on digital platforms requires approaches that transcend purely functional and technical aspects. It is also necessary to consider emotional, social and contextual factors that shape digital interaction. In this sense, the Generalised User Experience Questionnaire (UEQ-G), developed by Boothe et al. [
35] is an effective tool for capturing multimodal experiences by integrating both pragmatic and hedonic qualities in product and service contexts.
In a convergent perspective, research on digital platforms highlights that user experience should extend beyond functional efficiency and incorporate experiential and perceptual dimensions that influence users’ engagement with the interface. Studies analysing website quality and user experience indicate that attributes such as usability, information clarity and interaction quality significantly shape users’ perceptions and satisfaction with digital systems [
12,
35,
36]. These findings suggest that successful digital platforms are those that not only operate effectively but also create meaningful, engaging experiences, strengthening users’ connection to the interface and enhancing overall satisfaction.
The choice of the evaluation instrument directly impacts the results obtained. Schrepp et al. [
37] compared the SUS, UMUX-LITE, and UEQ-S questionnaires, demonstrating that although SUS and UMUX-LITE perform similarly in measuring usability, UEQ-S is distinguished by its ability to capture the hedonic dimension, which is essential for a more holistic understanding of the user experience.
Accessibility is a fundamental dimension of digital quality, particularly on institutional and public digital platforms, where inclusivity is a central requirement. Koutsabasis et al. [
38] proposed a practical methodology for evaluating web accessibility that goes beyond technical compliance with accessibility standards. Their approach emphasises identifying specific user requirements, defining explicit accessibility objectives, and implementing continuous monitoring mechanisms. This perspective highlights that accessibility should be integrated from the earliest stages of system design rather than treated as a post-development adjustment. Similarly, user-centred design approaches emphasise that website quality depends on the ability to accommodate diverse user needs and capabilities, reinforcing the importance of inclusive usability in digital service design.
The integration of qualitative and quantitative methods is also productive for identifying usability problems. Alhadreti and Mayhew [
39] concluded that, when comparing the traditional and co-participatory think-aloud methods, the latter allows for the identification of more problems, especially those of lesser severity, thus offering more detailed insights for the continuous improvement of the interface.
In addition, Moon et al. [
40] highlight the role of empathetic design in developing inclusive digital solutions. In a study on the prototyping of interactive visualisations for health services, the authors show how co-creation with users, anchored in empathy, allows the identification of hidden barriers and generates innovative responses with high social impact.
The convergence of these frameworks, perceptual analysis models, holistic measurement tools, and participatory methodologies enables a multidimensional reading of the user experience. This approach underpins design as an evidence-driven practice, capable of translating perceptions into informed strategic decisions, thereby promoting accessibility, inclusion, and greater communicative effectiveness in digital environments.
2.1. Quality of Service and Digital Usability
Evaluating the quality of digital services requires analytical frameworks that capture the complexity of interactions between users and online interfaces. Unlike traditional service environments, digital platforms combine technical system performance with cognitive, behavioural and perceptual aspects of user interaction. As a result, the assessment of digital usability must consider not only functional efficiency but also the clarity of information, accessibility of services, and users’ confidence when navigating the system.
Research in information systems consistently demonstrates that usability is one of the most influential determinants of user satisfaction and continued engagement with digital platforms. Empirical studies of institutional websites, e-government services, and organisational portals indicate that users tend to prioritise intuitive navigation structures, clear information architecture, and efficient task-completion mechanisms when evaluating online experiences [
4,
11]. When these elements are absent or poorly implemented, users often experience frustration, leading to lower satisfaction levels and reduced trust in the digital service.
In response to these challenges, several authors have proposed heuristic and indicator-based approaches to guide the evaluation of website quality. One example is the checklist developed by Veríssimo et al. [
41], which proposes a structured matrix of 108 indicators organised across four dimensions: content, design, navigation and educational functionalities. The framework integrates classic usability principles, such as Nielsen’s [
42] heuristics of consistency, error prevention and informative feedback, with contemporary digital quality models, including WebQEM [
42,
43], SiteQual [
44] and WebQual [
45].
The indicators included in this checklist encompass criteria such as the accuracy and updating of information, readability, visual hierarchy, accessibility, interactivity and institutional transparency. Applied to a sample of higher education institution websites, the tool demonstrated its capacity to identify structural and functional weaknesses in digital interfaces, thereby supporting targeted improvement initiatives [
41]. At the same time, the authors acknowledge that heuristic evaluations alone cannot fully capture the diversity of user experiences, emphasising the need to complement expert-based assessments with empirical user data.
This limitation reflects a broader challenge in digital usability research. While heuristic evaluation methods are effective in diagnosing structural design issues, they do not necessarily reveal how users perceive the relative importance of different attributes or how these attributes influence satisfaction. Consequently, many scholars advocate combining expert-based diagnostic tools with user-centred evaluation models that capture the experiential dimensions of digital interaction.
In this sense, usability evaluation increasingly relies on multimethod approaches that integrate heuristic inspection, user perception surveys and behavioural analysis. Such methodological triangulation allows researchers to move beyond purely technical assessments and develop a more comprehensive understanding of how design choices influence user satisfaction and engagement.
Quality assessment in digital environments requires models capable of capturing the complexity of interactions between users and interfaces. Online experiences involve not only functional efficiency but also subjective factors such as information clarity, accessibility, and confidence in navigation. In this context, evaluation instruments based on heuristics and observational criteria become valuable tools for both diagnosing and guiding improvements in institutional websites.
The checklist developed by Veríssimo et al. [
41] exemplifies this approach, proposing a matrix of 108 indicators distributed across four major dimensions: content, design, navigation, and educational functionalities. The proposal integrates classic heuristic principles, such as those of Nielsen [
42], which include consistency, error prevention and informative feedback, with contemporary digital quality references, such as WebQEM [
43], SiteQual [
44] and WebQual [
45]. These indicators cover criteria such as updating and accuracy of information, credibility, readability, visual hierarchy, usability, accessibility, interactivity, and institutional adequacy. The checklist also includes specific elements of educational institutions’ websites, such as the presentation of the training offer, information on admissions, student services, and internationalisation resources. When applied to a sample of six websites of higher education institutions, the tool proved effective in identifying gaps and supporting improvements to the digital experience. However, the authors acknowledge that their validation remains partial and recommend future applications involving real users to reinforce the proposal’s robustness [
41].
More than an evaluative instrument, this checklist assumes a formative role, offering a structured basis for the development and continuous improvement of digital platforms with an educational or institutional mission. Its use is particularly relevant in contexts that require clear communication, technical accessibility, and strengthened user trust, such as university websites, public services, and digital social projects, including Interior+.
2.2. WebQual 4.0 Model: Perceptual and Heuristic Assessment
Among the frameworks developed to evaluate website quality from the user perspective, the WebQual 4.0 model stands out as one of the most widely applied in digital service research. Proposed by Barnes and Vidgen [
34], WebQual adapts the principles of the SERVQUAL model to online environments, offering a structured approach to measuring perceived website quality.
The model conceptualises website quality through the following three core dimensions.
Usability: includes Criteria such as intuitive navigation, ease of learning, and efficiency in use.
Information Quality: Covers the accuracy, relevance, timeliness and clarity of the contents.
Interaction Quality: This refers to the trust, customisation, support, and responsiveness of the interface.
This tripartite structure reflects the multidimensional nature of digital interaction, recognising that users evaluate online platforms not only on their technical functionality but also on the quality and credibility of the information they provide and the perceived reliability of the service.
By relying on subjective perceptions, WebQual enables user-driven heuristic evaluation and is especially useful in contexts where the individual and emotional experience of digital browsing is central. The structure of the model facilitates the conversion of qualitative judgments into analysable data, promoting a bridge between the empirical domain of user experience and the functional requirements of digital design.
Empirical applications of WebQual across various domains, including e-government portals, university websites and online services, demonstrate that these three dimensions consistently explain a significant portion of variance in user satisfaction and perceived service quality [
4,
5]. In particular, usability and information quality frequently emerge as the most influential factors shaping user evaluations of institutional websites.
Despite its robustness as a perceptual evaluation tool, WebQual has certain limitations. While it effectively captures users’ subjective perceptions of digital quality, it does not inherently provide mechanisms for identifying latent expectations or prioritising improvement actions. In other words, the model is highly effective in diagnosing perceived quality gaps but less suited for determining which attributes should be prioritised in system redesign.
For this reason, several researchers have proposed combining WebQual with complementary analytical frameworks to identify hidden user needs and translate perceptual data into strategic design decisions. One such framework is the Kano model, which introduces a nonlinear perspective on the relationship between service attributes and user satisfaction.
Studies, such as that of Hidayat et al. [
46], demonstrate the potential of combining WebQual with other models, such as Kano, to identify latent or unspoken needs, aspects that often escape purely technical models but are fundamental to the overall degree of satisfaction.
By comparison, the checklist by Veríssimo et al. [
41] presents a more extensive and contextualised structure, covering emotional, institutional, and aesthetic criteria that are not explored to the same depth in WebQual. If Barnes and Vidgen’s model [
34] offers a functional and synthetic reading of the digital experience, the checklist serves as a complementary tool, enabling more specific and refined diagnoses. This complementarity becomes particularly relevant when it is intended to feed translation models such as QFD, which require accurate qualitative data to guide design decisions.
2.5. Comparison and Convergence: Integration of the Three Models
The evaluation and improvement of digital platforms require analytical approaches that capture not only how users perceive website quality but also how these perceptions translate into actionable design priorities. Individually, WebQual, the Kano Model and Quality Function Deployment (QFD) provide valuable but partial perspectives on this challenge. The integration of the Kano, WebQual 4.0 and QFD models constitutes more than a methodological juxtaposition: it represents a coherent chain of sensitive diagnosis, evaluative structure and strategic decision. Each model assumes a distinct and complementary role within a systematic process of evaluating and improving the digital experience.
The Kano Model complements this limitation by introducing an asymmetric perspective on user satisfaction. Rather than assuming a linear relationship between performance and satisfaction, the model recognises that different attributes exert distinct effects on user perceptions [
47,
48,
49]. Basic requirements may generate dissatisfaction when absent, without necessarily increasing satisfaction when present, whereas attractive features can create positive experiences even when not explicitly expected by users [
47,
48]. The incorporation of Satisfaction Index (SI) and Dissatisfaction Index (DI) coefficients further enables the quantitative estimation of each attribute’s contribution to overall user experience [
48,
49].
WebQual provides a structured mechanism for measuring perceived website quality through the dimensions of usability, information quality and interaction quality [
34]. These dimensions capture how users experience the website and identify areas where perceptions of quality may be weakened. Nevertheless, WebQual primarily serves as a diagnostic instrument and does not explicitly distinguish between attributes that merely prevent dissatisfaction and those that can generate greater satisfaction [
4,
5,
34].
While WebQual and Kano identify what users value and how specific attributes influence satisfaction, neither framework directly translates these findings into operational development priorities. This role is fulfilled by Quality Function Deployment [
51]. Through the House of Quality matrix, QFD systematically translates user requirements into technical specifications, enabling organisations to prioritise improvement actions based on their expected impact on user satisfaction and organisational objectives [
15,
51,
52,
53].
The integration of these three approaches establishes a sequential analytical process. First, WebQual identifies the dimensions through which users evaluate website quality. Second, the Kano Model classifies these attributes according to their influence on satisfaction and dissatisfaction. Third, QFD transforms these insights into prioritised technical requirements that guide redesign and development decisions. This progression enables organisations to move from diagnostic evaluation to evidence-based intervention [
15,
52,
53].
Previous studies have demonstrated the value of combining user-perception models with requirement-prioritisation techniques across various digital contexts, including e-government services, educational platforms, tourism websites and mobile applications [
49,
54,
55,
56]. These studies consistently report improvements in the identification of user requirements, prioritisation accuracy and alignment between design decisions and user expectations [
15,
52,
53,
54,
55,
56]. However, existing research remains fragmented, frequently applying only partial combinations of these methodologies or focusing on isolated dimensions of digital quality. Comprehensive frameworks that simultaneously evaluate perceived website quality, classify user expectations and translate these findings into technical priorities remain comparatively scarce.
The systematic review presented in
Appendix A reinforces this observation. Although previous studies have successfully applied combinations of WebQual, Kano and QFD in domains such as tourism, digital health, e-government and higher education, few studies have integrated all three approaches within a single evaluation framework that links diagnosis, prioritisation and implementation. This gap is particularly evident in institutional and territorial development platforms, where usability, information quality and stakeholder engagement are critical success factors.
Furthermore, user-centred evaluations do not always converge with expert assessments. Research on usability evaluation consistently shows that users and experts often identify different categories of problems [
39,
41]. Users tend to focus on task accomplishment, information clarity, and the experiential aspects of interaction, whereas experts are more likely to identify issues related to interface consistency, accessibility, compliance, and information architecture [
39,
41]. Consequently, combining user-based assessment with expert heuristic evaluation can provide a more comprehensive understanding of website quality than either approach alone.
Building on these considerations, the present study adopts an integrated WebQual–Kano–QFD framework complemented by expert heuristic evaluation. In addition to the three principal models, the heuristic checklist proposed by Veríssimo et al. [
41] provides a valuable complementary perspective by offering a comprehensive set of indicators covering content quality, design, navigation and educational functionalities. This approach seeks not only to assess the quality of the Interior+ platform from the user perspective but also to identify the relative importance of quality attributes, prioritise improvement actions and compare user perceptions with expert evaluations. By combining perceptual assessment, expectation analysis, technical prioritisation and heuristic inspection, the proposed framework contributes to a more comprehensive and actionable methodology for evaluating institutional digital platforms.
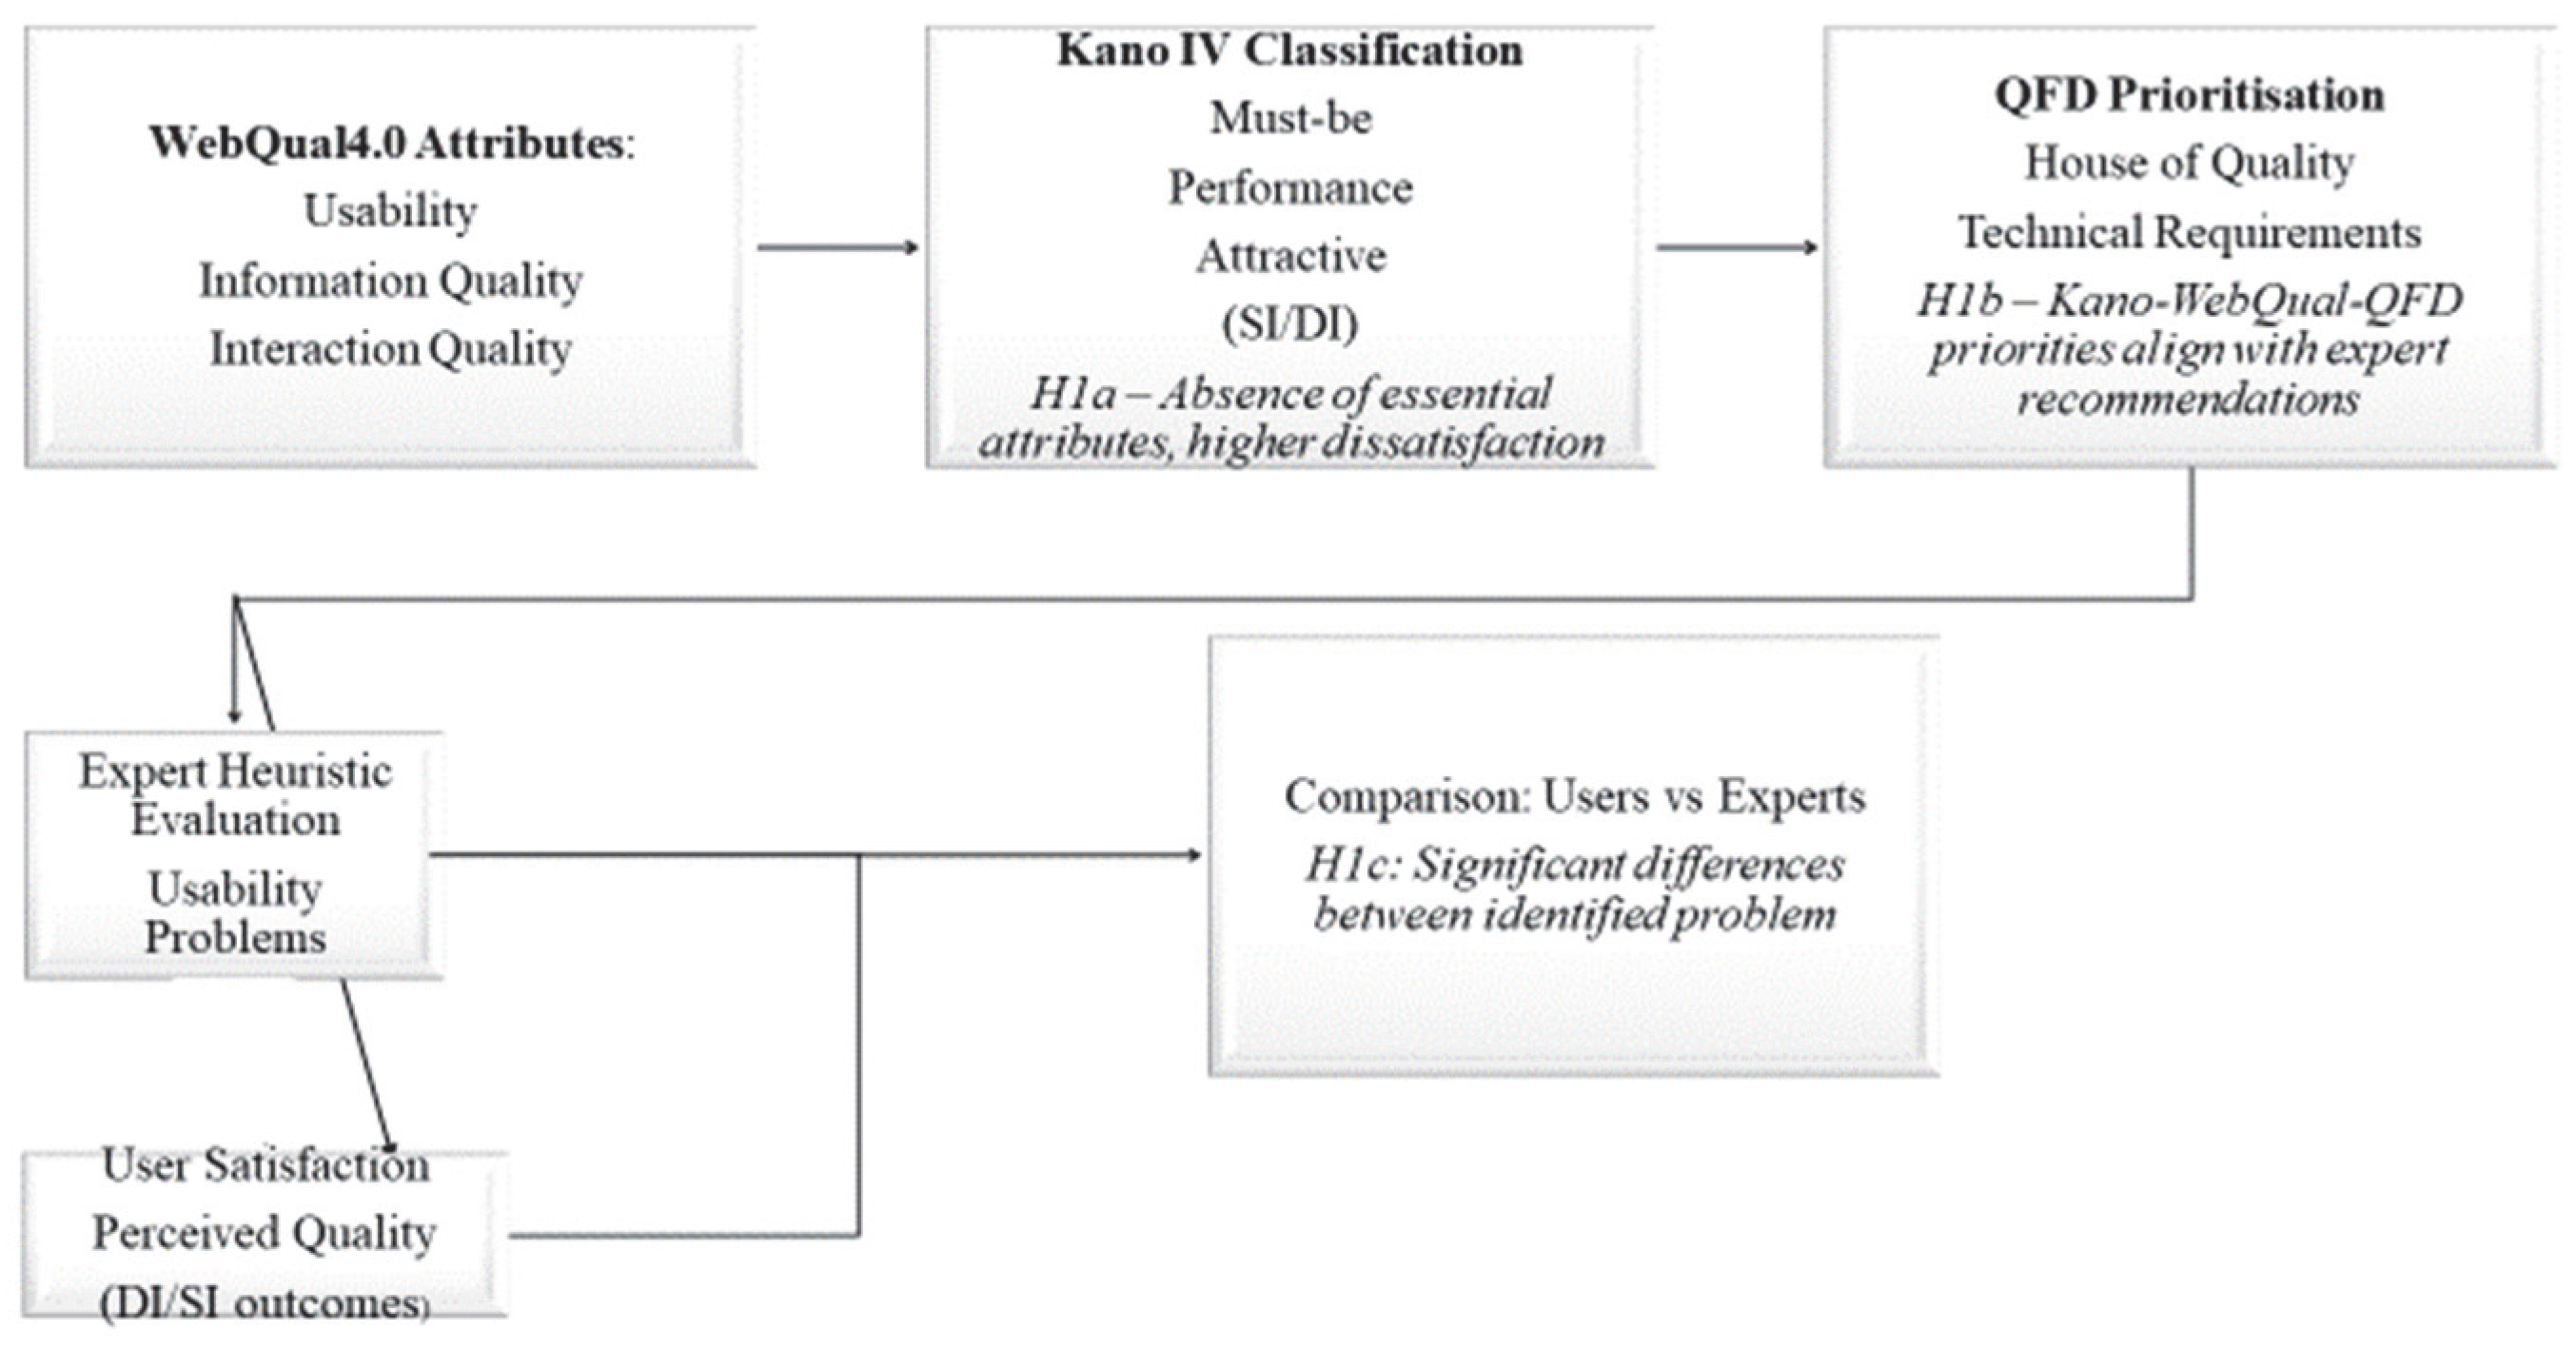
Figure 1 summarises the conceptual framework guiding the study. WebQual dimensions are evaluated based on user responses, interpreted using the Kano Model, and translated into technical priorities through QFD. These results are subsequently compared with expert heuristic evaluations to examine areas of convergence and divergence in website quality assessment.
In summary, the integration of the Kano, WebQual 4.0, and QFD models, complemented by proposals such as Veríssimo et al. [
41], constitutes one of the most comprehensive and effective approaches currently available for evaluating digital usability. By combining user-centred diagnosis, evaluative structure and strategic operationalisation, this articulation not only identifies flaws or gaps but guides the design of more functional, intuitive digital experiences aligned with the values and objectives of the institutions.
3. Materials and Methods
3.1. Research Design
This study adopted a mixed-methods design integrating user-centred evaluation, expert heuristic inspection and requirement-prioritisation techniques to assess the usability and perceived quality of the Interior+ digital platform. The methodological framework combined three complementary approaches, WebQual, the Kano Model and Quality Function Deployment (QFD), supported by an independent expert evaluation based on established usability heuristics.
The research design followed a convergent triangulation logic in which quantitative user perceptions and qualitative expert assessments were analysed independently and subsequently integrated through a QFD prioritisation process. This approach enabled the identification of user expectations, the assessment of perceived website quality, the detection of usability issues from an expert perspective and the translation of these findings into prioritised design recommendations.
The methodological framework was informed by a preliminary documentary analysis and a targeted literature review examining empirical applications of WebQual, Kano, and QFD in digital service environments. Previous studies consistently demonstrated that integrating user-perception models with prioritisation techniques improves the identification of critical usability attributes and supports evidence-based design decisions [
15,
46,
49,
52,
53,
54,
55,
56,
57].
To better explain the proposed methodology and for reproducibility, the operational workflow of this study is summarised in
Table 1.
In parallel with the user-based stages, an independent heuristic evaluation was carried out by a group of UXD specialists. These experts applied a checklist based on Veríssimo et al. [
41], which covered criteria including content clarity, navigation, design consistency, accessibility, and overall interface structure.
This expert evaluation served as a qualitative triangulation layer, providing an independent baseline grounded in recognised usability principles and feeding the QFD matrix as a secondary source of requirements, allowing for comparison between user perceptions and expert diagnoses.
The use of expert evaluation in UXD and UID is widely supported. As argued by Nielsen [
42], heuristic inspection is efficient in early-stage diagnostics, enabling the detection of structural issues even without direct user participation. The model used here, Veríssimo et al. [
41], provides a validated and comprehensive framework for analysing institutional websites.
This study follows a mixed-methods design with convergent predominance (see
Table 2), combining:
Quantifiable attitudinal instruments (Kano; WebQual 4.0) to measure expectations, satisfaction levels, and perceived quality;
Qualitative heuristic analysis by experts to assess compliance with usability guidelines and detect structural issues not visible in self-report measures;
QFD as an operational and decisional method to transform perceptions and heuristic findings into prioritised design requirements.
Table 2.
Methodological paradigm and complementarity of approaches.
| Paradigm | Method(s) | Purpose | Strengths | Conceptual Limitations | Contribution to Triangulation |
|---|
| Attitudinal/Quantitative | Kano Model | Measure user expectations and classify qualities (must-be, attractive, indifferent). Calculate SI/DI. | Identifies critical satisfaction drivers and distinguishes between basic and attractive features. | Self-report bias: does not capture real-time behaviour; dependent on user awareness. | Provides perception-based priorities grounded in user expectations. |
| Attitudinal/Quantitative | WebQual 4.0 | Measure perceived usability, information quality, and interaction quality. | Standardised, comparable metrics; strong literature foundation. | Purely perceptual; sensitive to prior familiarity; limited behavioural insight. | Complements Kano by quantifying satisfaction across multiple UX dimensions. |
| Qualitative/Heuristic | Expert Checklist Evaluation | Identify usability, accessibility, and interaction issues using design principles. | Independent of user experience, it is fast and identifies structural issues that surveys may miss. | Not based on actual user behaviour; subject to expert bias; cannot detect emotional responses. | Offers normative evaluation baseline; validates or contrasts user perceptions. |
| Operational/Decisional | QFD (Quality Function Deployment) | Prioritise design requirements by integrating user and expert data. | Structured; transparent; links need to design actions; produce ranked improvements. | Quality depends on inputs; it does not directly measure usability. | Synthesises all evidence into actionable design priorities. |
These methods are epistemologically different and thus contribute complementary forms of evidence. Their conceptual limitations justify the following triangulated design.
Kano Model: Captures perceptions and expectations, but not real-time behaviour.
WebQual 4.0: Provides perceptual metrics but may be influenced by familiarity or subjective bias.
Heuristic inspection: Identifies structural issues from a design-expert perspective but does not reflect actual user behaviour or emotional reactions.
QFD: Structures decision-making but depends entirely on the quality of inputs.
The integration of these layers overcomes the limitations of isolated approaches, resulting in a more robust model for user-centred design, particularly in contexts involving heterogeneous audiences and institutional digital services.
The adopted methodology aligns with recent empirical literature applying the Kano, QFD, and WebQual models in digital environments. These studies similarly employ structured surveys, attribute prioritisation, and multi-criteria analysis to capture user expectations and translate them into design requirements.
3.6. Data Analysis
Responses to the functional and dysfunctional questions were analysed using the Kano evaluation matrix. Attributes were classified as must-be, one-dimensional, attractive, indifferent, or reverse, based on users’ response patterns [
47].
To quantify the influence of each attribute on user experience, Satisfaction Index (SI) and Dissatisfaction Index (DI) coefficients were calculated following established Kano procedures [
48,
49]. These indicators estimate the potential contribution of an attribute to user satisfaction when present and dissatisfaction when absent.
WebQual responses were analysed descriptively to characterise users’ perceptions across the dimensions of usability, information quality and interaction quality. These results complement the Kano classification by providing additional evidence regarding the perceived quality of specific website attributes.
The findings obtained from the Kano and WebQual analyses were integrated into a House of Quality matrix. User requirements (WHATs) were derived primarily from attributes with higher potential for dissatisfaction (DI values) and lower perceived quality scores.
Technical requirements (HOWs) were derived from the expert heuristic evaluation and represented specific design interventions to address the identified user needs.
Relationships between WHATs and HOWs were coded using standard QFD relationship weights: 0 = no relationship; 1 = weak relationship; 3 = moderate relationship; 9 = strong relationship.
The priority score for each technical requirement was calculated as:
where
denotes the estimated priority score of requirement j in the QFD model;
DIi represents the dissatisfaction index of attribute i, expressed in absolute terms |DIi|;
rij is the relationship strength between attribute i and requirement j, typically coded as 0 (no relationship), 1 (weak), 3 (moderate), and 9 (strong);
indicates the summation over all user attributes i associated with requirement j.
The resulting prioritisation enabled ranking of improvement actions by their expected contribution to user satisfaction.
The results of the user evaluation and expert inspection were subsequently compared to identify areas of convergence and divergence between user perceptions and expert assessments. This comparison provided additional insight into how different stakeholder groups perceive website quality and usability issues.
4. Results
In the case of the Interior+ project website, applying the Kano model revealed distinct patterns in how different attributes influence the user experience. Attributes such as usability and responsiveness presented high Dissatisfaction Index (DI) values, indicating that their absence generates strong dissatisfaction and therefore constitutes a priority for intervention. Within the Kano framework, these attributes behave as must-be requirements, as users take their presence for granted and only notice them when performance is inadequate.
Conversely, search personalisation and multimedia content were identified as attractive. Although not explicitly expected by users, their presence can significantly enhance the user experience and represents a strategic opportunity for differentiation.
A particularly relevant finding concerns attributes associated with assisted usability, such as persistent tutorials, extensive explanations, or intrusive help elements. These were perceived negatively by users with higher levels of digital literacy, suggesting a reverse effect in specific contexts. Rather than supporting interaction, such elements may hinder the experience by reducing interface autonomy or fluidity. This result highlights the importance of designing adaptive or optional support mechanisms rather than imposing guidance.
In parallel, the expert evaluation highlighted strengths in visual clarity, readability, and graphic consistency, all of which contribute to the website’s institutional credibility. However, experts also identified limitations in the depth of information and the content hierarchy, indicating that the platform does not yet fully accommodate diverse user information needs.
The triangulation between user and expert perspectives revealed both convergence and divergence. While both groups emphasised the importance of clarity, responsiveness, and intuitive navigation, differences emerged regarding the usefulness of navigational aids. Elements such as explanatory menus and help features were valued by experts but often rejected by more experienced users, underscoring the need for flexible, user-adaptive design solutions.
Finally, the Kano results were integrated into the QFD matrix, enabling the translation of user perceptions into prioritised technical requirements. Attributes such as usability and security were identified as high priority due to their strong association with dissatisfaction. This integration ensured that design decisions were grounded in empirical evidence, combining user perceptions, expert evaluation, and structured prioritisation into a coherent framework for intervention.
4.2. Distribution by Categories Kano
The second stage of the analysis was based on the categorisation of attributes according to the principles of the Kano model, which allows us to understand how different functionalities affect the user experience in a nonlinear way. This approach classifies attributes into four main categories, must-be, one-dimensional, attractive, and reverse, based on their previously presented SI and DI scores.
The distribution of attributes across the Kano quadrants reveals the following consistent and theoretically meaningful patterns.
Attributes should not be classified as reverse attributes: High DI values instead point to −0.695 and −0.681, meaning that their absence strongly impairs the experience, thereby characterising them as must-be attributes within the Kano logic. The results clearly reveal that users take these elements for granted, whereas significant dissatisfaction arises when they are poorly implemented. It could be that the only components that would act like reverse attributes for those users with high digital fluency are specific interface elements related to assistance, such as intrusive tutorials or explanatory overlays that refuse to turn off, but not usability or responsiveness as functional constructs.
Attributes classified as must-be and one-dimensional: Clarity of information, up-to-datedness, and security, are perceived as minimum requirements, the absence of which causes high dissatisfaction, but whose presence is not a reason for enthusiasm.
Attractive attributes: Personalisation and multimedia elements are not expected by all users, but when present, they generate positive surprise and contribute to differentiation.
Visual design attribute (SI = 0.451; DI = −0.553) falls within an intermediate zone, suggesting a dual role. It contributes to perceived quality and differentiation but has a less direct impact on dissatisfaction than core functional attributes.
To better visualise the relationship between the SI and DI indexes,
Table 4 presents the coordinate matrix used to position attributes according to their Satisfaction Index (SI) and Dissatisfaction Index (DI).
This mapping highlights three distinct strategic zones. The first corresponds to a critical intervention area, where attributes such as usability and responsiveness combine to produce high dissatisfaction alongside comparatively low satisfaction, indicating that their absence severely compromises the user experience. The second represents a baseline quality zone, encompassing attributes such as information quality and security, which are perceived as fundamental requirements whose absence generates dissatisfaction but whose presence does not significantly enhance satisfaction. Finally, the attractive differentiation zone includes attributes such as customisation and multimedia elements, which are characterised by higher satisfaction and lower dissatisfaction, suggesting they serve as value-adding features that enhance the experience without being strictly essential.
The cross-reading between the quantitative data of the Kano model and the visual categorisation of
Table 4 reinforces the need to concentrate improvement efforts on attributes classified as critical, especially those with high perceived dissatisfaction. At the same time, elements recognised as attractive, although not a priority, represent strategic opportunities for differentiation, especially with users with greater digital literacy or aesthetic sensitivity.
Based on this analysis, the identified attributes were integrated into the QFD matrix, which translates users’ voices into technical requirements and intervention priorities. This final stage of the methodology constitutes the operative link between the evaluation of the experience and the planning of future improvements, anchoring the design process in systematised empirical evidence.
To operationalise user-expressed needs into concrete design actions, a reduced House of Quality was constructed, as shown in
Table 5. The Kano-derived DI values were used as weighting coefficients reflecting the dissatisfaction potential of each attribute, while WebQual responses provided semantic refinement. This allows for the translation of user priorities into implementable design specifications.
In general, QFD prioritisation indicates that improvements to information retrieval and navigational clarity (search, breadcrumbs, terminology) have the highest relevance to users and the strongest potential to mitigate dissatisfaction. Personalisation and visual enhancement features, though, serve purely as secondary amplifiers rather than as determinants of structural usability.
The fact that such attributes as Usability and Quality of Information present both high DI magnitude and high M/O counts−25/40 and 25/40, respectively suggests that the dissatisfaction potential is driven by an important share of the user base, not by extreme outliers. This strengthens the claim that these attributes behave as must-be conditions within the Kano logic structure.
To formally test H1a, one-sample
t-tests (
Table 6) were conducted on dysfunctional response scores (scale 1–5), using the neutral midpoint (3) as the test value. In parallel, Wilcoxon signed-rank tests were applied to ensure non-parametric robustness of the findings.
The results indicate that usability, responsiveness, and information quality are all significantly above the neutral midpoint. These findings indicate a strong dissatisfaction effect associated with the absence of these attributes.
Visual design and customisation also differ significantly from the neutral point, albeit with comparatively smaller effects. In contrast, security and privacy do not significantly deviate from neutrality, suggesting a more ambivalent perception among respondents.
Overall, these results support H1a, confirming that the absence of essential system attributes, particularly usability, responsiveness, and information quality, elicits statistically significant dissatisfaction.
Although the Kano DI values for usability and responsiveness are high, indicating potential dissatisfaction in the event of failure of these attributes, the questionnaire indicates that no usability or responsiveness problems were reported by users (
Table 7—0/40). The high value of DI must, therefore, be due to the expectations-based potential for dissatisfaction rather than to any records of failure. This is the point where the distinction between inferred dissatisfaction (Kano logic) and explicit dissatisfaction (user-reported) comes into play.
As shown in
Table 7, only two security-related attributes-both protection of personal data and clarity of privacy/cookies information-converge: there, 17 out of 40 users and all 4 experts flag this heuristic failure. In all other respects, users report issues (17/40) where experts do not, with regard to information clarity, and several structural issues, such as breadcrumbs, FAQs, download options, and contextual help, are detected by experts alone and not assessed directly in the user questionnaire. Overall, concordance is limited, supporting the view that user feedback and expert inspection provide diagnostic evidence for different layers of usability.
This is because the latent nature of expectations explains the apparent discrepancy between high DI values and the absence of user complaints: the DI represents latent expectations rather than consciously articulated problems. Therefore, usability and responsiveness must be treated as must-be attributes, not reverse attributes.
The integration of Kano, WebQual, and QFD produced a prioritisation of requirements that aligns with expert recommendations in key areas, particularly regarding information clarity, navigation, and security. To assess H1b, the prioritised requirements generated through the integrated Kano–WebQual–QFD framework were compared with the critical usability issues independently identified by the expert panel. Following previous multimethod usability studies, convergence was operationalised as the proportion of high-priority QFD recommendations that corresponded to issues also highlighted during the heuristic evaluation.
The convergence index was calculated as:
where
Ncommon represents the number of improvement priorities identified both by the integrated Kano–WebQual–QFD framework and by the expert heuristic evaluation;
NQFD represents the total number of priority improvements identified through the QFD analysis.
The QFD matrix identified five priority areas for intervention: usability, information clarity, responsiveness, navigation structure, and visual consistency. Four of these priorities were also independently identified by the UX experts during the heuristic evaluation.
The resulting convergence rate of 80% exceeds the a priori threshold of 70% for H1b. This result supports the hypothesis that the integrated Kano–WebQual–QFD approach produces a prioritisation of design requirements that is substantially consistent with expert-based usability assessment.
These findings confirm that the integrated methodological framework yields consistent and robust prioritisation outcomes, effectively translating user perceptions into actionable design requirements.
Differences between user and expert evaluations were examined using Fisher’s exact tests. Statistically significant differences were observed for the security of personal data (17/40 users vs. 4/4 experts; p = 0.044) and for privacy and cookie clarity (17/40 users vs. 4/4 experts; p = 0.044), indicating meaningful differences in perception between the two groups.
For clarity of information (17/40 users vs. 0/4 experts), the difference did not reach statistical significance (p = 0.147). However, the magnitude of the discrepancy suggests a potentially substantive effect that may not be adequately detected given the limited size of the expert sample.
Overall, these findings provide partial support for H1c, evidencing statistically significant differences in selected domains, particularly those related to security and privacy.
Table 7 summarises the concordance between user-reported issues and expert-identified problems. Overall, the results indicate limited agreement between the two perspectives.
In addition, Fisher’s exact tests confirm statistically significant differences only for the security of personal data and for privacy/cookies clarity (p = 0.044 for both), while all other comparisons do not reach significance, likely due to the limited number of expert evaluations.
These results provide partial support for H1c, suggesting systematic differences between user and expert perspectives. Users predominantly report experiential and perceptual issues encountered during interaction, whereas experts tend to identify structural and latent usability deficiencies, including missing navigational aids and support functionalities.
Therefore, it is possible to say that:
RQ1, which examined how usability and information-quality attributes influence user satisfaction and dissatisfaction, found that usability, responsiveness, and information clarity exhibited the highest dissatisfaction potential (DI values), confirming their role as critical quality attributes within the Interior+ platform. In contrast, personalisation features and multimedia content were generally classified as attractive attributes that contributed positively to the user experience when present but generated limited dissatisfaction when absent. These findings support the proposition that different website attributes exert differentiated effects on perceived value and user satisfaction.
RQ2, which investigated whether the integration of the Kano Model, WebQual 4.0 and QFD could generate a consistent prioritisation of technical improvements, demonstrated substantial convergence between user-derived priorities and expert recommendations. The QFD matrix translated the attributes identified through Kano and WebQual into actionable design requirements, while the comparison with the heuristic evaluation revealed that four of the five highest-priority improvements were independently identified by the expert panel. The convergence rate was calculated to be 80%, exceeding the predefined threshold of 70%. This result indicates that the integrated framework provides a coherent and operational mechanism for transforming user perceptions into technical priorities.
RQ3 explored potential divergences between user perceptions and expert evaluations. The results revealed both convergence and divergence patterns. While users and experts agreed on the importance of usability, visual consistency and navigation quality, a notable discrepancy emerged regarding information clarity. A considerable proportion of users reported difficulties in understanding or locating information, whereas this issue was not identified as critical during the expert heuristic inspection. This finding suggests that user-centred and expert-based evaluation methods capture different dimensions of website quality and therefore provide complementary rather than interchangeable sources of evidence.
H1a was supported by significant t-test and Wilcoxon results for usability, responsiveness and information quality.
H1b was supported through the observed convergence between QFD-derived priorities and expert recommendations, exceeding the predefined 70% threshold.
H1c received partial support, as significant differences were observed for security-related attributes, whereas information clarity differences did not reach statistical significance.
4.3. Heuristic Evaluation: Website Strengths and Weaknesses According to Experts
The qualitative evaluation was conducted by four experts in User Interface and User Experience Design, based on the checklist developed by Veríssimo et al. [
41], which combines visual, functional, and structural criteria to assess the quality of institutional websites. The technical analysis revealed solid performance of the website across the visual, structural, and typographic domains. Elements such as chromatic coherence, clarity of titles and subtitles, organisation of information and graphic consistency were widely valued. These aspects make a decisive contribution to smooth navigation, readability and the perception of confidence in the interface, essential indicators of effective design.
The typographic clarity, the uniformity of the visual language, and the clear hierarchy of the content stood out as high-quality dimensions, reflecting good practices in User Interface Design. The adequacy of the layout to its communicative functions, as well as the overall structure of the navigation, was also noted positively, revealing an effective alignment between form and function.
Although specialists emphasise visual consistency, typographic hierarchy, and overall aesthetic excellence, this does not conflict with the user-indicated potential dissatisfaction with visual design. The distinction lies in the aspect under evaluation: experts view the visual component as a fundamental element of interface quality, whereas users engage with it primarily as a means of functional communication. Those with digital literacy often benefit from clear visual cues and support, while highly literate users often see excessive visual guidance as unnecessary. Thus, the apparent discrepancy does not reflect contradictory evaluations, but rather different modes of perceptual engagement, aesthetic-structural for experts and functional–operational for users.
On the other hand, the least valued aspects focused on specific functional absences, such as the lack of an internal search tool, persistent help features, and content download options. While not universal requirements, their omission may negatively affect certain user profiles, especially those with lower digital literacy or more advanced expectations of control and exploitation. The absence of mechanisms such as breadcrumbs and contextual guidance tools limits the interface’s scalability in more complex informational environments.
It is important, however, to highlight that the lack of a frequently asked questions (FAQs) section, also mentioned by the experts, should not be automatically interpreted as a failure. Given the predominantly descriptive and informative nature of the Interior+ project and its lack of transactional functionality, this functionality may not be necessary within the current framework.
In summary, the application of the checklist (
Table 8) enabled the identification of the website’s main strengths, including clarity, coherence, and aesthetics, while also highlighting concrete opportunities for functional improvement. These results complement the data obtained from users and help consolidate an integrated reading of the platform’s quality, supported by objective criteria for usability, accessibility, and alignment with the institutional mission.
The results confirm that usability attributes such as clarity and responsiveness are essential for user satisfaction. These findings align with prior studies on institutional UX design (e.g., [
42,
50]).
4.4. Triangulation and Integration of Findings
The expert evaluation, conducted by four UID/UXD specialists, identified clear strengths in the website’s visual design, particularly in visual clarity, readability, and graphic consistency. These aspects were considered to reinforce the platform’s institutional credibility and overall professional appearance. At the same time, experts highlighted important limitations, notably in the depth of information provided, the content’s structure, and the extent to which the information architecture accommodates users with different profiles and needs.
When compared with user findings, a pattern of both convergence and divergence emerges. There is clear agreement between users and experts regarding the importance of clarity, responsiveness, and intuitive navigation, which are consistently identified as core determinants of quality. However, divergences arise regarding specific interface elements, particularly navigational aids. While experts tend to value explanatory structures such as enriched menus and guidance mechanisms as supportive of usability, experienced users often perceive these same elements as potentially intrusive or unnecessary, suggesting differences in expectations and interaction strategies between groups.
This triangulated interpretation is further reinforced by integrating the results into the QFD (Quality Function Deployment) framework. Kano-derived dissatisfaction indices were used as weighting factors in a reduced House of Quality, thereby translating user perceptions into prioritised technical requirements. In this context, usability, responsiveness, and information quality emerged as the highest-priority attributes due to their strong association with dissatisfaction when underperforming. WebQual data complemented this process by refining the semantic interpretation of user needs, supporting their translation into actionable technical specifications.
The resulting QFD prioritisation indicates that improvements in information retrieval mechanisms, navigation clarity (including search functionality, breadcrumbs, and terminology consistency), and content structuring would have the greatest impact on reducing user dissatisfaction. Conversely, features such as personalisation and visual enhancement, while still relevant to the user experience, function primarily as secondary contributors that enhance perceived quality rather than address fundamental usability concerns.
The distribution of high dissatisfaction indices, together with substantial frequency values for key attributes (e.g., usability and information quality), suggests that negative perceptions are widespread across users rather than concentrated in isolated cases. This reinforces their classification as must-be attributes, in line with Kano theory, and highlights their foundational role in shaping user satisfaction.
Overall, the findings provide consistent empirical support for the proposed hypotheses and the integrated methodological approach. Core functional attributes operate as must-be requirements, generating strong latent dissatisfaction when absent or insufficiently implemented. In contrast, enhancement attributes contribute to positive user experience but do not constitute essential conditions for baseline satisfaction.
The triangulation between users and experts demonstrates that both perspectives are complementary: users provide evidence of experienced and perceived interaction issues, while experts identify structural and latent deficiencies that may not be immediately visible to end users. Although alignment exists in key areas such as clarity and responsiveness, statistically and conceptually significant divergences remain, particularly regarding navigation support features.
Finally, the combined application of Kano, WebQual, expert evaluation, and QFD demonstrates strong methodological coherence and produces a robust, empirically grounded prioritisation of design requirements. This integrated approach enables a more comprehensive understanding of the user experience on institutional websites, supporting evidence-based, user-centred redesign decisions.
5. Discussion
5.2. Prioritisation of Improvement Actions Through the Integrated WebQual–Kano–QFD Framework
One of the main contributions of this study lies in the integration of WebQual, the Kano Model and Quality Function Deployment within a single analytical framework. While previous studies have applied these approaches independently or in partial combinations [
15,
46,
52,
53,
54,
55,
56], fewer studies have employed them sequentially to support evidence-based prioritisation of website improvements.
The integration proved particularly valuable because it enabled the translation of subjective user perceptions into operational design priorities. The Kano analysis identified which attributes had the greatest potential to generate dissatisfaction, whereas WebQual provided complementary evidence regarding perceived website quality. QFD subsequently transformed these findings into a structured hierarchy of technical requirements.
The prioritisation process demonstrated that not all identified usability issues contribute equally to the overall user experience. Some attributes exhibited relatively modest quality scores but generated substantial dissatisfaction when absent, indicating that they should receive priority attention during redesign processes. This finding reinforces the value of combining satisfaction-based models with requirement-prioritisation tools rather than relying exclusively on descriptive usability metrics.
Furthermore, the comparison between prioritised user requirements and expert recommendations revealed a substantial degree of convergence. The 80% convergence observed between the QFD priorities and the expert recommendations provides empirical support for the methodological integration proposed in this study. Although users and experts approached the website from different evaluative perspectives, both groups identified largely similar priorities concerning usability, navigation efficiency and information quality. This finding suggests that the integrated Kano–WebQual–QFD framework can translate user perceptions into design priorities that are broadly consistent with established usability principles.
The findings therefore support the proposition that combining WebQual, Kano and QFD offers a practical mechanism for translating user expectations into strategic design decisions, thereby strengthening the connection between usability evaluation and website development processes.
The QFD analysis reinforced the patterns identified in the previous stages of the study and demonstrated the practical value of integrating WebQual, the Kano Model and Quality Function Deployment within a single analytical framework. Attributes associated with usability, responsiveness, and information clarity, which exhibited higher potential for dissatisfaction in the Kano analysis, emerged as the highest-priority areas for intervention in the QFD matrix. This finding is consistent with previous studies applying Kano–QFD integrations in digital environments, which similarly identified navigation efficiency, information accessibility and service responsiveness as critical determinants of user satisfaction [
46,
52,
53,
54,
55].
The prioritisation process also highlighted the asymmetric nature of user expectations. While attributes such as usability and information clarity were associated with basic or performance requirements, personalisation features and multimedia resources emerged as attractive attributes. These elements were positively valued by users when present but did not generate substantial dissatisfaction when absent. Such findings support Kano’s proposition that not all quality attributes contribute equally to user satisfaction and that development efforts should be differentiated based on the role each attribute plays in shaping the user experience [
47,
48,
49].
The results further suggest that users of institutional platforms tend to favour solutions that are integrated, intuitive and non-intrusive. Features that support navigation and information access are appreciated when they operate seamlessly in the background rather than demanding continuous user attention. This observation aligns with the principle of “invisible design” proposed by Maeda [
54], which holds that the most effective digital experiences minimise cognitive effort and enable users to accomplish their goals with minimal friction. For a platform such as Interior+, which serves heterogeneous audiences with diverse levels of digital literacy and domain knowledge, simplicity and clarity appear to be more important than the proliferation of advanced features.
The prioritisation obtained through QFD therefore demonstrates how user-centred evaluation can be translated into concrete development strategies. By identifying which attributes generate the greatest dissatisfaction when absent and which features act as differentiating elements, the integrated framework provides a structured basis for allocating resources and guiding future redesign initiatives.
5.3. User–Expert Divergence in the Evaluation of Information Clarity
A particularly noteworthy finding emerged from the comparison between user perceptions and expert evaluations. Although users frequently reported difficulties with information clarity and content comprehension, expert evaluators did not identify these concerns as major usability problems. This discrepancy illustrates how different evaluation paradigms capture different dimensions of website quality.
At the same time, the triangulation process revealed important areas of convergence. Both users and experts recognised the importance of visual clarity, consistency and coherent information organisation. However, divergence emerged regarding specific orientation and support mechanisms. Experts typically evaluate websites through established usability principles, focusing on aspects such as navigation consistency, accessibility compliance, visual hierarchy and information architecture [
39,
41,
42]. Users, in contrast, assess websites primarily through the lens of task accomplishment and practical information needs. Therefore, some features considered useful from a design perspective were perceived by users as unnecessary or excessive, suggesting that the value of interface elements depends not only on their technical quality but also on how they fit users’ expectations and behavioural patterns.
In the context of the Interior+ platform, experts may have considered the information structure logically organised and compliant with accepted usability guidelines. From a technical perspective, the content may have appeared appropriately categorised, accessible and consistent with good design practice. However, users may have encountered difficulties in interpreting the information, understanding specialised terminology or identifying the most relevant content for their specific needs.
This distinction aligns with previous research suggesting that heuristic evaluation and user testing frequently uncover different usability problems [
39]. Whereas experts excel at identifying structural and interface-related deficiencies, users are more likely to reveal contextual and cognitive barriers that emerge during actual interaction with the system. Information that appears clear to domain specialists may not necessarily be perceived as clear by individuals with different levels of expertise, digital literacy or familiarity with the subject matter.
The nature of the Interior+ platform may further explain this discrepancy. The website serves a diverse audience that includes citizens, entrepreneurs, local development actors and organisations. Such heterogeneous audiences often possess varying levels of prior knowledge regarding funding programmes, territorial development initiatives and institutional terminology. Consequently, information structures that appear self-evident to experts may require additional contextualisation, simplification or guidance for end users.
From a practical perspective, this finding suggests that improving website quality should not focus exclusively on structural usability characteristics. Equal attention should be devoted to content comprehensibility, plain-language communication and information discoverability. Future redesign efforts could therefore benefit from adopting content design strategies, simplified terminology, clearer labelling systems, and user-centred information architecture.
The identification of attributes classified as reverse within the Kano analysis further supports this interpretation. Certain support and guidance mechanisms, traditionally regarded as helpful usability features, were perceived negatively by some participants. This finding may reflect increasing levels of digital literacy and user autonomy, particularly among individuals accustomed to contemporary web navigation standards. Rather than requiring extensive guidance, many users appear to prefer direct, self-explanatory interfaces that minimise interruptions and unnecessary assistance.
These findings reinforce previous research indicating that expert evaluations and user-centred assessments should be viewed as complementary rather than competing approaches [
39,
41,
42]. Whereas experts are particularly effective at identifying structural, accessibility and consistency issues, users provide insight into contextual, cognitive and experiential barriers that may not be apparent during heuristic inspection. The observed divergence, therefore, strengthens the rationale for adopting multimethod evaluation frameworks that integrate diverse perspectives on digital quality.
5.4. Implications for Institutional and Territorial Development Platforms
Beyond the specific context of the Interior+ platform, the study contributes to the growing body of research advocating multimethod approaches to digital service evaluation. The findings demonstrate that attitudinal instruments, heuristic inspections and prioritisation frameworks can be systematically combined to generate richer and more actionable evidence than any single method alone.
The proposed framework advances current understanding of how perceptual, motivational and technical dimensions of usability interact within institutional digital environments. By integrating qualitative assessment through WebQual, expectation classification through the Kano Model and technical prioritisation through QFD, the methodology provides a structured mechanism for translating subjective perceptions into objective design priorities.
From a practical perspective, this approach offers a replicable model for evaluating public, educational and territorial development platforms. Such websites frequently serve diverse user groups with varying needs, levels of expertise and digital competencies. Under these conditions, design decisions must balance usability, accessibility, information quality and resource constraints. The integrated framework assists decision-makers in identifying which improvements are most likely to enhance user satisfaction while remaining technically feasible.
More broadly, the results demonstrate that structured multi-model evaluations can contribute to the development of more inclusive, equitable and user-centred digital services. By systematically translating user perceptions and expert assessments into prioritised technical requirements, organisations are better equipped to improve accessibility, clarity and responsiveness, dimensions that are fundamental to the effectiveness of institutional digital platforms.
The findings have broader implications for institutional websites and territorial development platforms. Such platforms often perform multiple functions simultaneously, including information dissemination, stakeholder engagement, service promotion and resource access. As a result, they face particular challenges in balancing informational complexity with usability and accessibility requirements.
The results suggest that users prioritise clarity, ease of navigation and information accessibility over more sophisticated or innovative interface features. This observation supports previous studies indicating that institutional websites are evaluated primarily on their ability to facilitate efficient information retrieval and support goal-oriented tasks [
4,
11,
33].
For managers and designers of territorial development platforms, the findings highlight the importance of adopting evidence-based evaluation methodologies that incorporate both user perspectives and expert judgement. The integrated framework proposed in this study offers a possible approach to systematically identifying opportunities for improvement and translating them into prioritised design interventions.
In addition, the study demonstrates the practical value of combining perceptual evaluation, expectation analysis and technical prioritisation. Such integration may be particularly useful for organisations operating under resource constraints, as it helps ensure that redesign efforts focus on improvements most likely to enhance user satisfaction and perceived service quality.
5.5. Limitations and Future Research
Several limitations should be considered when interpreting the results, and therefore, they should be interpreted as exploratory rather than confirmatory.
First, the study relied primarily on self-reported user perceptions collected through survey instruments. Although these methods provide valuable insights into satisfaction and perceived quality, they do not directly capture actual user behaviour during interaction with the website.
Second, the study relied primarily on perceptual survey data and heuristic inspection. Behavioural usability indicators, such as task completion rate, time on task, navigation paths, clickstream analysis, and error rates, were not collected. Consequently, the findings reflect users’ perceived experiences rather than objectively observed interaction behaviour. Future research should integrate behavioural and observational measures with perception-based instruments to provide a more comprehensive assessment of website usability and user experience.
Third, the expert evaluation involved a relatively small panel of four specialists. While consistent with established usability evaluation practices, a larger and more diverse expert panel could provide additional perspectives and strengthen the robustness of the findings.
Fourth, the study focused on a single institutional platform within a specific territorial development context. Consequently, the generalisability of the findings to other types of websites should be considered with caution.
Finally, no behavioural usability metrics were collected. Measures such as task completion rates, error rates, time-on-task, navigation paths or clickstream analysis could provide complementary evidence regarding actual user performance and interaction patterns. Future studies should consider integrating behavioural analytics with perceptual and heuristic evaluation methods to obtain a more comprehensive understanding of digital user experience.
Future research may also explore longitudinal applications of the integrated WebQual–Kano–QFD framework, allowing researchers to evaluate whether prioritised improvements effectively enhance user satisfaction over time and whether convergence between user and expert evaluations changes following redesign interventions. Such studies could combine perceptual, behavioural and expert-based evidence to generate a more holistic understanding of digital service quality.