Article

A Multi-Criteria Decision-Making Framework for Evaluating Interactive Experience in Smart Museums


1
Department of Digital Media Art, Jiangsu Second Normal University, Nanjing 210013, China
2
Department of Visual Design, Hanyang University, Ansan 15588, Republic of Korea
3
Department of Design, Sungkyunkwan University, Seoul 03063, Republic of Korea
*
Author to whom correspondence should be addressed.
Information 2026, 17(6), 586; https://doi.org/10.3390/info17060586
Submission received: 23 May 2026 / Revised: 8 June 2026 / Accepted: 10 June 2026 / Published: 12 June 2026
(This article belongs to the Special Issue New Applications in Multiple Criteria Decision Analysis, 3rd Edition)

Abstract

Smart museums increasingly rely on digital media, interactive installations, artificial intelligence, augmented reality, and virtual reality to support cultural communication and visitor engagement. However, existing studies have mainly examined specific technologies, usability, or visitor satisfaction, while a systematic and quantitative framework for comparing interactive experience across different smart museums remains limited. To address this gap, this study proposes a hybrid multi-criteria decision-making framework for evaluating smart museum interactive experience. Based on the Strategic Experiential Modules, an evaluation system consisting of five dimensions—Sense, Feel, Think, Act, and Relate—and sixteen indicators was constructed. The Analytic Hierarchy Process was used to determine subjective weights from expert judgments, the entropy method was applied to capture the data-driven dispersion characteristics of expert evaluation data, and a game-theoretic combination weighting strategy was used to integrate the two weighting results. Subsequently, the Technique for Order Preference by Similarity to Ideal Solution (TOPSIS) was employed to compare five representative smart museum cases. The results show that Zhejiang Provincial Museum achieved the highest relative closeness value (Ci = 0.9891), followed by Shanghai Museum (Ci = 0.8457) and Hunan Museum (Ci = 0.5326). Robustness analysis further showed that the ranking order remained consistent under entropy weights, AHP weights, average weights, and game-theoretic combined weights. The Friedman test indicated no significant difference in the relative closeness coefficients across weighting schemes (χ2 = 1.200, p = 0.753). These findings indicate that the proposed framework can effectively identify relative strengths and weaknesses in smart museum interactive experience and provide a replicable decision-support tool for experience-oriented museum design and optimization.

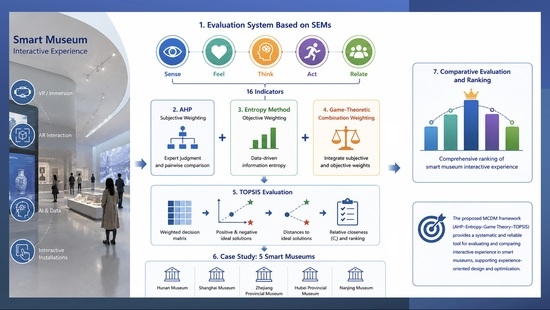
Graphical Abstract

1. Introduction

Museums, as important cultural and educational institutions, play an indispensable role in social development. In recent years, with technological advances and evolving social needs, the development focus of museums has gradually shifted from traditional exhibitions toward more interactive and participatory experiences. The educational role of museums has expanded from one-way knowledge transmission to providing interactive experiences and learning opportunities. Against the backdrop of rapid digitalization, globalization, and the knowledge economy, museums have made substantial investments—such as information and communication technologies (ICT), artificial intelligence (AI), augmented reality (AR), and virtual reality (VR)—to better serve the public and engage with the contemporary world; these technologies have become new carriers of museum content and new media for communication [1,2,3]. The “Smart Earth” strategy has been recognized by many countries, and digitalization, networking, and intelligence are expected to be major trends in future social development; accordingly, future museums will be smart museums that effectively integrate information technology with museum development [4].
The term “smart museum” originated from the fields of information, architecture, engineering, and construction (AEC); it has recently attracted increasing attention in tourism research as part of smart destinations (SD), where technology is embedded into tourism resources and used as a marketing platform [5]. According to the suggestions proposed by Bae et al. [6], a smart museum enables visitors to access museum content and participate in museum activities anytime and anywhere using smart devices. In smart museums, visitors can obtain information about exhibitions and event schedules via smart devices, search museum data, and participate in museum activities through interactive environments [7]. By integrating innovative technologies, smart museums also reshape visitors’ modes of engagement and their experiential perceptions. The application of ICT and smart technologies has been shown to improve visitor satisfaction, enhance interactive experience, and increase museum attractiveness [8].
The application of interactive technologies in museums has been widely demonstrated to play a critical role in enhancing visitors’ overall experience. However, to achieve sustained visitor engagement and deep immersion, relying solely on short-term attractiveness is insufficient; greater emphasis should be placed on the construction of “interactive experience”. In this regard, attractiveness can be understood as a transient outcome of interaction, whereas interactive experience represents a more enduring and multidimensional experiential process.
To address this gap, this study proposes a Smart Museum Interactive Experience Evaluation Framework (SMIEEF), which is a structured and integrated MCDM model specifically designed for evaluating interactive experience in smart museums. SMIEEF constructs a hierarchical indicator system based on five experiential dimensions: Sense, Feel, Think, Act, and Relate. It first uses the Analytic Hierarchy Process (AHP) to derive subjective weights from expert pairwise comparisons and then applies the entropy weight method to capture the objective dispersion of the evaluation data. To balance subjective judgment and objective data characteristics, a game-theoretic combination weighting strategy is further employed to generate the final comprehensive weights. Finally, the Technique for Order Preference by Similarity to Ideal Solution (TOPSIS) is used to compare and rank multiple smart museum cases. By applying this framework to five representative smart museums in China, this study aims to verify its applicability and robustness and to provide decision-support evidence for optimizing interactive systems in museums. Based on the above research gap, this study addresses the following research questions:
RQ1: How can interactive experience in smart museums be systematically evaluated through a multidimensional indicator framework?
RQ2: What are the relative importance weights of the evaluation indicators when subjective expert judgment and data-driven dispersion are integrated?
RQ3: How do the selected smart museum cases differ in terms of overall and dimension-level interactive-experience performance?
RQ4: Are the TOPSIS ranking results robust under different weighting schemes?
Unlike causal studies based on regression or structural equation modeling, this study does not examine independent and dependent variables in the traditional sense. Instead, it adopts a multi-criteria decision-making perspective. In this framework, the evaluation indicators function as decision criteria, the five selected smart museums function as alternatives, and the TOPSIS distances to the positive and negative ideal solutions and the relative closeness coefficient function as evaluation outcomes.
The contributions of this study are threefold. First, it constructs a multidimensional evaluation framework for smart museum interactive experience based on the Strategic Experiential Modules. Second, it integrates AHP, entropy weighting, and game-theoretic combination weighting to balance expert judgment and data-driven indicator dispersion. Third, it applies TOPSIS to compare multiple smart museum cases and provides both overall ranking results and dimension-level diagnostic information for experience-oriented museum optimization.

2. Literature Review

2.1. Research on Technology-Enabled Museum Interaction

Interactive technologies play a key role in enhancing museum attractiveness, involving not only the design of physical space and exhibition content, but also the roles of digital media and online interaction. In this context, museum attractiveness is primarily understood as an observable outcome of visitors’ engagement, while interactive experience constitutes the underlying experiential process that shapes such outcomes. Previous research on interactive museum experiences in primary-school contexts has emphasized the integration of physical interaction and digital content from cultural and historical museums [9]. Although the study focuses on an educational setting, its emphasis on the integration of physical and digital interaction provides relevant insights for understanding interactive experience design in museum contexts. The social interactivity of museums has been shown to extend beyond physical space by providing visitors with interactive social platforms that facilitate knowledge sharing, educational exchange, and cultural participation [10]. Such socially mediated interactions constitute an important component of interactive experience, particularly within the relational dimension of visitor experience. In virtual museum interfaces, technological features such as customization, interactivity, and navigability have also been found to positively influence visitor experience [11]. However, these effects are not solely attributable to technological features themselves, but also to how such features are experienced and interpreted during interaction. In addition, exhibits that stimulate visitor interaction and social interaction are more likely to enhance engagement, suggesting that carefully designed exhibits and interactive experiences can strengthen visitor participation and museum attractiveness [12]. In this regard, increased attractiveness can be interpreted as a cumulative effect of positive interactive experience rather than as an independent evaluative target.

2.2. Research on Interactive Experience in Museum Contexts

Interactive experience refers to a subjective experiential process formed through sustained interaction with museum digital systems, including interactive installations, virtual interfaces, and mobile guide systems. In this process, perception, emotion, cognition, and behavior are intertwined. It depends not only on sensory stimuli, such as visual and auditory elements, but also on emotional resonance, cognitive content communication, behavioral participation, and social-cultural connections formed through interaction [13,14]. This multidimensional understanding provides a conceptual basis for decomposing interactive experience into structured evaluation dimensions. In studies on digital culture, immersive exhibitions, and AR/VR interaction, interactive experience has gradually emerged as an independent object of evaluation. As museums and cultural institutions increasingly adopt immersive technologies such as virtual reality (VR), the quality of interactive experience directly affects visitor engagement, emotional resonance, and the depth of knowledge acquisition [15]. Accordingly, evaluating interactive experience quality has become a key concern across multiple disciplines, rather than a concept confined to a single technological context.
In the context of smart museums, interactive experience has increasingly moved beyond the traditional logic of short-term attention and attraction, becoming an important basis for evaluating visitor satisfaction and museum communication effectiveness. This shift reflects a transition from assessing immediate appeal to examining how experiences are perceived, interpreted, and internalized by visitors. Effective interactive experience has been associated with a deep understanding of target audiences’ interests, as well as the use of personalized content, dynamic engagement mechanisms, and multimodal interaction design to support sustained participation [16]. User experience research has also emphasized that experience is shaped not only by usability, but also by users’ emotional needs and psychological expectations during interaction [17]. This perspective reinforces the relevance of experience-centered evaluation in smart museum studies. Therefore, establishing a scientific and comprehensive evaluation mechanism for interactive experience can help identify shortcomings in current smart museum interaction design and provide theoretical and practical support for user-oriented optimization in complex technological environments. This is important for museums seeking to maintain their social influence and educational functions in the digital era.

2.3. Research on the Evaluation of Museum Interactive Experience

Current research on the evaluation of museum interaction mainly focuses on the effects of interactive technologies and systems, as well as the assessment of interactive installation design. Most existing studies concentrate on system performance, usability, or design effectiveness, rather than the holistic interactive experience. For example, evaluation research on virtual museum interaction systems has examined the relationship between learning performance and interaction systems and proposed score-sum-based methods to support improvements in attractiveness and interactivity [18]. Although such approaches are useful for identifying general performance trends, they provide limited insight into the multidimensional nature of interactive experience.
Other studies have developed heuristic evaluation scales for online virtual museum tours and identified improvement needs in visual authenticity, interactivity, navigation, and learning dimensions [19]. Research on science museum exhibits has also shown that diverse learning opportunities and participatory interaction are important characteristics of meaningful and enduring museum experiences [20]. In addition, usability-oriented evaluations of interface design principles in museum exhibitions have provided useful criteria for improving exhibition interfaces [21]. However, usability-oriented evaluation does not necessarily capture emotional, cognitive, and behavioral experiences during interaction.
Multidimensional frameworks have also been proposed for evaluating and comparing interactive installations in museums, emphasizing the complexity and diversity of interactive experience [22]. Nevertheless, such frameworks often lack a quantitative decision-making mechanism for comparing interactive experience across multiple cases. Therefore, a more systematic and quantitative evaluation framework is needed to integrate multidimensional experiential indicators and support comparative analysis among different smart museum cases.
Overall, existing evaluation studies still rely heavily on satisfaction surveys, visitor behavior observation, or system-oriented assessment methods. Although these approaches provide useful feedback for museum interaction design, they may overlook the emotional and experiential dimensions of interaction and often provide limited support for cross-case comparison. User-oriented feedback systems have contributed to understanding museum interaction, but they usually lack sufficient quantitative rigor for comparing multiple alternatives under a unified indicator system [23]. In addition, existing studies rarely integrate user experience, technological application, and museum design objectives into a comprehensive evaluation model. Problems such as subjective weight allocation, limited comparability among indicators, and insufficient treatment of information variation may further affect the reliability and interpretability of evaluation results. Therefore, addressing these limitations requires an integrated and quantitative evaluation approach that explicitly treats interactive experience as the core object of analysis.

2.4. Research on MCDM Methods and Their Applicability

Multi-criteria decision-making (MCDM) methods, such as the Analytic Hierarchy Process (AHP) and the Technique for Order Preference by Similarity to Ideal Solution (TOPSIS), have increasingly been applied to the comprehensive evaluation of e-tourism systems, online platforms, and cultural websites [24,25,26]. These methods have advantages in quantifying expert judgments, integrating multiple criteria, and supporting complex evaluation tasks [27]. As one of the foundational MCDM methods, TOPSIS evaluates alternatives by comparing their distances from the positive ideal solution and the negative ideal solution [28]. However, few existing studies have applied integrated MCDM models specifically to the systematic evaluation of interactive experience in smart museums. By considering both criterion importance and alternative performance, MCDM methods can provide intuitive and interpretable results for comparing smart museum cases and supporting museum management decisions [29].

2.5. Summary of the Literature

In summary, previous studies have demonstrated that smart museum technologies can significantly enhance visitor engagement and reshape museum interaction. At the same time, interactive experience has gradually become a core concept for understanding museum participation, immersion, and communication effectiveness. However, existing studies still mainly focus on technological functions, usability, or partial design performance, and they have not yet established a sufficiently systematic and quantitative framework for comparing interactive experience across multiple smart museums. Therefore, this study proposes the SMIEEF to address this gap.

3. Research Framework

This study proposes a Smart Museum Interactive Experience Evaluation Framework (SMIEEF) to systematically evaluate interactive experience in smart museums. By integrating the Strategic Experiential Modules (SEMs) with multi-criteria decision-making (MCDM) methods, the framework provides a structured approach for comparing and diagnosing the interactive-experience performance of smart museum systems.
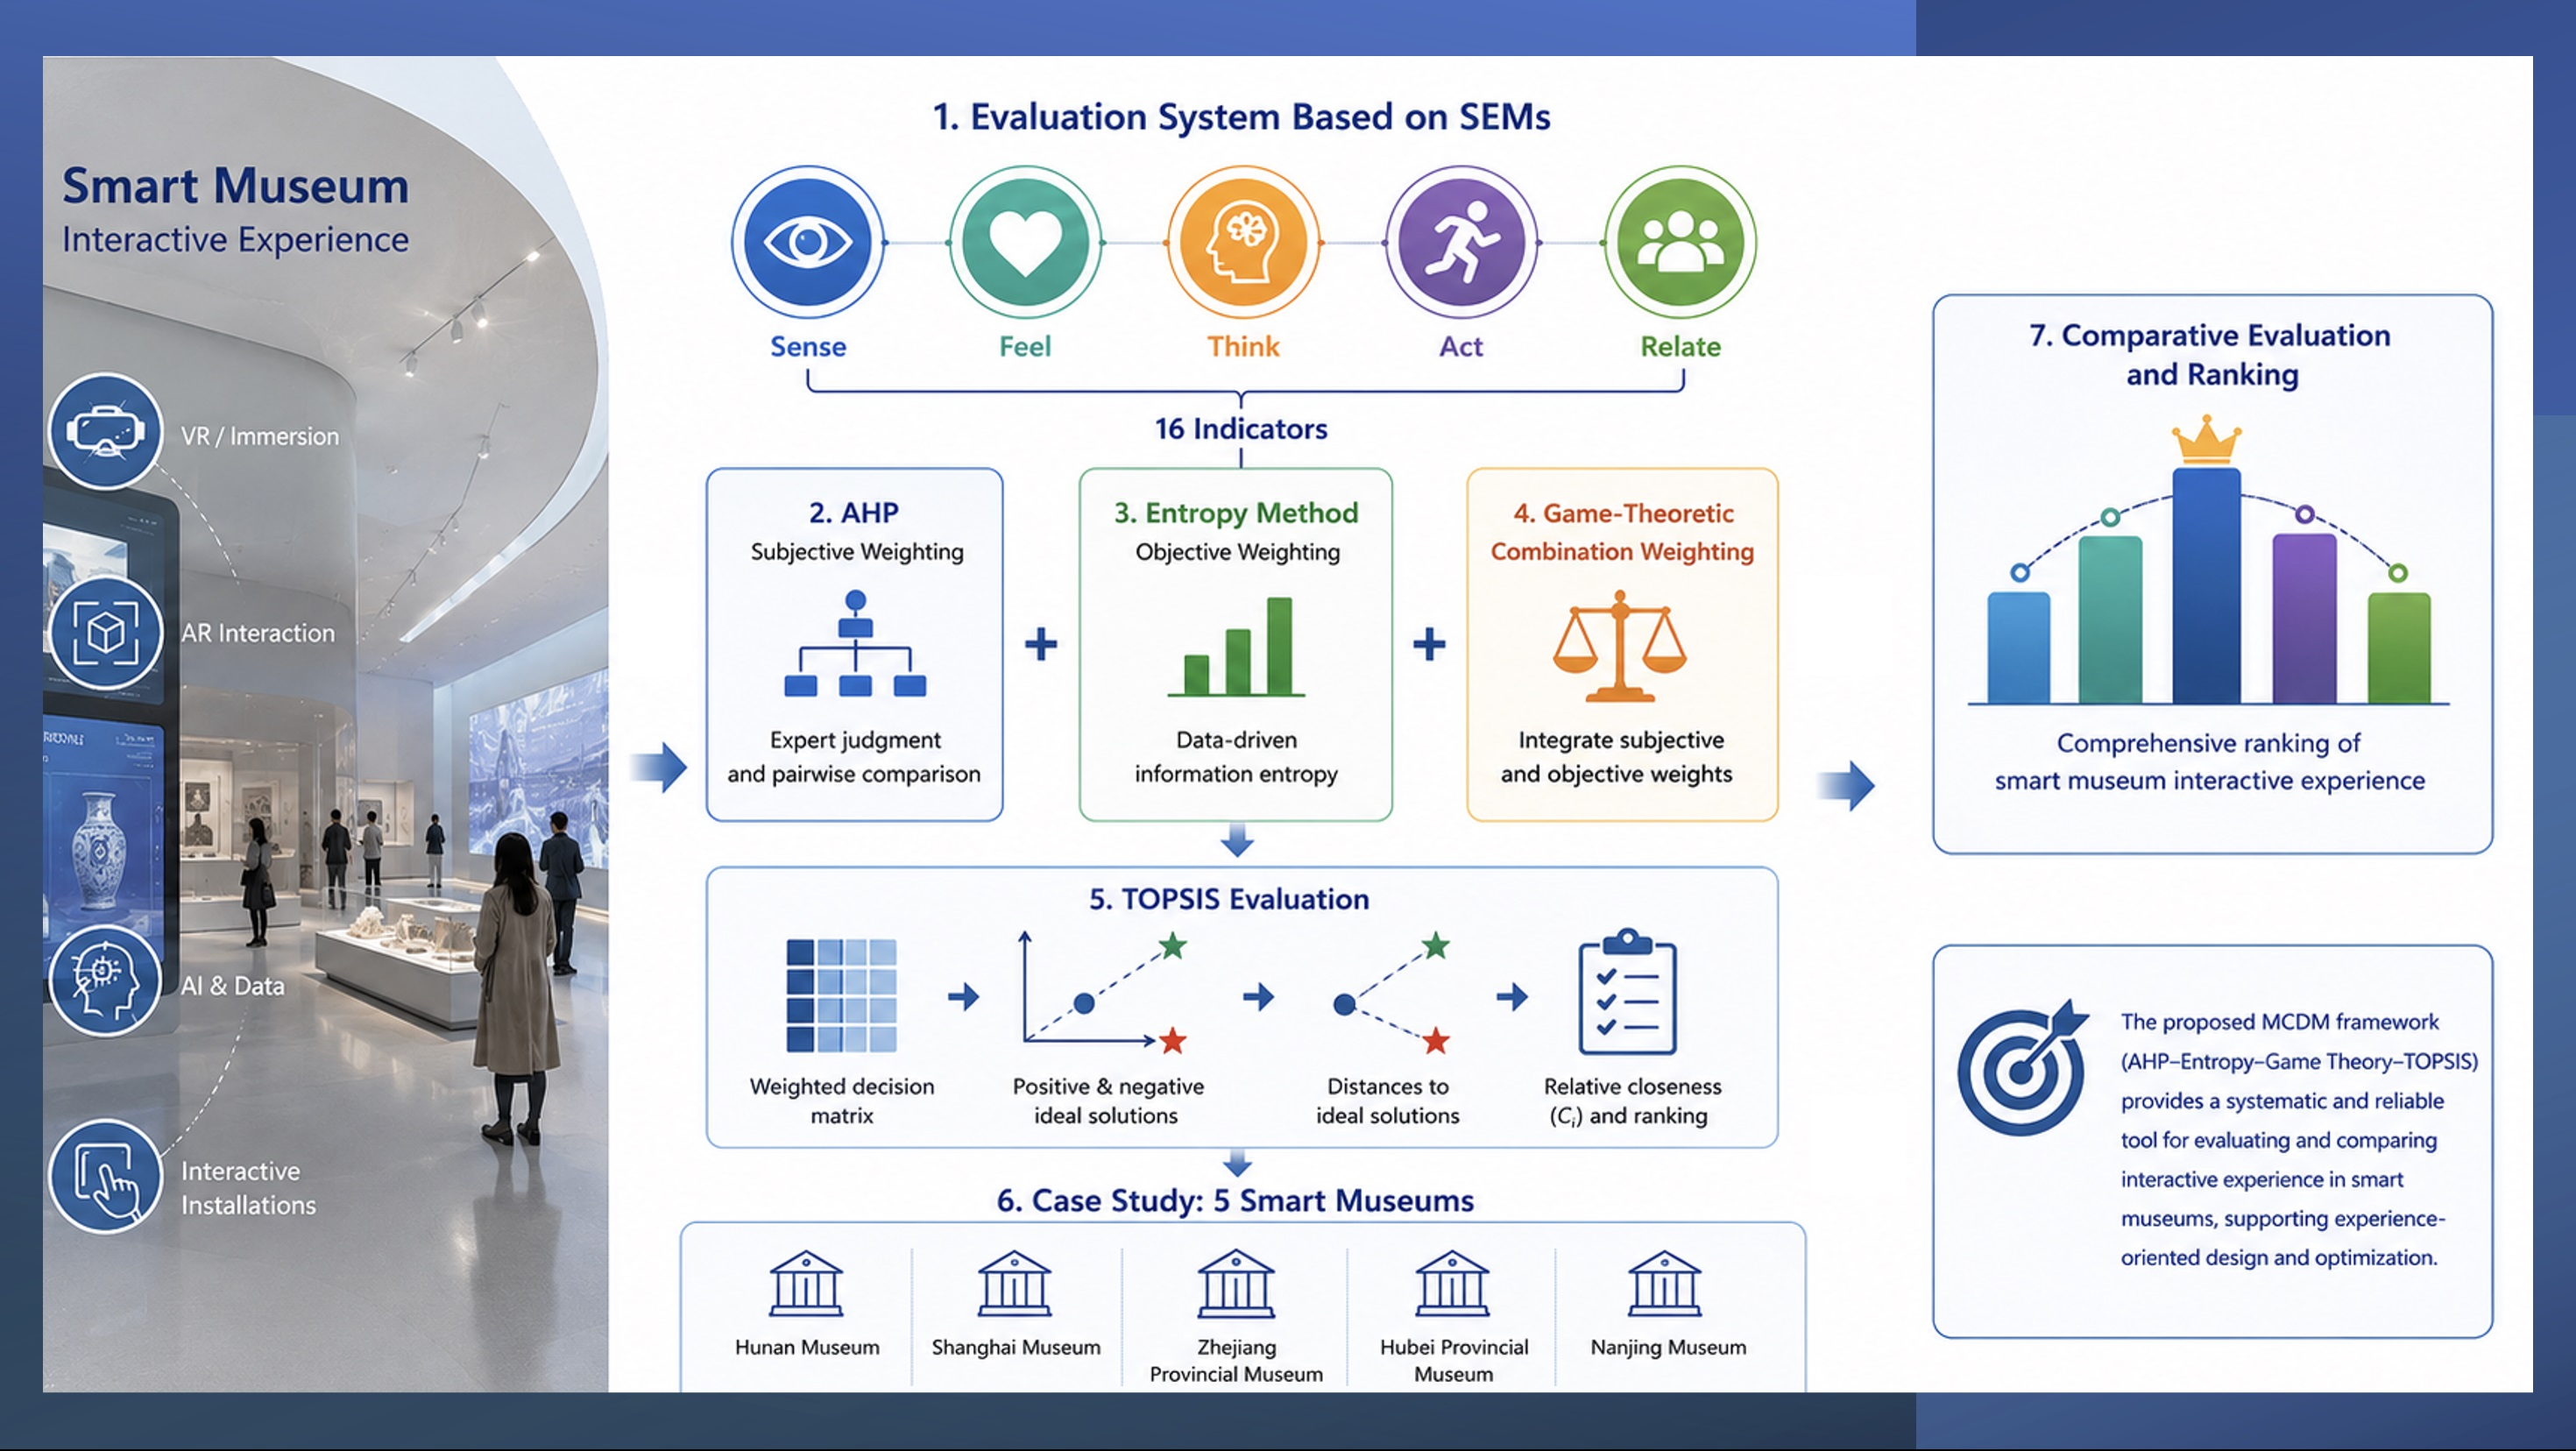
The framework consists of five main steps: indicator construction, case selection, data collection and preprocessing, hybrid weight determination, and TOPSIS-based comparative evaluation. The overall research framework of the proposed SMIEEF model is shown in Figure 1.

3.1. Evaluation Dimensions and Indicators

The first step of the framework is to identify the evaluation dimensions and their corresponding indicators. Based on the literature on experience design, museum visitor experience, and digital museum interaction, this study divides smart museum interactive experience into five core dimensions: Sense, Feel, Think, Act, and Relate [30,31,32]. These dimensions reflect the sensory, emotional, cognitive, behavioral, and relational aspects of interactive experience.
The five dimensions are further decomposed into sixteen specific evaluation indicators, including Visual, Auditory, Tactile, Comfort, Enjoyment, Immersion, Authenticity, Cognitive Value, Information Quality, Educational Value, Accessibility, Interaction Quality, Engagement, Personalization, Social Interaction, and Cultural Connectedness. This hierarchical structure provides the basis for subsequent expert evaluation, weight calculation, and TOPSIS-based comparative analysis. The detailed rationale for the indicator system and the definitions of each indicator are presented in Section 4.

3.2. Weight Determination

To reflect differences in the importance of evaluation indicators, SMIEEF adopts a hybrid weighting approach that combines subjective and objective methods. The Analytic Hierarchy Process (AHP) is used to determine subjective weights through expert pairwise comparisons [33], while the entropy weight method is used to capture the data-driven dispersion characteristics of expert evaluation data [27]. To improve the stability and interpretability of weight estimation, the subjective and objective weights are further integrated using a game-theoretic combination weighting strategy, producing the final comprehensive weights. Hybrid weighting approaches have been widely used in MCDM research to reduce the potential bias associated with a single weighting method.

3.3. Case Selection

This study adopted criterion-based purposive sampling to select smart museum cases for comparative evaluation. The purpose of case selection was not to identify the “best” or most visited museums in China, but to select comparable smart museum cases that satisfy the same set of inclusion criteria and can be evaluated under a unified indicator framework. This approach helps ensure that the selected museums share a comparable institutional basis while still presenting sufficient variation in digital and interactive experience design.
These museums typically integrate multiple interactive technologies, including augmented reality (AR) exhibitions, AI-based guidance systems, immersive media, digital participation platforms, and interactive exhibition interfaces. With the increasing application of digital technologies in museums, smart museums have become important platforms for cultural heritage presentation and public engagement [7,8]. Selecting multiple cases for comparative analysis helps identify differences in interactive-experience performance among museums under a unified evaluation framework and improves the reliability and interpretability of evaluation results [34].
In this study, the selected cases were required to meet several criteria. First, they should be major public museums with stable exhibition operation and public cultural-service functions. Second, they should focus primarily on historical, cultural, or heritage-related collections and exhibitions. Third, they should have adopted digital and interactive practices, such as digital exhibitions, interactive installations, smart guidance, immersive media, AR/VR, or online–offline digital services. Fourth, they should allow expert evaluators to conduct on-site visits, in-depth interaction, or systematic review of their digital resources. Finally, the selected cases should show variation in regional context, exhibition strategy, interaction design, and digital-service configuration, so that the proposed framework can test its discriminative ability across different smart museum profiles. The inclusion criteria for case selection are summarized in Table 1.
Based on these criteria, five representative smart museum cases in China were selected: Hunan Museum, Shanghai Museum, Zhejiang Provincial Museum, Hubei Provincial Museum, and Nanjing Museum. Each museum was treated as an evaluation unit, and its overall interactive system was assessed under the same indicator system to ensure comparability across cases. The selected cases are listed in Table 2.

3.4. Data Collection and Preprocessing

During the data collection stage, expert evaluators assessed the digital and physical interactive systems of the selected smart museums and rated each indicator using a Likert scale. The evaluation focused on the overall interactive system of each museum rather than on a single device or exhibition item. Such expert-based evaluation approaches are commonly used in user experience assessment and cultural heritage evaluation.
Expert evaluation was adopted because the purpose of this study was to construct and test a comparative evaluation framework rather than to directly measure individual visitors’ psychological responses. Experts with backgrounds in digital media design, interaction design, museum studies, exhibition design, and user experience research were considered suitable for assessing whether the selected museum systems met predefined experiential and design-related criteria. They evaluated the museums from a professional visitor-experience perspective, including sensory presentation, information organization, interaction quality, accessibility, and cultural communication. Therefore, experts were not intended to replace general visitors, but to serve as professional evaluators for framework construction, system diagnosis, and cross-case comparison. Future research should incorporate visitor-based empirical data to further validate the proposed framework.
For entropy weighting, the individual expert scores were retained to preserve differences in expert judgments and to reflect the dispersion of the evaluation data. For TOPSIS-based case comparison, the expert scores for each museum and each indicator were aggregated to construct the case-level decision matrix. In the preprocessing stage, the evaluation data were standardized using min–max normalization to meet the requirements of MCDM analysis [29]. After normalization, the decision matrix was used for subsequent weight calculation and comparative evaluation.

3.5. TOPSIS-Based Comparative Evaluation

In the alternative ranking stage, SMIEEF adopts the Technique for Order Preference by Similarity to Ideal Solution (TOPSIS). TOPSIS evaluates alternatives by calculating their distances from the positive ideal solution and the negative ideal solution [28]. It has been widely applied in multi-criteria decision-making research, particularly in complex evaluation problems involving multiple indicators [35].
By calculating the relative closeness of each smart museum to the ideal solution, the overall ranking results of the selected cases can be obtained. This procedure enables a comprehensive comparison of smart museums in terms of multidimensional interactive experience and provides a basis for identifying their relative strengths and weaknesses.

4. Dimensions and Criteria

Interactive experience in smart museums is a multidimensional process. To systematically evaluate this process, this study constructs an evaluation indicator system based on the Strategic Experiential Modules (SEMs) and previous research on user experience. In experience design research, SEMs provide an important theoretical foundation for understanding experience through five modules: Sense, Feel, Think, Act, and Relate [14]. Compared with traditional evaluation approaches that mainly focus on functionality or satisfaction, this framework emphasizes the linkage among sensory, emotional, cognitive, behavioral, and relational dimensions of interactive experience.
By incorporating SEMs, the proposed indicator system moves beyond isolated interaction points or superficial engagement and provides a multidimensional basis for evaluating smart museum interactive experience [30]. In the context of smart museums integrating AR/VR, immersive interaction, and AI technologies, museum experience is increasingly shaped by the combined effects of space, content, technology, and socio-cultural contexts [31,36]. Therefore, this study adopts the five SEMs—Sense, Feel, Think, Act, and Relate—as the criteria level and derives corresponding indicators under each dimension to form the evaluation system.

4.1. Sense

As the most direct component of interactive experience, sensory experience enhances engagement and presence by stimulating multiple sensory channels. In digital museum experiences, visual and auditory cues have been identified as important factors that shape overall experience, suggesting that these two modalities form a key multisensory combination [32]. Tactile perception also plays an important role in interactive experience, because touch-based feedback can enrich users’ sensory perception and strengthen the embodied quality of interaction [37,38]. Therefore, the Sense dimension in this study includes three indicators: Visual, Auditory, and Tactile.

4.2. Feel

Emotional experience strengthens visitors’ affective engagement and helps museums better understand visitors’ needs and preferences, thereby enabling more personalized and meaningful experiences. First, comfort concerns visitors’ physical and psychological ease; technology-enhanced exhibitions can support a more visitor-friendly environment, allowing visitors to explore exhibits with fewer disturbances. A study suggests that virtual touring tools can provide a comfortable viewing experience, which is critical for improving museum experience and attractiveness [39]. Second, enjoyment reflects the pleasure generated through interaction and participation; smart museums can foster engaging cultural experiences by balancing authenticity with innovation [40]. Third, immersion refers to visitors’ deep involvement in the content and the sense of “being there” during interaction. Developments in digital ecological cultural industries suggest that multimodal scene design can enhance the attractiveness and immersion of content presentation [41]. Finally, perceived authenticity concerns visitors’ perception of how “real” the exhibition content feels. Authenticity concerns the extent to which digital or interactive presentation is perceived as culturally and contextually credible. Previous research has shown that perceived authenticity can improve experience quality and influence behavioral responses [42]. Therefore, the Feel dimension in this study includes four indicators: Comfort, Enjoyment, Immersion, and Authenticity.

4.3. Think

Cognitive experience enhances engagement and depth of understanding, thereby contributing to more meaningful and educational museum interaction. Cognitive value refers to the extent to which interactive content supports learning intention, knowledge construction, and meaning-making [43]. In smart museum contexts, users not only pursue efficient information acquisition, but also expect knowledge integration and conceptual linkage related to exhibition content. Such cognitive satisfaction can influence overall experience, sustained engagement, and content memory [27].
Information quality is another important component of cognitive experience. Clear, accurate, and well-structured information can support deeper understanding of exhibition content. In mixed-reality museum experiences, factors such as presence, flow, and natural interaction have been identified as important elements influencing users’ cognitive evaluations [44]. Educational value further depends not only on the depth of exhibition content, but also on whether interactive processes support understanding and learning outcomes. Research on conversational AI in educational scenarios has emphasized the importance of high-quality educational content in shaping user experience [45]. Therefore, the Think dimension in this study includes three indicators: Cognitive Value, Information Quality, and Educational Value.

4.4. Act

Behavioral experience reflects the degree to which smart museum systems encourage actual actions, participation, and personalized interaction. Accessibility refers to whether the interaction modes are easy to access and use. Accessible interaction design can increase participation and enjoyment, especially when museum experiences are mediated through digital or remote systems [46]. Interaction quality concerns the smoothness, responsiveness, and controllability of the interaction process. High-quality interaction is usually associated with stronger engagement, emotional involvement, and personal investment.
Engagement is another important component of behavioral experience. Previous research has shown that interaction conditions and environmental factors can influence changes in engagement, providing implications for interactive exhibit design and experience-quality assessment [47,48]. Personalization further strengthens behavioral participation by providing customized content, adaptive storytelling, or individualized interaction options. Personalized storytelling and interaction design can enhance engagement, enjoyment, social closeness, and spatial presence, thereby improving the overall interactive experience [46]. Therefore, the Act dimension in this study includes four indicators: Accessibility, Interaction Quality, Engagement, and Personalization.

4.5. Relate

Relational experience concerns how users build connections with the social and cultural dimensions of the museum. Social interaction can influence satisfaction, sharing behavior, and word-of-mouth communication. Museums are not merely public consumption spaces; they can also foster interactive sociality beyond physical boundaries, thereby strengthening their social and cultural value [10]. By supporting communication, sharing, and co-experience, smart museum systems can extend interaction from individual experience to social participation. Cultural connectedness refers to the extent to which museum interaction strengthens users’ links with cultural heritage, historical narratives, and cultural identity. Previous research has shown that cultural connotation and creative expression are important factors in museum-related cultural consumption, indicating the value of incorporating explicit cultural elements into exhibitions and activities [49]. Therefore, the Relate dimension in this study includes two indicators: Social Interaction and Cultural Connectedness. Based on the above five dimensions, the definitions of the evaluation indicators for smart museum interactive experience are summarized in Table 3.
Each Level-2 indicator was measured using two expert-evaluation items developed according to its operational definition. Experts were asked to evaluate each item from the perspective of visitor experience based on their professional observation and interaction with the selected smart museum systems. A five-point Likert scale was used for each item, where 1 indicated “very poor”, 2 indicated “poor”, 3 indicated “moderate”, 4 indicated “good”, and 5 indicated “excellent”. The score of each Level-2 indicator was calculated as the sum of the two item scores, ranging from 2 to 10, with higher scores indicating better performance. The complete expert-evaluation items are provided in Table 4.

5. Methodology and Weighting Results

5.1. Subjective Weighting Using the Analytic Hierarchy Process (AHP)

To ensure a comprehensive and reliable determination of indicator weights, this study adopted a hybrid weighting approach integrating the Analytic Hierarchy Process (AHP), the entropy weight method, and a game-theoretic combination strategy. This approach combines subjective expert judgment with objective data characteristics, thereby improving the robustness and interpretability of the evaluation results.
First, AHP was employed to derive the subjective weights of the evaluation indicators. A panel of 25 experts with backgrounds in digital media design, interaction design, museum studies, and user experience research was invited to participate in the weighting process.
The experts were selected according to the following inclusion criteria: (1) academic or professional background in digital media design, interaction design, museum studies, cultural heritage, exhibition design, or user experience research; (2) at least three years of relevant research, teaching, design, or museum-related professional experience; (3) familiarity with digital museum systems, interactive exhibition design, or user-experience evaluation; and (4) willingness to participate voluntarily. Experts were excluded if they had no relevant disciplinary or professional background, were directly involved in the design, operation, or management of the evaluated museum cases, or failed to complete the evaluation procedure.
Based on Saaty’s 1–9 scale, the experts conducted pairwise comparisons of the indicators. The individual judgment matrices were aggregated using the geometric mean method to obtain a unified group decision matrix. Consistency tests were then conducted, and all matrices satisfied the acceptable consistency requirement (CR < 0.1).
The relative weight of each indicator was calculated as follows:
W i = ( j = 1 n a i j ) 1 n i = 1 n ( j = 1 n a i j ) 1 n ,         i = 1,2 , 3 , , n
  C R = C I R I = λ m a x n n 1 R I < 0.1 .    
where a i j represents the pairwise comparison value between indicators, W i denotes the normalized weight of indicator i, and n denotes the number of indicators included in the corresponding judgment matrix. In the consistency test, λ m a x represents the maximum eigenvalue of the judgment matrix, C I denotes the consistency index, R I denotes the random index, and C R denotes the consistency ratio. A judgment matrix is considered to have acceptable consistency when C R < 0.1.
The pairwise comparison matrix, Level-1 indicator weights, and consistency test results are presented in Table 5.
After the Level-1 indicator weights were obtained, pairwise comparisons were further conducted for the Level-2 indicators within each experiential dimension. Table 6 presents the detailed AHP results for the Level-2 indicators, including the pairwise comparison matrices, the local weights of each indicator within its corresponding Level-1 dimension, and the consistency test results.
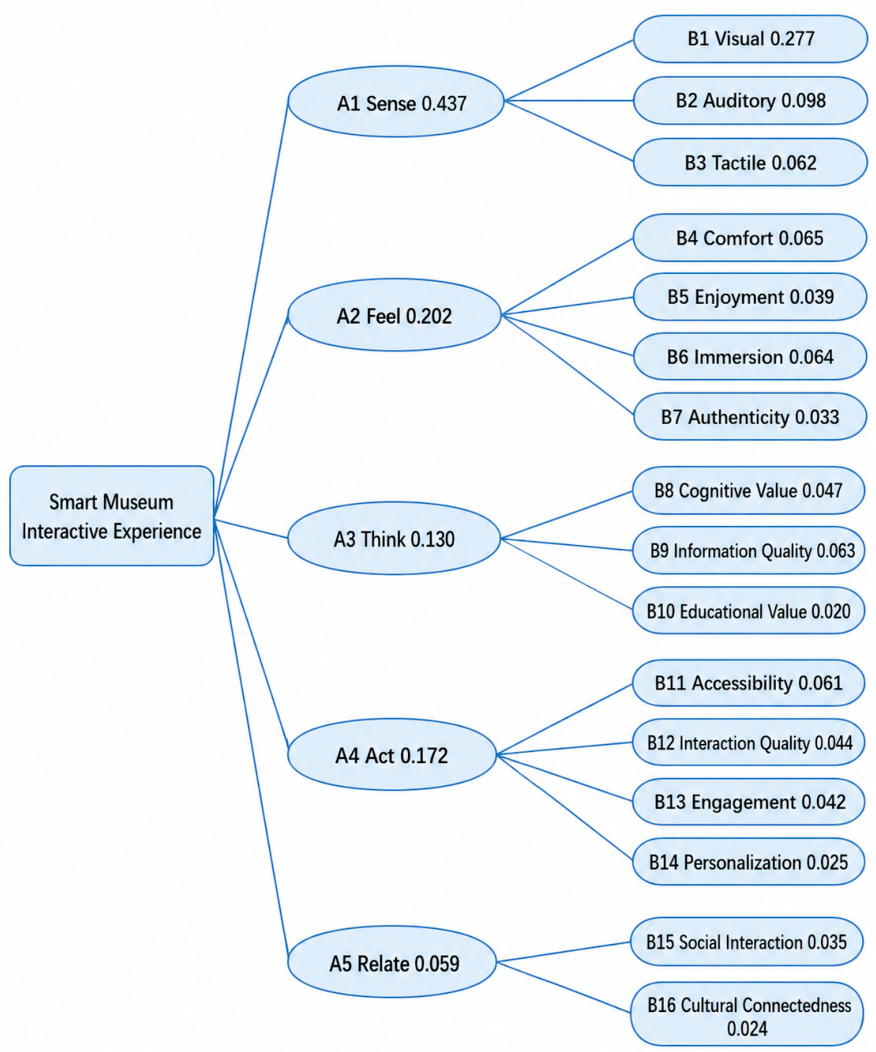
The composite weights were obtained by multiplying the Level-1dimension weights by the corresponding Level-2 relative weights. In this way, all sixteen indicators can be compared within the same evaluation framework. Figure 2 visualizes the hierarchical structure of the AHP results and presents the composite weights of each Level-2 indicator.

5.2. Entropy-Based Weighting Using Expert Evaluation Data

Second, to further capture the dispersion characteristics of expert evaluation data, the entropy weight method is employed. In contrast to AHP, which directly relies on pairwise expert judgments regarding indicator importance, the entropy method determines indicator weights based on the degree of variation in the observed evaluation data. It should be noted that although the entropy method is objective in its mathematical calculation procedure, the original data used in this study were derived from expert evaluations. Therefore, the entropy-based weights should be understood as data-driven dispersion weights rather than fully objective weights independent of human judgment.
In this study, an expert evaluation process was conducted to generate the raw data required for entropy weighting. A total of 10 experts with backgrounds in digital design, interactive experience, and museum exhibition were invited to participate in the evaluation. The same inclusion and exclusion principles were applied to the expert case-evaluation process. To reduce potential bias, experts who were directly involved in the planning, design, operation, or management of any of the selected museum cases were excluded. All expert evaluators participated voluntarily and completed the evaluation anonymously.
Five representative smart museums with rich interactive systems were selected as evaluation cases. Each expert conducted on-site or in-depth interaction with the museum systems and independently rated each case across 16 evaluation indicators using a Likert scale.
This process resulted in 50 sets of evaluation data (5 cases × 10 experts), forming a 50 × 16 original decision matrix. All indicators were defined as benefit-type criteria, where higher values indicate better performance. Unlike conventional approaches that aggregate expert scores prior to analysis, this study retains the original individual evaluation data when applying the entropy method. This strategy preserves the variability among expert judgments and avoids potential information loss caused by data averaging. As a result, the entropy values more accurately reflect the discriminative power of each indicator within the evaluation system.
The entropy value of each indicator is calculated as follows:
e j = 1 ln m i = 1 m   p i j l n   p i j
where e j denotes the entropy value of indicator j, p i j represents the normalized proportion of evaluation object i under indicator j, and m denotes the number of evaluation records. In this study, m = 50, corresponding to the 50 sets of expert evaluation data generated from five cases and ten experts. The parameter dj represents the degree of diversification, or information utility, of indicator j. A larger dj value indicates greater dispersion and stronger discriminative power of the corresponding indicator. The parameter w j denotes the normalized entropy weight of indicator j, and n denotes the total number of evaluation indicators, which is 16 in this study. The degree of diversification (also known as information utility) is then calculated as:
d j = 1 e j
The normalized entropy weight of each indicator is derived as:
w j = d j j = 1 n   d j
The entropy-based weights were compared with the AHP-based composite weights to examine the consistency between objective data dispersion and subjective expert judgment. As shown in Table 7, several indicators, including Visual (B1), Auditory (B2), Enjoyment (B5), Immersion (B6), Information Quality (B9), and Engagement (B13), showed identical rankings in both methods. This suggests that these indicators were both highly valued by experts and effective in distinguishing differences among cases. Meanwhile, differences were observed for indicators such as Interaction Quality (B12), Personalization (B14), Cognitive Value (B8), and Accessibility (B11), indicating that subjective importance and objective data variation do not always coincide. Therefore, integrating AHP and entropy weights through a game-theoretic combination strategy is necessary to obtain a more balanced weighting result.

5.3. Integrated Weighting Based on Game Theory

Finally, to integrate the subjective weights obtained from AHP and the objective weights derived from the entropy method, a game-theoretic combination weighting approach is employed. This method aims to minimize the deviation between different weighting schemes and achieve an optimal balance.
Let w 1 and w 2 denote the weight vectors obtained from the AHP and entropy methods, respectively. The combined weight vector is defined as:
W = α 1 w 1 T + α 2 w 2 T
where α 1 and α 2 are the combination coefficients.
The optimal coefficients are obtained by solving the following minimization problem:
m i n p = 1 n α p w p T w p 2
After normalization, the final weights are expressed as:
W * = p = 1 2 α p * w p
This method effectively balances subjective and objective weighting results, thereby enhancing the stability and reliability of the evaluation system. The final game-theoretic combined weights of the sixteen indicators are summarized in Table 8.

5.4. Evaluation Procedure Based on the TOPSIS Method

After obtaining the final combined weights, the Technique for Order Preference by Similarity to Ideal Solution (TOPSIS) is employed to evaluate and rank the selected smart museum cases. TOPSIS is a widely used multi-criteria decision-making method that determines the relative performance of alternatives by measuring their distances from the positive ideal solution and the negative ideal solution.
First, the original decision matrix is normalized to eliminate the influence of different measurement scales. Then, the normalized matrix is multiplied by the combined weights to obtain the weighted normalized decision matrix.
The positive ideal solution Z j + and negative ideal solution Z j are expressed as
Z j + = max Z 1 j , Z 2 j , , Z n j , ,     Z j = m i n ( Z 1 j , Z 2 j , , Z n j , )
Next, the Euclidean distances of each alternative from the ideal solutions are calculated as:
d i + = j = 1 n ( z i j z j + ) 2 ,     d i = j = 1 n ( z i j z j ) 2
Finally, the relative closeness coefficient is computed as:
C i = d i d i +   d i +
where a higher value of C i indicates better performance. Based on this coefficient, the alternatives can be ranked accordingly. This method enables a comprehensive evaluation of smart museums by simultaneously considering multiple criteria and their relative importance.

6. Evaluation Results and Robustness Analysis

6.1. Overall TOPSIS Ranking Results

Based on the combined weights derived from the game-theoretic method, the TOPSIS approach was applied to evaluate the overall interactive experience of the five selected smart museums. The weighted normalized decision matrix is presented in Table 9, and the final ranking results are shown in Table 10.
As shown in Table 10, Case C (Zhejiang Provincial Museum) achieves the highest relative closeness value ( C i = 0.9891), indicating the best overall performance among the evaluated cases. Case B (Shanghai Museum) ranks second ( C i = 0.8457), followed by Case A (Hunan Museum) ( C i = 0.5326). In contrast, Case D (Hubei Museum) and Case E (Nanjing Museum) exhibit relatively lower performance, ranking fourth and fifth, respectively.
The differences in relative closeness values reveal clear distinctions in overall performance among the selected smart museums. In particular, Zhejiang Provincial Museum demonstrates a significant advantage over the other cases, while Nanjing Museum shows the weakest performance in the evaluation. Overall, the results provide a clear and intuitive ranking of smart museums based on multidimensional interactive experience, demonstrating the applicability and effectiveness of the proposed evaluation framework.
A more detailed analysis of performance differences across specific dimensions is provided in Section 6.2.

6.2. Dimension-Level Comparative Results

To further explore the performance differences among the selected smart museums, a dimension-level analysis was conducted based on the TOPSIS results. The relative closeness values of each case across the five experiential dimensions are presented in Table 11.
The results show that the overall ranking pattern across all dimensions remains consistent with the overall evaluation results, with Zhejiang Provincial Museum consistently achieving the highest performance, followed by Shanghai Museum, Hunan Museum, Hubei Museum, and Nanjing Museum. This indicates that the differences in overall performance are not driven by a single dimension but reflect a systematic advantage across multiple dimensions.
The dimension-level TOPSIS results provide a more detailed view of the relative strengths and weaknesses of each smart museum case. As shown in Table 11, the five museums present different performance patterns across the five dimensions of Sense, Feel, Think, Act, and Relate. This indicates that the proposed framework can not only produce an overall ranking but also reveal dimensional differences in interactive-experience performance.
Zhejiang Provincial Museum shows the strongest performance across the five dimensions, particularly in the Feel, Think, Act, and Relate dimensions. Shanghai Museum also performs well, especially in the Sense and Think dimensions, suggesting relatively strong sensory presentation and information-related support. Hunan Museum shows a more balanced but moderate performance, with its highest relative closeness value appearing in the Act dimension. Hubei Provincial Museum performs comparatively better in the Act dimension than in the other dimensions, indicating an uneven dimensional structure. Nanjing Museum obtains the lowest relative closeness values in this comparison. This result should be understood as its relatively weaker position within the selected cases and indicators, rather than as an indication that it lacks interactive experience.
Overall, the dimension-level analysis further demonstrates the value of a multidimensional evaluation framework. Although sensory experience remains an important foundation of smart museum interaction, overall performance cannot be fully explained by sensory factors alone. Emotional, cognitive, behavioral, and relational dimensions also need to be considered together. Therefore, the proposed framework is useful not only for ranking smart museum cases, but also for identifying specific dimensions that may require improvement.

6.3. Robustness Check Under Different Weighting Schemes

To further evaluate the robustness of the proposed evaluation framework, a sensitivity analysis was conducted by comparing the TOPSIS results under different weighting schemes, including entropy weights, AHP weights, average weights, and game-theoretic combined weights. The results are presented in Table 12.
To examine whether the TOPSIS results were significantly affected by different weighting schemes, a statistical robustness analysis was further conducted on three TOPSIS metrics: distance to the positive ideal solution ( d i + ), distance to the negative ideal solution ( d i ), and relative closeness ( C i ).
First, the Shapiro–Wilk test was used to examine the normality of the data. The results showed that the values of d i + , d i , and C i under all four weighting schemes did not significantly deviate from normality, with all p-values greater than 0.05. Bartlett’s test was then conducted to examine the homogeneity of variance. The results also indicated no significant violation of homogeneity for d i + (p = 0.870), d i (p = 0.862), or C i (p = 0.999).
Given the small number of evaluated cases and the repeated-measures structure of the data, the Friedman test was further used to compare the TOPSIS metrics across the four weighting schemes. The results showed no significant difference in d i + among the weighting schemes (χ2 = 3.480, p = 0.323). A significant difference was found for d i 2 = 11.100, p = 0.011), indicating that the distance to the negative ideal solution was relatively more sensitive to the weighting scheme. However, the relative closeness coefficient, which is the final ranking criterion in TOPSIS, showed no significant difference across weighting schemes (χ2 = 1.200, p = 0.753).
In addition, the ranking results were examined using Spearman’s rank correlation and Kendall’s coefficient of concordance. The results showed that the ranking order remained identical across all four weighting schemes, with Spearman’s rho = 1.000 for all pairwise comparisons and Kendall’s W = 1.000. Therefore, although some distance values varied across weighting schemes, the final TOPSIS relative closeness values and ranking results were statistically stable within the selected cases. The results of the statistical robustness analysis are summarized in Table 13.
The identical ranking results across different weighting schemes should be interpreted with caution. On the one hand, this consistency suggests that the selected museum cases showed sufficiently clear performance differences under the proposed indicator system, so moderate changes in weighting schemes did not alter the final ranking order. On the other hand, this does not imply that the game-theoretic combination weighting strategy is unnecessary. The value of the combined weighting strategy lies not only in determining the final ranking, but also in providing a more balanced and interpretable indicator-weight structure by integrating expert-perceived importance and data-driven dispersion characteristics. In this study, the combined weights helped clarify which indicators contributed more strongly to the evaluation system and supported dimension-level diagnosis. Therefore, the robustness results indicate that the final ranking was stable within the selected cases, while the proposed weighting strategy remains meaningful for improving interpretability, reducing single-method bias, and supporting practical decision-making. In future studies involving more cases or cases with closer performance levels, the choice of weighting scheme may have a stronger influence on the final ranking.

7. Discussion

7.1. Answers to the Research Questions

This study proposed a multidimensional and quantitative framework for evaluating interactive experience in smart museums. In response to RQ1, the results show that smart museum interactive experience can be systematically evaluated through a hierarchical indicator system based on five experiential dimensions: Sense, Feel, Think, Act, and Relate. The sixteen Level-2 indicators further operationalize these dimensions and provide measurable criteria for expert evaluation and cross-case comparison.
Regarding RQ2, the weighting results indicate that the relative importance of evaluation indicators differs across subjective expert judgment and data-driven dispersion. The game-theoretic combination weighting strategy integrates AHP and entropy weights, thereby balancing expert-perceived importance and the discriminative information contained in the evaluation data. The final combined weights show that Visual, Auditory, Immersion, Comfort, and Information Quality are among the most influential indicators in the evaluation system.
Regarding RQ3, the TOPSIS results reveal clear differences among the selected smart museum cases in both overall and dimension-level performance. Zhejiang Provincial Museum achieved the highest overall relative closeness value, followed by Shanghai Museum and Hunan Museum. The dimension-level results further show that the performance differences among museums are not limited to a single dimension but are reflected across sensory, emotional, cognitive, behavioral, and relational aspects of interactive experience.
Regarding RQ4, the robustness analysis indicates that the TOPSIS ranking results are stable under different weighting schemes. Although some intermediate distance values varied across weighting schemes, the final relative closeness coefficients and ranking outcomes remained statistically stable. This suggests that the proposed framework can provide reliable comparative results within the selected cases and indicators.

7.2. Comparison with Previous Studies

The proposed SMIEEF extends previous research on museum evaluation and digital cultural experience in several ways. Existing studies on museum interaction have often focused on specific technologies, such as augmented reality, virtual reality, AI-based guides, or online museum interfaces [1,2,3,18,19]. These studies have provided important insights into technology acceptance, usability, immersion, and learning outcomes. However, many of them examine a single technological system or a specific user-response mechanism, rather than developing a comprehensive framework for comparing interactive experience across multiple smart museums.
Compared with previous studies on virtual museum tours and museum website evaluation [19,24,34], the present study shifts the evaluation object from online interfaces or individual digital systems to the overall interactive-experience performance of smart museums. In addition, previous MCDM-based museum evaluation studies have mainly focused on cultural websites, usability, functionality, or mobile interaction [24,34]. By contrast, this study integrates the Strategic Experiential Modules with MCDM methods and treats interactive experience as a multidimensional construct involving sensory, emotional, cognitive, behavioral, and relational dimensions [14,30,31,32].
Methodologically, this study differs from studies that rely solely on one weighting method or one evaluation perspective. AHP captures expert judgments regarding the relative importance of indicators, while the entropy method reflects the dispersion characteristics of expert evaluation data [27,33]. The game-theoretic combination weighting strategy further integrates these two types of weights, and TOPSIS provides an interpretable ranking of the selected smart museum cases [24,28,29]. Therefore, the proposed framework contributes not only to museum experience evaluation, but also to the broader application of MCDM methods in information-system and cultural-service evaluation.

7.3. Practical Implications

The proposed framework also provides practical implications for both museum visitors and museum staff. From the visitor’s perspective, the framework helps identify which aspects of interactive experience require improvement, such as visual presentation, information clarity, accessibility, immersion, and cultural connectedness. Improvements in these dimensions can support clearer exhibition interpretation, smoother interaction, stronger engagement, and deeper cultural understanding. Therefore, the framework can indirectly contribute to a more comfortable, meaningful, and engaging museum experience for visitors.
From the perspective of museum staff and managers, the framework provides a structured diagnostic tool for evaluating the strengths and weaknesses of smart museum interactive systems. Instead of relying only on general satisfaction feedback or isolated technical indicators, museum staff can use the evaluation results to identify priority areas for improvement. For example, if a museum performs weakly in Information Quality or Accessibility, staff may prioritize content organization, interface design, or guidance-system optimization. If the Relate dimension receives a low score, museums may strengthen cultural storytelling, social sharing mechanisms, or participatory activities.
In addition, the framework can support decision-making in resource allocation and exhibition optimization. Since the combined weights indicate the relative importance of different indicators, museum managers can better understand which dimensions contribute more strongly to interactive-experience performance. This can help guide investment in digital exhibition design, interactive media, visitor services, and cultural communication strategies. Therefore, SMIEEF can serve as a decision-support tool for experience-oriented smart museum development.

8. Conclusions

This study proposed a hybrid multi-criteria decision-making framework for evaluating interactive experience in smart museums. Based on the Strategic Experiential Modules, the study constructed an evaluation system consisting of five dimensions—Sense, Feel, Think, Act, and Relate—and sixteen indicators. By integrating AHP, entropy weighting, game-theoretic combination weighting, and TOPSIS, the proposed framework provides a structured procedure for determining indicator weights and comparing the interactive-experience performance of multiple smart museum cases.
The weighting results show that sensory experience occupies an important position in the evaluation system, especially visual and auditory elements. This indicates that sensory presentation remains a fundamental component of smart museum interaction. At the same time, the TOPSIS results suggest that overall performance cannot be explained by sensory factors alone. Zhejiang Provincial Museum ranked first among the selected cases, followed by Shanghai Museum and Hunan Museum. The dimension-level analysis further revealed that different museums showed different patterns of strengths and weaknesses across the five experiential dimensions. These results demonstrate that the proposed framework can not only generate an overall ranking but also provide diagnostic information for identifying specific dimensions that require improvement.
The robustness check under different weighting schemes showed that the ranking order remained consistent when AHP weights, entropy weights, average weights, and game-theoretic combined weights were applied. This indicates that the evaluation results were relatively stable within the selected cases and indicators. The game-theoretic combination weighting strategy should therefore be understood as a balanced method for integrating subjective expert judgment and objective data dispersion, rather than as a technique that artificially changes the ranking results. This improves the interpretability of the evaluation process and supports the methodological reliability of the proposed framework.
The main contribution of this study lies in the construction and application of a systematic evaluation framework for smart museum interactive experience. First, the study shifts the focus of museum interaction evaluation from single technological functions or general satisfaction toward a multidimensional experiential perspective. Second, it adapts the SEMs framework to develop a hierarchical indicator system suitable for smart museum contexts. Third, it integrates subjective and objective weighting methods with TOPSIS to provide a replicable decision-support tool for comparing different museum cases. From a practical perspective, the framework can help museum managers identify the relative strengths and weaknesses of interactive-experience design and support more targeted optimization strategies.
This study also has several limitations. First, the empirical analysis was based on five selected smart museum cases, which may limit the generalizability of the findings. Second, the evaluation data were mainly derived from expert assessment rather than large-scale visitor surveys. Third, the TOPSIS results reflect relative performance within the selected cases and indicators and should not be interpreted as an absolute judgment of overall museum quality. Future research may expand the number and types of museum cases, incorporate visitor-based empirical data, and combine this framework with behavioral tracking, usability testing, or structural equation modeling to further examine the relationship between interactive experience and visitor responses.

Author Contributions

Conceptualization, H.D. and Z.B.; methodology, H.D. and Z.B.; software, Z.B., Z.Y. and Y.Z.; validation, H.D., M.L., Z.Y. and Y.Z.; formal analysis, H.D. and Z.B.; investigation, H.D.; resources, H.D.; data curation, Z.B., M.L. and Y.Z.; writing—original draft preparation, H.D. and Z.B.; writing—review and editing, H.D., Z.B. and Y.Z.; visualization, H.D. and Y.Z.; supervision, Z.B.; project administration, H.D. All authors have read and agreed to the published version of the manuscript.

Funding

This research received no external funding.

Institutional Review Board Statement

Ethical review and approval were waived for this study. The study was reviewed at the institutional level by the Department of Design, College of Art, Sungkyunkwan University in May 2026. The study involved only anonymous expert evaluation of publicly accessible smart museum interactive systems and did not collect sensitive personal information or identifiable human-subject data. This is consistent with Article 23 of the Personal Information Protection Act of Korea, which regulates the processing of sensitive information, and with the exemption logic of Article 32 of the Measures for Ethical Review of Life Science and Medical Research Involving Humans issued by the Chinese National Health Commission and relevant authorities on 18 February 2023, which provides exemption conditions for certain minimal-risk studies that do not involve sensitive personal information or harm to participants.

Informed Consent Statement

Informed consent was obtained from all expert evaluators involved in the study.

Data Availability Statement

The data supporting the findings of this study are available from the corresponding author upon reasonable request.

Conflicts of Interest

The author declares no conflicts of interest.

References

  1. He, Z.; Wu, L.; Li, X.R. When art meets tech: The role of augmented reality in enhancing museum experiences and purchase intentions. Tour. Manag. 2018, 68, 127–139. [Google Scholar] [CrossRef]
  2. Lee, H.; Jung, T.H.; tom Dieck, M.C.; Chung, N. Experiencing immersive virtual reality in museums. Inf. Manag. 2020, 57, 103229. [Google Scholar] [CrossRef]
  3. Serravalle, F.; Ferraris, A.; Vrontis, D.; Thrassou, A.; Christofi, M. Augmented reality in the tourism industry: A multi-stakeholder analysis of museums. Tour. Manag. Perspect. 2019, 32, 100549. [Google Scholar] [CrossRef]
  4. Li, H.; Shen, C.; Zhang, K.; Wang, H. Implementation technology of the smart museum of the South China Sea Museum based on UWB. In Proceedings of the 2019 3rd International Conference on Data Science and Business Analytics (ICDSBA), Changsha, China, 20–22 September 2019; IEEE: Piscataway, NJ, USA, 2019; pp. 369–374. [Google Scholar]
  5. Jeong, M.; Shin, H.H. Tourists’ experiences with smart tourism technology at smart destinations and their behavior intentions. J. Travel Res. 2020, 59, 1464–1477. [Google Scholar] [CrossRef]
  6. Bae, E.S.; Im, D.U.; Lee, S.Y. Smart museum based on regional unified app. Int. J. Softw. Eng. Its Appl. 2013, 7, 157–166. [Google Scholar]
  7. Pallud, J. Impact of interactive technologies on stimulating learning experiences in a museum. Inf. Manag. 2017, 54, 465–478. [Google Scholar] [CrossRef]
  8. Naramski, M. The application of ICT and smart technologies in Polish museums—Towards smart tourism. Sustainability 2020, 12, 9287. [Google Scholar] [CrossRef]
  9. Dayyani, D. Designing an Interactive Museum Experience Inside Primary Schools; Politecnico di Milano: Milan, Italy, 2021. [Google Scholar]
  10. Jafari, A.; Taheri, B.; vom Lehn, D. Cultural consumption, interactive sociality, and the museum. J. Mark. Manag. 2013, 29, 1729–1752. [Google Scholar] [CrossRef]
  11. Sundar, S.S.; Jia, H.; Waddell, T.F.; Huang, Y. Toward a theory of interactive media effects (TIME): Four models for explaining how interface features affect user psychology. In The Handbook of the Psychology of Communication Technology; Sundar, S.S., Ed.; Wiley Blackwell: Hoboken, NJ, USA, 2015; pp. 47–86. [Google Scholar]
  12. Shaby, N.; Assaraf, O.B.Z.; Tal, T. The particular aspects of science museum exhibits that encourage students’ engagement. J. Sci. Educ. Technol. 2017, 26, 253–268. [Google Scholar] [CrossRef]
  13. Forlizzi, J.; Battarbee, K. Understanding experience in interactive systems. In Proceedings of the 5th Conference on Designing Interactive Systems: Processes, Practices, Methods, and Techniques, Cambridge, MA, USA, 1–4 August 2004; ACM: New York, NY, USA, 2004; pp. 261–268. [Google Scholar]
  14. Schmitt, B. Experiential marketing. J. Mark. Manag. 1999, 15, 53–67. [Google Scholar] [CrossRef]
  15. Jangra, S.; Singh, G.; Mantri, A. Evaluating user experience in cultural heritage through virtual reality simulations. Virtual Archaeol. Rev. 2025, 16, 17–31. [Google Scholar] [CrossRef]
  16. Param, A.G.; Minasians, A.; Abasi, F. Evaluating the effective factors in promoting the target audience-based attraction of a museum with the approach of increasing social interactions: Case study of Tehran City Region 2, Iran. PalArch’s J. Archaeol. Egypt/Egyptol. 2021, 18, 17–40. [Google Scholar]
  17. Hassenzahl, M.; Tractinsky, N. User experience—A research agenda. Behav. Inf. Technol. 2006, 25, 91–97. [Google Scholar] [CrossRef]
  18. Khundam, C.; Noël, F. Evaluation of adaptive interaction systems for virtual museum development. Trends Sci. 2021, 18, 1405. [Google Scholar] [CrossRef]
  19. Li, J.; Nie, J.W.; Ye, J. Evaluation of virtual tour in an online museum: Exhibition of Architecture of the Forbidden City. PLoS ONE 2022, 17, e0261607. [Google Scholar] [CrossRef] [PubMed]
  20. Allen, S. Designs for learning: Studying science museum exhibits that do more than entertain. Sci. Educ. 2004, 88, S17–S33. [Google Scholar] [CrossRef]
  21. Kamaruddin, N.; Rosli, H.; Wirasari, I.; Marman, M. Evaluation of interface design principles’ usability in permanent museum exhibition. Asian J. Environ.-Behav. Stud. 2022, 7, 29–43. [Google Scholar] [CrossRef]
  22. Gonçalves, L.; Campos, P.; Sousa, M. M-dimensions: A framework for evaluating and comparing interactive installations in museums. In Proceedings of the 7th Nordic Conference on Human-Computer Interaction: Making Sense Through Design, Copenhagen, Denmark, 14–17 October 2012; ACM: New York, NY, USA, 2012; pp. 59–68. [Google Scholar]
  23. Kuflik, T.; Stock, O.; Zancanaro, M.; Gorfinkel, A.; Jbara, S.; Kats, S.; Sheidin, J.; Kashtan, N. A visitor’s guide in an active museum: Presentations, communications, and reflection. J. Comput. Cult. Herit. 2011, 3, 11. [Google Scholar] [CrossRef]
  24. Kabassi, K. Application of multi-criteria decision-making models for the evaluation cultural websites: A framework for comparative analysis. Information 2021, 12, 407. [Google Scholar] [CrossRef]
  25. Nilashi, M.; Bagherifard, K.; Ibrahim, O.; Janahmadi, N.; Ebrahimi, L. Ranking parameters on quality of online shopping websites using multi-criteria method. Res. J. Appl. Sci. Eng. Technol. 2012, 4, 4380–4396. [Google Scholar]
  26. Kumar, A.; Dash, M.K.; Seharawat, R. Using entropy and AHP-TOPSIS for comprehensive evaluation of internet shopping malls and solution optimality. Int. J. Bus. Excell. 2017, 11, 487–504. [Google Scholar] [CrossRef]
  27. Wang, Z.; Zhou, X.; Yu, Z.; Wang, H.; Ni, H. Quantitative evaluation of group user experience in smart spaces. Cybern. Syst. 2010, 41, 105–122. [Google Scholar] [CrossRef]
  28. Hwang, C.L.; Yoon, K. Multiple Attribute Decision Making: Methods and Applications; Springer: Berlin/Heidelberg, Germany, 1981. [Google Scholar]
  29. Zavadskas, E.K.; Turskis, Z.; Tamošaitiene, J.; Marina, V. Selection of construction project managers by applying game theory. J. Bus. Econ. Manag. 2008, 9, 59–67. [Google Scholar]
  30. Pullman, M.E.; Gross, M.A. Ability of experience design elements to elicit emotions and loyalty behaviors. Decis. Sci. 2004, 35, 551–578. [Google Scholar] [CrossRef]
  31. Falk, J.H. Identity and the Museum Visitor Experience; Routledge: London, UK, 2016. [Google Scholar]
  32. Guo, K.; Fan, A.; Lehto, X.; Day, J. Immersive digital tourism: The role of multisensory cues in digital museum experiences. J. Hosp. Tour. Res. 2023, 47, 1017–1039. [Google Scholar] [CrossRef]
  33. Saaty, T.L. The Analytic Hierarchy Process; McGraw-Hill: New York, NY, USA, 1980. [Google Scholar]
  34. Kabassi, K. Evaluating websites of museums: State of the art. J. Cult. Herit. 2017, 24, 184–196. [Google Scholar] [CrossRef]
  35. Wang, J.J.; Jing, Y.Y.; Zhang, C.F.; Zhao, J.H. Review on multi-criteria decision analysis aid in sustainable energy decision-making. Renew. Sustain. Energy Rev. 2009, 13, 2263–2278. [Google Scholar] [CrossRef]
  36. Simon, N. The Participatory Museum; Museum 2.0: Santa Cruz, CA, USA, 2010. [Google Scholar]
  37. Li, S.C.; Jordanova, M.; Lindenberger, U. From good senses to good sense: A link between tactile information processing and intelligence. Intelligence 1998, 26, 99–122. [Google Scholar] [CrossRef]
  38. Gallace, A.; Spence, C. To what extent do Gestalt grouping principles influence tactile perception? Psychol. Bull. 2011, 137, 538–561. [Google Scholar] [CrossRef]
  39. Zhang, S.N.; Li, Y.Q.; Ruan, W.Q.; Liu, C.H. Would you enjoy virtual travel? The characteristics and causes of virtual tourists’ sentiment under the influence of the COVID-19 pandemic. Tour. Manag. 2022, 88, 104429. [Google Scholar] [CrossRef]
  40. Ramadhan, D.A.; Hidayati, S.; Asfarian, A.; Ardiansyah, F. Bridging the gap between education and experience: A comparative analysis of IPB University Museum’s visitor experience. Khizanah Al-Hikmah J. Ilmu Perpust. Inf. Dan Kearsipan 2023, 11, 118–127. [Google Scholar] [CrossRef]
  41. Huang, M.; Zhang, Z. Research on multi-modal scene design under the development of digital ecological culture industry. Int. J. Educ. Humanit. 2023, 9, 220–225. [Google Scholar]
  42. Wei, W.; Qi, R.; Zhang, L. Effects of virtual reality on theme park visitors’ experience and behaviors: A presence perspective. Tour. Manag. 2019, 71, 282–293. [Google Scholar] [CrossRef]
  43. Holbrook, M.B. Introduction to consumer value. In Consumer Value: A Framework for Analysis and Research; Holbrook, M.B., Ed.; Routledge: London, UK, 2002; pp. 17–44. [Google Scholar]
  44. Yi, J.H.; Kim, H.S. User experience research, experience design, and evaluation methods for museum mixed reality experience. J. Comput. Cult. Herit. 2021, 14, 48. [Google Scholar] [CrossRef]
  45. Kaiquan, C.; Xiaosong, H.; Xiaoli, H. Mechanism, scenarios, challenges and countermeasures of educational application of conversational general artificial intelligence. J. Distance Educ. 2023, 3, 21–41. [Google Scholar]
  46. Pisoni, G. Mediating distance: New interfaces and interaction design techniques to follow and take part in remote museum visits. J. Syst. Inf. Technol. 2020, 22, 329–350. [Google Scholar] [CrossRef]
  47. Gustafsson, B.M.; Danielsson, H.; Granlund, M.; Gustafsson, P.A.; Proczkowska-Björklund, M. Longitudinal pathways of engagement, social interaction skills, hyperactivity and conduct problems in preschool children. Scand. J. Psychol. 2021, 62, 170–184. [Google Scholar] [CrossRef]
  48. Johnson, L.D.; Weist, M.D.; Barrett, P.M.; Hugh, M.L. Exploring features within organizational and cognitive factors that predict variability in estimates of classwide active engagement. Top. Early Child. Spec. Educ. 2021, 41, 207–220. [Google Scholar] [CrossRef]
  49. Tu, J.C.; Liu, L.X.; Cui, Y. A study on consumers’ preferences for the Palace Museum’s cultural and creative products from the perspective of cultural sustainability. Sustainability 2019, 11, 3502. [Google Scholar] [CrossRef]

Figure 1. Research framework of the proposed SMIEEF model.
Information 17 00586 g001
Figure 2. AHP-based hierarchical weighting structure of smart museum interactive experience indicators.
Information 17 00586 g002
Table 1. Inclusion criteria for smart museum case selection.
CriterionDescriptionRelevance to This Study
Public museum statusThe museum should be a major public museum with stable exhibition operation and public cultural-service functions.Ensures that the selected cases share a comparable institutional basis.
Cultural heritage orientationThe museum should focus primarily on historical, cultural, or heritage-related collections and exhibitions.Ensures comparability in cultural communication and educational functions.
Digital and interactive practicesThe museum should have adopted digital exhibitions, interactive installations, smart guidance, immersive media, AR/VR, or online–offline digital services.Ensures that the case is suitable for evaluating smart museum interactive experience.
Accessibility for evaluationThe museum should allow expert evaluators to conduct on-site visits, in-depth interaction, or systematic review of its digital resources.Ensures the feasibility and consistency of data collection.
Variation across casesThe selected cases should differ in regional context, exhibition strategy, interaction design, and digital-service configuration.Allows the framework to test its discriminative ability across different smart museum profiles.
Table 2. Selected smart museum cases for comparative evaluation.
CaseMuseum
Case AHunan Museum
Case BShanghai Museum
Case CZhejiang Provincial Museum
Case DHubei Provincial Museum
Case ENanjing Museum
Table 3. Definitions of evaluation indicators for smart museum interactive experience.
Level-1 IndicatorLevel-2 IndicatorsDefinition
A1 (Sense)B1 VisualQuality of visual presentation, including images, interfaces, lighting, and digital display effects.
B2 AuditoryQuality of sound design, including narration, music, ambient sound, and audio guidance.
B3 TactileDegree of touch-based or device-based tactile interaction provided by the system.
A2 (Feel)B4 ComfortDegree of physical and operational comfort during interaction with the system.
B5 enjoymentDegree to which the interaction provides interest, pleasure, and experiential appeal.
B6 ImmersionDegree to which the system creates a sense of presence and deep involvement.
B7 AuthenticityDegree to which digital interaction maintains cultural, historical, or exhibition authenticity.
A3 (Think)B8 Cognitive ValueDegree to which the interaction supports understanding, thinking, and meaning-making.
B9 Information QualityAccuracy, clarity, completeness, and organization of the information provided.
B10 Educational ValueDegree to which the system supports knowledge acquisition and educational communication.
A4 (Act)B11 AccessibilityEase of accessing and using the interactive system across different conditions.
B12 Interaction QualitySmoothness, responsiveness, controllability, and effectiveness of the interaction process.
B13 EngagementDegree to which the system encourages active participation and continued exploration.
B14 PersonalizationDegree to which the system provides customized content, routes, or interaction options.
A5 (Relate)B15 Social InteractionDegree to which the system supports communication, sharing, or collaborative experience.
B16 Cultural ConnectednessDegree to which the interaction strengthens links with cultural heritage and museum narratives.
Table 4. Expert-evaluation items for smart museum interactive experience.
Evaluation Items
B11. To what extent does the visual design of the exhibition attract visitors’ attention? 2. To what extent are the visual effects of the exhibition clear and easy to understand?
B21. To what extent are the auditory elements coordinated with the exhibition content and able to enhance the visitor experience? 2. To what extent do the sound effects, such as background music and audio narration, enhance the sense of immersion?
B31. To what extent do the interactive exhibits provide a satisfactory tactile experience? 2. To what extent do tactile interactions, such as touchscreens or other interactive devices, enhance visitors’ sense of participation?
B41. To what extent is the exhibition environment comfortable in terms of spatial layout, temperature, noise control, and related conditions? 2. To what extent does the design of the interactive content make visitors feel relaxed during the visit?
B51. To what extent is the interactive content entertaining and enjoyable? 2. To what extent does the fun or interest of the exhibition encourage visitors to participate for a longer period of time?
B61. To what extent can visitors become immersed in the exhibition content? 2. To what extent are multisensory experiences, such as visual, auditory, and tactile elements, effectively presented?
B71. To what extent does the digital content of the exhibition appear authentic and credible? 2. To what extent do the virtual exhibits provide a strong sense of realism?
B81. To what extent does the exhibition content contribute to visitors’ knowledge or understanding? 2. To what extent does the interactive content improve visitors’ understanding of the exhibits?
B91. To what extent is the information presented in the exhibition accurate, clear, and easy to understand? 2. To what extent is the information detailed and consistent with visitors’ expectations?
B101. To what extent is the exhibition content educational and helpful for learning new knowledge? 2. To what extent does the interactive experience enhance the educational value of the exhibition?
B111. To what extent is the exhibition content easy to access and use, for example, whether visitors can smoothly operate the interactive devices or systems? 2. To what extent are the interaction methods suitable for different visitor groups, such as older adults and children?
B121. To what extent is the interactive design of the exhibition smooth and intuitive? 2. To what extent does the quality of interaction meet visitors’ expectations and enhance their sense of participation?
B131. To what extent does the exhibition attract visitors to actively participate in interactive activities? 2. To what extent does the exhibition encourage visitors to engage more deeply with and explore the content?
B141. To what extent does the exhibition provide customized content according to visitors’ interests and needs? 2. To what extent do visitors perceive that the exhibition content has been personalized or adjusted in certain aspects?
B151. To what extent does the exhibition provide opportunities for visitors to interact with other visitors? 2. To what extent are visitors encouraged to share their exhibition experience through social media or other channels?
B161. To what extent does the exhibition content enhance visitors’ understanding of or identification with the cultural background? 2. To what extent does the exhibition help visitors establish a connection with cultural heritage?
Table 5. Level-1 Indicator Weights Based on AHP.
A1A2A3A4A5
A1 sense12.5344263.331816982.8284675.754433
A2 feel0.3945666111.5453333361.169184.071222
A3 think0.300136530.6471110.7039422.293468
A4 act0.353548410.85531.42057118213.027378
A5 relate0.173779060.2456260.4360209490.3303191
WeightsλmaxCICR
A1 sense0.43725.02780.006950.0062 < 0.1
A2 feel0.2021
A3 think0.1295
A4 act0.1721
A5 relate0.059
Table 6. AHP Weights of Level-2 Indicators (B1–B16).
(A1)B1B2B3
B1 Visual13.1865113763.970196237
B2 Auditory0.31382282411.781716901
B3 Tactile0.2518767190.5612563921
WeightsλmaxCICR
B1 Visual0.63413.01420.007120.0137 < 0.1
B2 Auditory0.2242
B3 Tactile0.1418
(A2)B4B5B6B7
B4 Comfort11.6894254331.0930979471.810625138
B5 enjoyment0.59191721710.6225279421.15036007
B6 Immersion0.9148311031.60635359812.152916534
B7 Authenticity0.5522954360.8692930380.4644861911
WeightsλmaxCICR
B4 Comfort0.32354.00620.002060.0023 < 0.1
B5 enjoyment0.193
B6 Immersion0.3191
B7 Authenticity0.1644
(A3)B8B9B10
B8 Cognitive Value10.7515972432.382549953
B9 Information Quality1.33049982513.146477093
B10 Educational Value0.4197183770.3178157571
WeightsλmaxCICR
B8 Cognitive Value0.3639300 < 0.1
B9 Information Quality0.483
B10 Educational Value0.1531
(A4)B11B12B13B14
B11 Accessibility11.4377398891.5295900282.185654267
B12 Interaction Quality0.69553610311.1191130241.709006891
B13 Engagement0.6537699530.89356479511.810286007
B14 Personalization0.4575289030.5851351480.5523989011
WeightsλmaxCICR
B11 Accessibility0.35354.00630.002110.0024 < 0.1
B12 Interaction Quality0.2564
B13 Engagement0.2421
B14 Personalization0.148
(A5)B15B16
B15 Social Interaction11.436107574
B16 Cultural Connectedness0.6963266671
WeightsλmaxCICR
B15 Social Interaction0.58952.00.00 < 0.1
B16 Cultural Connectedness0.4105
Table 7. Comparison between entropy-based weights and AHP-based composite weights.
Indicator e j d j Entropy WeightRankAHP WeightRankConsistency
B1 Visual0.950050.049950.10333810.277228521Consistent
B2 Auditory0.9506450.0493550.10210720.098020242Consistent
B3 Tactile0.9799520.0200480.041475120.061994966Divergent
B4 Comfort0.9679320.0320680.06634380.065379353Partial
B5 enjoyment0.9792350.0207650.042958110.039005311Consistent
B6 Immersion0.9592430.0407570.0843240.064490114Consistent
B7 Authenticity0.9663120.0336880.06969560.0332252413Divergent
B8 Cognitive Value0.9836450.0163550.033837160.047125058Divergent
B9 Information Quality0.9656590.0343410.07104750.06254855Consistent
B10 Educational Value0.9828290.0171710.035524150.0198264516Similar
B11 Accessibility0.9826020.0173980.035993140.060837357Divergent
B12 Interaction Quality0.9554810.0445190.09210230.044126449Divergent
B13 Engagement0.971760.028240.058423100.0416654110Consistent
B14 Personalization0.9676220.0323780.06698570.025470814Divergent
B15 Social Interaction0.9717080.0282920.05853190.034780512Partial
B16 Cultural Connectedness0.981960.018040.037321130.024219515Similar
Table 8. Game-Theoretic Combined Weights.
IndicatorA1 SenseA2 FeelA3 ThinkA4 ActA5 RelateRank
B1 Visual0.2534 1
B2 Auditory0.0986 2
B3 Tactile0.0592 6
B4 Comfort 0.0655 4
B5 Enjoyment 0.0395 11
B6 Immersion 0.0672 3
B7 Authenticity 0.0382 12
B8 Cognitive Value 0.0453 9
B9 Information Quality 0.0637 5
B10 Educational Value 0.022 16
B11 Accessibility 0.0574 7
B12 Interaction Quality 0.0507 8
B13 Engagement 0.044 10
B14 Personalization 0.0312 14
B15 Social Interaction 0.03813
B16 Cultural Connectedness 0.02615
Level-1 Relative Weight0.41120.21040.1310.18330.064
Table 9. Weighted Normalized Decision Matrix.
IndicatorCase ACase BCase CCase DCase E
B10.1467310.2400880.2534250.0467042.50 × 10−5
B20.019730.078890.098610.0039541.00 × 10−5
B30.043060.0592060.0556180.0035946.00 × 10−6
B40.03170.0422650.0655070.0105717.00 × 10−6
B50.0266930.0320310.0395040.010684.00 × 10−6
B60.0378070.0588070.0672070.0189077.00 × 10−6
B70.0127370.0353740.0382040.0113224.00 × 10−6
B80.01970.0433350.0453050.01975.00 × 10−6
B90.0307580.0483310.0637060.0109896.00 × 10−6
B100.0140820.0184820.0220020.0052822.00 × 10−6
B110.0313150.0287060.0574060.0234886.00 × 10−6
B120.0287810.0383730.0507050.02335.00 × 10−6
B130.0261670.0344910.0440040.0166534.00 × 10−6
B140.0208030.0312030.0312030.0104033.00 × 10−6
B150.0168930.022170.0380040.0073934.00 × 10−6
B160.0143030.0221030.0260030.0026033.00 × 10−6
Table 10. Overall Relative Closeness and Final Ranking.
Game-Theoretic Combined WeightsDistance to Positive Ideal Solution ( d i + )Distance to Negative Ideal Solution ( d i )Relative Closeness ( C i )Rank
Case A0.1570370.1789410.5325973
Case B0.0531620.2913240.8456772
Case C0.0035880.3260990.9891171
Case D0.2645210.0706780.2108544
Case E0.32673005
Table 11. Dimension-Level TOPSIS Results.
Case A
(Hunan)
Distance   to   Positive   Ideal   Solution   ( d i + ) Distance   to   Negative   Ideal   Solution   ( d i ) Relative   Closeness   ( C i )Rank
A1 Sense0.1336660.1541590.5356012
A2 Feel0.0531030.0575130.5199363
A3 Think0.0424720.0391390.4795764
A4 Act0.0398470.0540870.5757991
A5 Relate0.0241360.022130.4783135
Case B
(Shanghai)
Distance   to   Positive   Ideal   Solution   ( d i + ) Distance   to   Negative   Ideal   Solution   ( d i ) Relative   Closeness   ( C i )Rank
A1 Sense0.0238070.2595320.9159791
A2 Feel0.0259730.0867180.7695193
A3 Think0.0158960.0674850.8093562
A4 Act0.0326540.0667720.6715754
A5 Relate0.0163070.0313010.6574825
Case C
(Zhejiang)
Distance   to   Positive   Ideal   Solution   ( d i + ) Distance   to   Negative   Ideal   Solution   ( d i ) Relative   Closeness   ( C i )Rank
A1 Sense0.0035880.2775360.9872375
A2 Feel00.10874514
A3 Think00.08120212
A4 Act00.09367313
A5 Relate00.04604311
Case D
(Hubei)
Distance   to   Positive   Ideal   Solution   ( d i + ) Distance   to   Negative   Ideal   Solution   ( d i ) Relative   Closeness   ( C i )Rank
A1 Sense0.2340640.0469820.167175
A2 Feel0.0830920.0266630.242933
A3 Think0.0609450.0231610.2753772
A4 Act0.0555180.0384630.4092621
A5 Relate0.0385310.0078330.1689474
Case E
(Nanjing)
Distance   to   Positive   Ideal   Solution   ( d i + ) Distance   to   Negative   Ideal   Solution   ( d i ) Relative   Closeness   ( C i )Rank
A1 Sense0.278277005
A2 Feel0.108745004
A3 Think0.081202002
A4 Act0.093673003
A5 Relate0.046043001
Table 12. Comparison of TOPSIS Results under Different Weighting Schemes.
entropy weights Distance   to   Positive   Ideal   Solution   ( d i + ) Distance   to   Negative   Ideal   Solution   ( d i ) Relative   Closeness   ( C i )Rank
Case A0.1404020.137460.4947063
Case B0.0560770.2222850.7985472
Case C0.0025140.2660610.9906411
Case D0.2062460.0721170.2590764
Case E0.266441005
AHP
Weights
Distance   to   Positive   Ideal   Solution   ( d i + ) Distance   to   Negative   Ideal   Solution   ( d i ) Relative   Closeness   ( C i )Rank
Case A0.1625770.1893440.538033
Case B0.0533670.3082740.8524322
Case C0.0037570.3424460.9891471
Case D0.2785740.0724370.2063674
Case E0.343105005
average weights Distance   to   Positive   Ideal   Solution   ( d i + ) Distance   to   Negative   Ideal   Solution   ( d i ) Relative   Closeness   ( C i )Rank
Case A0.1217690.1365260.5285653
Case B0.0580730.2066280.7806082
Case C0.0037880.249080.985021
Case D0.1898850.0702140.269954
Case E0.25005
Table 13. Statistical robustness analysis of TOPSIS results under different weighting schemes.
MetricShapiro–Wilk TestBartlett’s TestFriedman/Consistency TestInterpretation
d i + All p > 0.05p = 0.870χ2 = 3.480, p = 0.323No significant difference
d i All p > 0.05p = 0.862χ2 = 11.100, p = 0.011Significant difference
C i All p > 0.05p = 0.999χ2 = 1.200, p = 0.753No significant difference
RankingSpearman’s ρ = 1.000
Kendall’s W = 1.000
Fully consistent ranking
Note: “—” indicates that the test was not applicable. Ranking data are ordinal; therefore, Spearman’s ρ and Kendall’s W were used to assess ranking consistency.
Disclaimer/Publisher’s Note: The statements, opinions and data contained in all publications are solely those of the individual author(s) and contributor(s) and not of MDPI and/or the editor(s). MDPI and/or the editor(s) disclaim responsibility for any injury to people or property resulting from any ideas, methods, instructions or products referred to in the content.