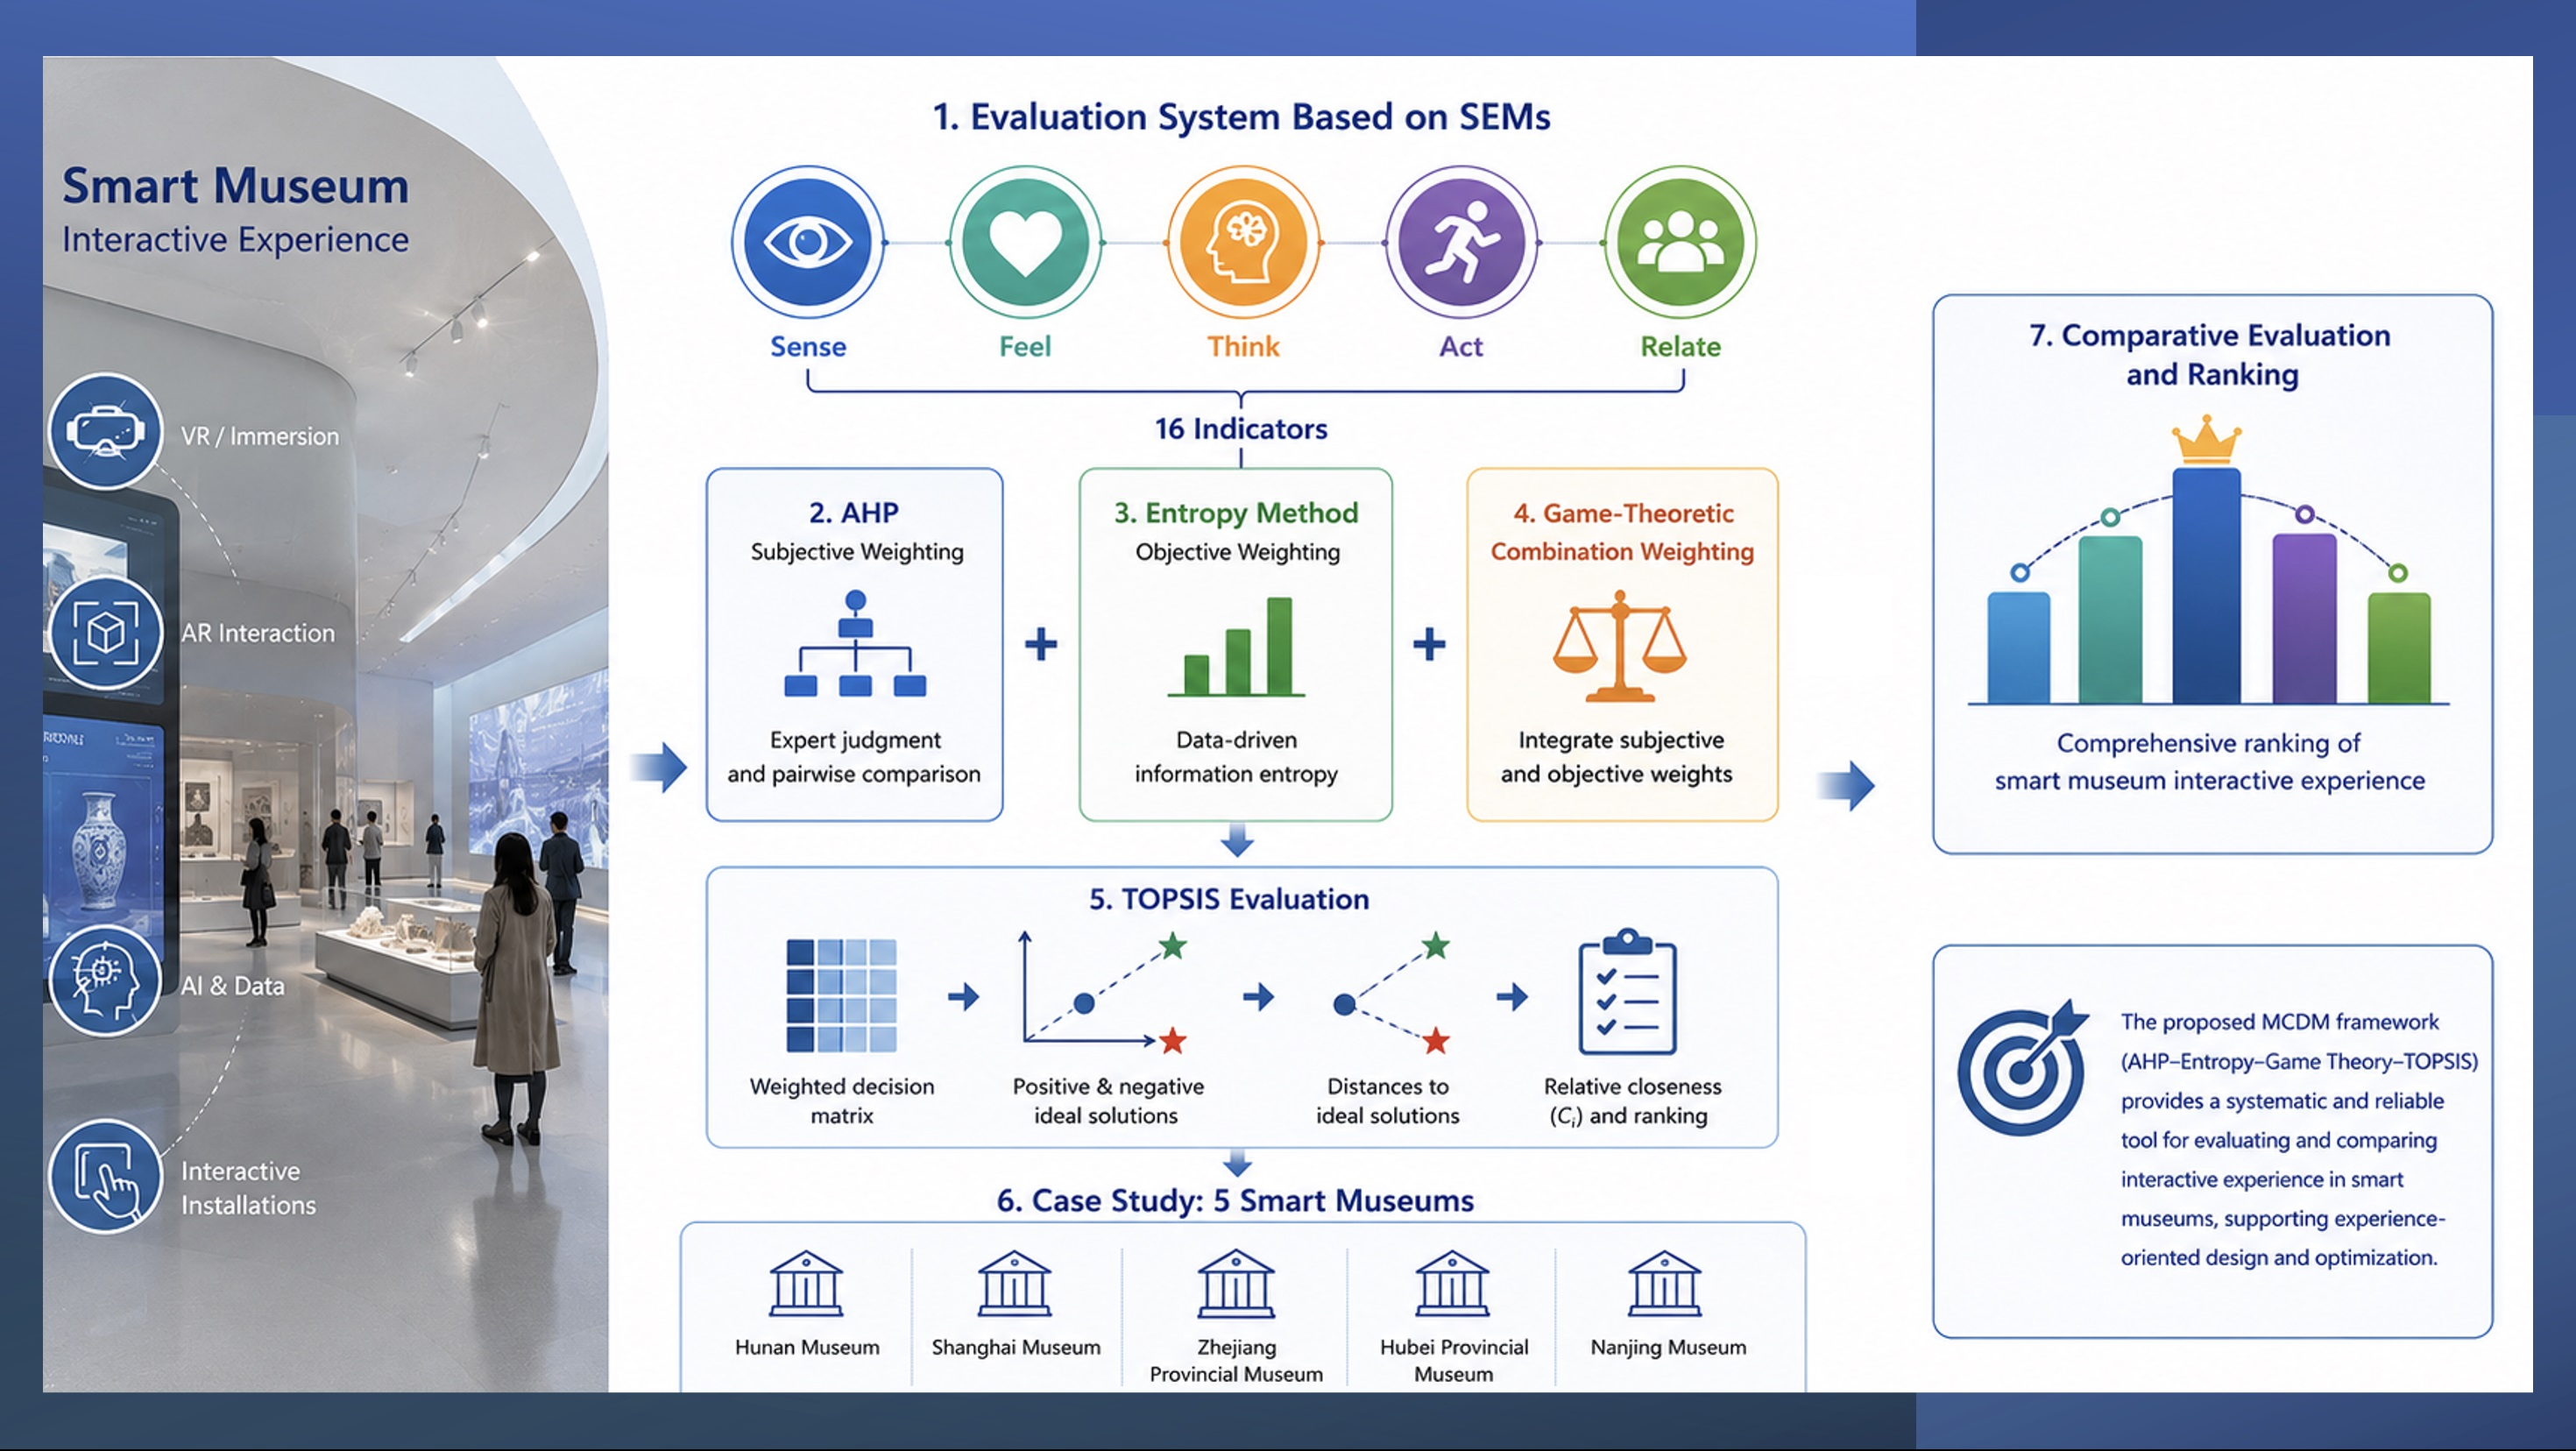
A Multi-Criteria Decision-Making Framework for Evaluating Interactive Experience in Smart Museums


Abstract
1. Introduction
2. Literature Review
2.1. Research on Technology-Enabled Museum Interaction
2.2. Research on Interactive Experience in Museum Contexts
2.3. Research on the Evaluation of Museum Interactive Experience
2.4. Research on MCDM Methods and Their Applicability
2.5. Summary of the Literature
3. Research Framework
3.1. Evaluation Dimensions and Indicators
3.2. Weight Determination
3.3. Case Selection
3.4. Data Collection and Preprocessing
3.5. TOPSIS-Based Comparative Evaluation
4. Dimensions and Criteria
4.1. Sense
4.2. Feel
4.3. Think
4.4. Act
4.5. Relate
5. Methodology and Weighting Results
5.1. Subjective Weighting Using the Analytic Hierarchy Process (AHP)
5.2. Entropy-Based Weighting Using Expert Evaluation Data
5.3. Integrated Weighting Based on Game Theory
5.4. Evaluation Procedure Based on the TOPSIS Method
6. Evaluation Results and Robustness Analysis
6.1. Overall TOPSIS Ranking Results
6.2. Dimension-Level Comparative Results
6.3. Robustness Check Under Different Weighting Schemes
7. Discussion
7.1. Answers to the Research Questions
7.2. Comparison with Previous Studies
7.3. Practical Implications
8. Conclusions
Author Contributions
Funding
Institutional Review Board Statement
Informed Consent Statement
Data Availability Statement
Conflicts of Interest
References
- He, Z.; Wu, L.; Li, X.R. When art meets tech: The role of augmented reality in enhancing museum experiences and purchase intentions. Tour. Manag. 2018, 68, 127–139. [Google Scholar] [CrossRef]
- Lee, H.; Jung, T.H.; tom Dieck, M.C.; Chung, N. Experiencing immersive virtual reality in museums. Inf. Manag. 2020, 57, 103229. [Google Scholar] [CrossRef]
- Serravalle, F.; Ferraris, A.; Vrontis, D.; Thrassou, A.; Christofi, M. Augmented reality in the tourism industry: A multi-stakeholder analysis of museums. Tour. Manag. Perspect. 2019, 32, 100549. [Google Scholar] [CrossRef]
- Li, H.; Shen, C.; Zhang, K.; Wang, H. Implementation technology of the smart museum of the South China Sea Museum based on UWB. In Proceedings of the 2019 3rd International Conference on Data Science and Business Analytics (ICDSBA), Changsha, China, 20–22 September 2019; IEEE: Piscataway, NJ, USA, 2019; pp. 369–374. [Google Scholar]
- Jeong, M.; Shin, H.H. Tourists’ experiences with smart tourism technology at smart destinations and their behavior intentions. J. Travel Res. 2020, 59, 1464–1477. [Google Scholar] [CrossRef]
- Bae, E.S.; Im, D.U.; Lee, S.Y. Smart museum based on regional unified app. Int. J. Softw. Eng. Its Appl. 2013, 7, 157–166. [Google Scholar]
- Pallud, J. Impact of interactive technologies on stimulating learning experiences in a museum. Inf. Manag. 2017, 54, 465–478. [Google Scholar] [CrossRef]
- Naramski, M. The application of ICT and smart technologies in Polish museums—Towards smart tourism. Sustainability 2020, 12, 9287. [Google Scholar] [CrossRef]
- Dayyani, D. Designing an Interactive Museum Experience Inside Primary Schools; Politecnico di Milano: Milan, Italy, 2021. [Google Scholar]
- Jafari, A.; Taheri, B.; vom Lehn, D. Cultural consumption, interactive sociality, and the museum. J. Mark. Manag. 2013, 29, 1729–1752. [Google Scholar] [CrossRef]
- Sundar, S.S.; Jia, H.; Waddell, T.F.; Huang, Y. Toward a theory of interactive media effects (TIME): Four models for explaining how interface features affect user psychology. In The Handbook of the Psychology of Communication Technology; Sundar, S.S., Ed.; Wiley Blackwell: Hoboken, NJ, USA, 2015; pp. 47–86. [Google Scholar]
- Shaby, N.; Assaraf, O.B.Z.; Tal, T. The particular aspects of science museum exhibits that encourage students’ engagement. J. Sci. Educ. Technol. 2017, 26, 253–268. [Google Scholar] [CrossRef]
- Forlizzi, J.; Battarbee, K. Understanding experience in interactive systems. In Proceedings of the 5th Conference on Designing Interactive Systems: Processes, Practices, Methods, and Techniques, Cambridge, MA, USA, 1–4 August 2004; ACM: New York, NY, USA, 2004; pp. 261–268. [Google Scholar]
- Schmitt, B. Experiential marketing. J. Mark. Manag. 1999, 15, 53–67. [Google Scholar] [CrossRef]
- Jangra, S.; Singh, G.; Mantri, A. Evaluating user experience in cultural heritage through virtual reality simulations. Virtual Archaeol. Rev. 2025, 16, 17–31. [Google Scholar] [CrossRef]
- Param, A.G.; Minasians, A.; Abasi, F. Evaluating the effective factors in promoting the target audience-based attraction of a museum with the approach of increasing social interactions: Case study of Tehran City Region 2, Iran. PalArch’s J. Archaeol. Egypt/Egyptol. 2021, 18, 17–40. [Google Scholar]
- Hassenzahl, M.; Tractinsky, N. User experience—A research agenda. Behav. Inf. Technol. 2006, 25, 91–97. [Google Scholar] [CrossRef]
- Khundam, C.; Noël, F. Evaluation of adaptive interaction systems for virtual museum development. Trends Sci. 2021, 18, 1405. [Google Scholar] [CrossRef]
- Li, J.; Nie, J.W.; Ye, J. Evaluation of virtual tour in an online museum: Exhibition of Architecture of the Forbidden City. PLoS ONE 2022, 17, e0261607. [Google Scholar] [CrossRef] [PubMed]
- Allen, S. Designs for learning: Studying science museum exhibits that do more than entertain. Sci. Educ. 2004, 88, S17–S33. [Google Scholar] [CrossRef]
- Kamaruddin, N.; Rosli, H.; Wirasari, I.; Marman, M. Evaluation of interface design principles’ usability in permanent museum exhibition. Asian J. Environ.-Behav. Stud. 2022, 7, 29–43. [Google Scholar] [CrossRef]
- Gonçalves, L.; Campos, P.; Sousa, M. M-dimensions: A framework for evaluating and comparing interactive installations in museums. In Proceedings of the 7th Nordic Conference on Human-Computer Interaction: Making Sense Through Design, Copenhagen, Denmark, 14–17 October 2012; ACM: New York, NY, USA, 2012; pp. 59–68. [Google Scholar]
- Kuflik, T.; Stock, O.; Zancanaro, M.; Gorfinkel, A.; Jbara, S.; Kats, S.; Sheidin, J.; Kashtan, N. A visitor’s guide in an active museum: Presentations, communications, and reflection. J. Comput. Cult. Herit. 2011, 3, 11. [Google Scholar] [CrossRef]
- Kabassi, K. Application of multi-criteria decision-making models for the evaluation cultural websites: A framework for comparative analysis. Information 2021, 12, 407. [Google Scholar] [CrossRef]
- Nilashi, M.; Bagherifard, K.; Ibrahim, O.; Janahmadi, N.; Ebrahimi, L. Ranking parameters on quality of online shopping websites using multi-criteria method. Res. J. Appl. Sci. Eng. Technol. 2012, 4, 4380–4396. [Google Scholar]
- Kumar, A.; Dash, M.K.; Seharawat, R. Using entropy and AHP-TOPSIS for comprehensive evaluation of internet shopping malls and solution optimality. Int. J. Bus. Excell. 2017, 11, 487–504. [Google Scholar] [CrossRef]
- Wang, Z.; Zhou, X.; Yu, Z.; Wang, H.; Ni, H. Quantitative evaluation of group user experience in smart spaces. Cybern. Syst. 2010, 41, 105–122. [Google Scholar] [CrossRef]
- Hwang, C.L.; Yoon, K. Multiple Attribute Decision Making: Methods and Applications; Springer: Berlin/Heidelberg, Germany, 1981. [Google Scholar]
- Zavadskas, E.K.; Turskis, Z.; Tamošaitiene, J.; Marina, V. Selection of construction project managers by applying game theory. J. Bus. Econ. Manag. 2008, 9, 59–67. [Google Scholar]
- Pullman, M.E.; Gross, M.A. Ability of experience design elements to elicit emotions and loyalty behaviors. Decis. Sci. 2004, 35, 551–578. [Google Scholar] [CrossRef]
- Falk, J.H. Identity and the Museum Visitor Experience; Routledge: London, UK, 2016. [Google Scholar]
- Guo, K.; Fan, A.; Lehto, X.; Day, J. Immersive digital tourism: The role of multisensory cues in digital museum experiences. J. Hosp. Tour. Res. 2023, 47, 1017–1039. [Google Scholar] [CrossRef]
- Saaty, T.L. The Analytic Hierarchy Process; McGraw-Hill: New York, NY, USA, 1980. [Google Scholar]
- Kabassi, K. Evaluating websites of museums: State of the art. J. Cult. Herit. 2017, 24, 184–196. [Google Scholar] [CrossRef]
- Wang, J.J.; Jing, Y.Y.; Zhang, C.F.; Zhao, J.H. Review on multi-criteria decision analysis aid in sustainable energy decision-making. Renew. Sustain. Energy Rev. 2009, 13, 2263–2278. [Google Scholar] [CrossRef]
- Simon, N. The Participatory Museum; Museum 2.0: Santa Cruz, CA, USA, 2010. [Google Scholar]
- Li, S.C.; Jordanova, M.; Lindenberger, U. From good senses to good sense: A link between tactile information processing and intelligence. Intelligence 1998, 26, 99–122. [Google Scholar] [CrossRef]
- Gallace, A.; Spence, C. To what extent do Gestalt grouping principles influence tactile perception? Psychol. Bull. 2011, 137, 538–561. [Google Scholar] [CrossRef]
- Zhang, S.N.; Li, Y.Q.; Ruan, W.Q.; Liu, C.H. Would you enjoy virtual travel? The characteristics and causes of virtual tourists’ sentiment under the influence of the COVID-19 pandemic. Tour. Manag. 2022, 88, 104429. [Google Scholar] [CrossRef]
- Ramadhan, D.A.; Hidayati, S.; Asfarian, A.; Ardiansyah, F. Bridging the gap between education and experience: A comparative analysis of IPB University Museum’s visitor experience. Khizanah Al-Hikmah J. Ilmu Perpust. Inf. Dan Kearsipan 2023, 11, 118–127. [Google Scholar] [CrossRef]
- Huang, M.; Zhang, Z. Research on multi-modal scene design under the development of digital ecological culture industry. Int. J. Educ. Humanit. 2023, 9, 220–225. [Google Scholar]
- Wei, W.; Qi, R.; Zhang, L. Effects of virtual reality on theme park visitors’ experience and behaviors: A presence perspective. Tour. Manag. 2019, 71, 282–293. [Google Scholar] [CrossRef]
- Holbrook, M.B. Introduction to consumer value. In Consumer Value: A Framework for Analysis and Research; Holbrook, M.B., Ed.; Routledge: London, UK, 2002; pp. 17–44. [Google Scholar]
- Yi, J.H.; Kim, H.S. User experience research, experience design, and evaluation methods for museum mixed reality experience. J. Comput. Cult. Herit. 2021, 14, 48. [Google Scholar] [CrossRef]
- Kaiquan, C.; Xiaosong, H.; Xiaoli, H. Mechanism, scenarios, challenges and countermeasures of educational application of conversational general artificial intelligence. J. Distance Educ. 2023, 3, 21–41. [Google Scholar]
- Pisoni, G. Mediating distance: New interfaces and interaction design techniques to follow and take part in remote museum visits. J. Syst. Inf. Technol. 2020, 22, 329–350. [Google Scholar] [CrossRef]
- Gustafsson, B.M.; Danielsson, H.; Granlund, M.; Gustafsson, P.A.; Proczkowska-Björklund, M. Longitudinal pathways of engagement, social interaction skills, hyperactivity and conduct problems in preschool children. Scand. J. Psychol. 2021, 62, 170–184. [Google Scholar] [CrossRef]
- Johnson, L.D.; Weist, M.D.; Barrett, P.M.; Hugh, M.L. Exploring features within organizational and cognitive factors that predict variability in estimates of classwide active engagement. Top. Early Child. Spec. Educ. 2021, 41, 207–220. [Google Scholar] [CrossRef]
- Tu, J.C.; Liu, L.X.; Cui, Y. A study on consumers’ preferences for the Palace Museum’s cultural and creative products from the perspective of cultural sustainability. Sustainability 2019, 11, 3502. [Google Scholar] [CrossRef]


| Criterion | Description | Relevance to This Study |
|---|---|---|
| Public museum status | The museum should be a major public museum with stable exhibition operation and public cultural-service functions. | Ensures that the selected cases share a comparable institutional basis. |
| Cultural heritage orientation | The museum should focus primarily on historical, cultural, or heritage-related collections and exhibitions. | Ensures comparability in cultural communication and educational functions. |
| Digital and interactive practices | The museum should have adopted digital exhibitions, interactive installations, smart guidance, immersive media, AR/VR, or online–offline digital services. | Ensures that the case is suitable for evaluating smart museum interactive experience. |
| Accessibility for evaluation | The museum should allow expert evaluators to conduct on-site visits, in-depth interaction, or systematic review of its digital resources. | Ensures the feasibility and consistency of data collection. |
| Variation across cases | The selected cases should differ in regional context, exhibition strategy, interaction design, and digital-service configuration. | Allows the framework to test its discriminative ability across different smart museum profiles. |
| Case | Museum |
|---|---|
| Case A | Hunan Museum |
| Case B | Shanghai Museum |
| Case C | Zhejiang Provincial Museum |
| Case D | Hubei Provincial Museum |
| Case E | Nanjing Museum |
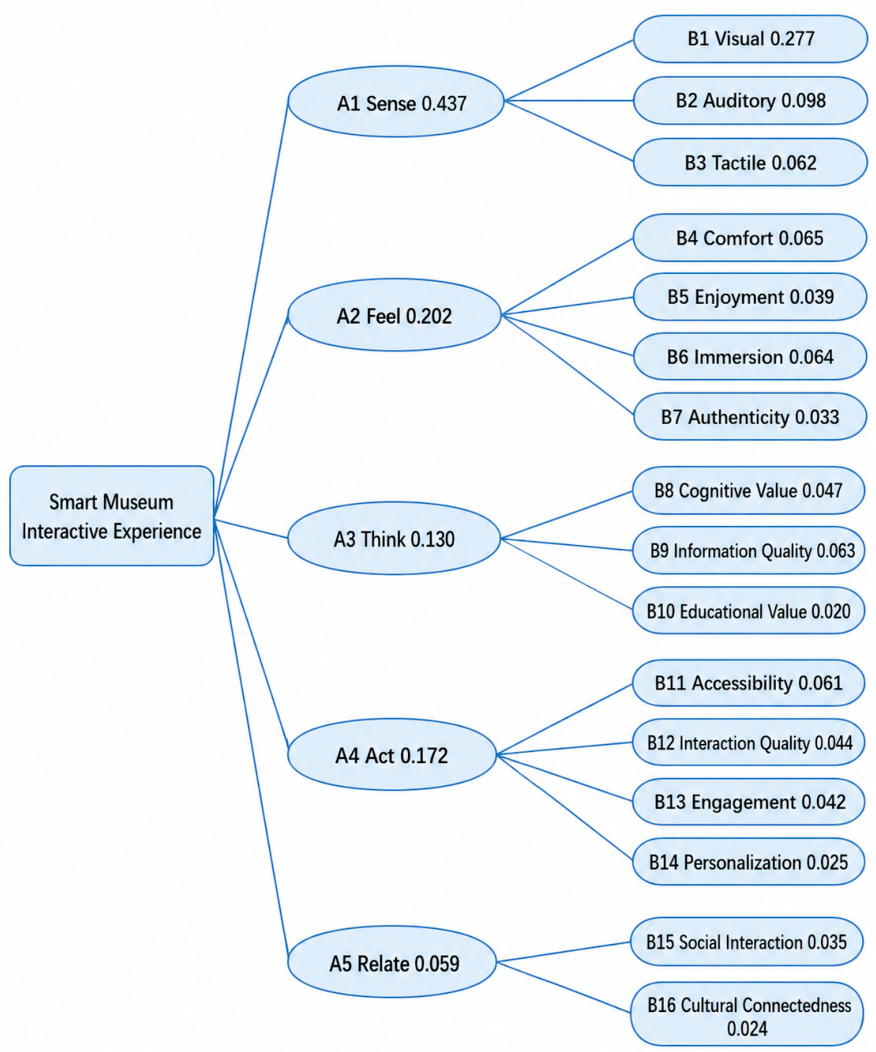
| Level-1 Indicator | Level-2 Indicators | Definition |
|---|---|---|
| A1 (Sense) | B1 Visual | Quality of visual presentation, including images, interfaces, lighting, and digital display effects. |
| B2 Auditory | Quality of sound design, including narration, music, ambient sound, and audio guidance. | |
| B3 Tactile | Degree of touch-based or device-based tactile interaction provided by the system. | |
| A2 (Feel) | B4 Comfort | Degree of physical and operational comfort during interaction with the system. |
| B5 enjoyment | Degree to which the interaction provides interest, pleasure, and experiential appeal. | |
| B6 Immersion | Degree to which the system creates a sense of presence and deep involvement. | |
| B7 Authenticity | Degree to which digital interaction maintains cultural, historical, or exhibition authenticity. | |
| A3 (Think) | B8 Cognitive Value | Degree to which the interaction supports understanding, thinking, and meaning-making. |
| B9 Information Quality | Accuracy, clarity, completeness, and organization of the information provided. | |
| B10 Educational Value | Degree to which the system supports knowledge acquisition and educational communication. | |
| A4 (Act) | B11 Accessibility | Ease of accessing and using the interactive system across different conditions. |
| B12 Interaction Quality | Smoothness, responsiveness, controllability, and effectiveness of the interaction process. | |
| B13 Engagement | Degree to which the system encourages active participation and continued exploration. | |
| B14 Personalization | Degree to which the system provides customized content, routes, or interaction options. | |
| A5 (Relate) | B15 Social Interaction | Degree to which the system supports communication, sharing, or collaborative experience. |
| B16 Cultural Connectedness | Degree to which the interaction strengthens links with cultural heritage and museum narratives. |
| Evaluation Items | |
|---|---|
| B1 | 1. To what extent does the visual design of the exhibition attract visitors’ attention? 2. To what extent are the visual effects of the exhibition clear and easy to understand? |
| B2 | 1. To what extent are the auditory elements coordinated with the exhibition content and able to enhance the visitor experience? 2. To what extent do the sound effects, such as background music and audio narration, enhance the sense of immersion? |
| B3 | 1. To what extent do the interactive exhibits provide a satisfactory tactile experience? 2. To what extent do tactile interactions, such as touchscreens or other interactive devices, enhance visitors’ sense of participation? |
| B4 | 1. To what extent is the exhibition environment comfortable in terms of spatial layout, temperature, noise control, and related conditions? 2. To what extent does the design of the interactive content make visitors feel relaxed during the visit? |
| B5 | 1. To what extent is the interactive content entertaining and enjoyable? 2. To what extent does the fun or interest of the exhibition encourage visitors to participate for a longer period of time? |
| B6 | 1. To what extent can visitors become immersed in the exhibition content? 2. To what extent are multisensory experiences, such as visual, auditory, and tactile elements, effectively presented? |
| B7 | 1. To what extent does the digital content of the exhibition appear authentic and credible? 2. To what extent do the virtual exhibits provide a strong sense of realism? |
| B8 | 1. To what extent does the exhibition content contribute to visitors’ knowledge or understanding? 2. To what extent does the interactive content improve visitors’ understanding of the exhibits? |
| B9 | 1. To what extent is the information presented in the exhibition accurate, clear, and easy to understand? 2. To what extent is the information detailed and consistent with visitors’ expectations? |
| B10 | 1. To what extent is the exhibition content educational and helpful for learning new knowledge? 2. To what extent does the interactive experience enhance the educational value of the exhibition? |
| B11 | 1. To what extent is the exhibition content easy to access and use, for example, whether visitors can smoothly operate the interactive devices or systems? 2. To what extent are the interaction methods suitable for different visitor groups, such as older adults and children? |
| B12 | 1. To what extent is the interactive design of the exhibition smooth and intuitive? 2. To what extent does the quality of interaction meet visitors’ expectations and enhance their sense of participation? |
| B13 | 1. To what extent does the exhibition attract visitors to actively participate in interactive activities? 2. To what extent does the exhibition encourage visitors to engage more deeply with and explore the content? |
| B14 | 1. To what extent does the exhibition provide customized content according to visitors’ interests and needs? 2. To what extent do visitors perceive that the exhibition content has been personalized or adjusted in certain aspects? |
| B15 | 1. To what extent does the exhibition provide opportunities for visitors to interact with other visitors? 2. To what extent are visitors encouraged to share their exhibition experience through social media or other channels? |
| B16 | 1. To what extent does the exhibition content enhance visitors’ understanding of or identification with the cultural background? 2. To what extent does the exhibition help visitors establish a connection with cultural heritage? |
| A1 | A2 | A3 | A4 | A5 | |
| A1 sense | 1 | 2.534426 | 3.33181698 | 2.828467 | 5.754433 |
| A2 feel | 0.39456661 | 1 | 1.545333336 | 1.16918 | 4.071222 |
| A3 think | 0.30013653 | 0.64711 | 1 | 0.703942 | 2.293468 |
| A4 act | 0.35354841 | 0.8553 | 1.420571182 | 1 | 3.027378 |
| A5 relate | 0.17377906 | 0.245626 | 0.436020949 | 0.330319 | 1 |
| Weights | λmax | CI | CR | ||
| A1 sense | 0.4372 | 5.0278 | 0.00695 | 0.0062 < 0.1 | |
| A2 feel | 0.2021 | ||||
| A3 think | 0.1295 | ||||
| A4 act | 0.1721 | ||||
| A5 relate | 0.059 | ||||
| (A1) | B1 | B2 | B3 | |
| B1 Visual | 1 | 3.186511376 | 3.970196237 | |
| B2 Auditory | 0.313822824 | 1 | 1.781716901 | |
| B3 Tactile | 0.251876719 | 0.561256392 | 1 | |
| Weights | λmax | CI | CR | |
| B1 Visual | 0.6341 | 3.0142 | 0.00712 | 0.0137 < 0.1 |
| B2 Auditory | 0.2242 | |||
| B3 Tactile | 0.1418 | |||
| (A2) | B4 | B5 | B6 | B7 |
| B4 Comfort | 1 | 1.689425433 | 1.093097947 | 1.810625138 |
| B5 enjoyment | 0.591917217 | 1 | 0.622527942 | 1.15036007 |
| B6 Immersion | 0.914831103 | 1.606353598 | 1 | 2.152916534 |
| B7 Authenticity | 0.552295436 | 0.869293038 | 0.464486191 | 1 |
| Weights | λmax | CI | CR | |
| B4 Comfort | 0.3235 | 4.0062 | 0.00206 | 0.0023 < 0.1 |
| B5 enjoyment | 0.193 | |||
| B6 Immersion | 0.3191 | |||
| B7 Authenticity | 0.1644 | |||
| (A3) | B8 | B9 | B10 | |
| B8 Cognitive Value | 1 | 0.751597243 | 2.382549953 | |
| B9 Information Quality | 1.330499825 | 1 | 3.146477093 | |
| B10 Educational Value | 0.419718377 | 0.317815757 | 1 | |
| Weights | λmax | CI | CR | |
| B8 Cognitive Value | 0.3639 | 3 | 0 | 0 < 0.1 |
| B9 Information Quality | 0.483 | |||
| B10 Educational Value | 0.1531 | |||
| (A4) | B11 | B12 | B13 | B14 |
| B11 Accessibility | 1 | 1.437739889 | 1.529590028 | 2.185654267 |
| B12 Interaction Quality | 0.695536103 | 1 | 1.119113024 | 1.709006891 |
| B13 Engagement | 0.653769953 | 0.893564795 | 1 | 1.810286007 |
| B14 Personalization | 0.457528903 | 0.585135148 | 0.552398901 | 1 |
| Weights | λmax | CI | CR | |
| B11 Accessibility | 0.3535 | 4.0063 | 0.00211 | 0.0024 < 0.1 |
| B12 Interaction Quality | 0.2564 | |||
| B13 Engagement | 0.2421 | |||
| B14 Personalization | 0.148 | |||
| (A5) | B15 | B16 | ||
| B15 Social Interaction | 1 | 1.436107574 | ||
| B16 Cultural Connectedness | 0.696326667 | 1 | ||
| Weights | λmax | CI | CR | |
| B15 Social Interaction | 0.5895 | 2.0 | 0.0 | 0 < 0.1 |
| B16 Cultural Connectedness | 0.4105 | |||
| Indicator | Entropy Weight | Rank | AHP Weight | Rank | Consistency | ||
|---|---|---|---|---|---|---|---|
| B1 Visual | 0.95005 | 0.04995 | 0.103338 | 1 | 0.27722852 | 1 | Consistent |
| B2 Auditory | 0.950645 | 0.049355 | 0.102107 | 2 | 0.09802024 | 2 | Consistent |
| B3 Tactile | 0.979952 | 0.020048 | 0.041475 | 12 | 0.06199496 | 6 | Divergent |
| B4 Comfort | 0.967932 | 0.032068 | 0.066343 | 8 | 0.06537935 | 3 | Partial |
| B5 enjoyment | 0.979235 | 0.020765 | 0.042958 | 11 | 0.0390053 | 11 | Consistent |
| B6 Immersion | 0.959243 | 0.040757 | 0.08432 | 4 | 0.06449011 | 4 | Consistent |
| B7 Authenticity | 0.966312 | 0.033688 | 0.069695 | 6 | 0.03322524 | 13 | Divergent |
| B8 Cognitive Value | 0.983645 | 0.016355 | 0.033837 | 16 | 0.04712505 | 8 | Divergent |
| B9 Information Quality | 0.965659 | 0.034341 | 0.071047 | 5 | 0.0625485 | 5 | Consistent |
| B10 Educational Value | 0.982829 | 0.017171 | 0.035524 | 15 | 0.01982645 | 16 | Similar |
| B11 Accessibility | 0.982602 | 0.017398 | 0.035993 | 14 | 0.06083735 | 7 | Divergent |
| B12 Interaction Quality | 0.955481 | 0.044519 | 0.092102 | 3 | 0.04412644 | 9 | Divergent |
| B13 Engagement | 0.97176 | 0.02824 | 0.058423 | 10 | 0.04166541 | 10 | Consistent |
| B14 Personalization | 0.967622 | 0.032378 | 0.066985 | 7 | 0.0254708 | 14 | Divergent |
| B15 Social Interaction | 0.971708 | 0.028292 | 0.058531 | 9 | 0.0347805 | 12 | Partial |
| B16 Cultural Connectedness | 0.98196 | 0.01804 | 0.037321 | 13 | 0.0242195 | 15 | Similar |
| Indicator | A1 Sense | A2 Feel | A3 Think | A4 Act | A5 Relate | Rank |
|---|---|---|---|---|---|---|
| B1 Visual | 0.2534 | 1 | ||||
| B2 Auditory | 0.0986 | 2 | ||||
| B3 Tactile | 0.0592 | 6 | ||||
| B4 Comfort | 0.0655 | 4 | ||||
| B5 Enjoyment | 0.0395 | 11 | ||||
| B6 Immersion | 0.0672 | 3 | ||||
| B7 Authenticity | 0.0382 | 12 | ||||
| B8 Cognitive Value | 0.0453 | 9 | ||||
| B9 Information Quality | 0.0637 | 5 | ||||
| B10 Educational Value | 0.022 | 16 | ||||
| B11 Accessibility | 0.0574 | 7 | ||||
| B12 Interaction Quality | 0.0507 | 8 | ||||
| B13 Engagement | 0.044 | 10 | ||||
| B14 Personalization | 0.0312 | 14 | ||||
| B15 Social Interaction | 0.038 | 13 | ||||
| B16 Cultural Connectedness | 0.026 | 15 | ||||
| Level-1 Relative Weight | 0.4112 | 0.2104 | 0.131 | 0.1833 | 0.064 |
| Indicator | Case A | Case B | Case C | Case D | Case E |
|---|---|---|---|---|---|
| B1 | 0.146731 | 0.240088 | 0.253425 | 0.046704 | 2.50 × 10⁻⁵ |
| B2 | 0.01973 | 0.07889 | 0.09861 | 0.003954 | 1.00 × 10⁻⁵ |
| B3 | 0.04306 | 0.059206 | 0.055618 | 0.003594 | 6.00 × 10⁻⁶ |
| B4 | 0.0317 | 0.042265 | 0.065507 | 0.010571 | 7.00 × 10⁻⁶ |
| B5 | 0.026693 | 0.032031 | 0.039504 | 0.01068 | 4.00 × 10⁻⁶ |
| B6 | 0.037807 | 0.058807 | 0.067207 | 0.018907 | 7.00 × 10⁻⁶ |
| B7 | 0.012737 | 0.035374 | 0.038204 | 0.011322 | 4.00 × 10⁻⁶ |
| B8 | 0.0197 | 0.043335 | 0.045305 | 0.0197 | 5.00 × 10⁻⁶ |
| B9 | 0.030758 | 0.048331 | 0.063706 | 0.010989 | 6.00 × 10⁻⁶ |
| B10 | 0.014082 | 0.018482 | 0.022002 | 0.005282 | 2.00 × 10⁻⁶ |
| B11 | 0.031315 | 0.028706 | 0.057406 | 0.023488 | 6.00 × 10⁻⁶ |
| B12 | 0.028781 | 0.038373 | 0.050705 | 0.0233 | 5.00 × 10⁻⁶ |
| B13 | 0.026167 | 0.034491 | 0.044004 | 0.016653 | 4.00 × 10⁻⁶ |
| B14 | 0.020803 | 0.031203 | 0.031203 | 0.010403 | 3.00 × 10⁻⁶ |
| B15 | 0.016893 | 0.02217 | 0.038004 | 0.007393 | 4.00 × 10⁻⁶ |
| B16 | 0.014303 | 0.022103 | 0.026003 | 0.002603 | 3.00 × 10⁻⁶ |
| Game-Theoretic Combined Weights | Distance to Positive Ideal Solution () | Distance to Negative Ideal Solution () | Relative Closeness () | Rank |
|---|---|---|---|---|
| Case A | 0.157037 | 0.178941 | 0.532597 | 3 |
| Case B | 0.053162 | 0.291324 | 0.845677 | 2 |
| Case C | 0.003588 | 0.326099 | 0.989117 | 1 |
| Case D | 0.264521 | 0.070678 | 0.210854 | 4 |
| Case E | 0.32673 | 0 | 0 | 5 |
| Case A (Hunan) | ) | ) | ) | Rank |
| A1 Sense | 0.133666 | 0.154159 | 0.535601 | 2 |
| A2 Feel | 0.053103 | 0.057513 | 0.519936 | 3 |
| A3 Think | 0.042472 | 0.039139 | 0.479576 | 4 |
| A4 Act | 0.039847 | 0.054087 | 0.575799 | 1 |
| A5 Relate | 0.024136 | 0.02213 | 0.478313 | 5 |
| Case B (Shanghai) | ) | ) | ) | Rank |
| A1 Sense | 0.023807 | 0.259532 | 0.915979 | 1 |
| A2 Feel | 0.025973 | 0.086718 | 0.769519 | 3 |
| A3 Think | 0.015896 | 0.067485 | 0.809356 | 2 |
| A4 Act | 0.032654 | 0.066772 | 0.671575 | 4 |
| A5 Relate | 0.016307 | 0.031301 | 0.657482 | 5 |
| Case C (Zhejiang) | ) | ) | ) | Rank |
| A1 Sense | 0.003588 | 0.277536 | 0.987237 | 5 |
| A2 Feel | 0 | 0.108745 | 1 | 4 |
| A3 Think | 0 | 0.081202 | 1 | 2 |
| A4 Act | 0 | 0.093673 | 1 | 3 |
| A5 Relate | 0 | 0.046043 | 1 | 1 |
| Case D (Hubei) | ) | ) | ) | Rank |
| A1 Sense | 0.234064 | 0.046982 | 0.16717 | 5 |
| A2 Feel | 0.083092 | 0.026663 | 0.24293 | 3 |
| A3 Think | 0.060945 | 0.023161 | 0.275377 | 2 |
| A4 Act | 0.055518 | 0.038463 | 0.409262 | 1 |
| A5 Relate | 0.038531 | 0.007833 | 0.168947 | 4 |
| Case E (Nanjing) | ) | ) | ) | Rank |
| A1 Sense | 0.278277 | 0 | 0 | 5 |
| A2 Feel | 0.108745 | 0 | 0 | 4 |
| A3 Think | 0.081202 | 0 | 0 | 2 |
| A4 Act | 0.093673 | 0 | 0 | 3 |
| A5 Relate | 0.046043 | 0 | 0 | 1 |
| entropy weights | ) | ) | ) | Rank |
| Case A | 0.140402 | 0.13746 | 0.494706 | 3 |
| Case B | 0.056077 | 0.222285 | 0.798547 | 2 |
| Case C | 0.002514 | 0.266061 | 0.990641 | 1 |
| Case D | 0.206246 | 0.072117 | 0.259076 | 4 |
| Case E | 0.266441 | 0 | 0 | 5 |
| AHP Weights | ) | ) | ) | Rank |
| Case A | 0.162577 | 0.189344 | 0.53803 | 3 |
| Case B | 0.053367 | 0.308274 | 0.852432 | 2 |
| Case C | 0.003757 | 0.342446 | 0.989147 | 1 |
| Case D | 0.278574 | 0.072437 | 0.206367 | 4 |
| Case E | 0.343105 | 0 | 0 | 5 |
| average weights | ) | ) | ) | Rank |
| Case A | 0.121769 | 0.136526 | 0.528565 | 3 |
| Case B | 0.058073 | 0.206628 | 0.780608 | 2 |
| Case C | 0.003788 | 0.24908 | 0.98502 | 1 |
| Case D | 0.189885 | 0.070214 | 0.26995 | 4 |
| Case E | 0.25 | 0 | 0 | 5 |
| Metric | Shapiro–Wilk Test | Bartlett’s Test | Friedman/Consistency Test | Interpretation |
|---|---|---|---|---|
| All p > 0.05 | p = 0.870 | χ2 = 3.480, p = 0.323 | No significant difference | |
| All p > 0.05 | p = 0.862 | χ2 = 11.100, p = 0.011 | Significant difference | |
| All p > 0.05 | p = 0.999 | χ2 = 1.200, p = 0.753 | No significant difference | |
| Ranking | — | — | Spearman’s ρ = 1.000 Kendall’s W = 1.000 | Fully consistent ranking |
Disclaimer/Publisher’s Note: The statements, opinions and data contained in all publications are solely those of the individual author(s) and contributor(s) and not of MDPI and/or the editor(s). MDPI and/or the editor(s) disclaim responsibility for any injury to people or property resulting from any ideas, methods, instructions or products referred to in the content. |
© 2026 by the authors. Licensee MDPI, Basel, Switzerland. This article is an open access article distributed under the terms and conditions of the Creative Commons Attribution (CC BY) license.
Share and Cite
Dong, H.; Li, M.; Yang, Z.; Zhang, Y.; Bao, Z. A Multi-Criteria Decision-Making Framework for Evaluating Interactive Experience in Smart Museums. Information 2026, 17, 586. https://doi.org/10.3390/info17060586
Dong H, Li M, Yang Z, Zhang Y, Bao Z. A Multi-Criteria Decision-Making Framework for Evaluating Interactive Experience in Smart Museums. Information. 2026; 17(6):586. https://doi.org/10.3390/info17060586
Chicago/Turabian StyleDong, Hao, Muze Li, Zhengfeng Yang, Yunhao Zhang, and Zuowen Bao. 2026. "A Multi-Criteria Decision-Making Framework for Evaluating Interactive Experience in Smart Museums" Information 17, no. 6: 586. https://doi.org/10.3390/info17060586
APA StyleDong, H., Li, M., Yang, Z., Zhang, Y., & Bao, Z. (2026). A Multi-Criteria Decision-Making Framework for Evaluating Interactive Experience in Smart Museums. Information, 17(6), 586. https://doi.org/10.3390/info17060586