Article

From Screen to Scene: How Virtual Experiences Translate into Actual Destination Visits

1
College of Tourism, Hunan Normal University, 36 Lushan Road, Yuelu District, Changsha 410081, China
2
Department of Leisure Service and Sport, Paichai University, Daejeon 35345, Republic of Korea
*
Author to whom correspondence should be addressed.
Information 2026, 17(6), 530; https://doi.org/10.3390/info17060530
Submission received: 21 April 2026 / Revised: 22 May 2026 / Accepted: 23 May 2026 / Published: 28 May 2026

Abstract

While virtual tourism (VT) has emerged as a disruptive force in destination marketing, the mechanism by which virtual immersion translates into physical visitation remains debated. Addressing the “virtual-to-real” conversion gap, this study proposes an integrated theoretical framework combining the Stimulus–Organism–Response (SOR) model with the Technology Acceptance Model (TAM). Unlike traditional studies, we position Perceived Usefulness (PU) and Perceived Ease of Use (PEOU) as boundary conditions rather than direct antecedents. Empirical data were collected from 476 tourists with virtual experiences of Zhangjiajie National Forest Park and analyzed using Structural Equation Modeling (SEM). The results indicate that virtual experiences not only directly trigger visit intention but also indirectly foster it by enhancing destination attitude. Crucially, a novel “asymmetric moderation” effect was revealed: while technical attributes (PU and PEOU) do not influence the affective formation of attitude, they significantly moderate the translation of attitude and experience into behavioral intention. These findings suggest that while immersion drives “liking,” technical utility drives “going.” This study offers strategic insights for Destination Marketing Organizations (DMOs) to optimize VT platforms by balancing hedonic experience with functional utility to maximize actual visitor conversion.

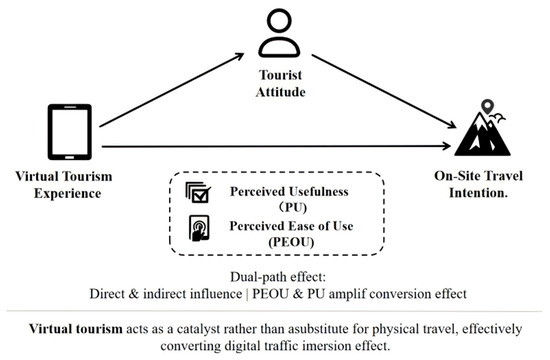
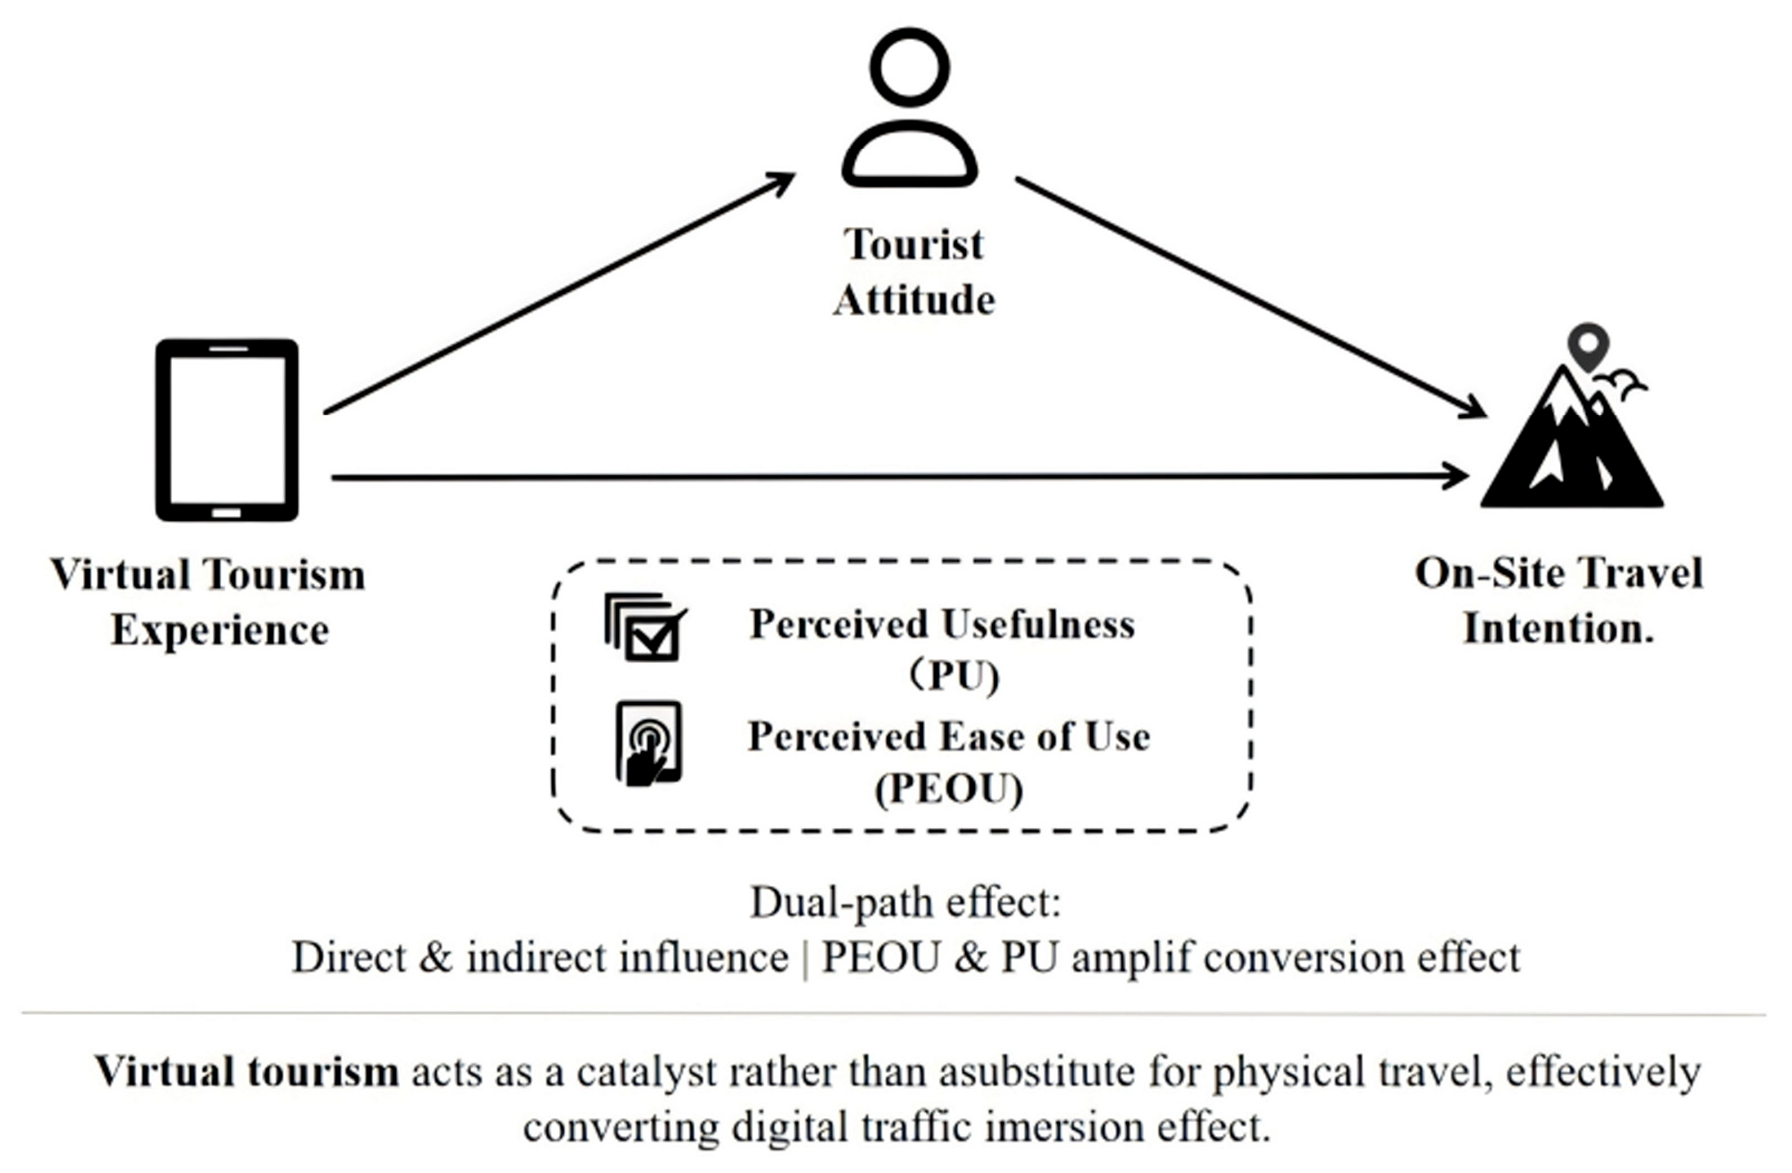
Graphical Abstract

1. Introduction

The global travel and tourism economy, which contributed a record USD 11.6 trillion to global GDP in 2025 [1] and saw international visitor spending reach an all-time high of USD 2.02 trillion [2], is increasingly embracing immersive technologies—such as Virtual Reality (VR), Augmented Reality (AR), and Metaverse platforms—to enhance accessibility, personalization, and sustainability. This digital shift has been accelerated by external disruptions, notably the COVID-19 pandemic, which curtailed physical mobility and positioned virtual tourism as a viable alternative [3,4]. Virtual Tourism Experiences (VTEs) enable users to engage with destinations remotely, offering sensory immersion unencumbered by geographical or temporal constraints [5,6]. However, while virtual tourism has undoubtedly expanded the boundaries of traditional travel, its role in shaping tourists’ attitudes and intentions toward actual physical visitation remains under-explored. While existing scholarship has largely scrutinized the technological architecture of the Metaverse and Extended Reality (XR) to enhance online engagement [7], empirical evidence regarding whether these disembodied experiences can bridge the digital divide to generate a “spillover effect” onto physical destinations remains scant and inconclusive [8]. In essence, it remains unclear whether immersive screen-based interactions merely offer online sensory gratification, or if they effectively foster emotional attachment to physical destinations and trigger actual visitation decisions—a “virtual-to-real” conversion path that is yet to be fully mapped in the literature.
The extant literature on tourism experience has long underscored the multi-sensory and emotional dimensions of physical travel, where direct interaction with landscapes and culture fosters satisfaction, loyalty, and behavioral intentions [9,10]. Conversely, VTEs reconstruct these interactions via digital means, influencing perceptions through factors such as accessibility, authenticity, and interactivity [11,12]. Studies grounded in the Stimulus–Organism–Response (SOR) framework elucidate how VTE stimuli trigger cognitive and emotional responses, leading to outcomes like destination attachment and visit intention [13,14]. Similarly, the Technology Acceptance Model (TAM) has been employed to explain adoption behaviors, highlighting Perceived Usefulness (PU) and Perceived Ease of Use (PEOU) as critical predictors [15,16]. Empirical findings suggest that favorable VTEs can enhance attitudes toward a destination and stimulate real-world travel desire [17,18]. For instance, in cultural heritage contexts, VR previews have been shown to outperform traditional media in boosting engagement and visitation intent [19,20].
Notwithstanding these advancements, a significant gap persists in understanding the underlying mechanisms linking VTE to physical travel intention. A prevailing concern in earlier research was that high-quality virtual substitutes might cannibalize the motivation for physical travel; however, recent empirical evidence posits that, under specific conditions, virtual tourism actually functions as a “complement,” serving as an effective pre-experience tool that ignites the desire for on-site visits [8]. Yet, the current literature often fails to explain how this conversion occurs. Specifically, how tourists process sensory data in virtual environments and encode it into real-world behavioral drivers via psychological mechanisms—such as “happiness forecasting”—remains inadequately explained [5,8].
Consequently, this study advocates for an integrative perspective. Recognizing VTE as inherently a “technology-mediated environmental experience,” a single theoretical lens is insufficient to capture its complexity. While the SOR model effectively explains how environmental stimuli trigger emotional shifts [13], it shows limitations in accounting for the rational evaluation users apply when facing complex technical systems. We attempt to organically synthesize TAM with SOR: positioning the virtual scene as the environmental “Stimulus” (S), the tourist’s attitude as the psychological “Organism” (O), and the intention to visit physically as the “Response” (R). Crucially, rather than treating Perceived Usefulness (PU) and Perceived Ease of Use (PEOU) merely as independent antecedents, we introduce them as critical boundary conditions. We posit that a tourist’s rational assessment of the technology (i.e., system usability and information utility) moderates the efficiency with which sensory experiences translate into attitude formation. As noted by Dwivedi et al. [7] in the context of Metaverse marketing, technological features are deeply intertwined with consumer experience; absent practical value or faced with high interaction barriers, mere immersion may fail to translate into sustained positive behavior. Through this integration, we aim to construct a comprehensive model of “Experience—Attitude—Intention—Technology Perception Moderation.”
Theoretically, this study demystifies the “virtual-to-reality” transition mechanism, offering hypotheses on how technological perceptions amplify or attenuate behavioral outcomes. From a managerial standpoint, the findings offer critical insights for destination marketers. Specifically, this research reveals how to move beyond mere visual spectacle to optimize the functionality (enhancing usefulness) and usability of VTE platforms, thereby precisely converting the massive volume of virtual traffic into physical footfall. This not only addresses industry skepticism regarding whether “virtual experience yields real-world returns” [5] but also provides strategic support for tourism recovery and the sustainable digital management of destinations.

2. Theoretical Background and Hypotheses

2.1. Virtual Tourism Experience

Tourism experience, a central tenet of tourism scholarship, is undergoing a continuous evolution in both connotation and form, driven by rapid innovations in digital technology [21,22]. Traditionally, the essence of tourism experience has been anchored in corporeal presence—the individual’s direct, multi-sensory interaction with a destination’s cultural landscapes and natural environments, which fosters sensory pleasure, emotional resonance, and meaning-making [10,23]. However, in the wake of digitalization, Virtual Tourism Experience (VTE) has emerged as a novel paradigm. By leveraging immersive technologies such as Virtual Reality (VR), Augmented Reality (AR), and Mixed Reality (MR), VTE enables users to achieve sensory and emotional immersion, transcending geographical and temporal limitation [5,24,25].
Far from being a mere substitute for traditional travel, VTE reconstructs and extends it through immersive technology. It not only expands the boundaries of tourism but also demonstrates broad application potential across domains such as cultural heritage, destination marketing, and mental health interventions. For instance, Yin and Huang, utilizing the MEC and Kano models, identified 29 distinct attributes of virtual tourism. They highlighted “convenience” as a core value and clarified how different attributes exert differential impacts on user satisfaction [11]. Furthermore, VTE is influenced by factors including information quality, technology acceptance, and emotional engagement, all of which significantly shape tourist attitudes and behavioral intentions [12].
From a theoretical perspective, the Technology Acceptance Model (TAM) is frequently employed to explain the adoption behaviors associated with virtual tourism technologies. Teng et al. examined how personal innovativeness influences consumers’ intention to participate in VR tourism, mediated by factors within the AIDA and TAM frameworks, such as interest, Perceived Usefulness (PU), Perceived Ease of Use (PEOU), attitude, and desire [15]. Similarly, Bilynets, applying the UTAUT2 model, confirmed a marked discrepancy between user acceptance and willingness to pay for VTEs; while tourists generally exhibit a strong intent to use these technologies, actual paying behavior remains low [26].
Regarding behavioral mechanisms, the Stimulus–Organism–Response (SOR) model has become a dominant analytical framework. Research grounded in SOR theory indicates that VTE attributes—such as accessibility, authenticity, and interactivity—can foster pro-environmental behaviors in cultural heritage tourism by shaping tourist attitudes [14]. Exploring consumer behavior in VR tourism, Kim and Lee also found that authentic experiences in VR can trigger cognitive and emotional responses, which in turn influence destination attachment and ultimately enhance visitation intention [13].
Moreover, virtual tourism exhibits positive effects in providing escapism, stress relief, and psychological restoration, thereby showcasing its therapeutic potential. Zhong et al. demonstrated that long-term engagement with virtual tourism can serve as a non-invasive intervention [27]. By satisfying basic psychological needs for autonomy, competence, and relatedness, it helps alleviate symptoms in patients with depression and promotes recovery.
Despite lingering debates regarding issues such as authenticity, device dependency, and the deficit of social interaction [28,29], the consensus in current scholarship affirms VTE as an effective complement to physical tourism. It continues to drive the digital transformation and experiential innovation of the tourism industry in the digital age.

2.2. Hypothetical Relationships

2.2.1. The Relationship Between VTE, Travel Attitude and On-Site Travel Intention

Travel attitude refers to the psychological predisposition—whether positive or negative—that a tourist holds toward a specific destination [30]. Virtual Tourism Experience (VTE) has been empirically established as a critical antecedent in shaping these destination attitudes. Influenced by factors such as information quality, technology acceptance, and emotional engagement, VTE exerts a significant impact on both tourist attitudes and subsequent behavioral intentions [12]. For instance, Kim and Ko observed that positive VR experiences significantly enhance attitudes toward both the destination and VR tourism itself [31]. Wan et al. further elaborated that the immersion and perceived value derived from VR experiences actively mold tourist attitudes [32]. This causal pathway has been robustly validated across diverse contexts, including virtual religious tourism [17] and cultural heritage tourism [33].
On-site travel intention, a construct intrinsically linked to planning and decision-making [6], is defined in this study as the tourist’s inclination or plan to physically visit a real-world destination following a VTE. Tourist attitude is widely recognized as the most direct and stable psychological mechanism driving this intention. As a comprehensive evaluative disposition encompassing cognitive, affective, and behavioral components [34,35], attitude serves as the core transmission bridge linking external stimuli (e.g., virtual experiences) to behavioral intentions (e.g., physical visitation). Empirical studies confirm that tourist attitude plays a pivotal role—either as a key mediator or a direct driver—in the pathway from VTE to on-site travel intention [12,36].
Specifically, within the context of Islamic religious tourism, Alkhalifah et al. found that VR experiences, by heightening telepresence and perceived value, fostered positive attitudinal shifts toward the destination, which in turn significantly and positively influenced actual travel intentions [17]. Similarly, Talawar et al. demonstrated that VR preview modes, by enhancing customer engagement, significantly outperformed traditional previews (such as static images or basic 360-degree tours) in boosting positive attitudes and visitation intent [18]. In the context of Hanok (traditional Korean house) tourism, Lee also pinpointed that a positive attitude is the crucial link that effectively translates experiential value into future revisit intentions [20].
Furthermore, VR technology can directly ignite interest in exploring real-world destinations by creating highly realistic sensory environments that generate a strong sense of presence. Tussyadiah et al. showed that the telepresence generated in VR environments significantly strengthens users’ on-site visitation intentions [37]. By fostering emotional connections and a sense of belonging, VTE also acts as a direct stimulus for physical travel [22]. Zheng et al. found that the digital presentation of cultural heritage can spark tourists’ imagination, directly elevating their willingness to explore the site physically [33]. From the perspective of Cognitive Appraisal Theory, Song and Lu examined tourist responses to VTE, with results supporting the notion that VR usage directly influences behavioral intentions [36].
This study primarily investigates the impact of VTE and travel attitude on on-site travel intention, aiming to bridge the gap in understanding the “virtual-to-real” attitudinal shift and its subsequent effect on physical travel behavior. Based on the theoretical relationships delineated above, we propose the following hypotheses:
Hypothesis 1.
VTE has a significant positive effect on tourist attitude.
Hypothesis 2.
Tourist attitude has a significant positive effect on on-site travel intention.
Hypothesis 3.
VTE has a significant positive direct effect on on-site travel intention.

2.2.2. The Moderating Role of Perceived Usefulness and Perceived Ease of Use

The Technology Acceptance Model (TAM) has been extensively applied to elucidate tourist attitudes and behaviors toward virtual tourism [16,38,39]. At the core of TAM lie two pivotal constructs: Perceived Usefulness (PU), defined as “the degree to which a person believes that using a particular system would enhance his or her job performance,” and Perceived Ease of Use (PEOU), defined as “the degree to which a person believes that using a particular system would be free of effort” [40]. If tourists perceive that virtual tourism technologies can simplify travel planning, enhance efficiency, or enrich the experience—while being effortless to operate—they are more likely to harbor positive attitudes, develop usage intentions, and ultimately adopt the technology [15,41]. Sinha et al. [41] noted that both PEOU and PU positively influence attitudes toward using VR tourism, which subsequently drives the behavioral intention to engage in VR tourism. Similarly, Yang et al. [42] confirmed that ease of use and usefulness significantly impact consumers’ willingness to adopt virtual tourism technologies. Notably, El-Said and Aziz found that PU not only exerts a significant direct effect on the intention to adopt virtual tourism but also moderates the relationship between adoption intention and actual visitation propensity [43]. Prados-Castillo, analyzing willingness to pay (WTP) for immersive virtual tourism, observed that while PU significantly boosted WTP, PEOU’s effect was nuanced, often diminishing WTP due to the influence of prior gaming experience [44].
Multiple studies have validated the utility of PU and PEOU as moderating variables across various domains. Giachino verified the moderating role of PU in the relationship between esports motivations and reward-based crowdfunding behavior [45]. Mensah confirmed that PU significantly moderates the link between internet trust and e-government usage intention [46]. Likewise, Al-Gasawneh et al. demonstrated that both PEOU and PU serve as significant moderators in the relationship between Mobile Customer Relationship Management (M-CRM) adoption and post-purchase behavior [47]. However, within the specific context of virtual tourism, the moderating roles of PU and PEOU remain largely underexplored.
In the realm of virtual tourism, the moderating functions of PEOU and PU are of paramount importance. They are not static constants; rather, they dynamically condition user experiences, attitudes, and behavioral intentions based on technological attributes, user characteristics, and usage contexts. We posit that the technical characteristics (ease of use) and utilitarian value (usefulness) of the experience are necessary conditions for effectively translating telepresence into behavioral intention. Specifically, when tourists perceive a VTE as highly useful, the positive attitude toward the destination formed during the virtual experience is likely to be more robust, thereby increasing the probability of its conversion into on-site travel intention. Conversely, if perceived usefulness is low, even a highly immersive VTE may fail to ignite positive attitudes or subsequent behaviors. Similarly, PEOU moderates the impact of VTE on attitudes and intentions: when interaction is seamless, tourists can more easily immerse themselves in and enjoy the VTE, thereby strengthening their emotional connection to the destination and their desire to visit physically. In contrast, complex operations or technical glitches can attenuate the positive effects of VTE, dampening the intention to travel on-site. Therefore, identifying and understanding these moderating mechanisms not only theoretically reveals the boundary conditions of TAM within immersive experiences but also provides practical guidance for product optimization—such as simplifying workflows for usability-sensitive users or deepening content value for utility-driven scenarios—thereby precisely enhancing user experience and promoting the effective adoption and sustained use of virtual tourism services.
Based on the foregoing discussion, we propose the following hypotheses:
Hypothesis 4.
PU significantly moderates the relationship between VTE and tourist attitude.
Hypothesis 5.
PEOU significantly moderates the relationship between VTE and tourist attitude.
Hypothesis 6.
PU significantly moderates the relationship between tourist attitude and on-site travel intention.
Hypothesis 7.
PEOU significantly moderates the relationship between tourist attitude and on-site travel intention.
Hypothesis 8.
Perceived Usefulness significantly moderates the relationship between VTE and on-site travel intention.
Hypothesis 9.
PEOU significantly moderates the relationship between VTE and on-site travel intention.

2.3. Research Model

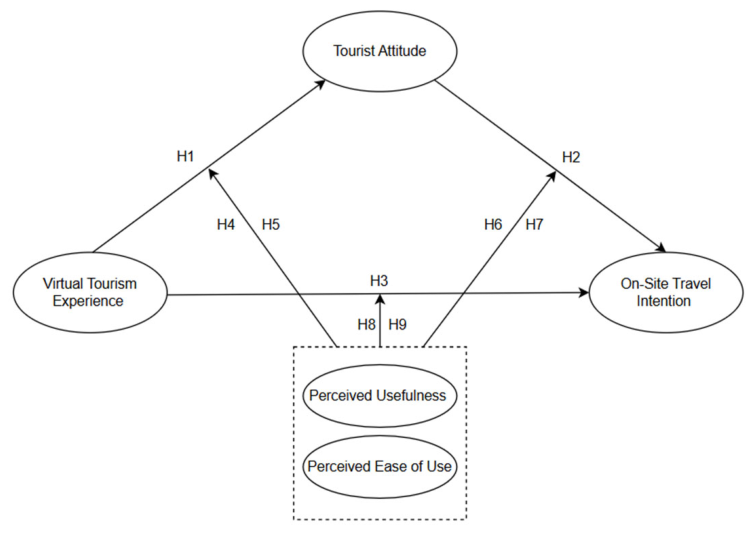
Building upon the hypothesized direct relationships among VTE, tourist attitude, and on-site travel intention (H1, H2, H3), and integrating the moderating roles of Perceived Usefulness and Perceived Ease of Use within these pathways (H4–H9), this study proposes the theoretical model illustrated below (Figure 1):

3. Methodology

3.1. Study Site

The study focuses on Zhangjiajie, a UNESCO World Natural Heritage site located in the northwest of Hunan Province, China. Renowned for its rare quartz sandstone peak forest landforms, its core scenic areas include Wulingyuan, Tianmen Mountain, and the Grand Canyon Glass Bridge. In recent years, Zhangjiajie has accelerated its digital transformation, actively integrating virtual technologies to create immersive smart tourism experiences. As a pioneer in “virtual–real fusion” tourism, the destination has launched numerous virtual tourism projects. Notably, Zhangjiajie has successfully constructed a comprehensive smart tourism platform featuring functionalities such as “One Mobile for Tour” and “One Screen for Management,” achieving systematic data integration and upgrading immersive experiences. Furthermore, in 2023, Zhangjiajie unveiled the nation’s first scenic metaverse experience hall (available at: https://www.zjjnews.cn/zt/2023metaverse/ & https://b23.tv/I6fh5ad, accessed on 25 September 2025), leveraging digital technology to forge a novel “Technology + Tourism” model. Through virtual IPs and interactive scene design, the site offers tourists a seamless blend of virtual and physical exploration, propelling the digital transformation of the tourism industry. Looking ahead, Zhangjiajie plans to further integrate metaverse concepts, developing additional interactive features to continuously enhance tourist immersion and engagement.

3.2. Measurement

A survey questionnaire was designed referencing prior literature and tailored to the specific context of Zhangjiajie’s virtual tourism. All items were measured using a 5-point Likert scale, ranging from 1 (“strongly disagree”) to 5 (“strongly agree”). The questionnaire comprised two main sections. The first section collected demographic information, including gender, age group, education level, monthly income, occupation, and prior experience with virtual tourism. The second section contained measurement scales for the study’s constructs, adapted from established domestic and international scales to suit the current research context. The instrument included 21 items covering five constructs: Virtual Tourism Experience (VTE) (6 items, adapted from Song & Lu [36]; Jiang et al. [48]; Luo & Xia [49]); Tourist Attitude (4 items, adapted from Sinha et al. [25]; Qiu et al. [50]); On-site Travel Intention (4 items, adapted from Song & Lu [36]; Wang et al. [51]); Perceived Ease of Use (PEOU) (3 items, adapted from Sinha et al. [41]; Qiu et al. [50]); and Perceived Usefulness (PU) (4 items, adapted from Sinha et al. [41]; Giachino et al. [45]; Li et al. [52]).

3.2.1. Pilot Test

To assess the validity and reliability of the questionnaire, a pilot study was conducted prior to the main survey. With participants’ consent, the pre-test was administered in a classroom setting in September 2025. A total of 56 university students were recruited as the initial sample. The procedure was as follows: participants first watched a video showcasing a virtual tour of Zhangjiajie (https://b23.tv/I6fh5ad, accessed on 25 September 2025) and subsequently completed the questionnaire based on their viewing experience. Of the 58 questionnaires collected, 2 invalid responses (e.g., incomplete answers) were excluded, resulting in 56 valid responses and an effective response rate of 96.6%. The sample consisted of 48.2% males (N = 27) and 51.8% females (N = 29).
Reliability and validity tests were performed on the valid data. Reliability was assessed using Cronbach’s α coefficient. The overall Cronbach’s α for the questionnaire was 0.738, with subscale coefficients of 0.912, 0.834, 0.760, 0.861, and 0.867, respectively. All values exceeded the recommended threshold of 0.70, indicating excellent internal consistency. Validity was examined via exploratory factor analysis (EFA). The Kaiser–Meyer–Olkin (KMO) measure of sampling adequacy was 0.714, and Bartlett’s test of sphericity was significant (χ2 = 668.753, df = 210, p < 0.001), confirming that the data were suitable for factor analysis. The results of the pilot study demonstrated that the measurement instrument possessed good reliability and validity.

3.2.2. Data Collection and Analysis

This study employed an online survey approach, distributing questionnaires via the “Wenjuanxing” platform (www.wjx.cn) to tourists who had experienced virtual tours of Zhangjiajie. A total of 520 questionnaires were distributed. After rigorously screening the data and excluding 44 invalid responses characterized by short completion times (less than 90 s) or logical inconsistencies, 476 valid questionnaires were retained for analysis, yielding an effective response rate of approximately 91.54%.

4. Results

4.1. Descriptive Analysis

The demographic profile of the respondents reveals a relatively balanced gender distribution, with males accounting for 47.7% and females for 52.3%. The age structure was dominated by the 19–30 age group (43.9%), followed by the 30–50 age group (31.7%), suggesting that young and middle-aged adults exhibit higher interest in and receptivity toward virtual tourism. Regarding educational attainment, the majority of respondents held a college or university degree (41.2%), indicating a generally high level of education among the sample. In terms of monthly income, the largest segment earned between CNY 6000 and CNY 8000 (24.6%), while those earning CNY 4000–6000 and below CNY 2000 represented similar proportions, each accounting for approximately 20%. Occupationally, students constituted the largest group (21.8%), closely followed by freelancers (19.3%) (Table 1).
As shown in Table 2, the mean scores of all 21 measurement items ranged from 3.29 to 4.37 (on a 5-point scale), with standard deviations between 0.70 and 1.57. No significant gender-based differences were observed; male and female respondents reported similar mean values across all items (differences generally < 0.15). Regarding age groups, respondents aged 19–30 years tended to have slightly higher mean scores on most items (e.g., VTE1 = 4.10, PU2 = 3.95) compared to those under 18 or over 50, whereas the under-18 group showed somewhat larger variability (SD up to 1.57 for PU4). Overall, the pattern of means and standard deviations suggests that the data are well-behaved, with no extreme floor/ceiling effects or systematic group biases, supporting the validity of subsequent structural equation modeling analyses.

4.2. Reliability and Validity Analysis

As presented in Table 3, all factor loadings exceeded the threshold of 0.5. The Kaiser–Meyer–Olkin (KMO) values for Virtual Tourism Experience, Tourist Attitude, On-site Travel Intention, and Perceived Ease of Use were all above 0.8, while Perceived Usefulness fell within the acceptable range of 0.6 to 0.7, indicating satisfactory structural validity and suitability for factor analysis. regarding reliability, the Cronbach’s Alpha coefficient for each construct surpassed 0.7, demonstrating good internal consistency reliability for the measurement scale.
Furthermore, the Composite Reliability (CR) values for all latent variables exceeded 0.70, indicating robust internal consistency across constructs [53]. Regarding convergent validity, the Average Variance Extracted (AVE) values for most constructs were above the 0.50 threshold [54]. Although the AVE for Virtual Tourism Experience was slightly below 0.50, it remains acceptable given that its CR value was high (>0.60), as suggested by Malhotra and Dash [55]. Moreover, in exploratory research contexts, an AVE greater than 0.36 is often considered a marginally acceptable standard.

4.3. Hypothesis Testing

4.3.1. Structural Model Evaluation

This study utilized AMOS 28.0 to test the structural equation model depicted in Figure 1. The model fit indices were evaluated as follows: The ratio of Chi-square to degrees of freedom (χ2/df) was 1.428 (df = 186), which falls within the ideal range. Both RMR (0.03) and RMSEA (0.030) were well below the stringent threshold of 0.08. Additionally, the incremental fit indices—GFI (0.969), RFI (0.946), NFI (0.956), IFI (0.986), CFI (0.986), and TLI (0.983)—all exceeded the minimum recommended cutoff of 0.90. Collectively, these results indicate that the measurement model exhibits an excellent overall goodness of fit (Table 4).

4.3.2. Path Analysis

The Maximum Likelihood (ML) estimation method in AMOS 28.0 was employed to estimate the parameters of the structural equation model. The results of the hypothesis testing are presented in Table 5. Hypotheses H1, H2, and H3 are all supported.
As shown in Table 5, the path coefficient from Virtual Tourism Experience (VTE) to Tourist Attitude (ATT) was 0.706 (S.E. = 0.083, C.R. = 8.472, p < 0.001), indicating a strong positive relationship. This suggests that for every one-unit increase in VTE quality, tourist attitude improves by 0.706 standard deviations, holding other factors constant. The critical ratio (C.R.) exceeding 1.96 confirms statistical significance at the 0.05 level.
The direct effect of VTE on On-site Travel Intention (INT) was 0.288 (S.E. = 0.079, C.R. = 3.63, p < 0.001), which is modest but significant. This implies that virtual experiences directly contribute to visitation intention beyond their indirect influence through attitude.
The path from Tourist Attitude to On-site Travel Intention was the strongest among the three, with a coefficient of 0.572 (S.E. = 0.067, C.R. = 8.5, p < 0.001). This underscores the centrality of attitudinal shifts as the primary psychological mechanism translating virtual experiences into behavioral outcomes.

4.4. Moderation Analysis

The moderating roles of Perceived Ease of Use (PEOU) and Perceived Usefulness (PU) were examined using the SPSS PROCESS 4.1 macro. Given the high reliability of the items for each variable, the average scores of the items for each latent construct served as their observed values for this analysis.
Table 6 details the results of the moderation analysis for PEOU within the “VTE–Attitude–Intention” framework. Model 1 tested the moderating effect of PEOU on the relationship between VTE and tourist attitude. The interaction term between VTE and PEOU was not statistically significant (β = 0.0408, p = 0.4518), indicating that PEOU does not moderate the impact of VTE on tourist attitude.
Conversely, Model 2 examined the moderating effect of PEOU on the relationship between tourist attitude and on-site travel intention. The interaction term was significantly positive (β = 0.084, p < 0.05). The positive coefficient suggests that as the level of “ease of use” increases, the positive predictive power of tourist attitude on on-site travel intention strengthens. This confirms that PEOU significantly and positively moderates the attitude–intention relationship. Similarly, the analysis revealed a significant moderating effect of PEOU on the direct relationship between VTE and on-site travel intention (β = 0.1578, p < 0.05). The R2 values for these models (0.3623 and 0.2899, respectively) suggest moderate explanatory power.
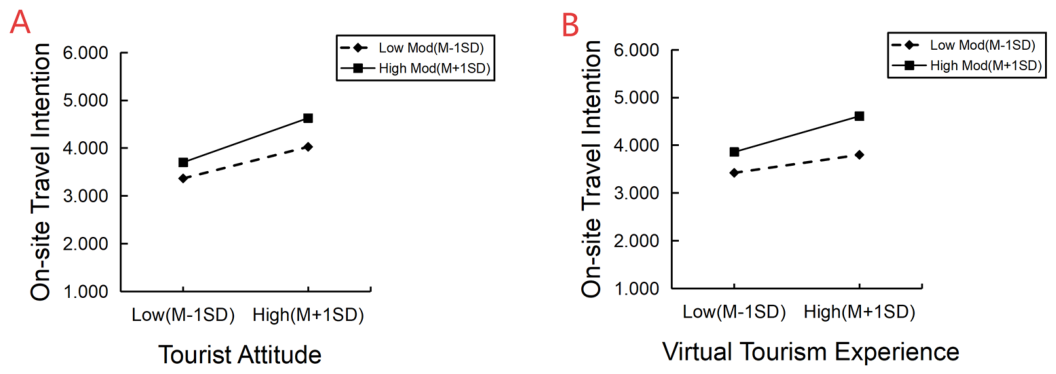
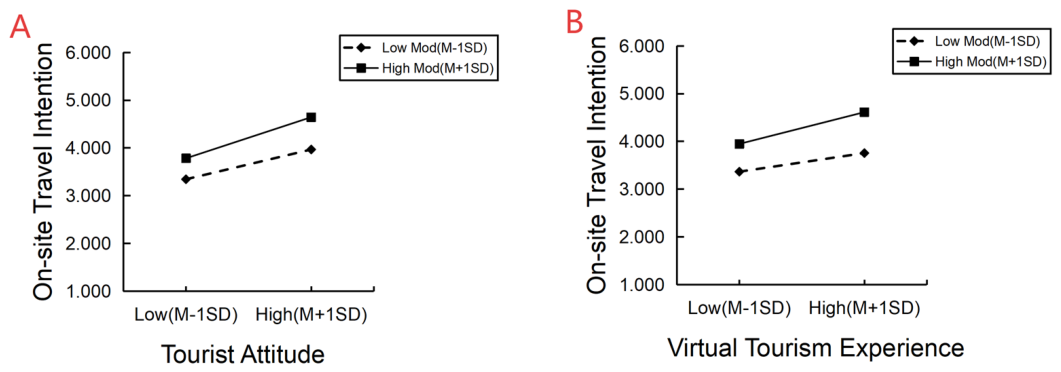
To visualize the pattern of these moderating effects, simple slope analyses were conducted and plotted (see Figure 2A,B). The results demonstrate that PEOU significantly moderates the relationship between tourist attitude and on-site travel intention. Specifically, at high levels of PEOU (M + 1SD), tourist attitude exerts a strong positive influence on intention. However, at low levels of PEOU (M − 1SD), while the influence of attitude remains significant, its magnitude is markedly attenuated. This finding indicates that high perceived ease of use amplifies the promotional effect of positive attitudes on behavioral intention, thereby supporting our hypothesis of positive moderation. A similar pattern was observed for the moderating effect of PEOU on the VTE–intention relationship.
Table 7 presents the moderation analysis for PU within the research framework. The results from Models 4, 5, and 6 indicate that PU does not significantly moderate the relationship between VTE and tourist attitude (β = 0.013, p = 0.7996). However, PU plays a significant positive moderating role in the relationship between tourist attitude and on-site travel intention (β = 0.0737, p < 0.05), as well as in the direct relationship between VTE and on-site travel intention (β = 0.129, p < 0.05). The R2 for the PU-moderated Tourist Attitude → On-site travel intention model was 0.3805, slightly higher than that of PEOU, indicating that perceived usefulness explains slightly more variance in the attitude intention link.
To further elucidate the nature of PU’s moderating effects, simple slope plots were generated (see Figure 3A,B). The analysis reveals that PU significantly moderates the relationship between VTE and on-site travel intention. Specifically, when perceived usefulness is high (M + 1SD), VTE has a robust positive impact on on-site travel intention. In contrast, when perceived usefulness is low (M − 1SD), although VTE still significantly predicts intention, its predictive strength is substantially weakened. This result supports the hypothesis that PU acts as a positive moderator. By the same token, PU was found to significantly and positively moderate the relationship between tourist attitude and on-site travel intention.
To provide a clear and unequivocal overview of all hypothesis testing results, including both direct and moderating effects, we present Table 8 below.
As shown in Table 8, H1, H2, and H3 are all supported, confirming the direct and indirect paths from VTE to on-site travel intention via tourist attitude. H4 and H5 are not supported, indicating that neither PU nor PEOU moderates the relationship between VTE and tourist attitude. In contrast, H6 through H9 are all supported, demonstrating that both PU and PEOU significantly moderate the attitude–intention relationship as well as the direct VTE–intention relationship.

5. Conclusions, Discussion and Implications

5.1. Conclusions

Situating the inquiry within the context of virtual tourism in Zhangjiajie, this study addresses a pivotal question in the digital tourism era: How do tourists’ virtual experiences on screens effectively translate into physical footprints at the destination? To this end, we constructed an analytical framework encompassing “Virtual Tourism Experience (VTE)—Tourist Attitude—On-site Travel Intention” and integrated Perceived Ease of Use (PEOU) and Perceived Usefulness (PU) into the model. This approach attempts to unravel the underlying logic bridging online virtual engagement and offline physical visitation from the dual perspectives of psychological response and technological experience.
The findings reveal that virtual tourism experiences significantly enhance tourists’ overall attitude toward the virtual tour, and a more positive attitude, in turn, markedly strengthens the intention to visit Zhangjiajie in person. Moreover, VTE not only exerts an indirect effect via the psychological nexus of attitude but also has a significant direct positive impact on on-site travel intention. This suggests that virtual tourism plays a dual role—serving both as a “pre-experience” simulation and an “interest-arousing” catalyst.
Further analysis indicates that while PEOU and PU do not significantly alter the initial impact of virtual experience on attitude itself, they significantly amplify the conversion of both virtual experience and positive attitude into actual visitation intention. Specifically, when tourists perceive the system as effortless to use and the information as highly utilitarian, their favorable experiences and attitudes in the virtual environment are more likely to crystallize into tangible travel plans and behavioral intentions. Collectively, these findings directly respond to the core research question posited at the outset, offering clear empirical evidence on how virtual tourism can effectively drive the conversion of digital traffic into real-world tourist arrivals.

5.2. Discussion

First, this study verifies the validity of the “VTE–Attitude–Intention” transmission path, which is consistent with existing VR tourism research conclusions that immersion, telepresence, and authenticity can significantly enhance destination evaluation and subsequently influence behavioral intentions [13,37,56]. By focusing on the psychological conversion process from “online pre-experience” to “offline visitation,” this study provides destination-level evidence—often scarce in existing literature—on how virtual experiences tangibly drive real-world tourist flows. This echoes recent scholarly calls to view virtual tourism as a pivotal tool for destination marketing and experience design [57,58,59].
Second, diverging from the majority of technology acceptance studies that treat Perceived Ease of Use (PEOU) and Perceived Usefulness (PU) merely as direct antecedents of behavioral intention, this research operationalizes them as critical boundary conditions moderating the translation of VTE into attitude, and attitude into on-site intention. The findings suggest that the two technological perception factors are key boundary conditions for virtual tourism experience conversion. The usability and practicality of virtual tourism systems do not change tourists’ intuitive perception of virtual experiences, but determine whether positive experiences and attitudes can be finally transformed into travel behaviors. This explains the contextual differences in tourists’ psychological and behavioral responses facing the same virtual tourism content, making up for the deficiency of linear causal assumptions in classic TAM in virtual tourism scenario research. Third, our conclusions regarding the relationship between virtual and physical tourism lend support to specific strands of existing literature. On one hand, our results corroborate the view that “virtual tourism is a catalyst for, rather than a substitute for, physical travel.” In this study, virtual tourism significantly strengthened tourists’ emotional identification with and anticipation of visiting the destination, aligning with research highlighting VR’s capacity to enhance destination attractiveness through telepresence and enjoyment [37,57,60]. On the other hand, while some scholars have posited that immersive virtual tourism might lead to “addiction” or a sense of “temporary detachment,” potentially reducing real-world travel motivation in certain contexts [61], this study did not observe any significant substitution effect. This discrepancy likely stems from differences in context and design objectives, indicating that the behavioral impact of virtual tourism has obvious heterogeneity and cannot be generalized.
From a holistic theoretical perspective, this study realizes the organic combination of SOR model and extended TAM. Taking VTE as external stimulus, tourist attitude as internal psychological organism, and on-site intention as behavioral response, and embedding PEOU and PU as contextual moderating factors, it constructs a more systematic multi-dimensional theoretical model. This integration resonates with Kim et al. [13], who utilized an extended SOR model to explain the “Authentic Experience–Cognitive/Affective Response–Visitation Intention” pathway in VR tourism. However, our study goes a step further by explicitly incorporating technological perception boundary conditions, revealing the differential mechanism of technological experience on tourists’ psychological–behavioral conversion, and improving the explanatory power of relevant theoretical models in smart tourism scenarios.

5.3. Implications

5.3.1. Theoretical Implications

First, this study consolidates and expands the theoretical path of virtual tourism behavioral research. It systematically verifies the dual mediating and direct driving mechanism of tourist attitude between virtual experience and on-site travel intention, supplements scarce destination-level empirical evidence for the theory that virtual tourism drives offline tourist flow, and responds to the latest academic advocacy of taking virtual tourism as a core tool for destination marketing and experience design.
Second, it optimizes and expands the application boundary of the Technology Acceptance Model in tourism research. This study transforms the traditional linear causal chain of “PEOU–PU–Intention” into a contextual regulatory mechanism, clarifying the moderating amplification effect of technological perception in the virtual experience conversion process. This theoretically complements the Technology Acceptance Model (TAM) in two ways: (1) It extends the classic “PEOU–PU–Intention” causal chain into a regulatory mechanism, offering experience-based evidence for the discussion on contextual and social influence factors within the extended TAM [62]; and (2) it responds to recent calls in virtual and smart tourism research for integrating experiential and technological variables, incorporating virtual experience and technology perception into a unified framework [63,64,65].
Third, it refines the theoretical cognition of the relationship between virtual tourism and physical tourism. This study clarifies the complementary catalytic relationship between the two, and explains the generation mechanism of virtual tourism’s non-substitution effect based on scenario and design differences. It proposes that future research needs to classify and discuss different types of virtual tourism (marketing-oriented, experience-oriented, entertainment-oriented, etc.) to avoid overgeneralization of research conclusions, which provides a new theoretical perspective for follow-up related research.
Fourth, it innovates the integrated application of SOR and TAM theories in virtual tourism scenarios. The constructed “Experience–Attitude–Intention–Technology Perception Moderation” composite model breaks the single theoretical research framework of existing literature, and provides a universal structural template for future smart tourism and metaverse tourism research that integrates experience theory and technology adoption theory. In addition, this study discovers the dual attribute of PEOU and PU as both antecedent variables and moderating variables, reminding subsequent studies to shift from linear influence thinking to multi-path contextual influence thinking in technological perception modeling, so as to more accurately restore tourists’ psychological decision-making mechanism in digital tourism scenarios.

5.3.2. Practical Implications

From a practical standpoint, the findings underscore that virtual tourism should not be dismissed simply as “esthetically pleasing promotional videos.” Rather, it can be consciously engineered as a strategic “pre-experience tool” designed to drive physical traffic to the destination.
First, for destination managers and scenic spot operators, virtual tourism should be leveraged as a “foot-in-the-door” pre-experience.
Our study demonstrates that virtual experiences can directly boost on-site visitation intentions while also exerting an indirect positive effect by improving attitudes toward the destination. Consequently, cultural and tourism departments should move beyond static “panoramic displays.” Instead, they should curate story-driven and situational virtual content centered on core landscapes and key products. Crucially, functionalities such as ticket booking and itinerary recommendations should be seamlessly embedded within these experiences, guiding tourists naturally from online engagement to offline travel decision-making.
Second, for virtual tourism platforms and technology developers, equal emphasis must be placed on esthetics (“good-looking”) and functionality (“easy to use” and “useful”).
The results indicate that Perceived Ease of Use and Perceived Usefulness significantly amplify the conversion of virtual experiences and positive attitudes into on-site travel intentions. In practice, developers should lower the barrier to entry by ensuring simplified interfaces, clear navigation, and system stability. Simultaneously, they should provide information that genuinely aids travel planning—such as recommended routes, optimal visiting times, crowd levels, and safety tips. By making the virtual experience both entertaining and decision-supportive, platforms can effectively enhance the conversion rate from virtual users to actual visitors.
Third, for regional administrators and policymakers, virtual tourism should be integrated into the toolkit for destination governance and coordinated regional development.
For popular destinations, virtual tourism serves a dual purpose: stimulating interest while also guiding and dispersing tourist flows. For instance, virtual previews and reservation mechanisms can help alleviate peak congestion and environmental pressure. Furthermore, governments can establish regional virtual tourism platforms to provide a unified digital showcase for smaller scenic spots and surrounding rural areas. This allows these lesser-known destinations to enter tourists’ cognitive maps and consideration sets even before they possess large-scale reception capabilities, thereby creating conditions for future tourist inflow and synergistic regional development.

5.4. Limitations and Future Research

While this study sheds light on the mechanisms linking Virtual Tourism Experience, Tourist Attitude, and On-site Travel Intention, several limitations warrant acknowledgment and suggest avenues for future inquiry.
First, although the core findings of this study—including the VTE–Attitude–Intention transmission path, the dual role of virtual tourism as a pre-experience and catalyst, and the moderating amplification effects of PEOU and PU—have potential generalizability to other natural destinations, cultural heritage sites, urban leisure spots and rural tourism contexts, the generalizability of the results is constrained by the single-case design. This study only focuses on Zhangjiajie as a typical mountain-type scenic destination, and lacks empirical tests across different destination types, tourist markets and virtual tourism scenarios. In addition, this study uses cross-sectional data, which means the long-term stability and cross-cultural applicability of the findings remain to be verified. Therefore, future cross-context and cross-destination studies can further explore and strengthen the generalizability of the current model and conclusions.
Second, this study did not measure the actual visitation rate following virtual tourism experiences. While our results confirm that virtual experiences significantly enhance travel intention, the extent to which these intentions translate into actual behavior remains an open question. Future studies should adopt longitudinal tracking or post-travel surveys to capture the intention–behavior gap and to validate the ‘virtual-to-real’ conversion more directly.
Additionally, regarding variable selection, this study focused primarily on VTE quality, tourist attitude, PEOU, and PU. It did not incorporate other potentially influential factors such as pre-existing destination image, perceived risk and safety, environmental responsibility awareness, or social media word-of-mouth. Future studies could expand the current model by integrating additional variables and pathways to construct richer mediation and moderation mechanisms. Moreover, adopting a multi-level perspective to simultaneously examine the interplay between individual psychology, destination governance, and product supply would provide a more comprehensive understanding of how virtual tourism shapes on-site travel decisions. Meanwhile, this study did not systematically compare the heterogeneous effects of different virtual tourism experience formats (e.g., promotional videos, virtual walks, and full VR modeling) on the conversion pathways. Future research could employ experimental designs to further examine the independent contributions and interactions of sensory immersion, interactivity, and information utility.

Author Contributions

Conceptualization, J.-H.W.; methodology, D.-Y.Y. and J.-H.W.; validation, J.-H.W. and X.-D.S.; formal analysis, D.-Y.Y. and X.-D.S.; investigation, D.-Y.Y. and X.-D.S.; resources, J.-H.W.; data curation, D.-Y.Y. and X.-D.S.; writing—original draft preparation, D.-Y.Y., J.-H.W. and X.-D.S.; writing—review and editing, J.-H.W.; supervision, J.-H.W.; funding acquisition, J.-H.W. All authors have read and agreed to the published version of the manuscript.

Funding

This research was supported by the Social Science Foundation of Hunan Province, China (Grant No.24YBQ151).

Institutional Review Board Statement

This study only collected data via anonymous questionnaires. The survey did not involve any physiological, medical, or psychological experimentation, nor did it collect any personally identifiable information. According to Article 32 of the Declaration of Helsinki (2013 revision), ethics committee review can be waived.

Informed Consent Statement

Informed consent for participation was obtained from all subjects involved in the study.

Data Availability Statement

The original contributions presented in this study are included in the article. Further inquiries can be directed to the corresponding author.

Conflicts of Interest

The authors declare no conflicts of interest.

References

  1. World Travel & Tourism Council. Travel & Tourism Sees Best Year Ever and Outpacing the Global Economy in 2025; WTTC: Madrid, Spain, 2026. [Google Scholar]
  2. World Travel & Tourism Council. Global Travel & Tourism Forecast 2026–2035; WTTC: Madrid, Spain, 2026. [Google Scholar]
  3. Gössling, S.; Scott, D.; Hall, C.M. Pandemics, tourism and global change: A rapid assessment of COVID-19. J. Sustain. Tour. 2020, 29, 1–20. [Google Scholar] [CrossRef]
  4. Sigala, M. Tourism and COVID-19: Impacts and implications for advancing and resetting industry and research. J. Bus. Res. 2020, 117, 312–321. [Google Scholar] [CrossRef] [PubMed]
  5. Gursoy, D.; Malodia, S.; Dhir, A. The metaverse in the hospitality and tourism industry: An overview of current trends and future research directions. J. Hosp. Mark. Manag. 2022, 31, 527–534. [Google Scholar] [CrossRef]
  6. Li, L.; Liu, M.; Zhang, Y.; Lai, X. How can use and gratification attributes evoke on-site travel intention in digital museum tourism? A serial mediation model. J. Hosp. Tour. Technol. 2025, 17, 620–642. [Google Scholar] [CrossRef]
  7. Dwivedi, Y.K.; Hughes, L.; Wang, Y.; Alalwan, A.A.; Ahn, S.J.; Balakrishnan, J.; Barta, S.; Belk, R.; Buhalis, D.; Dutot, V.; et al. Metaverse marketing: How the metaverse will shape the future of consumer research and practice. Psychol. Mark. 2023, 40, 750–776. [Google Scholar] [CrossRef]
  8. Skard, S.; Knudsen, E.S.; Sjastad, H.; Thorbjornsen, H. How virtual reality influences travel intentions: The role of mental imagery and happiness forecasting. Tour. Manag. 2021, 87, 104360. [Google Scholar] [CrossRef]
  9. Qin, S.H.; Lin, Z.L. Research on the formation mechanism of pro-environmental behaviours of mountain hikers from the perspective of transformative tourism experience. Tour. Sci. 2025, 1–21. [Google Scholar]
  10. Song, H.J.; Lee, C.K.; Park, J.A.; Hwang, Y.H.; Reisinger, Y. The influence of tourist experience on perceived value and satisfaction with temple stays: The experience economy theory. J. Travel Tour. Mark. 2015, 32, 401–415. [Google Scholar] [CrossRef]
  11. Yin, Z.; Huang, A.; Huang, Z. Virtual tourism attributes in cultural heritage: Benefits and values. Tour. Manag. Perspect. 2024, 53, 101275. [Google Scholar] [CrossRef]
  12. Godovykh, M.; Baker, C.; Fyall, A. VR in tourism: A new call for virtual tourism experience amid and after the COVID-19 pandemic. Tour. Hosp. 2022, 3, 265–275. [Google Scholar] [CrossRef]
  13. Kim, M.J.; Lee, C.-K.; Jung, T. Exploring consumer behavior in virtual reality tourism using an extended stimulus-organism-response model. J. Travel Res. 2020, 59, 69–89. [Google Scholar] [CrossRef]
  14. Wu, S.; Wang, J. Exploring the impact of AI-enhanced virtual tourism on tourists’ pro-environmental behavior: A stimulus-organism-response model perspective. Acta Psychol. 2024, 249, 104469. [Google Scholar] [CrossRef]
  15. Teng, Y.; Wu, K.; Kuo, F. Virtual reality tourism: Intention to use mediated by perceived usefulness, attitude and desire. Tour. Rev. 2025, 80, 1515–1534. [Google Scholar] [CrossRef]
  16. Liu, C.R.; Park, B.J. Exploring the impact of metaverse tourism experiences on actual visit intentions: An integrated model of presence, the Technology Acceptance Model, and the theory of planned behavior. Int. J. Tour. Res. 2024, 26, e2616. [Google Scholar] [CrossRef]
  17. Alkhalifah, E.; Hammady, R.; Abdelrahman, M.; Darwish, A.; Cranmer, E.; Al-Shamaileh, O.; Bourazeri, A.; Jung, T. Virtual reality’s impact on tourist attitudes in Islamic religious tourism: Exploring emotional attachment and VR presence. Hum. Behav. Emerg. Technol. 2025, 1, 8818559. [Google Scholar] [CrossRef]
  18. Talawar, A.; Suresh, S.; Alathur, S. Assessing the moderating effects of involvement on tourist attitudes and intentions through virtual reality applications. J. Hosp. Tour. Insights 2024, 7, 1050–1069. [Google Scholar] [CrossRef]
  19. Zheng, C.; Zhang, J.; Zhu, J. “Dialogue” through time and space: Imagination inspiration and travel intentions in the digitalization of cultural heritage. Tour. Trib. 2024, 39, 127–1404. [Google Scholar]
  20. Lee, C.K.; Ahmad, M.S.; Petrick, J.F.; Park, Y.N.; Park, E.; Kang, C.W. The influence of Hanok experience on tourists’ attitude and behavioral intention: An application of the experience economy. Travel Tour. Mark. 2021, 38, 481–495. [Google Scholar]
  21. Pencarelli, T. The digital revolution in the travel and tourism industry. Inf. Technol. Tour. 2020, 22, 455–476. [Google Scholar] [CrossRef]
  22. Dong, Y.; Tian, X.; Zhu, Z.; Wang, X. Exploring Features, Customer Emotions, and Evaluations of Airbnb Online Experiences: A Framework for Virtual Tourism Experiences. Int. J. Tour. Res. 2025, 27, e70068. [Google Scholar] [CrossRef]
  23. Qin, L.; Zhang, H. Impact of rich cultural tourism experience on tourist satisfactions and behavioral intentions toward Ningxia’s cultural heritage: Moderation role of perceived cultural distance. PLoS ONE 2025, 20, e0336220. [Google Scholar] [CrossRef]
  24. Li, X.; Zhang, Y.; Liu, Y. Virtual reality in tourism: The impact of virtual experiences and destination images on travel intention. Comput. Hum. Behav. Rep. 2025, 17, 100482. [Google Scholar]
  25. Sinha, N.; Kapoor, G.; Kataria, N. Customer engagement in virtual tourism: Embracing immersive experience of culture and heritage. Int. J. Tour. Res. 2025, 27, e70094. [Google Scholar] [CrossRef]
  26. Bilynets, I.; Trkman, P.; Knežević Cvelbar, L. Virtual tourism experiences: Adoption factors, participation and readiness to pay. Curr. Issues Tour. 2024, 27, 3658–3675. [Google Scholar] [CrossRef]
  27. Zhong, L.; Xu, Z.; Li, X.; Law, R.; Wang, Y.; Zhu, M. Exploring the therapeutic potential of long-term virtual tourism: Empowering tourists on the path to depression recovery. Tour. Manag. 2025, 111, 105221. [Google Scholar] [CrossRef]
  28. Gao, B.W.; Zhu, C.; Song, H.; Dempsey, I.M.B. Interpreting the perceptions of authenticity in virtual reality tourism through postmodernist approach. Inf. Technol. Tour. 2022, 24, 31–55. [Google Scholar] [CrossRef]
  29. Vinnakota, S.; Mohan, M.D.; Boda, J.; Askarzai, W.; Devkota, P.; Shetty, S.; Wangmo, T.; Choden, T. Venturing into virtuality: Exploring the evolution, technological underpinnings, and forward pathways of virtual tourism. Educ. Res. (IJMCER) 2023, 5, 8–49. [Google Scholar]
  30. Jalilvand, M.R.; Samiei, N.; Dini, B.; Manzari, P.Y. Examining the structural relationships of electronic word of mouth, destination image, tourist attitude toward destination and travel intention: An integrated approach. J. Destin. Mark. Manag. 2012, 1, 134–143. [Google Scholar] [CrossRef]
  31. Kim, D.; Ko, Y. The impact of virtual reality (VR) technology on sport spectators’ flow experience and satisfaction. Comput. Hum. Behav. 2019, 93, 346–356. [Google Scholar] [CrossRef]
  32. Wan, C.; Ng, P.M.; Cheung, C.T.; Lit, K.K.; Lau, M.M. Is more immersive always better? VR CAVE vs. desktop VR for shaping tourists’ attitudes and sustainable VR tourism intentions. Hosp. Tour. Technol. 2025, 16, 1124–1142. [Google Scholar] [CrossRef]
  33. Zheng, C.; Chen, Z.; Zhang, Y.; Fan, R. Digital cultural tourism: Progress and a proposed framework for future research. J. Hosp. Tour. Manag. 2024, 59, 96–107. [Google Scholar] [CrossRef]
  34. Ajzen, I. The theory of planned behavior. Organ. Behav. Hum. Decis. Process. 1991, 50, 179–211. [Google Scholar] [CrossRef]
  35. Vincent, V.C.; Thompson, W. Assessing community support and sustainability for ecotourism development. J. Travel Res. 2002, 41, 153–160. [Google Scholar] [CrossRef]
  36. Song, H.; Lu, S. The effect of virtual tourism experience on tourist responses: The lens from cognitive appraisal theory. Asia Pac. J. Tour. Res. 2024, 29, 885–899. [Google Scholar] [CrossRef]
  37. Tussyadiah, I.P.; Wang, D.; Jung, T.H.; Tom Dieck, M.C. Virtual reality, presence, and attitude change: Empirical evidence from tourism. Tour. Manag. 2018, 66, 140–154. [Google Scholar] [CrossRef]
  38. Lin, H.F.; Chen, C.H. Combining the Technology Acceptance Model and uses and gratifications theory to examine the usage behavior of an augmented reality tour-sharing application. Symmetry 2017, 9, 113. [Google Scholar] [CrossRef]
  39. Chen, L.; Wu, X.; Liu, Y.; Hu, Z.; Chen, X.; Zhang, Z. Integrating TAM–ISSM–SOR framework to explore how virtual tourism experience influences tourists’ travel intention. Sci. Rep. 2025, 15, 38826. [Google Scholar] [CrossRef]
  40. Davis, F.D.; Bagozzi, R.P.; Warshaw, P.R. User acceptance of computer technology: A comparison of two theoretical models. Manag. Sci. 1989, 35, 982–1003. [Google Scholar] [CrossRef]
  41. Sinha, N.; Dhingra, S.; Sehrawat, R.; Jain, V. Customers’ intention to use virtual reality in tourism: A comprehensive analysis of influencing factors. Tour. Rev. 2025, 80, 742–766. [Google Scholar] [CrossRef]
  42. Yang, C.; Yan, S.; Wang, J.; Xue, Y. Flow experiences and virtual tourism: The role of technological acceptance and technological readiness. Sustainability 2022, 14, 5361. [Google Scholar] [CrossRef]
  43. El-Said, O.; Aziz, H. Virtual tours a means to an end: An analysis of virtual tours’ role in tourism recovery post COVID-19. J. Travel Res. 2022, 61, 528–548. [Google Scholar] [CrossRef]
  44. Prados-Castillo, J.F.; Solano-Sánchez, M.Á.; Martín, J.M.M.; Liebana-Cabanillas, F. An analysis of the consumer profile and the willingness to pay in immersive virtual tourism. J. Destin. Mark. Manag. 2024, 33, 100929. [Google Scholar] [CrossRef]
  45. Giachino, C.; Nirino, N.; Leonidou, E.; Glyptis, L. eSport in the digital era: Exploring the moderating role of perceived usefulness on financial behavioural aspects within reward-crowdfunding. J. Bus. Res. 2023, 155, 113416. [Google Scholar] [CrossRef]
  46. Mensah, I.K. Exploring the moderating effect of perceived usefulness on the adoption of E-government services. Int. J. Electron. Gov. Res. (IJEGR) 2019, 15, 17–35. [Google Scholar] [CrossRef]
  47. Al-Gasawneh, J.A.; Al Khoja, B.; Al-Qeed, M.A.; Nusairat, N.M.; Hammouri, Q.; Anuar, M.M. Mobile-customer relationship management and its effect on post-purchase behavior: The moderating of perceived ease of use and perceived usefulness. Int. J. Data Netw. Sci. 2022, 6, 439–448. [Google Scholar] [CrossRef]
  48. Jiang, S.; Zhang, Z.; Xu, H.; Pan, Y. What influences users’ continuous behavioral intention in cultural heritage virtual tourism: Integrating experience economy theory and stimulus–organism–response (SOR) model. Sustainability 2024, 16, 10231. [Google Scholar] [CrossRef]
  49. Luo, J.; Xia, M. Embracing Virtual Reality in Destination Marketing: A Serial Mediation Model to Investigate the Role of Virtual Tourism Experiences in the Formation of Place Attachmen. Sustainability 2024, 16, 10551. [Google Scholar] [CrossRef]
  50. Qiu, L.; Li, X.; Choi, S.H. Exploring the influence of short video platforms on tourist attitudes and travel intention: A social–technical perspective. J. Destin. Mark. Manag. 2024, 31, 100826. [Google Scholar] [CrossRef]
  51. Wang, J.C.; Santoso, H.B.; Changkaew, L.; Tamtama, G.I.W.; Windasari, N.A. Virtual reality in dark tourism: Multisensory virtual tourism experiences with thermal stimuli. ACM J. Comput. Cult. Herit. 2025, 18, 30. [Google Scholar] [CrossRef]
  52. Li, Y.; Liang, J.; Huang, J.; Yang, M.; Li, R.; Bai, H. Would you accept virtual Tourism? The impact of COVID-19 risk perception on technology acceptance from a comparative perspective. Sustainability 2022, 14, 12693. [Google Scholar] [CrossRef]
  53. Hair, J.F., Jr.; Black, W.C.; Babin, B.J.; Anderson, R.E.; Tatham, R.L. Multivariate Data Analysis; Pearson Education: Upper Saddle River, NJ, USA, 2006; pp. 72–104. [Google Scholar]
  54. Fornell, C.; Larcker, D.F. Evaluating structural equation models with unobservable variables and measurement error. J. Mark. Res. 1981, 18, 39–50. [Google Scholar] [CrossRef]
  55. Malhotra, N.K.; Dash, S. Marketing Research: An Applied Orientation, 6th ed.; Dorling Kindersley Pvt. Ltd.: New Delhi, India, 2011. [Google Scholar]
  56. Kim, M.J.; Hall, C.M. A hedonic motivation model in virtual reality tourism: Comparing visitors and non-visitors. Int. J. Inf. Manag. 2019, 46, 236–249. [Google Scholar] [CrossRef]
  57. Wei, W. Research progress on virtual reality (VR) and augmented reality (AR) in tourism and hospitality: A critical review of publications from 2000 to 2018. J. Hosp. Tour. Technol. 2019, 10, 539–570. [Google Scholar] [CrossRef]
  58. Yung, R.; Khoo-Lattimore, C. New realities: A systematic literature review on virtual reality and augmented reality in tourism research. Curr. Issues Tour. 2019, 22, 2056–2081. [Google Scholar] [CrossRef]
  59. Loureiro, S.M.C.; Guerreiro, J.; Ali, F. 20 years of research on virtual reality and augmented reality in tourism context: A text-mining approach. Tour. Manag. 2020, 77, 104028. [Google Scholar] [CrossRef]
  60. Wu, H.C.; Ai, C.H.; Cheng, C.C. Virtual reality experiences, attachment and experiential outcomes in tourism. Tour. Rev. 2019, 75, 481–495. [Google Scholar] [CrossRef]
  61. Merkx, C.; Nawijn, J. Virtual reality tourism experiences: Addiction and isolation. Tour. Manag. 2021, 87, 104394. [Google Scholar] [CrossRef]
  62. Venkatesh, V.; Davis, F.D. A theoretical extension of the Technology Acceptance Model: Four longitudinal field studies. Manag. Sci. 2000, 46, 186–204. [Google Scholar] [CrossRef]
  63. Jeong, M.; Shin, H.H. Tourists’ experiences with smart tourism technology at smart destinations and their behavior intentions. J. Travel Res. 2020, 59, 1464–1477. [Google Scholar] [CrossRef]
  64. Iftikhar, R.; Khan, M.S.; Pasanchay, K. Virtual reality tourism and technology acceptance: A disability perspective. Leis. Stud. 2023, 42, 849–865. [Google Scholar] [CrossRef]
  65. Zhu, Z.; Hall, C.M.; Li, Y.; Zhang, X. Exploring the impact of virtual reality on tourists’ pro-sustainable behavior: An integration of TAM and awe. Sustainability 2025, 17, 6278. [Google Scholar] [CrossRef]
Figure 1. The Proposed Research Model.
Information 17 00530 g001
Figure 2. Simple slope plots of the moderating effects of PEOU. (A) Moderating effect of PEOU on the relationship between tourist attitude and on-site travel intention. (B) Moderating effect of PEOU on the relationship between virtual tourism experience and on-site travel intention.
Information 17 00530 g002
Figure 3. Simple slope plots of the moderating effects of PU. (A) Moderating effect of PU on the relationship between tourist attitude and on-site travel intention. (B) Moderating effect of PU on the relationship between virtual tourism experience and on-site travel intention.
Information 17 00530 g003
Table 1. Demographic characteristics of the sample (N = 476).
CharacteristicsTypesN%CharacteristicsTypesN%
Gender Male22747.7EducationJunior high school and below7315.3
Female24952.3High school12225.6
AgeUnder 18 years old418.6College or University19641.2
19–30 years old20943.9Postgraduate or above8517.9
30–50 years old15131.7Monthly incomeLess than $200010321.6
more than 50 years old7515.8$2000–40007916.6
CareerCivil Servant6112.8$4000–60009720.4
Enterprise managers5611.8$6000–800011724.6
Professional/Technical position6613.9More than $80008016.8
Students10421.8Awareness of virtual tourismYes43691.6
Freelance9219.3No408.4
Agricultural and fishing workers428.8Number of virtual tourism experiences *1–2 times23850
Retirees122.53–4 times16534.7
Teachers, doctors, lawyers439More than 4 times7315.3
* Number of virtual tourism experiences refers to the total number of times the respondent has engaged in any form of virtual tourism (e.g., VR tours, 360° videos, metaverse experiences) over their entire lifetime.
Table 2. Mean (Standard Deviation) of measurement items by gender and age group.
Item CodeGenderAge
MaleFemaleUnder 18 Years Old19–30 Years Old30–50 Years OldMore than 50 Years Old
MeanStandard Deviation MeanStandard Deviation MeanStandard Deviation MeanStandard Deviation MeanStandard Deviation MeanStandard Deviation
VTE14.060.8234.070.8864.170.9984.10.8054.040.8323.970.958
VTE23.980.9614.040.8974.020.794.030.934.020.8833.931.082
VTE34.080.8914.030.9284.170.8924.050.8784.070.9213.990.993
VTE44.080.9614.120.8854.370.6984.090.8844.110.9463.991.059
VTE54.050.9674.080.9254.150.914.030.9824.130.8223.991.084
VTE64.180.9984.160.914.270.7754.150.9724.240.8774.031.115
ATT13.891.1353.91.0973.681.3123.991.0143.871.13.791.277
ATT23.881.0973.841.0433.631.093.961.033.831.0983.761.089
ATT33.911.0653.861.0983.81.2293.960.9943.831.143.81.115
ATT43.861.0633.71.1543.761.2613.871.0323.681.1223.721.225
INT14.051.053.921.1243.830.9984.150.9593.891.1783.791.244
INT24.011.0133.851.0933.781.3143.940.9814.011.0613.81.103
INT33.971.0153.91.0853.981.2144.020.993.781.0763.991.059
INT44.11.0063.941.1594.120.94.111.0093.891.1973.991.168
PEOU13.751.1293.791.0733.441.3973.891.0283.691.0973.771.085
PEOU23.791.2323.861.0463.511.3443.921.0513.751.2013.921.1
PEOU33.851.0313.81.0843.371.4283.960.9273.811.0573.761.113
PU13.811.1513.921.043.511.3623.980.9923.811.1183.871.131
PU23.771.1983.791.0773.291.4533.951.0273.661.1373.81.139
PU33.911.1313.881.1373.411.2643.961.0443.871.1474.031.219
PU43.881.1953.841.1563.511.5673.891.1433.881.0953.891.158
Table 3. Reliability and confirmatory factor analysis.
VariablesItemsSourceFactor LoadingCRAVE
Virtual Tourism Experience (VTE)
KMO = 0.858
α = 0.806
1. I found the virtual tour of Zhangjiajie very interesting.Song & Lu [36]; Jiang et al. [48]; Luo & Xia [49]0.6960.83480.4575
2. The virtual tour of Zhangjiajie made me feel very pleasant.0.637
3. I enjoyed the process of the virtual tour of Zhangjiajie.0.675
4. I think virtual tourism is a good way to relax my mind.0.671
5. The virtual tour gave me a new understanding of Zhangjiajie’s natural scenery, history, and culture.0.666
6. This experience introduced me to new things.0.711
Tourist Attitude (ATT)
KMO = 0.805
α = 0.812
1. I think using virtual tourism to visit Zhangjiajie is a good idea.Sinha et al. [25]; Qiu et al. [50]0.710.81320.5213
2. I am satisfied with the overall image of Zhangjiajie presented in the virtual tour.0.754
3. Overall, I am satisfied with the virtual tourism of Zhangjiajie.0.718
4. I like visiting Zhangjiajie Scenic Area via virtual tourism.0.705
On-site Travel Intention (INT)
KMO = 0.804
α = 0.820
1. I am willing to visit Zhangjiajie in person in the future.Song & Lu [36]; Wang et al. [51]0.7730.82390.5393
2. When I have the opportunity to travel in the future, I will prioritize Zhangjiajie.0.707
3. I hope to visit Zhangjiajie in person as soon as possible.0.729
4. After experiencing the virtual tour, my intention to visit the destination became stronger.0.727
Perceived Ease of Use (PEOU)
KMO = 0.693
α = 0.764
1. The interface of the virtual tour is smooth.Sinha et al. [41]; Qiu et al. [50]0.7040.77480.5344
2. The virtual tour allows me to obtain information simply and quickly.0.73
3. The visuals presented in the virtual tour are clear.0.758
Perceived Usefulness (PU)
KMO = 0.812
α = 0.831
1. The virtual tour allows me to obtain a lot of information about the destination.Sinha et al. [41]; Giachino et al. [45]; Li et al. [52]).0.7480.82090.5343
2. The virtual tour improves the efficiency of obtaining travel information.0.756
3. The information presented in the virtual tour provides a reference for on-site travel.0.728
4. Virtual tourism saves me time in acquiring travel information.0.69
Table 4. Results of Goodness-of-fit indices for measurement model.
Parsimonious Fit IndicesIncremental Fit IndicesAbsolute Fit Indices
Fit Indicesχ2/dfGFINFIRFIIFITFICLIRMRRMSEA
Recommended Criteria<3>0.9>0.9>0.9>0.9>0.9>0.9<0.08<0.08
Observed Values1.4280.9690.9560.9460.9860.9830.9860.0310.030
Table 5. Results of hypothesis testing.
EstimateS.E.C.R.p
Tourist AttitudeVirtual Tourism Experience (VTE)0.7060.0838.472<0.001
On-site Travel IntentionVirtual Tourism Experience (VTE)0.2880.0793.63<0.001
On-site Travel IntentionTourist Attitude0.5720.0678.5<0.001
Table 6. Estimation of the moderated effect of PEOU.
Coeffsetp
1constant3.8420.0363105.9528<0.001
VTE → Tourist AttitudeExperience0.35710.06435.5503<0.001
 PEOU0.39270.04129.5255<0.001
 Int_10.04080.05420.7530.4518
 R20.3197
 F73.9399
2constant3.93140.0355110.6806<0.001
Tourist Attitude →
On-site travel intention
Attitude0.45360.045210.0433<0.001
 PEOU0.25870.04196.1766<0.001
 Int_10.0840.03892.16160.0311
 R20.3623
 F89.3734
3constant3.92340.0366107.2689<0.001
VTE →
On-site travel intention
Experience0.43090.06496.6399<0.001
 PEOU0.34350.04168.2609<0.001
 Int_10.15780.05462.88780.0041
 R20.2899
 F64.2405
Table 7. Estimation of the moderated effect of PU.
Coeffsetp
1constant3.84940.0361106.5599<0.001
VTE → Tourist AttitudeExperience0.34290.06365.3912<0.001
 PU0.38110.04069.3779<0.001
 Int_10.0130.0510.2540.7996
 R20.3164
 F72.8355
2constant3.93520.0348112.9674<0.001
Tourist Attitude →
On-site travel intention
Attitude0.4240.04399.6539<0.001
 PU0.30180.0417.3543<0.001
 Int_10.07370.03681.99940.0461
 R20.3805
 F96.6535
3constant3.93030.0358109.8522<0.001
VTE → On-site travel intentionExperience0.38790.0636.1576<0.001
 PU0.37910.04029.4195<0.001
 Int_10.12910.05052.55540.0109
 R20.3121
 F71.3802
Table 8. Summary of hypothesis testing results.
HypothesisDescriptionResultKey Statistics
H1VTE → Tourist AttitudeSupportedβ = 0.706, p < 0.001
H2Tourist Attitude → On-site Travel IntentionSupportedβ = 0.572, p < 0.001
H3VTE → On-site Travel IntentionSupportedβ = 0.288, p < 0.001
H4PU moderates VTE → Tourist AttitudeNot Supportedβ = 0.013, p = 0.7996
H5PEOU moderates VTE → Tourist AttitudeNot Supportedβ = 0.0408, p = 0.4518
H6PU moderates Tourist Attitude → On-site Travel IntentionSupportedβ = 0.0737, p = 0.0461
H7PEOU moderates Tourist Attitude → On-site Travel IntentionSupportedβ = 0.084, p = 0.0311
H8PU moderates VTE → On-site Travel IntentionSupportedβ = 0.1291, p = 0.0109
H9PEOU moderates VTE → On-site Travel IntentionSupportedβ = 0.1578, p = 0.0041
Disclaimer/Publisher’s Note: The statements, opinions and data contained in all publications are solely those of the individual author(s) and contributor(s) and not of MDPI and/or the editor(s). MDPI and/or the editor(s) disclaim responsibility for any injury to people or property resulting from any ideas, methods, instructions or products referred to in the content.