Article

Web-Based Repeated Monitoring of Well-Being in University Students: Cohort Protocol and Baseline Findings from the DiCoBENE Study


Department of Medical and Surgical Sciences and Advanced Technologies “G.F. Ingrassia”, University of Catania, 95123 Catania, Italy
*
Author to whom correspondence should be addressed.
Information 2026, 17(6), 531; https://doi.org/10.3390/info17060531 (registering DOI)
Submission received: 28 April 2026 / Revised: 22 May 2026 / Accepted: 26 May 2026 / Published: 29 May 2026
(This article belongs to the Special Issue Recent Developments and Implications in Web Analysis, 2nd Edition)

Abstract

Web-based repeated-measures cohorts enable remote, scalable, and temporally structured monitoring of health-related outcomes in naturalistic settings. This paper presents the DiCoBENE study, a web-based cohort of healthcare-track university students, and reports evidence-informed instrument selection together with protocol features and pilot baseline findings. A structured review was used to inform the web-based administration of patient-reported outcome measures (PROMs) covering sleep quality, perceived stress, anxiety symptoms, depressive symptoms, and quality of life. In the pilot baseline sample, 442 students constituted the analytic dataset and 370–372 completed the core PROM battery, depending on the instrument. Poor sleep quality, anxiety symptoms, depressive symptoms, and perceived stress were common. Internal consistency was good to excellent for the Generalized Anxiety Disorder 7-item scale (GAD-7), the Patient Health Questionnaire 9-item depression module (PHQ-9), and the 10-item Perceived Stress Scale (PSS-10), and moderate for the Pittsburgh Sleep Quality Index (PSQI). Exploratory multivariate analyses, including latent profile analysis, principal component analysis, and partial-correlation network analysis, suggested that baseline heterogeneity was more parsimoniously summarized as a graded multidimensional burden continuum than as sharply separated phenotypes. Taken together, these findings position DiCoBENE as a methodologically explicit framework for web-based repeated outcome assessment in student well-being research.

1. Introduction

Web-based cohorts are increasingly used in epidemiological and behavioral research because they enable remote, repeated, and scalable data collection in naturalistic settings [1,2,3]. Compared with conventional observational designs, web-based cohorts and, more broadly, digital cohort infrastructures may offer important methodological advantages, including greater temporal resolution, lower logistical burden, broader reach, and the possibility of integrating repeated self-reported outcomes with digital contextual information. These strengths are particularly relevant for constructs such as sleep quality, perceived stress, anxiety symptoms, depressive symptoms, quality of life, and well-being, which form a closely interconnected symptom-functioning cluster and are increasingly assessed jointly in behavioral and health research.
In these contexts, especially when repeated assessment is implemented through web-based interfaces, patient-reported outcome measure (PROM) administration is no longer merely a matter of operational convenience, but becomes a core measurement issue. Regulatory guidance and methodological recommendations consistently emphasize that migration from paper-based to electronic administration should preserve the intended construct, item wording, response options, and recall period, and that measurement equivalence cannot be assumed when presentation or administration conditions may alter response processes [4,5,6,7,8]. In practice, electronic implementations often differ in methodologically consequential ways. Categorical response options may be replaced by sliders, item presentation may require scrolling, mandatory completion may alter missing-data patterns, and bring-your-own-device designs may introduce heterogeneity in screen size and layout.
These concerns become especially salient in repeated web-based cohort studies, in which inference depends on the interpretation of longitudinal change. If interface characteristics vary across assessments, apparent temporal effects may partly reflect mode- or device-related artifacts rather than changes in the underlying construct. At the same time, repeated digital assessment offers substantial analytical opportunities, including finer temporal granularity, the estimation of within-person variability, and the possibility of summarizing high-dimensional outcome information through multivariate approaches. Attrition and nonresponse remain common in remote cohort designs and must therefore be anticipated, monitored, and transparently reported because of their implications for internal validity and generalizability [9].
University students enrolled in healthcare-related programs represent a population of particular substantive and methodological interest for digital cohort research. Meta-analytic evidence indicates elevated levels of anxiety and depressive symptoms among college students, with especially high burden observed in medical and healthcare training contexts [10,11,12]. Sleep quality is likewise frequently compromised, and Italian multicenter evidence indicates that poor sleep quality, defined as a Pittsburgh Sleep Quality Index (PSQI) score > 5, affects more than half of university students [13]. The academic calendar also offers a naturally structured temporal framework, including teaching periods and examination phases, that is well suited to repeated web-based monitoring. Beyond their methodological relevance, academically structured assessment schedules may also support a substantive research question of direct interest, namely whether student well-being fluctuates systematically across recurring phases of the academic cycle. Lecture periods, examination periods, and post-examination intervals may differ not only in workload and perceived stress, but also in their short-term effects on sleep quality, affective symptoms, and quality of life [10,11,12,13]. A repeated-measures cohort is therefore necessary not only to improve measurement, but also to examine whether distress intensifies during academically demanding periods, whether recovery occurs after examinations, and whether students differ in the magnitude and persistence of such responses.
Despite growing attention to student mental health and well-being, the assessment of these outcomes in university populations still relies largely on conventional methodologies, which may be limited in their ability to capture dynamic, multidimensional, and context-sensitive health trajectories over time. In response to this gap, the DiCoBENE (DIgital COhort per la Valutazione del BENEssere degli Studenti Universitari) study was conceived as a web-based repeated-measures cohort aimed at evaluating student well-being through the integration of epidemiological design, explicit web-based measurement choices, and multivariate outcome analysis. The novelty of the present study does not reside in the isolated use of established PROMs per se, but in the integration of four elements within a single framework: evidence-informed PROM selection for web administration, protocol specification of repeated measurement across academically meaningful time points, pilot baseline psychometric verification, and exploratory multivariate characterization of baseline burden structure. Accordingly, the manuscript has three interrelated aims. First, it documents the evidence-informed selection of PROMs for web-based administration and the corresponding design and start-up of the DiCoBENE cohort protocol. Second, it presents pilot baseline findings on completion, descriptive burden, psychometric performance, and cross-domain coherence. Third, it establishes the baseline analytical framework for examining whether student well-being varies systematically across academically meaningful phases and whether such variation is better understood as a common burden continuum than as sharply separated phenotypes.

2. Materials and Methods

2.1. DiCoBENE Protocol

2.1.1. Guiding Design and Measurement Principles

The DiCoBENE protocol was developed according to four overarching methodological principles. First, the selection of PROMs for digital administration was evidence-informed and based on construct validity, cross-cultural robustness, and, where available, empirical evidence on mode and device comparability [4,5,6,7,8]. Second, electronic migration was designed to remain as faithful as possible to the original instruments, because changes in response format may introduce systematic measurement error. Third, interface- and device-related characteristics were explicitly documented and treated as potential sources of measurement variability. Fourth, the repeated-measures design required explicit planning for attrition and missing data, including analytical strategies capable of using all available observations and sensitivity analyses where dropout could plausibly be informative [9]. From an operational perspective, attrition mitigation was approached through low-burden repeated measurement, predefined completion windows, reminder-based follow-up, stable study identifiers, and participant feedback during the pilot phase.

2.1.2. Review and Evidence-Informed PROM Selection

To support protocol development, we conducted a narrative review aimed at identifying validated PROMs across five domains relevant to student well-being-sleep quality, perceived stress, anxiety symptoms, depressive symptoms, and quality of life/well-being-that could be feasibly administered in web-based format. Searches were performed in Scopus, PubMed/MEDLINE, and Web of Science using combinations of terms related to the target constructs, digital administration, and measurement comparability, including sleep quality, perceived stress, anxiety, depression, quality of life, well-being, PROMs, patient-reported outcomes, electronic administration, digital assessment, ePROM, web-based survey, mobile application, paper-to-electronic equivalence, mode comparison, measurement equivalence, scrolling, and bring-your-own-device. The purpose of the review was not to produce an exhaustive systematic synthesis, but rather to support evidence-informed instrument selection and transparent reporting of web-based implementation choices within a repeated-measures cohort design. In accordance with this purpose, no formal risk-of-bias appraisal was undertaken; instead, the evidence was considered according to its relevance for digital migration, including psychometric foundation, applied feasibility, and direct equivalence or device-feature evidence.
On this basis, the DiCoBENE assessment battery was selected to balance interpretability, respondent burden, availability of validated Italian versions, and the strength of evidence supporting web-based administration. For sleep quality, the PSQI was retained because of its widespread use, benchmark interpretability, and relevance for repeated web-based assessment, despite known variability in factor structure and component behavior across populations [13,14,15,16]. For perceived stress, the Perceived Stress Scale-10 (PSS-10) was selected because of its strong psychometric foundation and supporting evidence for digital administration under controlled implementation conditions [17,18,19,20]. For anxiety and depressive symptoms, the Generalized Anxiety Disorder-7 (GAD-7) and the Patient Health Questionnaire-9 (PHQ-9) were selected because of their brevity, validated thresholds, and broad use in web-based and mode-comparison studies [21,22,23]. For quality of life, the WHOQOL-BREF was included to ensure multidimensional coverage, while recognizing that device-related features such as scrolling and bring-your-own-device conditions may affect comparability across domains [24,25]. Sleep quality was prioritized as the primary domain because of its high prevalence and benchmark interpretability in Italian university populations. Accordingly, the main study primary endpoint was defined as PSQI > 5 over time [13].

2.1.3. Study Design

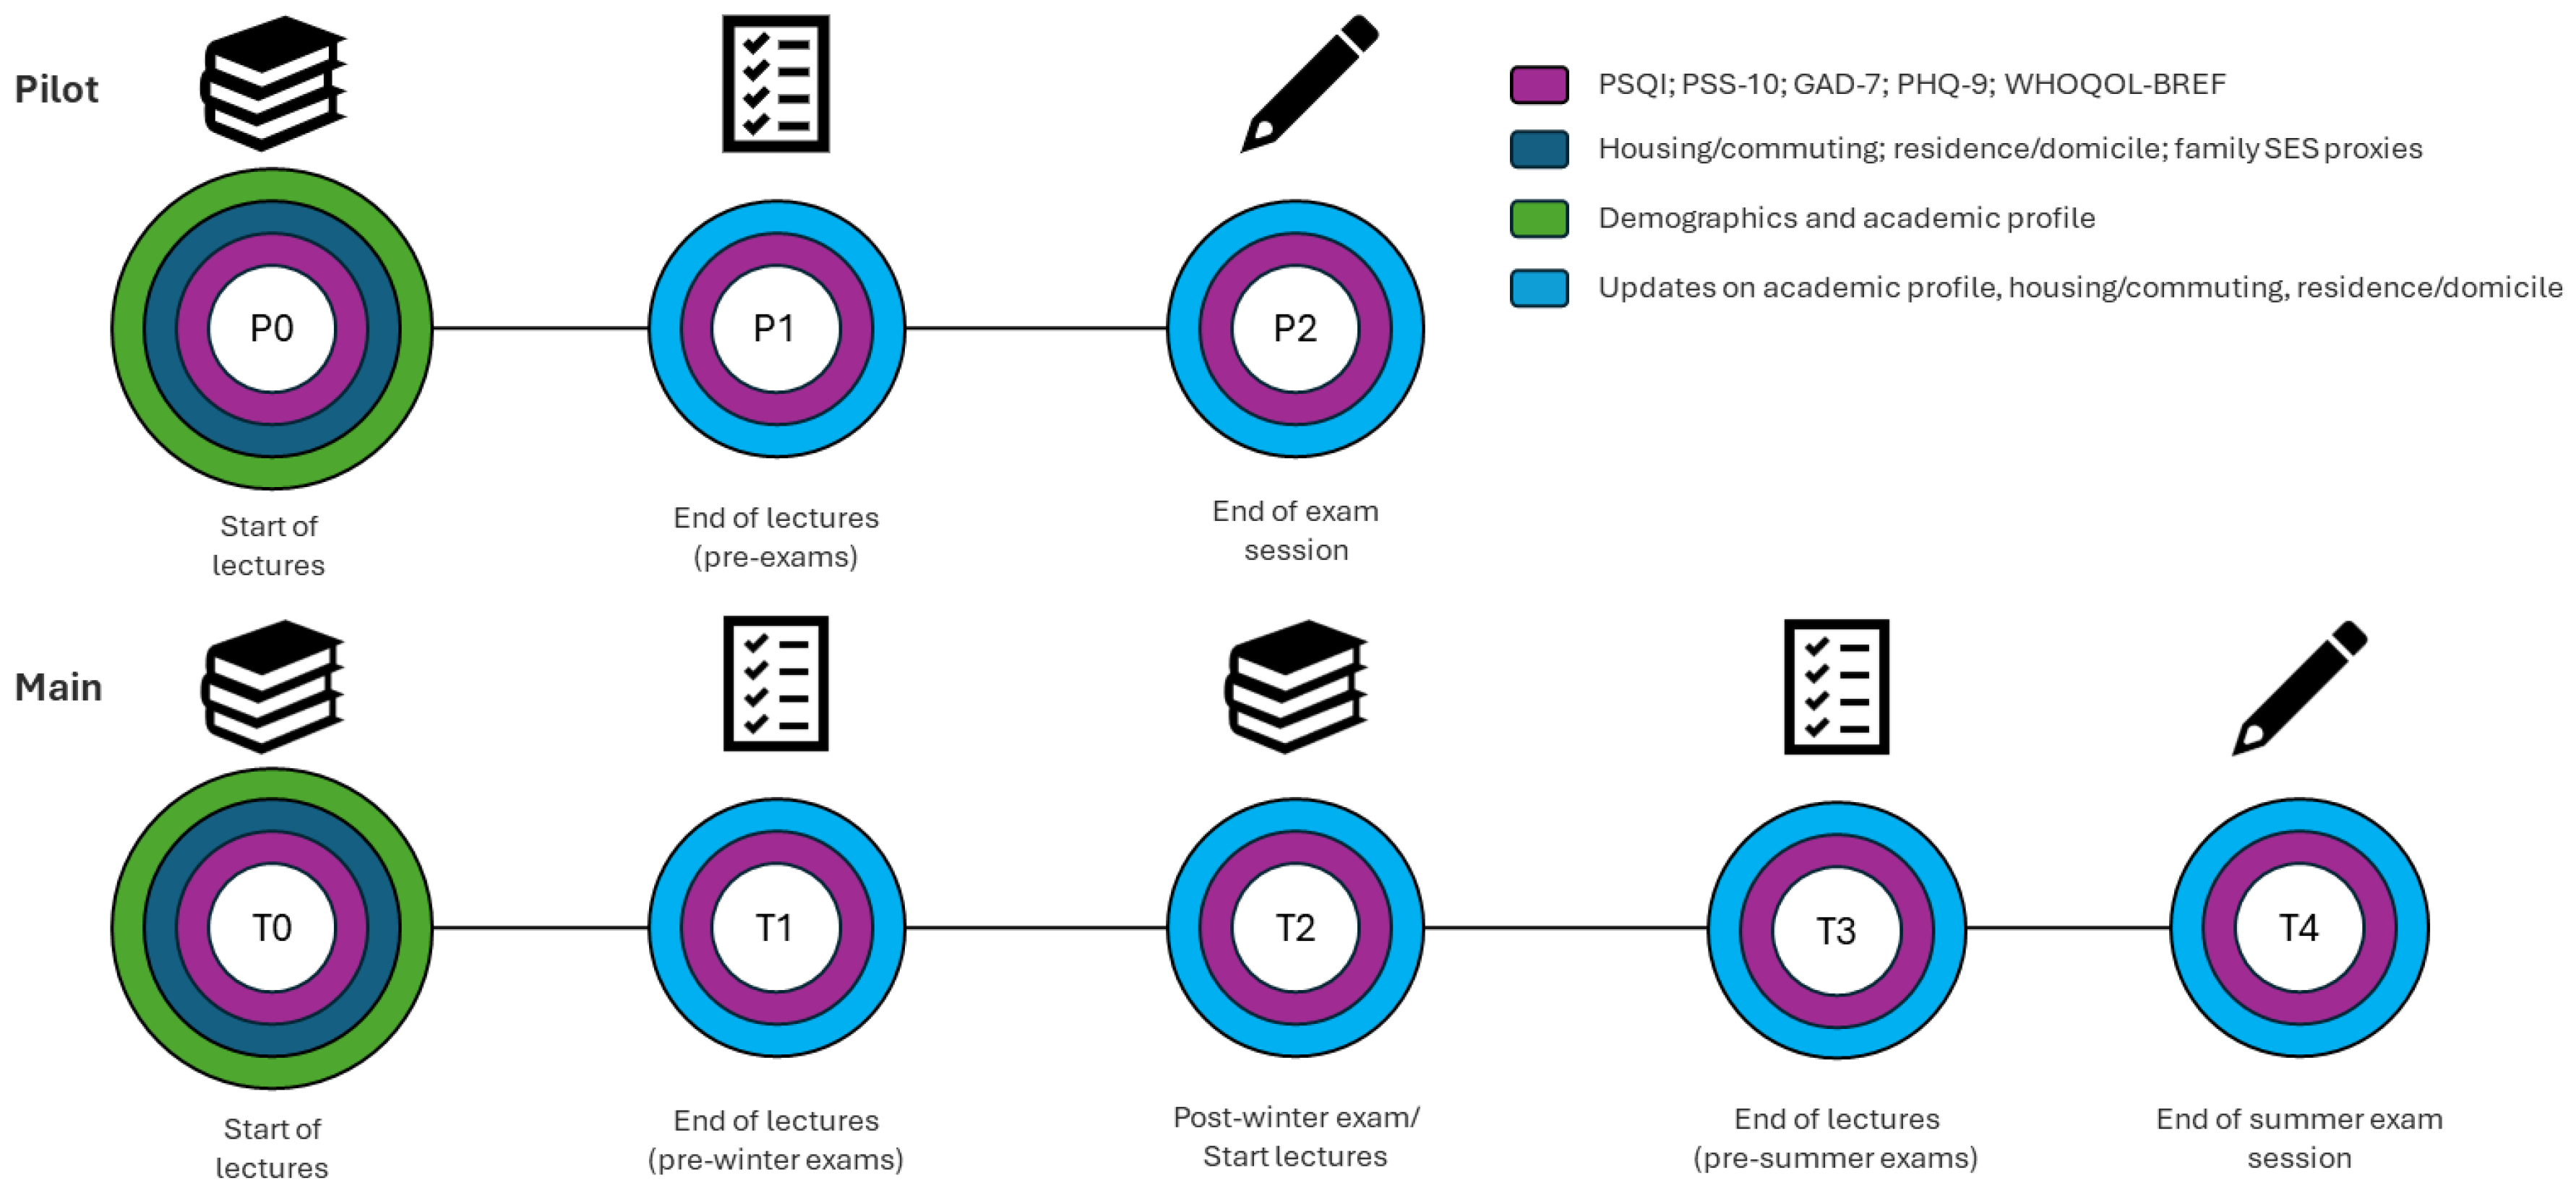
DiCoBENE is an observational, non-interventional, prospective repeated-measures cohort study conducted at the University of Catania (Catania, Italy). The study targets students enrolled in healthcare-related degree programs across all years of training, including those who are out of course. The project is funded by the University of Catania under the PIano di inCEntivi per la RIcerca di Ateneo (PIACERI), Linea di Intervento 3 Starting Grant. The study protocol was approved by the Catania 1 Ethics Committee (approval code: 14/2026/PAR). The protocol is implemented through the institutional Research Electronic Data Capture (REDCap) platform and is structured into two phases using harmonized measurement procedures (Figure 1).
The pilot phase, conducted during the second semester of the 2025–2026 academic year, comprises three assessment waves (P0–P2): P0 at the beginning of the teaching period, P1 at the end of lectures and prior to the examination period, and P2 at the conclusion of the examination session. In the interval between the pilot and the main phase, selected groups of participants will be involved in qualitative interviews to elicit feedback on the strengths and limitations of the study procedures and to gather suggestions for refinement. The findings from this participant-centered evaluation will inform potential adjustments to the study design and implementation prior to the launch of the main phase.
The main phase, planned for the 2026–2027 academic year, comprises five assessment waves (T0–T4) aligned with academically time points: T0 at the beginning of first-semester lectures, T1 at the end of lectures and before the winter examination session, T2 following the winter examinations and at the beginning of second-semester lectures, T3 at the end of lectures and before the summer examination session, and T4 at the end of the summer examination period. Each assessment wave remains open for a predefined completion window, typically lasting two to three weeks.

2.1.4. Eligibility, Recruitment, and Follow-Up

Eligibility criteria include age of at least 18 years, enrollment in an eligible healthcare-related degree program during the reference academic year, adequate proficiency in Italian, and provision of electronic informed consent. Participants are also asked to provide separate optional consent for recontact in order to enable longitudinal follow-up. Recruitment is based on an open-invitation strategy disseminated through official university channels, including institutional email, learning platforms, and program-level communications, and was supplemented, where feasible, by brief in-class presentations. To ensure a consistent temporal baseline, enrollment is restricted to the baseline assessment window (P0 or T0). Follow-up invitations will be sent only to participants who had consented to recontact, with one reminder issued for each wave. Participants are free to withdraw from the study at any time and could opt out of further recontact without consequences.

2.1.5. Data Linkage and Measures

A persistent StudyID is used to link repeated observations across assessment waves. Contact email addresses collected exclusively for reinvitation purposes are stored separately from the analytic dataset. The REDCap platform is configured with role-based access control and audit trail functionalities, while the analytic dataset is pseudonymized and includes only the StudyID and study variables.
The PROM battery comprises the PSQI for sleep quality (19 items contributing to seven component scores and one global score), the PSS-10 for perceived stress (10 items), the GAD-7 for anxiety symptoms (7 items), the PHQ-9 for depressive symptoms (9 items), and the WHOQOL-BREF for quality of life (26 items covering four domains in addition to general items). All instruments are administered in validated Italian versions. For the present baseline analyses, GAD-7, PHQ-9, WHOQOL-BREF, and PSQI were scored according to their standard manuals.
Baseline data collection includes socio-demographic and academic characteristics, such as age, gender, citizenship, degree program, year of study, and campus/site. Additional variables include housing arrangement, commuting-time categories, and residence and domicile indicators, including municipality and postal code. Baseline assessment also includes family- and household-level socioeconomic proxies, such as household composition, perceived economic hardship, parental educational attainment, employment status, and broad occupational categories. Follow-up assessments are designed to maximize comparability while minimizing respondent burden. Accordingly, they primarily repeat the PROM battery and include only minimal contextual updates when necessary.

2.1.6. Endpoints and Estimands

In the main phase of the study, the primary estimand is the effect of academically structured time, operationalized as categorical assessment waves (T0–T4), on the probability of poor sleep quality, defined as a PSQI score > 5. Primary reporting will include both wave-specific observed prevalence estimates and model-based prevalence estimates, together with contrasts relative to baseline (T0), expressed as odds ratios and/or marginal prevalence differences. Secondary estimands will be specified using the same analytical framework for PHQ-9 ≥ 10 and GAD-7 ≥ 10, as well as for the continuous longitudinal trajectories of PSQI, PSS-10, PHQ-9, GAD-7, and WHOQOL-BREF domain scores.

2.1.7. Sample Size

Sample size for the main phase was determined using a precision-based approach, as the primary endpoint is the longitudinal prevalence of poor sleep quality, defined as PSQI > 5 across T0–T4. The expected prevalence was based on the Italian multicenter UnSleep study, which reported a prevalence of 54.6% among university students [13]. Using the standard formula for prevalence estimation, with p = 0.546 and absolute precision d = 0.03, the required baseline sample size was 1058. After applying a 10% inflation to account for incomplete baseline questionnaires, the target sample was set at 1164 participants, operationally rounded to approximately 1200 baseline completers. Assuming a conservative 60% retention at T4, approximately 700 participants are expected at the final wave, corresponding to an estimated precision of approximately ±3.7% for the prevalence at T4. Because longitudinal analyses will incorporate all repeated observations collected across intermediate waves, overall analytical information is expected to exceed that available from the final wave alone.
For the pilot phase, sample size was determined to estimate feasibility and retention across P0–P2. Assuming an expected retention of 70%, an absolute precision of 0.05, and 10% inflation for incomplete baseline data, the target sample was set at 355 participants with a complete baseline assessment.

2.1.8. Statistical Analysis

Analyses were planned separately for the pilot and main study phases. The present work focuses on the pilot baseline dataset (P0). The analytical sample was restricted to participants who provided informed consent both for study participation and for personal data processing. Analyses were conducted on a pseudonymized dataset; contact information and other directly identifying fields were removed from all analytical files prior to analysis.
Baseline sample characteristics, data completeness, and distributions of PROMs were summarized using descriptive statistics. Categorical variables are presented as absolute frequencies and percentages, whereas continuous variables are reported as mean and standard deviation (SD) or median and interquartile range (IQR), as appropriate according to their empirical distribution. For each PROM, instrument-level completeness was quantified as the proportion of participants with sufficient non-missing data to compute total scores and, where applicable, domain-specific scores according to prespecified scoring rules. For binary descriptive reporting, prevalence estimates were calculated for poor sleep quality, defined as PSQI global score > 5; moderate-to-severe anxiety symptoms, defined as GAD-7 ≥ 10; moderate-to-severe depressive symptoms, defined as PHQ-9 ≥ 10; and moderate or high perceived stress categories derived from the PSS-10. Baseline prevalence estimates were reported with 95% confidence intervals (CIs) calculated using Wilson’s method.
The internal consistency of web-based administered PROMs was evaluated at baseline using both Cronbach’s alpha and McDonald’s omega total. Cronbach’s alpha was retained as the conventional index of internal consistency, whereas McDonald’s omega was additionally reported because it is less dependent on the assumption of tau-equivalence and may provide a more robust estimate of reliability in the presence of heterogeneous item loadings. Reliability coefficients were estimated separately for each scale or domain score included in the analysis. This dual approach was adopted to provide a more comprehensive psychometric assessment of the web-based administration of the selected PROMs. To further characterize item-level homogeneity and identify potential item-level irregularities, corrected item-total correlations and Cronbach’s alpha if item deleted were also examined. For reporting purposes, the range of corrected item-total correlations and the range of alpha-if-item-deleted values were summarized for each instrument.
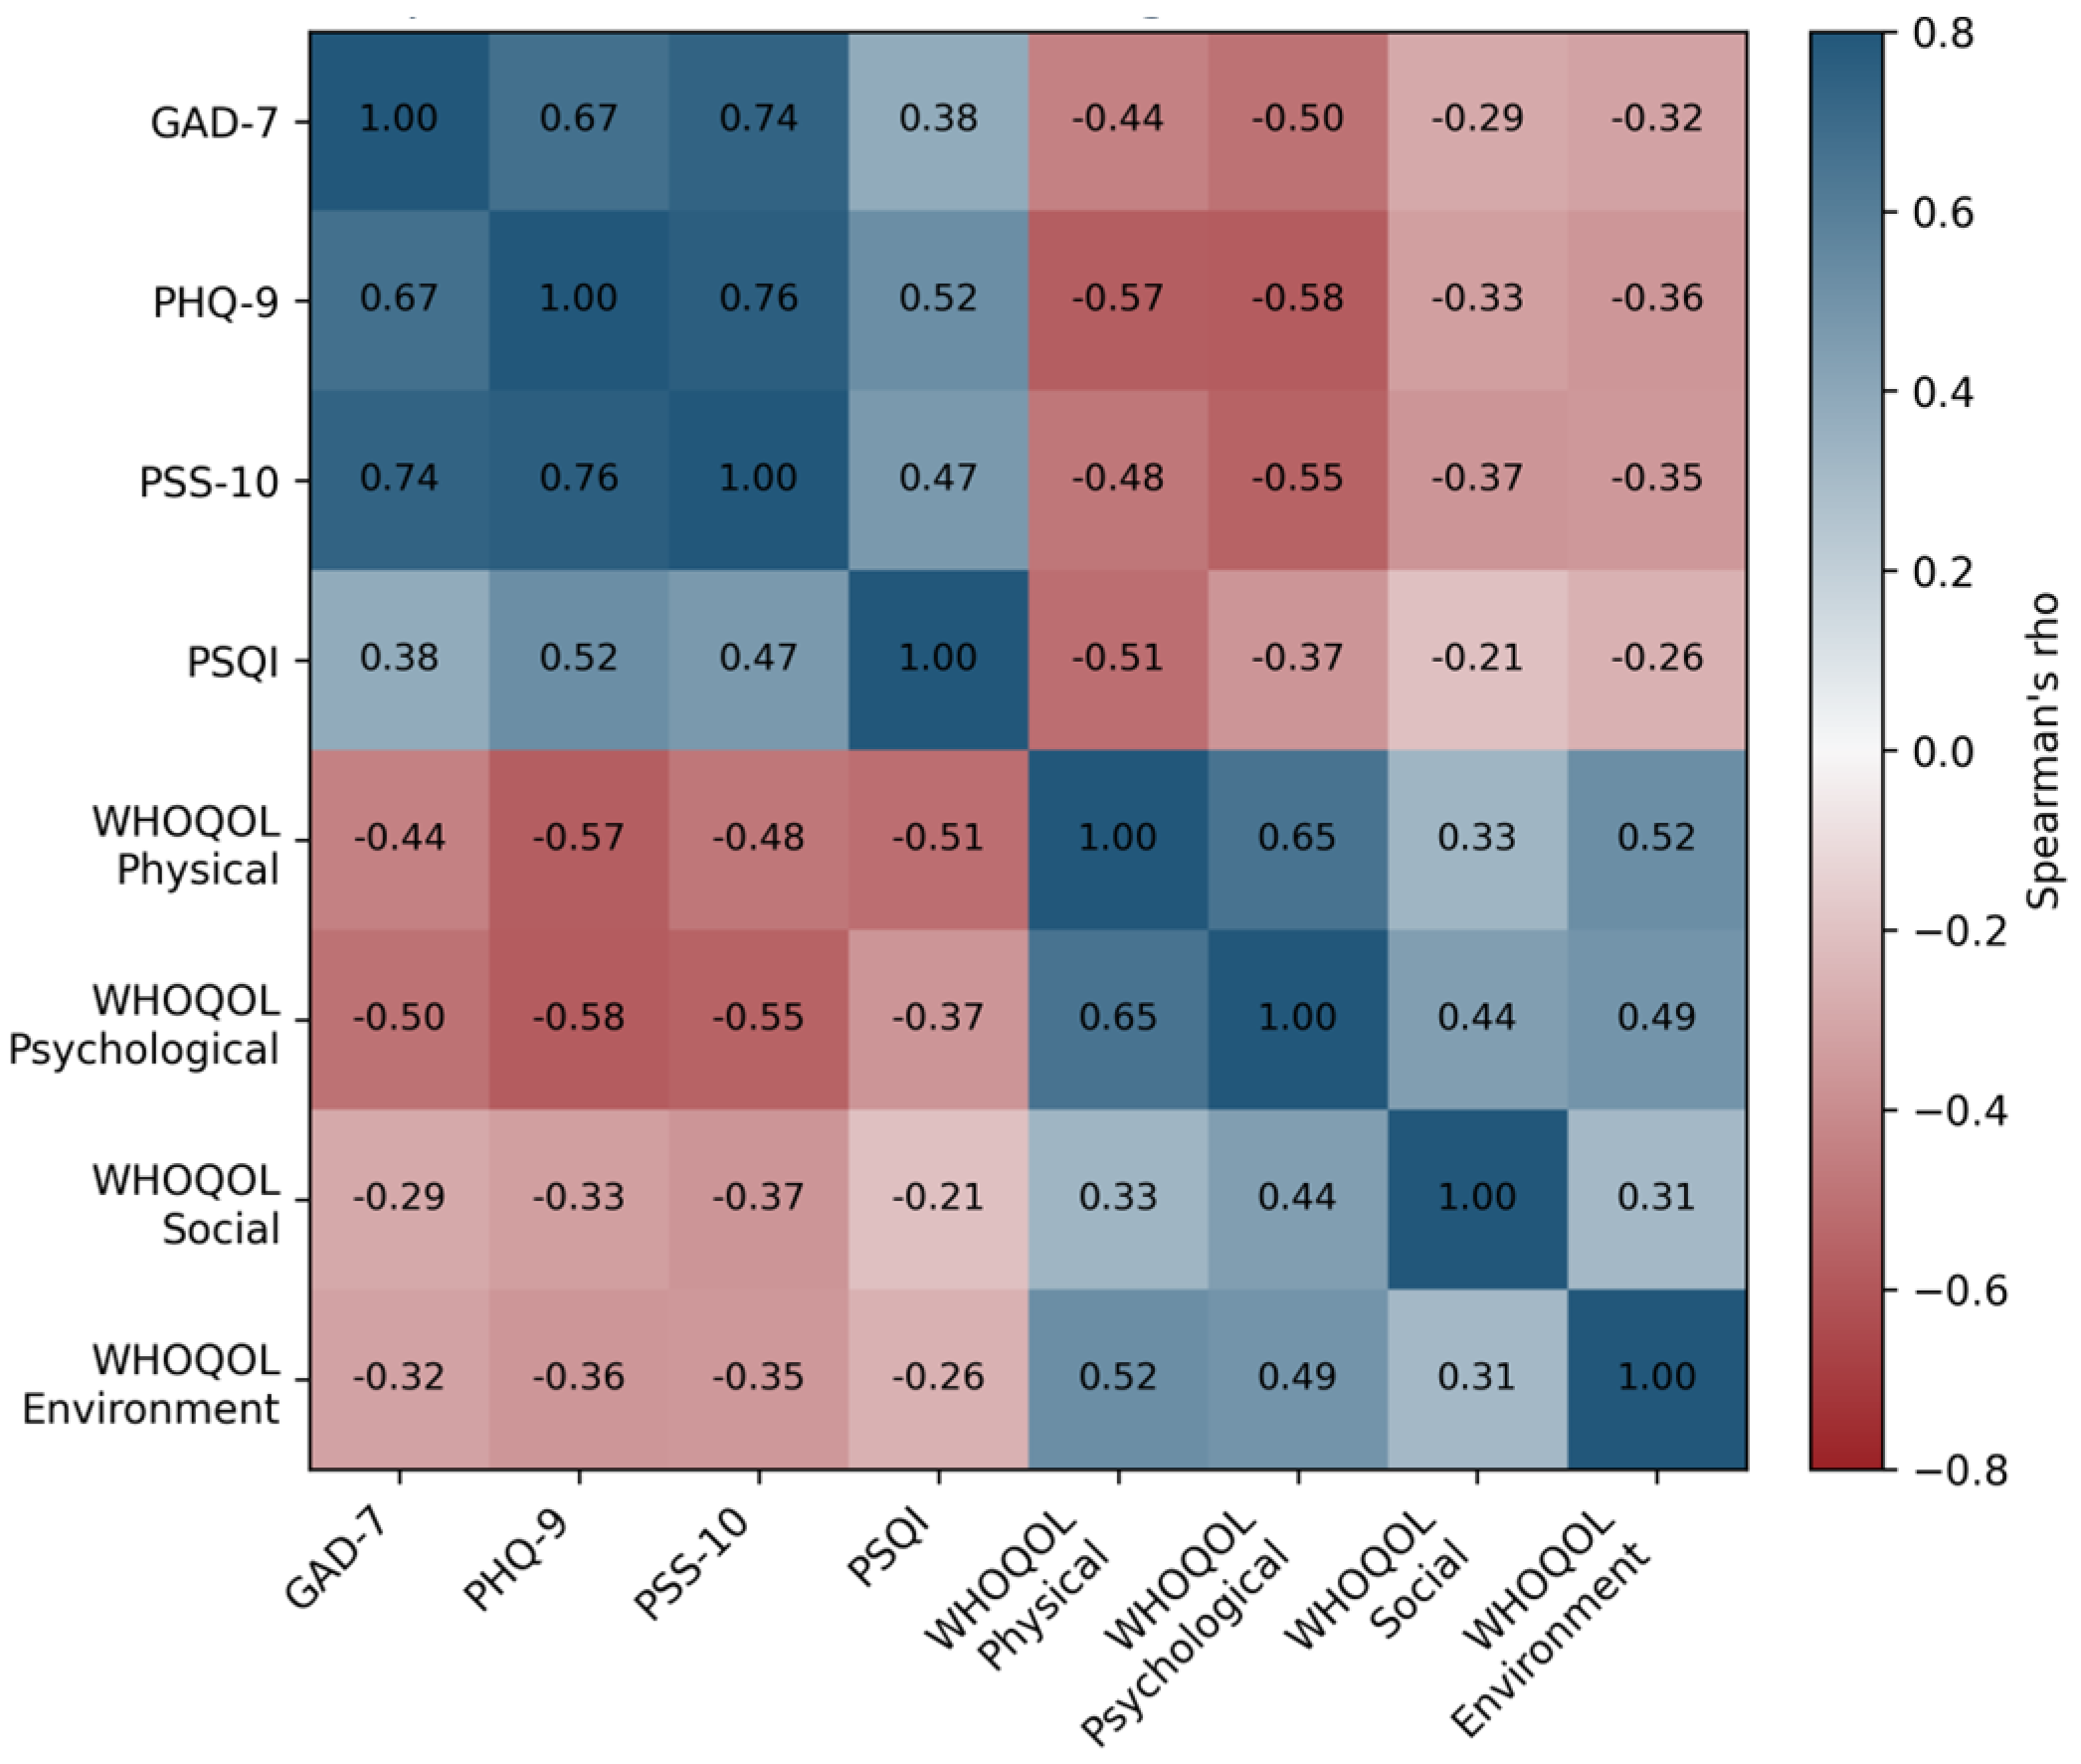
Associations among continuous baseline outcomes were examined using Spearman’s rank correlation coefficients. This non-parametric approach was selected because several measures were derived from ordinal items and some score distributions were expected to deviate from normality. Correlation analyses were used to characterize the direction and magnitude of associations among sleep quality, perceived stress, anxiety symptoms, depressive symptoms, and quality-of-life domains, and to assess whether the observed interrelationships were consistent with the expected multidimensional structure of psychophysical well-being.
To explore the multivariate structure of baseline burden beyond marginal outcome distributions, three complementary exploratory analyses were conducted on standardized continuous indicators expressed as z-scores. These indicators included PSQI, PSS-10, GAD-7, PHQ-9, and WHOQOL-BREF domain scores. Prior to analysis, all measures were oriented so that higher values consistently reflected worse well-being or greater symptom burden.
First, principal component analysis (PCA) was performed on the correlation matrix using orthogonal varimax rotation. PCA was used to evaluate whether the covariance structure of the baseline PROM battery was primarily driven by one or more latent dimensions. Component interpretation was based on the proportion of explained variance and the magnitude and direction of component loadings, with particular attention to whether a dominant general dimension of distress or burden accounted for the correlations among outcome domains.
Second, latent profile analysis (LPA) was implemented using Gaussian finite mixture modeling across a prespecified range of class solutions. Competing models were compared using information criteria, with particular emphasis on the Bayesian information criterion (BIC), while also considering profile size and substantive interpretability. Identified profiles were interpreted as descriptive patterns of baseline psychophysical burden, potentially reflecting increasing levels of overall burden, rather than as clinically defined subtypes.
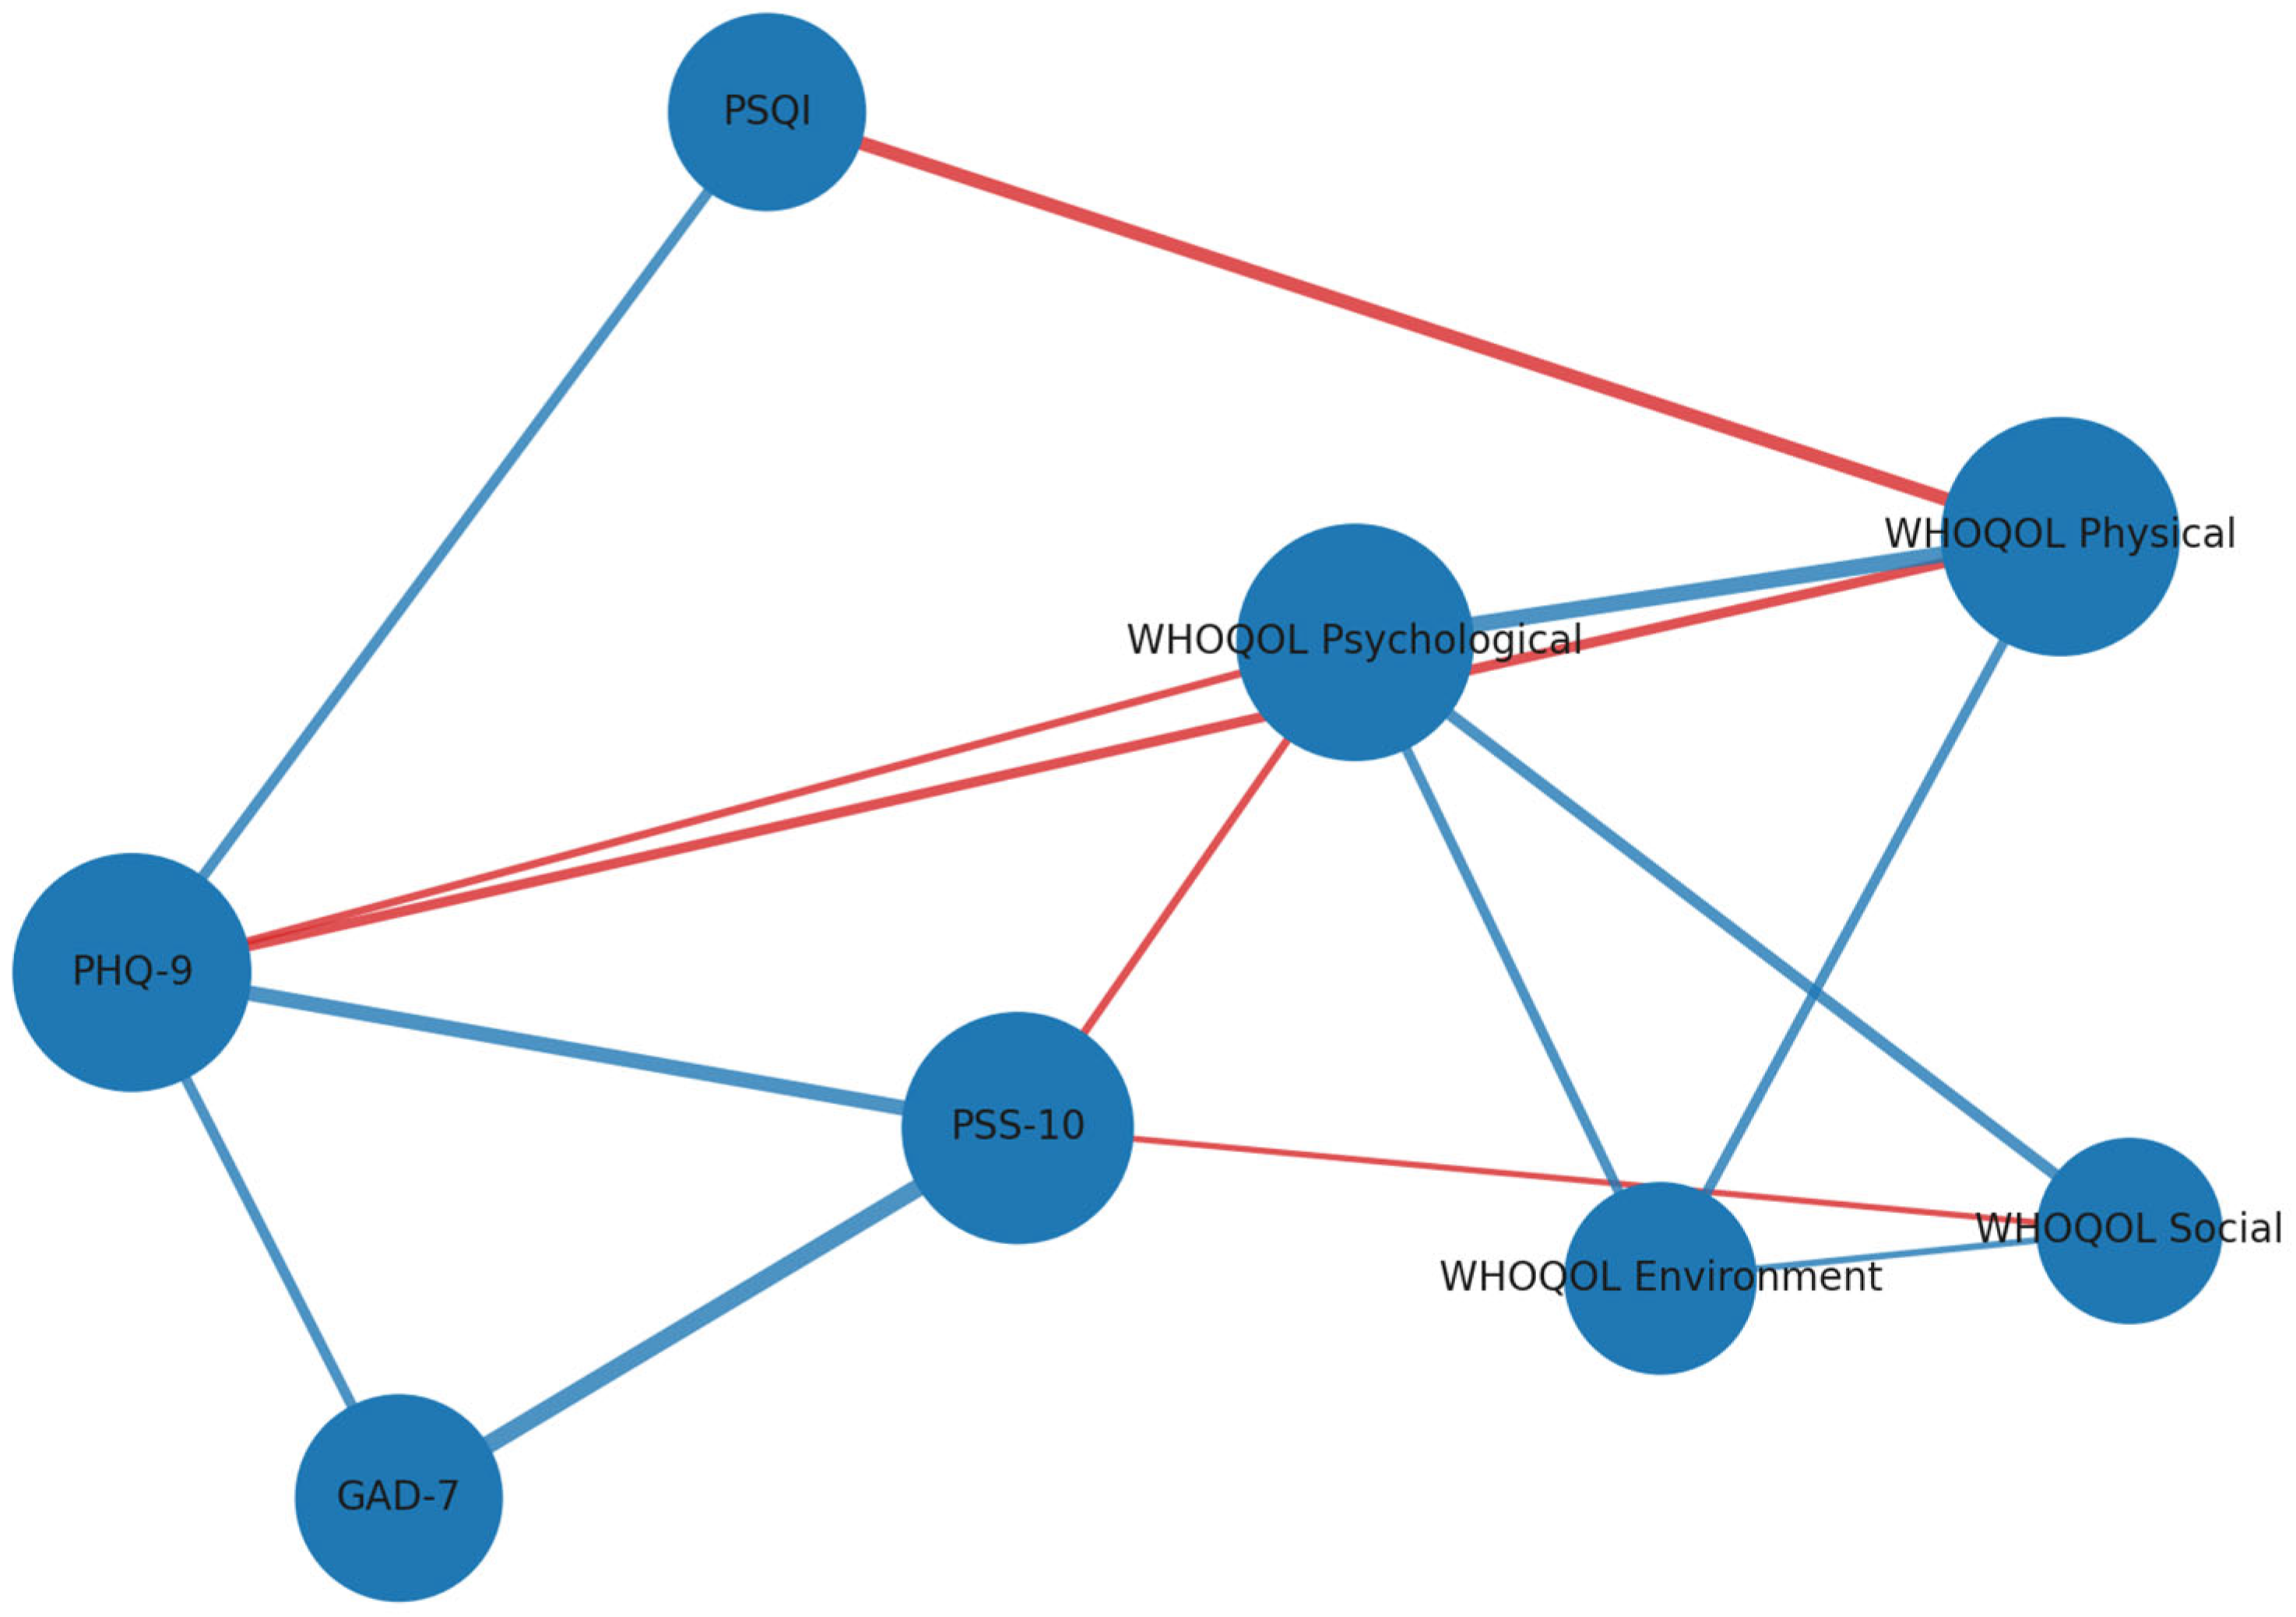
Third, network analysis was conducted using a Gaussian graphical model (GGM), in which nodes represented continuous baseline outcome scores and edges represented conditional associations between pairs of outcomes after controlling for all other variables in the network. Networks were estimated using the graphical least absolute shrinkage and selection operator (graphical LASSO), with extended BIC model selection via the EBICglasso procedure with γ = 0.5. Node strength centrality was examined to identify the most highly connected variables within the network, thereby highlighting outcome domains occupying a more central position in the overall psychophysical burden structure. Network results were interpreted descriptively, and no formal edge-weight or centrality stability analysis was used for confirmatory purposes.
All multivariate exploratory analyses were considered descriptive and hypothesis-generating rather than confirmatory. All statistical analyses were conducted in R, version 4.3 (R Foundation for Statistical Computing, Vienna, Austria).
For subsequent longitudinal assessments, including the pilot waves P0–P2 and the main study waves T0–T4, repeated binary outcomes, including PSQI > 5, GAD-7 ≥ 10, and PHQ-9 ≥ 10, will be analyzed using methods appropriate for correlated data, such as generalized estimating equations or mixed-effects generalized linear models, depending on the primary inferential objective and the observed data structure. Continuous repeated outcomes, including PSQI, PSS-10, GAD-7, PHQ-9, and WHOQOL-BREF domain scores, will be analyzed using linear mixed-effects models with participant-specific random intercepts and, where supported by the data, random slopes for time.
In the primary longitudinal analyses, time will be modeled categorically to allow for potentially non-linear changes across academically meaningful assessment waves. Prespecified contrasts will compare each follow-up wave with baseline. Additional analyses will examine whether trajectories differ across predefined baseline subgroups by including time-by-covariate interaction terms.
Attrition and missingness will be described explicitly at each wave. Retained and non-retained participants will be compared with respect to baseline characteristics and outcome distributions. The primary analytical approach will rely on likelihood-based repeated-measures modeling under a missing-at-random assumption, thereby allowing all available observations to contribute to the analysis. Should dropout patterns suggest potentially informative nonresponse, sensitivity analyses will be conducted using inverse-probability weighting and, where appropriate, multiple imputation or alternative pattern-based strategies.

2.2. DiCoBENE Web-App

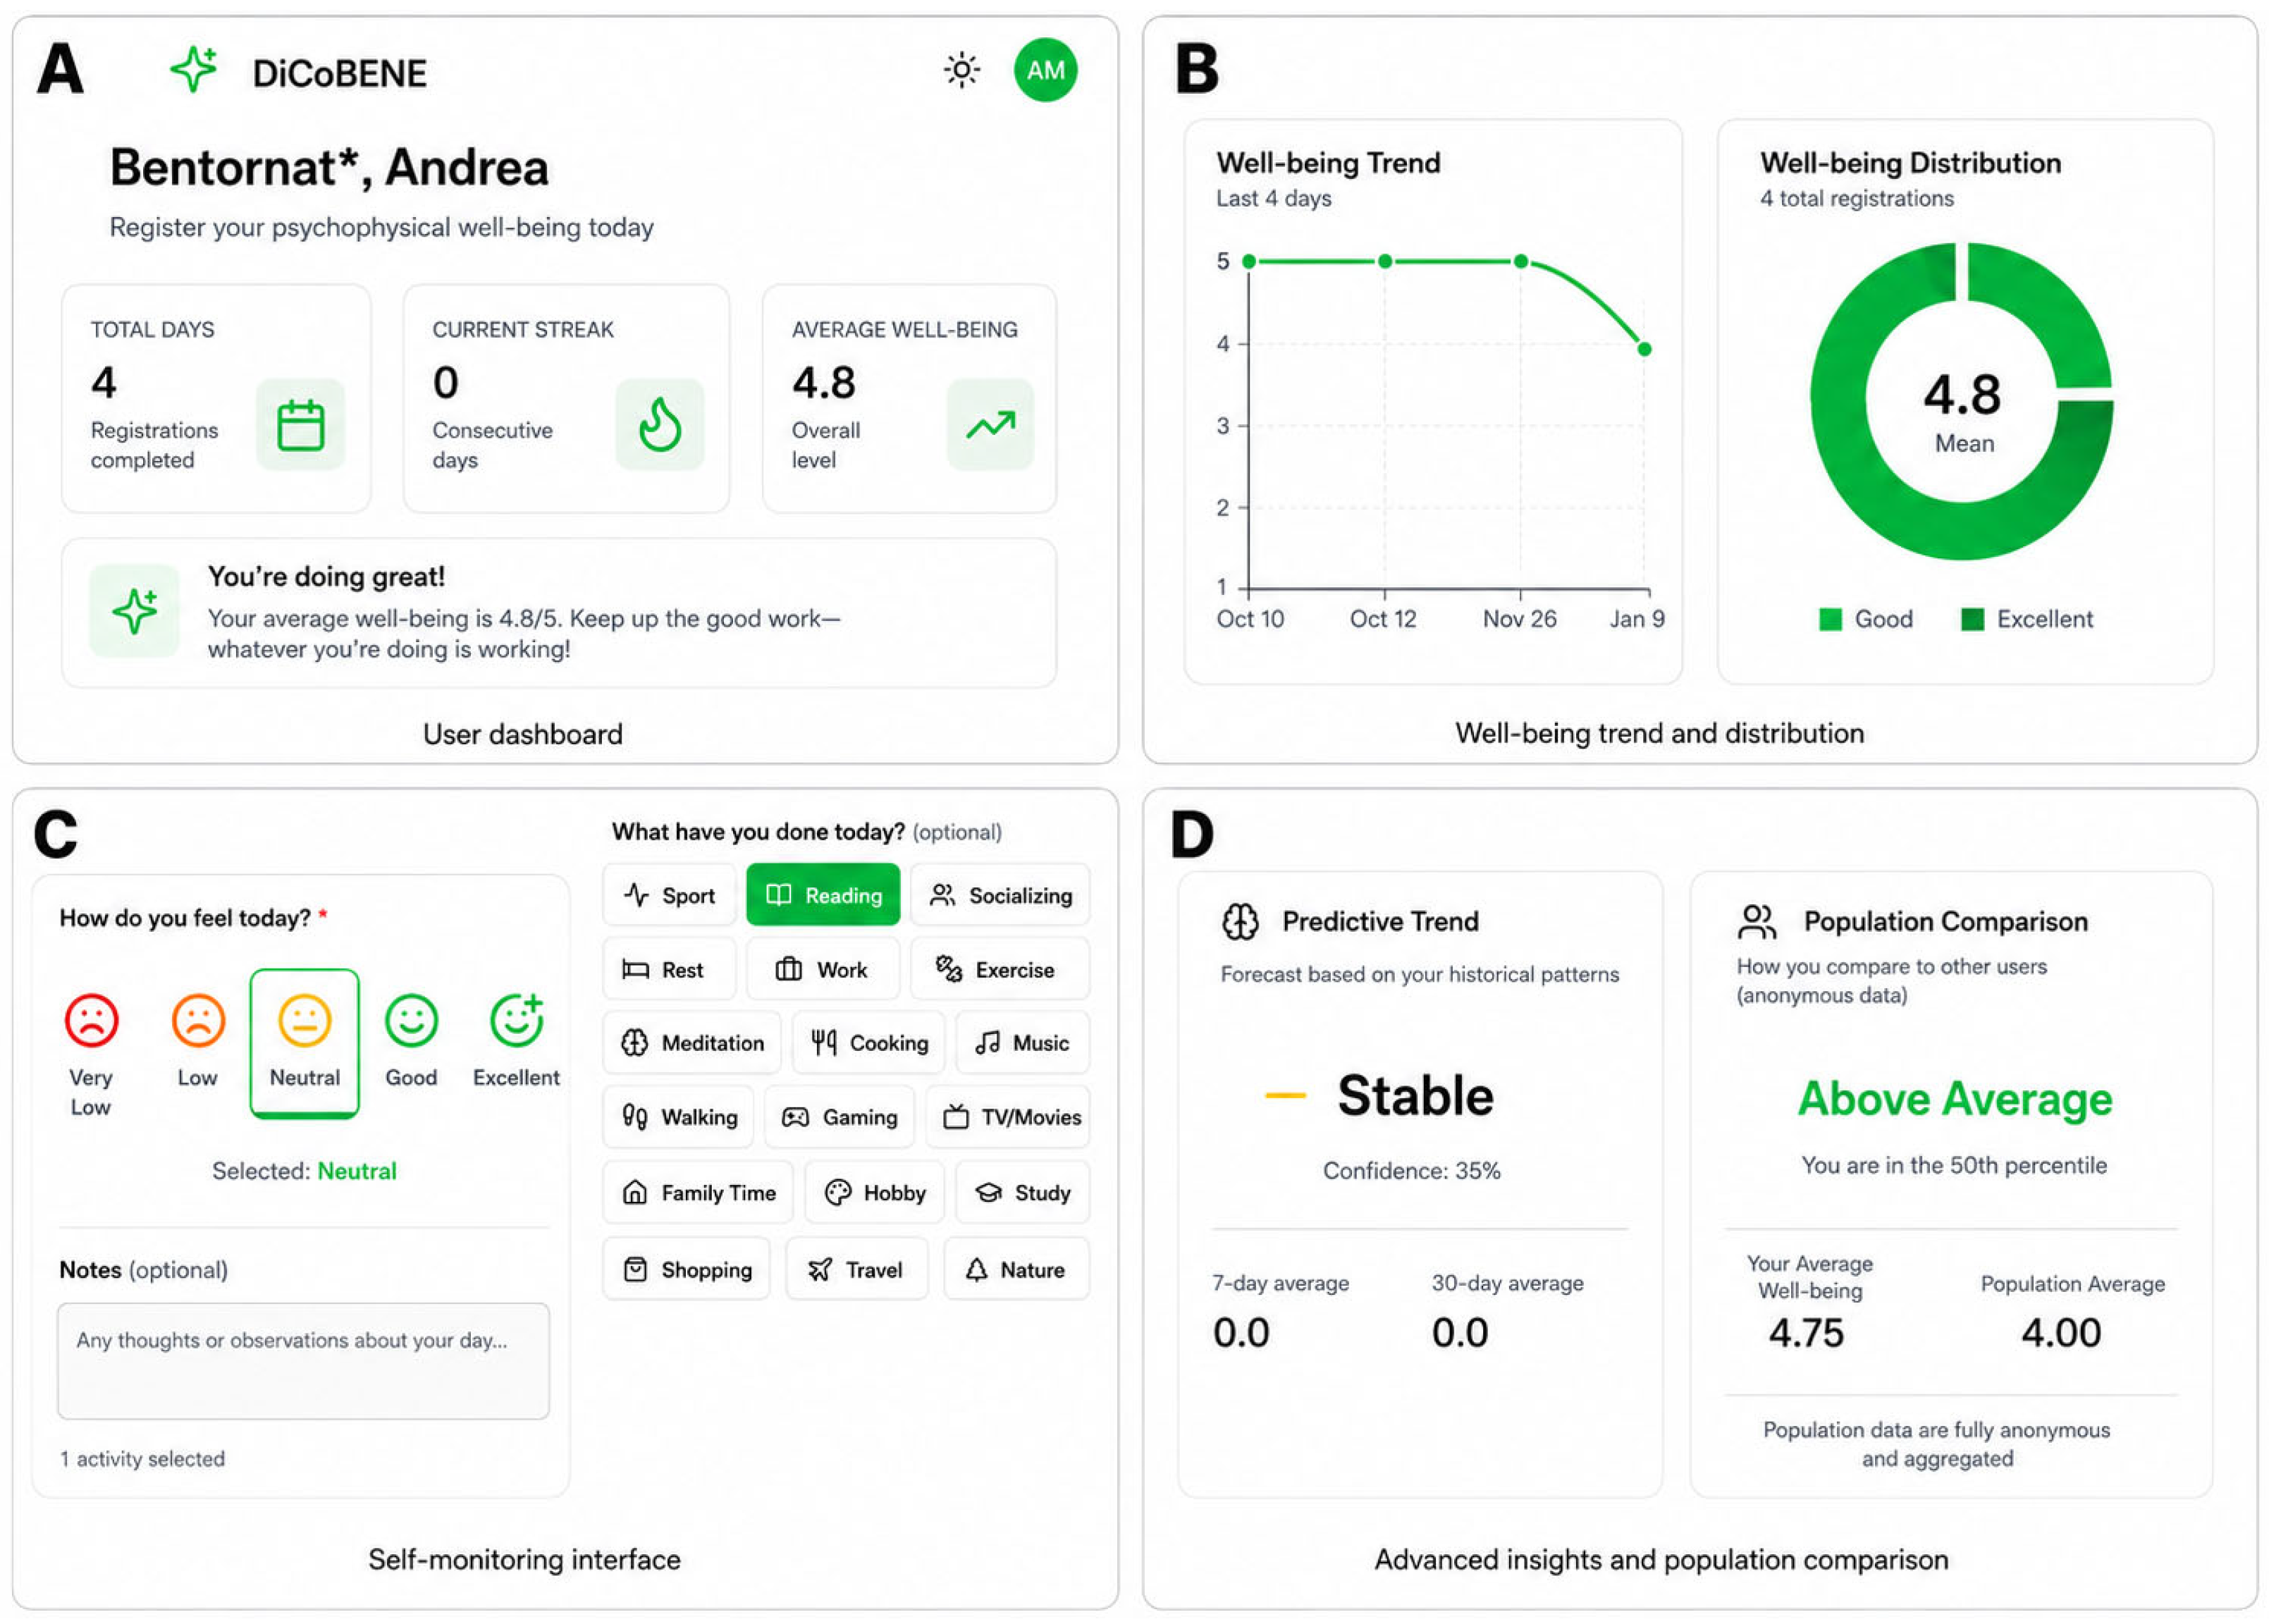
The DiCoBENE web application was developed to support the ecological momentary assessment of daily well-being and activity context, thereby enabling data collection at a higher temporal resolution than that achievable through wave-based PROM assessments. The application enables registered users to submit one entry per day, comprising a five-point Likert self-rated well-being score, activity selections from a predefined and standardized set, and optional free-text notes. Figure 2 summarizes the participant-facing workflow and the main functions of the tool.
The platform is implemented as a progressive web application (PWA), with a React 18.3.1/TypeScript 5.6.3 frontend, an Express.js 4.21.2 backend, and a PostgreSQL 16.10 database. A database-level unique constraint enforces the submission of no more than one entry per user per day. Authentication is session-based, with passwords protected through bcrypt hashing, and personally identifying information is separated from research data through the use of anonymization identifiers assigned at registration. The application also includes a participant-facing analytics dashboard and an administrative interface enabling aggregated, anonymized data export in CSV and JSON formats. The tool is optimized for mobile use, supports offline functionality, and allows configurable push-notification reminders.
Participation in the ecological momentary assessment component is optional and will be evaluated within a predefined subgroup in terms of feasibility, including enrollment, adherence, and missingness, as well as usability, acceptability, and harmonization with the wave-based PROM framework. Any broader integration of the tool will be implemented in a staged manner and will remain contingent upon pilot findings and relevant governance approvals.

3. Results

3.1. Analytic Sample and Completion

Overall, 463 students agreed to participate, and 442 additionally provided consent for data processing, thereby constituting the analytic dataset. Within this cohort, 398 participants completed the sociodemographic module, corresponding to 85.8% of those invited and 90.0% of those who consented to data processing. Completion of the core PROM battery was 372 for the GAD-7, PSS-10, and WHOQOL-BREF domain scores, 371 for the PHQ-9, and 370 for the PSQI. These figures correspond to 80.2%, 80.2%, and 79.7% of invited students, respectively, and to 84.2%, 83.9%, and 83.7% of students who consented to data processing. Thus, completion across the core PROM modules indicates that missingness was concentrated primarily at the module level rather than at the item level within completed questionnaires.

3.2. Participant Characteristics

Among participants with available sociodemographic data (n = 398), the sample had a mean age of 21.3 years (SD 3.8; median 20, IQR 20–21) and was predominantly female (59.0%). Most respondents attended mainly in person (95.7%), and did not report paid work during the academic year (79.5%). Housing and commuting patterns were heterogeneous, whereas indicators of marked family economic difficulty were less frequent. Table 1 summarizes the baseline sample profile.

3.3. Baseline Scale Distributions, Completion Rates, and Threshold Prevalence

Mean baseline scores were 9.76 (SD 5.13) for GAD-7, 7.33 (SD 4.66) for PHQ-9, 19.34 (SD 8.68) for PSS-10, and 6.78 (SD 3.27) for the PSQI global score. WHOQOL-BREF domain means were 69.7 (SD 13.6) for the physical domain, 60.1 (SD 16.2) for the psychological domain, 65.1 (SD 16.9) for the social domain, and 61.8 (SD 13.7) for the environment domain. Threshold-based prevalence estimates indicated poor sleep quality in 58.8%, moderate-to-severe anxiety symptoms in 46.0%, moderate-to-severe depressive symptoms in 29.5%, moderate perceived stress in 54.0%, and high perceived stress in 19.8% of participants.

3.4. Internal Consistency and Scale Performance

Internal consistency was good for GAD-7 (alpha = 0.877, omega = 0.881), PHQ-9 (0.818 and 0.820), and PSS-10 (0.929 and 0.931). Reliability was moderate for the PSQI (alpha = 0.654, omega = 0.681). Within WHOQOL-BREF, the physical, psychological, and environment domains showed acceptable to good internal consistency, whereas the social domain was weaker, as is common for very short three-item subscales (Table 2).

3.5. Correlation Pattern

Cross-sectional associations were internally coherent and clinically plausible (Figure 3). Perceived stress correlated strongly with depressive symptoms (Spearman’s rho = 0.759) and anxiety symptoms (rho = 0.736), while anxiety and depressive symptoms were also strongly interrelated (rho = 0.671). Poorer sleep quality correlated with depressive symptoms (rho = 0.522) and with lower physical quality of life (rho = −0.507). Depressive symptoms correlated inversely with WHOQOL-BREF psychological (rho = −0.578) and physical (rho = −0.571) domains, supporting a coherent burden structure across symptom and functioning measures.

3.6. Latent Profile Analysis, Principal Component Analysis, and Network Analysis

To characterize baseline heterogeneity beyond univariate summaries and pairwise correlations, multivariate analyses were performed on 365 complete baseline observations with non-missing values for the PSQI, PSS-10, GAD-7, PHQ-9, and the four WHOQOL-BREF domains. Latent profile analysis favored a four-profile solution with the lowest BIC (5000.3) and a mean maximum posterior assignment probability of 0.923. The resulting profiles were interpretable as an ordered gradient of multidimensional burden rather than as sharply distinct symptom phenotypes, comprising 50 low-burden participants (13.7%), 150 mild-burden participants (41.1%), 115 moderate-burden participants (31.5%), and 50 high-burden participants (13.7%).
Principal component analysis reinforced this interpretation. The first principal component explained 55.6% of the total variance, while the first two components together explained 67.4%, indicating that most baseline heterogeneity was captured by a common distress/poor well-being dimension. The largest absolute loadings on the first component were observed for PHQ-9 (0.410), WHOQOL-BREF psychological (0.390), WHOQOL-BREF physical (0.388), and PSS-10 (0.386). Graphical lasso network analysis yielded a sparse but clinically coherent partial-correlation structure in which the most central nodes were WHOQOL-BREF physical (strength 1.124), PHQ-9 (1.119), WHOQOL-BREF psychological (1.098), and PSS-10 (1.018). The strongest non-trivial edges linked PSS-10 with GAD-7 (0.459), WHOQOL-BREF physical with WHOQOL-BREF psychological (0.398), and PSS-10 with PHQ-9 (0.365) (Figure 4).

4. Discussion

The DiCoBENE study was designed as a web-based repeated-measures cohort for monitoring student well-being under explicit measurement and reporting standards. The present manuscript extends the protocol by showing that baseline web-based administration can yield interpretable psychometric evidence, coherent cross-sectional associations, and multivariate characterization of heterogeneity across symptom and quality-of-life domains. In this sense, the study is aligned with recent guidance that treats digital PROM implementation as both a measurement challenge and an analytical opportunity rather than a purely logistical solution [4,5,6,7,8].
The baseline findings indicate a substantial burden of poor sleep quality, perceived stress, anxiety symptoms, and depressive symptoms in this healthcare-track student population. The observed prevalence of poor sleep quality was close to, although slightly higher than, the 54.6% reported in the Italian multicenter UnSleep study [13]. The frequencies of moderate-to-severe anxiety and depressive symptoms were also within the upper range reported in university and healthcare-student samples from recent evidence syntheses [10,11,12]. These data support the substantive relevance of repeated web-based monitoring in this population.
From a psychometric standpoint, the digital administration performed well for most instruments. GAD-7, PHQ-9, and PSS-10 showed good-to-excellent internal consistency, while the PSQI was more modest but still acceptable for group-level descriptive and analytical use. This pattern is consistent with methodological recommendations emphasizing that digital PROM migration should be evaluated not only for feasibility but also for comparability, reliability, and transparent reporting of implementation conditions [4,5,6,7,8,26]. The broad pattern of Spearman correlations was clinically coherent, with stress, anxiety, depressive symptoms, and sleep difficulties clustering together and tracking inversely with multiple domains of quality of life.
The exploratory multivariate analyses add an important interpretive layer for web-based outcome analysis. Model-based latent profile analysis favored a four-profile solution ordered from low to high multidimensional burden. Principal component analysis showed that more than half of the total variance was captured by a single general burden component, and the partial-correlation network identified perceived stress, depressive symptoms, and the physical and psychological quality-of-life domains as the most central elements of the baseline symptom-functioning system. Taken together, these findings suggest that baseline heterogeneity is driven primarily by a graded burden continuum rather than by sharply separated phenotypes. However, these analyses were explicitly hypothesis-generating and should not be interpreted as establishing stable clinical subtypes or definitive network architecture. Rather, they provide a structured baseline summary that may inform future longitudinal modeling [3].
The manuscript’s main contribution therefore lies not in the isolated use of classical PROMs in students, which is already well established, but in the integration of evidence-informed web-based PROM selection, protocol-level repeated-measures design, pilot baseline psychometric evaluation, and exploratory multivariate characterization within a single cohort framework. Rather than presenting the web-based environment merely as a delivery channel, the study treats it as a measurement-explicit analytical setting in which completion, comparability, burden, and multidimensional outcome structure can be examined jointly. This is the aspect by which DiCoBENE advances beyond many descriptive cohort or digital survey studies.
The longitudinal phase remains central to the design. Because baseline burden was already well summarized by a dominant latent dimension, future analyses will be able to examine both changes in individual PROMs and changes in broader multidimensional burden across academically meaningful time points. The protocol also includes operational features intended to support retention, including recontact consent, reminder procedures, low-burden repeated measures, and participant feedback during the pilot phase. These elements are particularly relevant because sustained engagement is critical for the long-term success of web-based cohort designs and for the interpretability of wave-to-wave change [9,27,28].
This study has several limitations. First, the present report is based on a single-center pilot sample from one Italian university and is largely composed of healthcare-track students, limiting generalizability to other institutions and student populations. Second, the baseline design is cross-sectional and therefore does not permit temporal or causal inference regarding the relationships among sleep, stress, anxiety, depression, and quality of life. Third, although completion rates for the main PROMs were acceptable, the multivariate analyses were based on complete cases only, which may have introduced selection effects if participants with missing data differed systematically from those with complete responses. Fourth, all measures were self-reported and digitally administered, leaving the findings subject to the usual limitations of PROM-based assessment, including reporting bias, recall bias, and mode-related influences linked to the digital environment. Fifth, the exploratory latent profile, principal component, and network analyses were not intended as confirmatory models; no inferential claims are made regarding stable subtypes or network mechanisms, and further replication in larger and more heterogeneous samples will be needed. Finally, because this report is limited to pilot baseline data, it cannot yet address within-person change, transition between burden states, or the stability of the observed burden continuum over time.
Even with these limitations, the internal consistency across descriptive, psychometric, correlational, and exploratory multivariate analyses supports the coherence of the digital baseline assessment and provides a methodologically informative basis for the longitudinal development of the cohort.

5. Conclusions

Web-based repeated-measures cohorts are an important infrastructure for epidemiological and behavioral research on dynamic outcomes such as sleep quality, perceived stress, mood symptoms, and quality of life. In the DiCoBENE pilot baseline, the integration of completion profiling, descriptive burden estimates, internal-consistency assessment, Spearman correlation analysis, LPA, PCA, and network analysis showed that the web-administered PROM battery generated data that were not only feasible to collect, but also psychometrically coherent and clinically interpretable.
At this exploratory baseline stage, heterogeneity in student well-being was more parsimoniously summarized as a graded multidimensional burden continuum than as a set of sharply separated phenotypes. Overall, the present findings support the use of DiCoBENE as a methodologically grounded framework for longitudinal web-based assessment and for the study of temporal changes, burden trajectories, and multidimensional well-being patterns in university students.

Author Contributions

Conceptualization, A.M., M.B., and A.A.; methodology, A.M.; software, A.M.; formal analysis, A.M., M.B., and A.A.; investigation, A.M., M.B., and A.A.; resources, A.M.; data curation, A.M., M.B., and A.A.; writing—original draft preparation, A.M.; writing—review and editing, A.M., M.B., and A.A.; visualization, A.M.; supervision, A.A.; project administration, A.M.; funding acquisition, A.M. All authors have read and agreed to the published version of the manuscript.

Funding

This research was funded by the University of Catania under the PIano di inCEntivi per la RIcerca di Ateneo (PIACERI), Linea di Intervento 3 Starting Grant.

Institutional Review Board Statement

The study was conducted in accordance with the Declaration of Helsinki, and approved by the Catania 1 Ethics Committee (approval code: 14/2026/PAR; date of approval: 17 March 2026).

Informed Consent Statement

Informed consent was obtained from all subjects involved in the study.

Data Availability Statement

The data presented in this study are available on request from the corresponding author due to privacy and ethical restrictions.

Conflicts of Interest

The authors declare no conflicts of interest.

References

  1. Afonso, P.; Fonseca, M.; Teodoro, T. Evaluation of anxiety, depression and sleep quality in full-time teleworkers. J. Public Health 2022, 44, 797–804. [Google Scholar] [CrossRef] [PubMed]
  2. Alwhaibi, M.; Al Aloola, N.A. Associations between stress, anxiety, depression and sleep quality among healthcare students. J. Clin. Med. 2023, 12, 4340. [Google Scholar] [CrossRef]
  3. Li, W.; Huo, S.; Yin, F.; Wu, Z.; Zhang, X.; Wang, Z.; Cao, J. The differences in symptom networks of depression, anxiety, and sleep in college students with different stress levels. BMC Public Health 2024, 24, 3609. [Google Scholar] [CrossRef]
  4. Coons, S.J.; Gwaltney, C.J.; Hays, R.D.; Lundy, J.J.; Sloan, J.A.; Revicki, D.A.; Lenderking, W.R.; Cella, D.; Basch, E.; ISPOR ePRO Task Force. Recommendations on evidence needed to support measurement equivalence between electronic and paper-based patient-reported outcome measures. Value Health 2009, 12, 419–429. [Google Scholar] [CrossRef]
  5. Eremenco, S.; Coons, S.J.; Paty, J.; Coyne, K.; Bennett, A.; McEntegart, D. PRO data collection in clinical trials using mixed modes. Value Health 2014, 17, 501–516. [Google Scholar] [CrossRef]
  6. U.S. Food and Drug Administration. Patient-Reported Outcome Measures: Use in Medical Product Development to Support Labeling Claims: Guidance for Industry; U.S. Food and Drug Administration: Silver Spring, MD, USA, 2009. Available online: https://www.fda.gov/regulatory-information/search-fda-guidance-documents/patient-reported-outcome-measures-use-medical-product-development-support-labeling-claims (accessed on 28 April 2026).
  7. O’Donohoe, P.; Reasner, D.S.; Kovacs, S.M.; Byrom, B.; Eremenco, S.; Barsdorf, A.I.; Arnera, V.; Coons, S.J. Updated recommendations on evidence needed to support measurement comparability among modes of data collection for patient-reported outcome measures. Value Health 2023, 26, 623–633. [Google Scholar] [CrossRef]
  8. Mowlem, F.D.; Elash, C.A.; Dumais, K.M.; Haenel, E.; O’Donohoe, P.; Olt, J.; Kalpadakis-Smith, A.V.; James, B.; Balestrieri, G.; Becker, K.; et al. Best practices for the electronic implementation and migration of patient-reported outcome measures. Value Health 2024, 27, 79–94. [Google Scholar] [CrossRef] [PubMed]
  9. Eysenbach, G. The law of attrition. J. Med. Internet Res. 2005, 7, e11. [Google Scholar] [CrossRef]
  10. Li, W.; Zhao, Z.; Chen, D.; Peng, Y.; Lu, Z. Prevalence and associated factors of depression and anxiety symptoms among college students. J. Child Psychol. Psychiatry 2022, 63, 1222–1230. [Google Scholar] [CrossRef] [PubMed]
  11. Rotenstein, L.S.; Ramos, M.A.; Torre, M.; Segal, J.B.; Peluso, M.J.; Guille, C.; Sen, S.; Mata, D.A. Prevalence of depression, depressive symptoms, and suicidal ideation among medical students. JAMA 2016, 316, 2214–2236. [Google Scholar] [CrossRef]
  12. Rao, W.-W.; Li, W.; Qi, H.; Hong, L.; Chen, C.; Li, C.Y.; Ng, C.H.; Ungvari, G.S.; Xiang, Y.-T. Sleep quality in medical students: A comprehensive meta-analysis of observational studies. Sleep Breath. 2020, 24, 1151–1165. [Google Scholar] [CrossRef] [PubMed]
  13. Galle, F.; Grassi, F.; Valeriani, F.; Albertini, R.; Angelillo, S.; Caggiano, G.; Bargellini, A.; Bianco, A.; Bianco, L.; Dallolio, L.; et al. Sleep quality among Italian university students: The UnSleep multicenter study. Ann. Di Ig. 2025, 37, 141–153. [Google Scholar] [CrossRef]
  14. Buysse, D.J.; Reynolds, C.F.; Monk, T.H.; Berman, S.R.; Kupfer, D.J. The Pittsburgh Sleep Quality Index: A new instrument for psychiatric practice and research. Psychiatry Res. 1989, 28, 193–213. [Google Scholar] [CrossRef]
  15. Zhong, Q.; Gelaye, B.; Sanchez, S.; Williams, M.A. Psychometric properties of the Pittsburgh Sleep Quality Index in a cohort of Peruvian pregnant women. J. Clin. Sleep Med. 2015, 11, 869–877. [Google Scholar] [CrossRef]
  16. Raniti, M.B.; Waloszek, J.M.; Schwartz, O.; Allen, N.B.; Trinder, J. Factor structure and psychometric properties of the Pittsburgh Sleep Quality Index in community-based adolescents. Sleep 2018, 41, zsy066. [Google Scholar] [CrossRef]
  17. Cohen, S.; Kamarck, T.; Mermelstein, R. A global measure of perceived stress. J. Health Soc. Behav. 1983, 24, 385–396. [Google Scholar] [CrossRef] [PubMed]
  18. Du, X.; Liu, X.; Zhao, Y.; Wang, S. Psychometric testing of the 10-item Perceived Stress Scale for Chinese nurses. BMC Nurs. 2023, 22, 430. [Google Scholar] [CrossRef]
  19. Herrero, J.; Meneses, J. Short web-based versions of the Perceived Stress and Center for Epidemiological Studies-Depression scales: A comparison to pencil and paper responses among internet users. Comput. Hum. Behav. 2006, 22, 830–846. [Google Scholar] [CrossRef]
  20. Wijndaele, K.; Matton, L.; Duvigneaud, N.; Lefevre, J.; De Bourdeaudhuij, I.; Duquet, W. Reliability, equivalence and respondent preference of computerized versus paper-and-pencil mental health questionnaires. Comput. Hum. Behav. 2007, 23, 1958–1970. [Google Scholar] [CrossRef]
  21. Barrigon, M.L.; Rico-Romano, A.M.; Ruiz-Gomez, M.; Delgado-Gomez, D.; Barahona, I.; Aroca, F.; Baca-Garcia, E.; MEmind Study Group. Comparative study of pencil-and-paper and electronic formats of GHQ-12, WHO-5 and PHQ-9 questionnaires. Rev. Psiquiatr. Salud Ment. 2017, 10, 160–167. [Google Scholar] [CrossRef]
  22. Whitehead, L. Methodological issues in internet-mediated research: A randomized comparison of internet versus mailed questionnaires. J. Med. Internet Res. 2011, 13, e109. [Google Scholar] [CrossRef]
  23. Cronly, J.; Duff, A.J.; Riekert, K.A.; Horgan, A.; Lehane, E.; Howe, B.A.; Ni Chroinin, M.; Savage, E. Online versus paper-based screening for depression and anxiety in adults with cystic fibrosis in Ireland. BMJ Open 2018, 8, e019305. [Google Scholar] [CrossRef]
  24. Skevington, S.M.; Lotfy, M.; O’Connell, K.A. The World Health Organization’s WHOQOL-BREF quality of life assessment: Psychometric properties and results of the international field trial. Qual. Life Res. 2004, 13, 299–310. [Google Scholar] [CrossRef] [PubMed]
  25. Shahraz, S.; Pham, T.P.; Gibson, M.; De La Cruz, M.; Baara, M.; Karnik, S.; Dell, C.; Pease, S.; Nigam, S.; Cappelleri, J.C.; et al. Does scrolling affect measurement equivalence of electronic patient-reported outcome measures? J. Patient-Rep. Outcomes 2021, 5, 23. [Google Scholar] [CrossRef] [PubMed]
  26. Gagnier, J.J.; Lai, J.; Mokkink, L.B.; Terwee, C.B. COSMIN reporting guideline for studies on measurement properties of patient-reported outcome measures. Qual. Life Res. 2021, 30, 2197–2218. [Google Scholar] [CrossRef] [PubMed]
  27. Shiffman, S.; Stone, A.A.; Hufford, M.R. Ecological momentary assessment. Annu. Rev. Clin. Psychol. 2008, 4, 1–32. [Google Scholar] [CrossRef]
  28. Shiffman, S. Conceptualizing analyses of ecological momentary assessment data. Nicotine Tob. Res. 2014, 16, S76–S87. [Google Scholar] [CrossRef]
Figure 1. Overview of the DiCoBENE repeated-measures cohort design across pilot and main study phases.
Information 17 00531 g001
Figure 2. Representative screenshots of the DiCoBENE ecological momentary assessment web application. (A) User dashboard summarizing the number of completed assessments, current streak, average well-being score, and personalized feedback. (B) Well-being analytics section showing longitudinal trends across assessments and the distribution of recorded well-being levels. (C) Ecological momentary assessment interface used for daily self-monitoring, including mood selection, activity tagging, and optional free-text notes. (D) Advanced insights section displaying predictive well-being trends and anonymized population-level comparison.
Information 17 00531 g002
Figure 3. Spearman correlations among baseline outcomes.
Information 17 00531 g003
Figure 4. Partial-correlation network of baseline outcomes. Nodes represent continuous baseline outcome scores, and edges represent conditional associations after adjustment for all other variables in the network. Thicker edges indicate stronger associations.
Information 17 00531 g004
Table 1. Baseline participant characteristics among respondents with completed sociodemographic data (n = 398).
CharacteristicValue
Age, mean (SD)21.3 (3.8)
Age, median (IQR)20 (20–21)
Sex
 Female236 (59.0%)
 Male163 (41.0%)
Attendance mode
 In person381 (95.7%)
 Mixed69 (2.2%)
 Mostly remote7 (1.8%)
 Prefer not to answer2 (0.4%)
Paid work during academic year
 No316 (79.5%)
 Yes, occasional49 (12.2%)
 Yes, part-time23 (5.8%)
 Yes, full-time7 (1.8%)
 Prefer not to answer3 (0.7%)
Housing during lectures
 With family of origin182 (45.7%)
 With roommates187 (47.1%)
 Living alone17 (4.3%)
 University residence23 (0.7%)
 Other7 (1.8%)
 Prefer not to answer2 (0.4%)
Commute time
 <15 min83 (20.9%)
 15–30 min192 (48.2%)
 31–60 min90 (22.7%)
 61–90 min23 (5.8%)
 >90 min9 (2.2%)
 Prefer not to answer2 (0.4%)
Family economic situation
 Very good57 (14.4%)
 Good218 (54.7%)
 Adequate93 (23.4%)
 Difficult24 (6.1%)
 Prefer not to answer4 (1.1%)
Difficulty covering essential expenses (past year)
 Never246 (61.9%)
 Rarely105 (26.3%)
 Sometimes33 (8.3%)
 Often4 (1.1%)
 Prefer not to answer9 (2.2%)
Table 2. Internal consistency of digitally administered PROMs at baseline.
Scale/DomainCronbach αOmega ωCorrected Item-Total r (Range)α If Item Deleted (Range)
GAD-70.8770.8810.527–0.7830.843–0.876
PHQ-90.8180.8200.292–0.6320.785–0.822
PSS-10 total score0.9290.9310.627–0.7890.919–0.927
PSQI components0.6540.6810.176–0.5720.580–0.680
WHOQOL Physical0.7190.8060.267–0.6110.645–0.722
WHOQOL Psychological0.7910.8520.484–0.6460.734–0.773
WHOQOL Social0.4380.7290.098–0.4310.051–0.653
WHOQOL Environment0.7670.8330.416–0.5240.732–0.752
Disclaimer/Publisher’s Note: The statements, opinions and data contained in all publications are solely those of the individual author(s) and contributor(s) and not of MDPI and/or the editor(s). MDPI and/or the editor(s) disclaim responsibility for any injury to people or property resulting from any ideas, methods, instructions or products referred to in the content.