Research on the Nonlinear and Spatial Effects of Digital Financial Information Flow on Industrial Structure Upgrading

Abstract
1. Introduction
2. Literature Review and Research Hypotheses
2.1. Literature Review
2.2. Theoretical Hypothesis
2.2.1. The Impact of Digital Inclusive Finance on Industrial Structure Upgrading
2.2.2. Nonlinear Impact of Digital Inclusive Finance on Industrial Structure Upgrading
2.2.3. The Differential Effects of Financial Information Flows on Industrial Structure Upgrading
3. Model Design
3.1. Benchmark Model
3.2. Spatial Autocorrelation Analysis
3.3. Specification of the Spatial Econometric Model
3.4. Specification of the Spatial Weight Matrix
3.5. Direct Impact and Spillover Effects
4. Empirical Analysis
4.1. Variable Selection and Data Sources
4.1.1. Dependent Variable: Industrial Structure Upgrading (isu)
4.1.2. Core Explanatory Variable: Digital Financial Information Flow
4.1.3. Mediating Variables and Threshold Variables
4.1.4. Control Variables
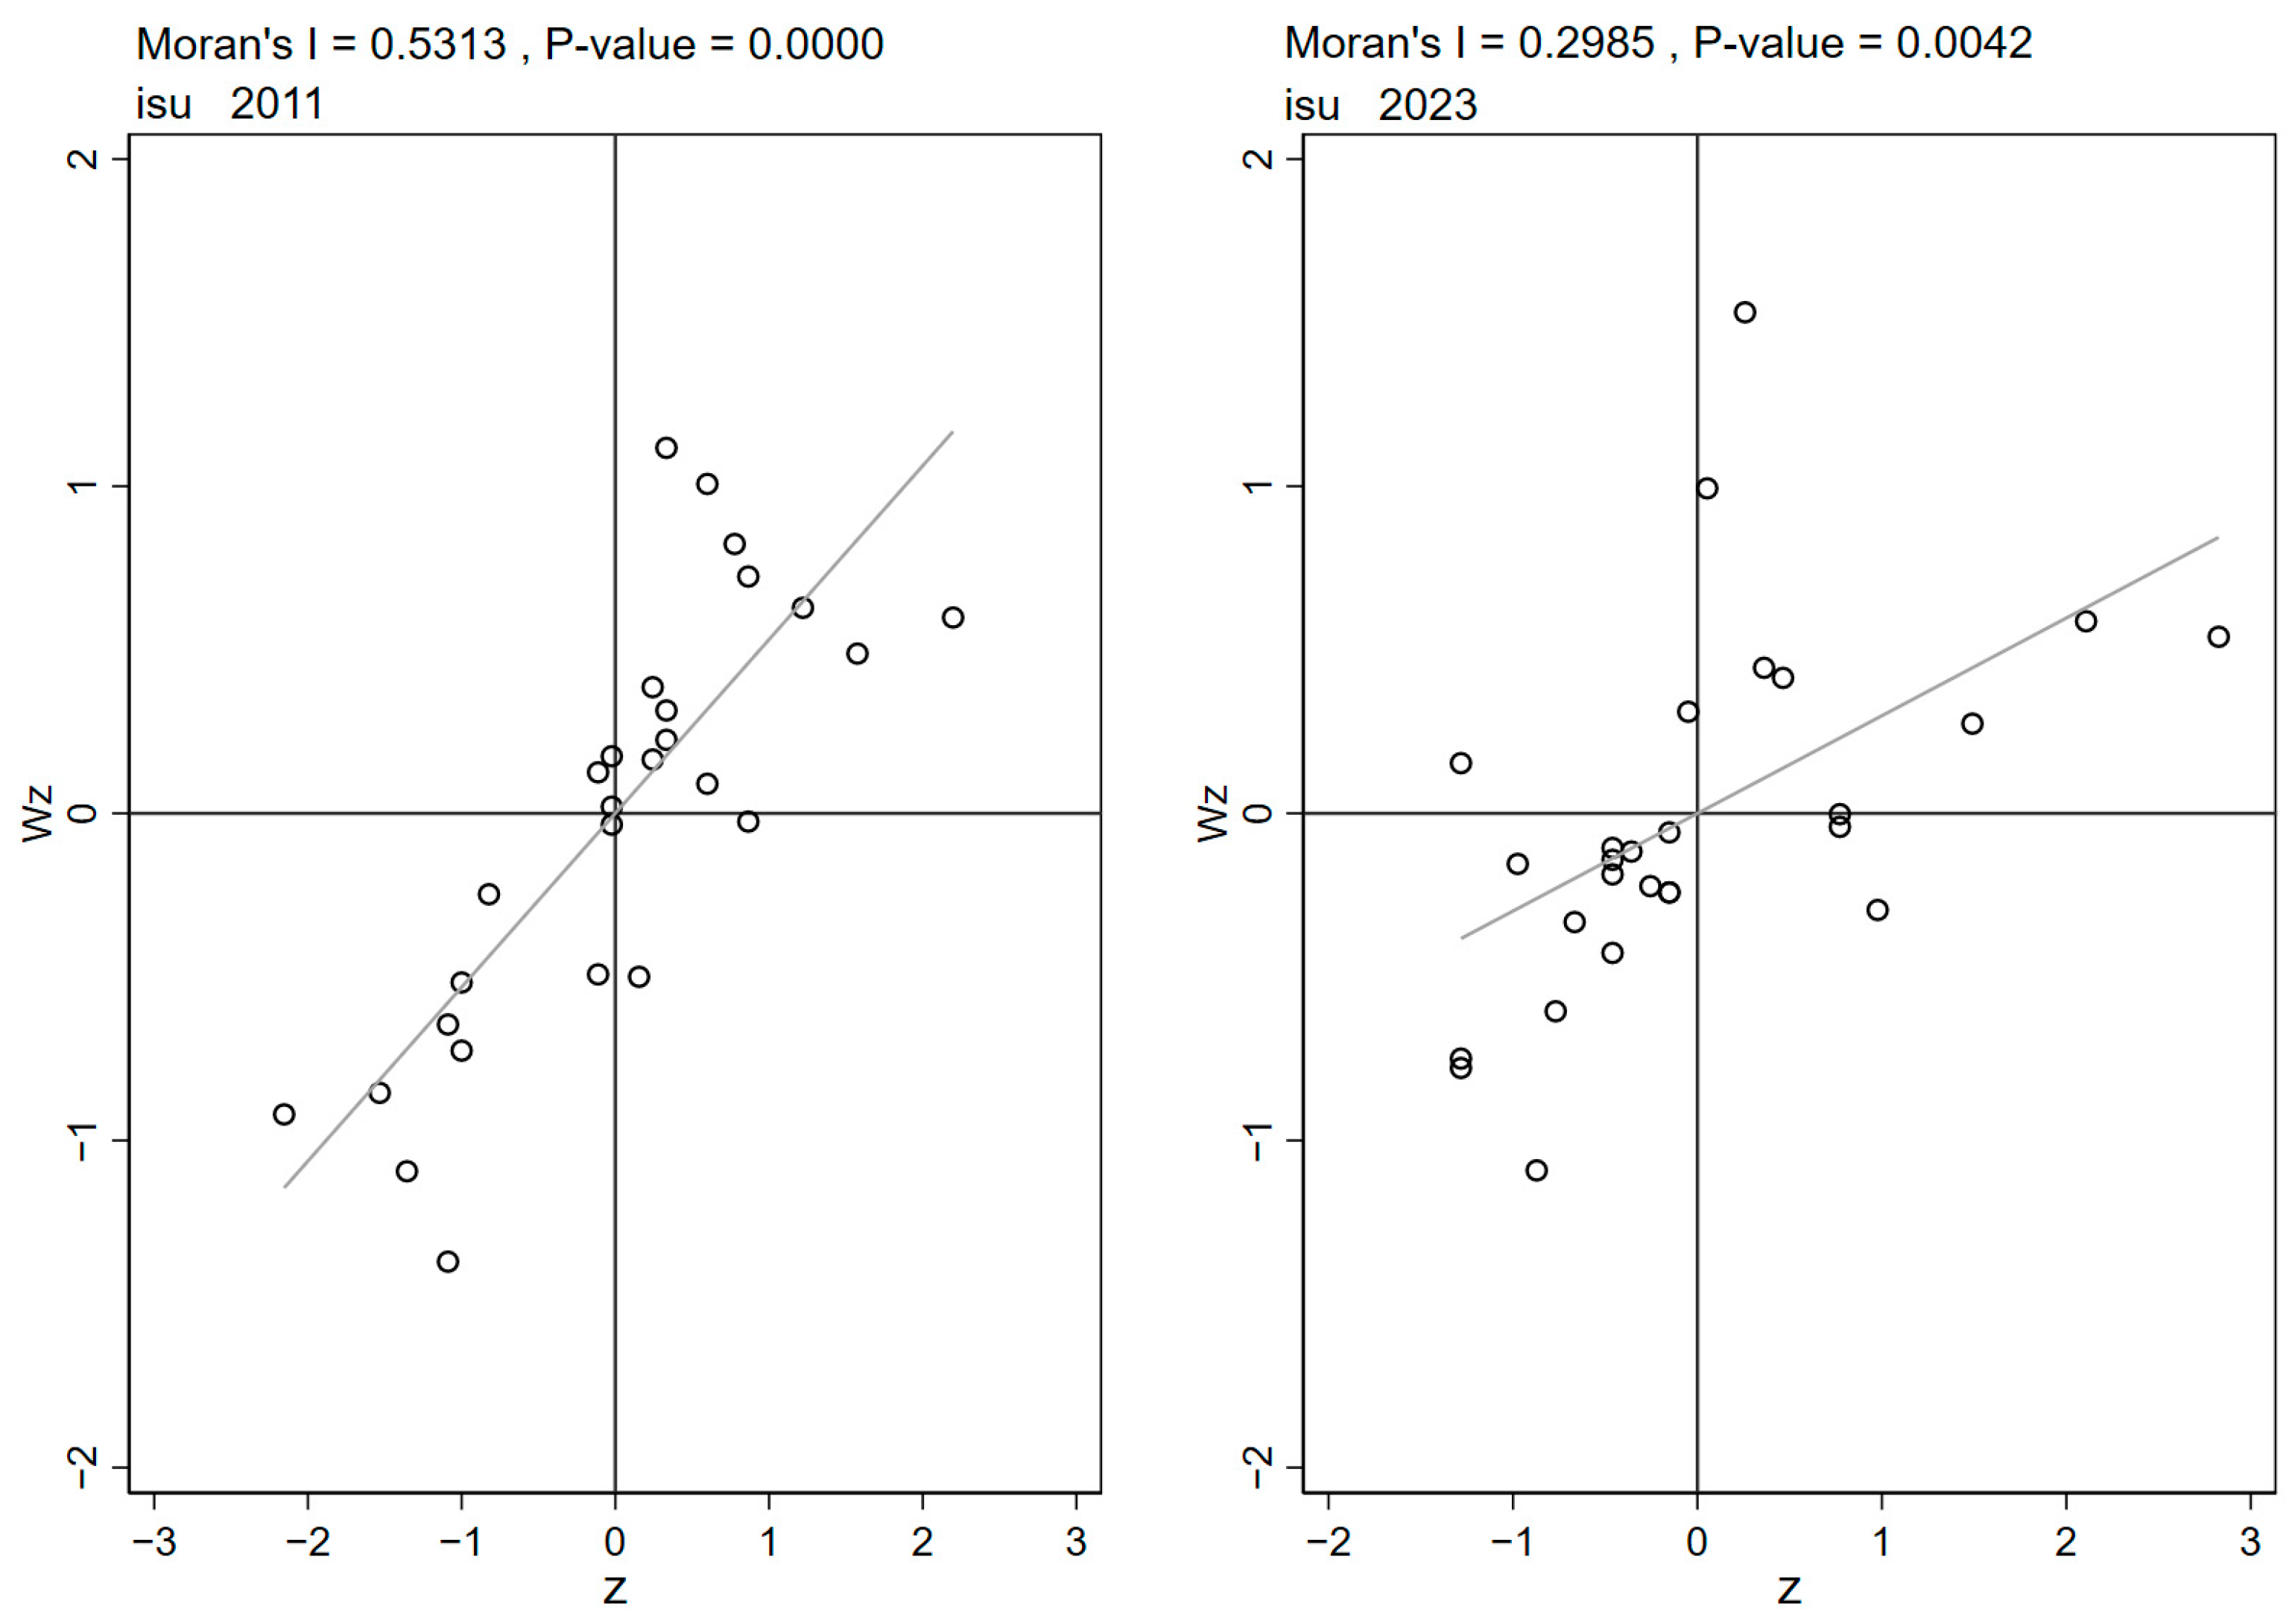
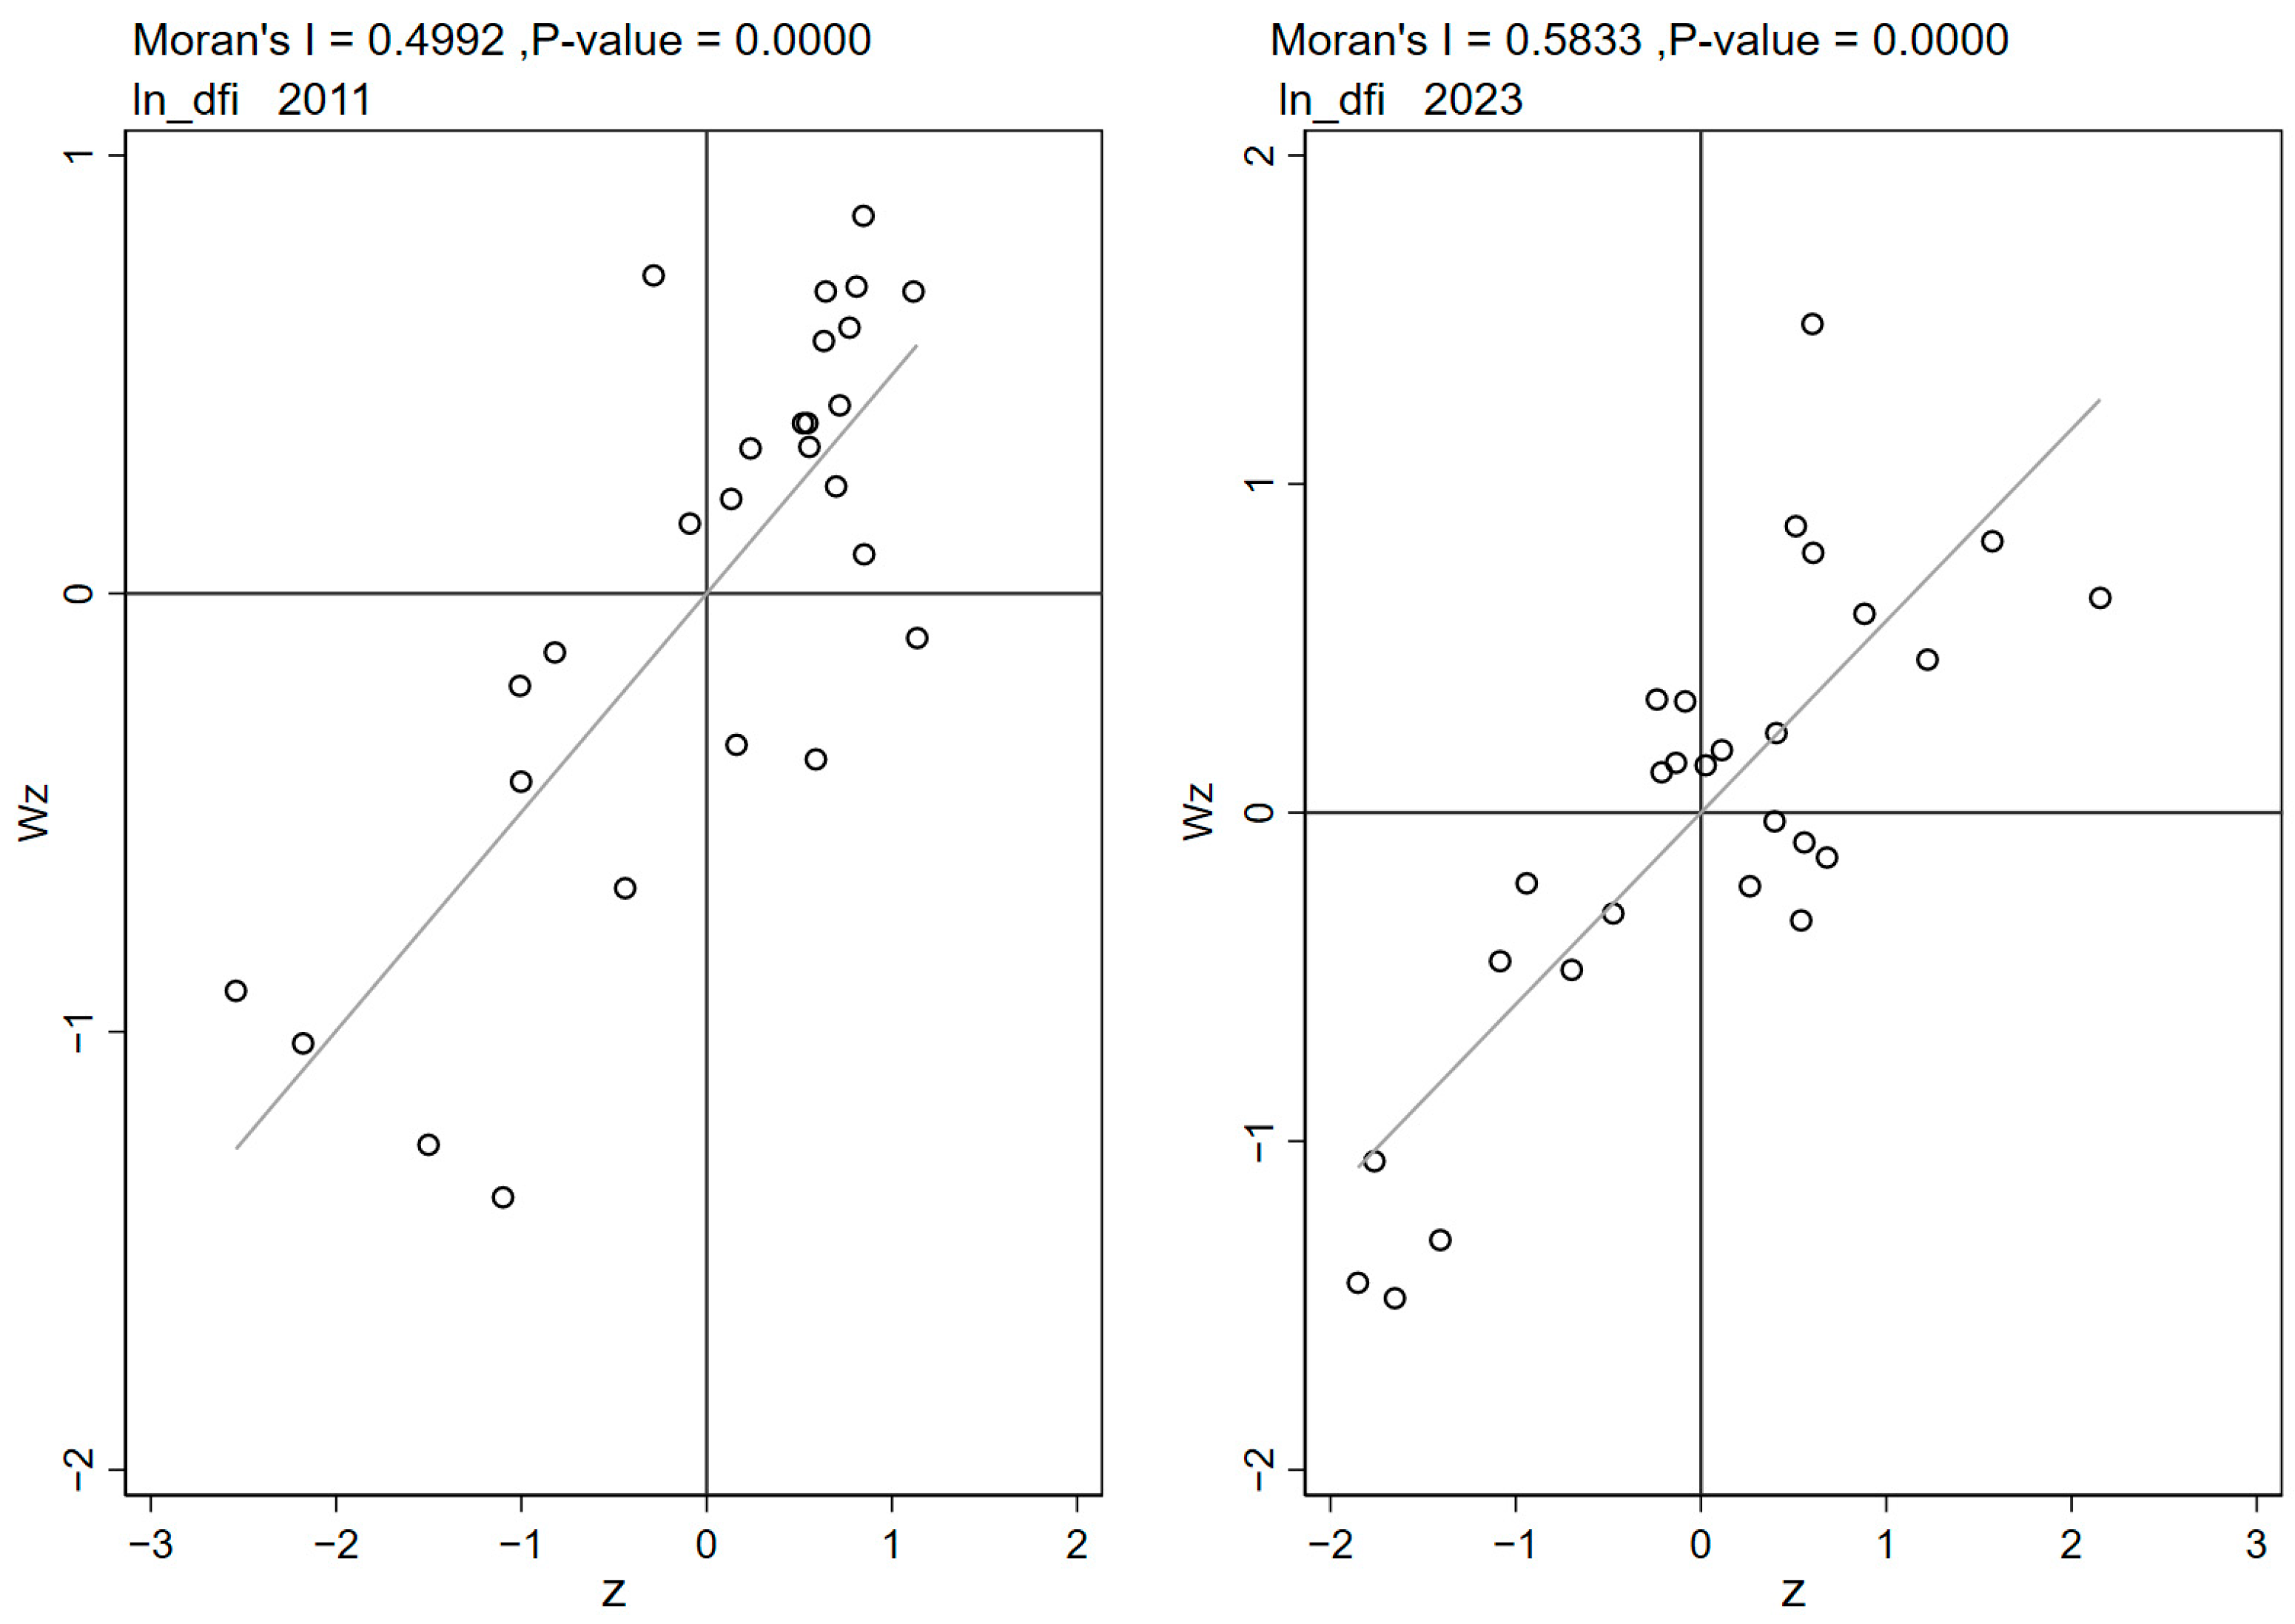
4.2. Results of Spatial Autocorrelation Test
4.3. Selection of Spatial Econometric Models
4.4. Analysis of Spatial Econometric Model Results
4.5. Decomposition of Spatial Spillover Effects
4.6. Robustness Testing
4.7. The Impact of Different Sub-Sectors of Digital Inclusive Finance on Industrial Upgrading
4.8. Analysis of the Impact Path of Financial Information Flow
4.9. Threshold Effect Analysis
5. Conclusions and Discussion
5.1. Conclusions
- (1)
- The local impact of digital inclusive finance on industrial structure upgrading exhibits a U-shaped pattern, while spatial spillover effect follows an inverted U-shaped pattern. Following a suite of robustness tests—including the exclusion of extreme samples and replacement of the explained variable—this nonlinear relationship remains statistically significant.
- (2)
- Digital payment and digital credit constitute the core information flows driving industrial structure upgrading, while the spatial spillover effect of digital insurance lacks statistical significance. All three local business segments significantly facilitate industrial upgrading; however, only payment and credit services generate positive spatial spillovers (coefficients = 0.144 and 0.463, respectively; p < 0.01).
- (3)
- Further mechanism tests reveal that entrepreneurial activity exerts a partial mediating effect with spatial transmission, whereas the mediating effect of technological innovation information input is only significant locally. Entrepreneurial activity reduces the direct effect of digital inclusive finance by 16.2%, with the mediating effect transmitting across regions. Due to the tacit knowledge attribute of technological innovation information and heterogeneity in absorptive capacity, no significant spatial spillover is observed. The mechanism tests validate the transmission chain: “information release → response of information carriers → optimization of industrial information allocation”.
5.2. Policy Recommendations
- (1)
- This study finds that digital inclusive finance exerts a significant spatial spillover effect on industrial structure upgrading, indicating that financial information flow serves as the core driver of regional coordination. Regions should continuously advance the development of digital inclusive finance and co-construct a digital financial information sharing network to enhance the transmission efficiency of transaction information flows, credit information flows, and risk information flows, reduce information friction costs, accelerate digital inclusive finance’s crossing of the critical value, and facilitate the early arrival of the inflection point for industrial structure upgrading.
- (2)
- The local U-shaped threshold acceleration effect and spatial inverted U-shaped characteristic provide a quantitative basis for tiered policy formulation by governments at all levels. For regions below the critical threshold, financial institutions are encouraged to develop small-denomination, high-frequency simplified digital financial products targeting groups with underdeveloped digital infrastructure. For core cities above the critical threshold, a siphon effect monitoring mechanism and compensation fund should be established to prevent excessive resource agglomeration and mitigate the “inverted U-shaped” siphon effect.
- (3)
- Payment and credit information flows exert significant positive spatial spillover effects, whereas insurance information flows do not exhibit such spatial spillovers. Governments at all levels and financial institutions should optimize the structure of financial information flows in a classified manner to enhance the synergistic support efficacy for industrial upgrading. Sustained efforts should be directed toward channeling digital payment information flows into industrial extension, thereby providing data support for industrial digital transformation; optimizing the structure of digital credit information flows, drawing on the experience of “three-tier service” models (ultra-simplified application, ultra-fast approval, and ultra-high-quality service), simplify approval processes, and improving the information response speed for small and micro enterprises.
- (4)
- The “information decoding” function that activates entrepreneurial dynamism should be leveraged to cultivate the peripheral technological absorption capacity. This study finds that entrepreneurial information can spill over naturally: the “market opportunity information” embedded within it is highly accessible for capture and imitation, whereas technological patents require other regions to first enhance absorption capacity. Thus, peripheral regions should be encouraged to collaborate with universities and research institutions in core cities, and local technology transfer talents should be cultivated by drawing on the G60 Sci-Tech Innovation Manager System currently being advanced [68].
5.3. Limitations and Directions for Future Research
Author Contributions
Funding
Institutional Review Board Statement
Informed Consent Statement
Data Availability Statement
Conflicts of Interest
References
- Bibi, S.; Zada, H.; Awan, T.; Wong, W.-K.; Khan, N. Evaluating the moderating role of governance on the relationships between social inclusion, ICT infrastructure, and financial inclusion. Heliyon 2024, 10, e33711. [Google Scholar] [CrossRef]
- Li, Y.L.; Wang, M.X.; Liao, G.K.; Wang, J.X. Spatial spillover effect and threshold effect of digital financial inclusion on farmers’ income growth-based on provincial data of China. Sustainability 2022, 14, 1838. [Google Scholar] [CrossRef]
- Zhou, W.; Zhang, X.; Wu, X. Digital inclusive finance, industrial structure, and economic growth: An empirical analysis of Beijing-Tianjin-Hebei region in China. PLoS ONE 2024, 19, e0299206. [Google Scholar] [CrossRef]
- Doku, J.N.; Iddrisu, K.; Bortey, D.N.; Ladime, J. Impact of digital financial technology on financial inclusion in Sub-Saharan Africa: The moderation role of institutional quality. Afr. Financ. J. 2023, 25, 31–45. [Google Scholar]
- Zhao, L.; Zhu, T.; Chen, J.; Zhao, L. Impact of digital economy on upgrading of industrial structure: From the financial development perspective. Financ. Res. Lett. 2025, 81, 107503. [Google Scholar] [CrossRef]
- Basnayake, D.; Naranpanawa, A.; Selvanathan, S.; Bandara, J.S. Financialinclusion through digitalization and economic growth in Asia-Pacific countries. Int. Rev. Financ. Anal. 2024, 96, 103596. [Google Scholar] [CrossRef]
- Yang, J.L. The Impact and Spatial Effects of Digital Inclusive Finance on the Upgrading of Rural Industrial Structure in Provinces. Econ. Geogr. 2025, 45, 183–191. [Google Scholar] [CrossRef]
- Zhang, C.Z.; Zhang, H.M. How Does Digital Inclusive Finance Empower the Upgrading of Agricultural Industrial Structure? —From the Perspective of New Quality Productivity in Agriculture. J. Yunnan Minzu Univ. (Philos. Soc. Sci. Ed.) 2025, 42, 100–113. [Google Scholar] [CrossRef]
- Wu, Y.M. Spatial Econometric Analysis of China’s Economic Growth and Income Distribution Difference; Economic Science Press: Beijing, China, 2005; pp. 46–81. [Google Scholar]
- Tao, C.Q.; Yang, H.W. Spatial Econometric Model Selection and Simulation Analysis. Stat. Res. 2014, 31, 88–96. [Google Scholar] [CrossRef]
- Guo, S.T.; Jin, Z.B. A Study of the Spatial Spillover Effect of Digital Inclusive Finance on the Optimization of Regional Industrial Structure. Econ. Rev. 2022, 39, 77–87. [Google Scholar] [CrossRef]
- Schumpeter, J.A. The Theory of Economic Development: An Inquiry into Profits, Capital, Credit, Interest, and the Business Cycle; Transaction Publishers Press: Piscataway, NJ, USA, 1934; pp. 105–111. [Google Scholar]
- King, R.G.; Levine, R. Finance and Growth: Schumpeter Might Be Right. Q. J. Econ. 1993, 108, 717–737. [Google Scholar] [CrossRef]
- Sheng, D.; Wang, Y.J. Industrial agglomeration, credit allocation efficiency and firm financing cost: Evidence from World Bank survey data and Chinese industrial firm data. J. Manag. World 2013, 29, 85–98. [Google Scholar] [CrossRef]
- Xiao, Y.F.; Zhou, P.P. Digital Economy, Industrial Upgrading, and High-Quality Development: An Empirical Study Based on Mediation Effect and Panel Threshold Effect. J. Chongqing Univ. Technol. (Soc. Sci.) 2021, 35, 68–80. [Google Scholar]
- Dong, F.; Lu, Y.; Xu, Z.W.; Sun, H.N. Financial bubbles, financialization and economic growth-the perspective of dynamic multi-sector asset bubbles. China Econ. Q. 2024, 24, 360–378. [Google Scholar] [CrossRef]
- Gennaioli, N.; Shleifer, A.; Vishny, R. Neglected risks, financial innovation, and financial fragility. J. Financ. Econ. 2012, 104, 452–468. [Google Scholar] [CrossRef]
- Yang, L.; Li, J.W. The transformation of financial structure and the upgrading of real economic structure (Part 1). Financ. Trade Econ. 2002, 9–13. [Google Scholar] [CrossRef]
- Ye, W.H.; Gong, L.Z. Digital Financial Inclusion and Inclusive Growth: Theoretical Analysis and Prospects. Econ. Probl. 2023, 45, 49–57. [Google Scholar] [CrossRef]
- Xu, M.; Zhang, X.L. Inclusive Finance Development and Industrial Structure Adjustment. Commer. Res. 2015, 57, 79–85. [Google Scholar] [CrossRef]
- Shen, H.; Qin, M.; Li, T.; Zhang, X.; Zhao, Y. Digital finance and industrial structure upgrading: Evidence from Chinese counties. Int. Rev. Financ. Anal. 2024, 95, 103442. [Google Scholar] [CrossRef]
- Ge, H.P.; Zhang, L. The Impact of Digital Inclusive Finance Development on Industrial Structure Upgrading. Financ. Account. Mon. 2021, 42, 135–141. [Google Scholar] [CrossRef]
- Li, F.; Li, J.H.; Lan, X.Y. Research on the Impact of Digital Inclusive Finance on Industrial Structure Optimization and Upgrading:Based on Different Business Systems Perspectives. Price Theory Pract. 2024, 44, 156–162. [Google Scholar] [CrossRef]
- Du, J.M.; Wei, S.W.; Wu, W.Y. Does Digital Inclusive Finance Promote the Optimization of Industrial Structure? Comp. Econ. Soc. Syst. 2020, 36, 38–49. [Google Scholar]
- He, X.Q.; Liu, L.L. Impact and Spatial Effect of the Urban Digital Inclusive Finance on the Entrepreneurial Activity. Econ. Geogr. 2026, 46, 78–86. [Google Scholar] [CrossRef]
- Zhang, Q.X.; Liu, Y.S.; Liu, H. Statistical Test of the Effect of Digital Inclusive Finance on Industrial Structure Upgrading. Stat. Decis. 2023, 39, 139–143. [Google Scholar] [CrossRef]
- Li, Y.S.; Li, F.P.; Li, X. Environmental Regulation, Digital Inclusive Finance and Urban Industrial Upgrading: Analysis Based on Spatial Spillover Effect and Regulation Effect. Inq. Into Econ. Issues 2022, 43, 50–66. [Google Scholar]
- Zeng, J.Z.; Li, Y.Z.; Liu, G.D. Research on the Function Mechanism and Spatial Effect of Digital Inclusive Finance Enabling Rural Industrial Prosperity: An Empirical Test Based on County Spatial Dynamic Panel Data. Stud. Int. Financ. 2023, 40, 39–49. [Google Scholar] [CrossRef]
- Gong, P.; He, Y.L. Influencing mechanism and spatial effects of digital inclusive finance on rural industrial revitalization. Stat. Decis. 2020, 41, 150–155. [Google Scholar] [CrossRef]
- Zeng, L.E.; Xie, D.Y.; Chen, Z.Y.; Yuan, D.D.; Nie, Y.; Huan, Q.; Yang, L.; Liang, Z.Q. How Does Digital Inclusive Finance Affect Energy Carbon Emission Efficiency in China? Analysis Based on Mediation Effect Model. Acta Sci. Nat. Univ. Pekin. 2025, 61, 153–165. [Google Scholar] [CrossRef]
- Xu, Z.Y.; Zhang, L.S.; Liu, Y.Z. Does Digital Inclusive Finance Enhance Regional Innovation Capacity? J. Financ. Econ. 2020, 64, 17–28. [Google Scholar]
- Tang, J.Q.; Li, T.; Zhang, X.Y.; Mou, S. Digital Inclusive Finance, Technological Innovation and Industrial Structure Optimization. Stat. Decis. 2022, 38, 134–139. [Google Scholar] [CrossRef]
- Song, Y.; Jiang, Y. How Does the Digital Economy Drive the Optimization and Upgrading of Industrial Structure? The Mediating Effect of Innovation and the Role of Economic Resilience. Sustainability 2024, 16, 1352. [Google Scholar] [CrossRef]
- Zhang, Q.J.; Li, Q. How Can Digital Inclusive Finance Help Upgrade Industrial Structure?—From the Perspective of Enterprise Entry. J. Mod. Financ. 2025, 30, 14–24+68. [Google Scholar] [CrossRef]
- Huang, Z.J.; Liu, B.Y. Could Digital Inclusive Finance Promote the Development of New Urbanization? Acta Sci. Nat. Univ. Pekin. 2025, 61, 557–568. [Google Scholar] [CrossRef]
- Tian, H.Y.; Liu, X. Digital Inclusive Finance, Capital Allocations and the Integration of County Industries. Rev. Ind. Econ. 2026, 14, 91–109. [Google Scholar] [CrossRef]
- Lin, B.H.; Chen, J.N. The industrial structure upgrading effect and spatial differences of digital inclusive finance. Fujian Trib. (Humanit. Soc. Sci. Ed.) 2022, 42, 76–86. [Google Scholar]
- Duan, X.; Li, M.R. Impact Analysis of Digital Inclusive Finance on Industrial Structure Upgrading: An Empirical Study Based on a Threshold Model. Qinghai Financ. 2020, 29, 47–52. [Google Scholar]
- Zhang, S.F.; Fang, L.Y.; Wang, X.L.; Cheng, X. Study on Mechanism of Digital Inclusive Finance and Industrial Structure Upgrading-Based on the Regulatory Effects of Technological Progress. Shanghai J. Econ. 2024, 43, 92–102. [Google Scholar] [CrossRef]
- Yang, H.; Wang, Q.R. The Impact and Mechanism of Digital Inclusive Finance on Industrial Structure Upgrading. Rev. Invest. Stud. 2021, 40, 4–14. [Google Scholar]
- Sui, L.R.; Jin, H. Research on the Mechanism and Effect of Inclusive Finance on Industrial Structure Upgrading. J. Audit. Econ. 2012, 37, 110–118. [Google Scholar]
- Zhang, L.; Jiang, L.W.; Ding, X.L. Can the Development of Digital Inclusive Finance Alleviate the Distortion of Financial Factors? Res. Financ. Econ. Issues 2025, 47, 82–97. [Google Scholar] [CrossRef]
- Liu, L.Q.; Wang, F.Y. The Impact of Digital Inclusive Finance and Consumption Level on Industrial Structure Upgrading in the Yangtze River Economic Belt. Financ. Account. Mon. 2023, 44, 148–153. [Google Scholar] [CrossRef]
- Xue, Q.; Feng, S.; Li, M. The Impact of Digital Finance on Industrial Structure: Evidence From China. SAGE Open 2024, 14, 21582440241239387. [Google Scholar] [CrossRef]
- Karaivanov, A. Financial Constraints and Occupational Choice in Thai Villages. J. Dev. Econ. 2012, 97, 201–220. [Google Scholar] [CrossRef]
- Li, C.M.; Zhou, Y. Influence of digital inclusive finance on rural consumption: Based on spatial econometric model. Econ. Geogr. 2021, 41, 177–186. [Google Scholar] [CrossRef]
- Anselin, L. Spatial Econometrics: Methods and Models; Kluwer Academic Publishers: Dordrecht, The Netherlands, 1988. [Google Scholar]
- Moran, P. Notes on Continuous Stochastic Phenomena. Biometrika 1950, 37, 17–23. [Google Scholar] [CrossRef] [PubMed]
- LeSage, J.; Pace, R.K. Introduction to Spatial Econometrics; CRC Press: New York, NY, USA, 2009. [Google Scholar]
- Shao, S.; Li, X.; Cao, J. Economic policy choices for haze pollution control in China: From the perspective of spatial spillover effects. Econ. Res. J. 2016, 51, 73–88. [Google Scholar]
- Chen, L.; Zhang, G. Research on the impact of digital financial inclusion and environmental regulation on industrial structure upgrading-based on spatial Durbin model analysis. PLoS ONE 2024, 19, e0310720. [Google Scholar] [CrossRef]
- Li, X.; Deng, F. Scientific Innovation, Industrial Structure Upgrading, and Economic Growth. Sci. Res. Manag. 2019, 40, 84–93. [Google Scholar] [CrossRef]
- Ming, C.Q.; Peng, H.L. The High-Quality Development of the Digital and Urban Economies and Spatial Spillover Effects: Based on Empirical Research for 26 Cities in the Yangtze River Delta. East China Econ. Manag. 2024, 38, 25–35. [Google Scholar] [CrossRef]
- Yin, Z.C.; Wu, Z.S. Mobile Payment and County Economic Growth. J. Financ. Econ. 2023, 49, 124–138. [Google Scholar] [CrossRef]
- Liu, Y.; Luan, L.; Wu, W.; Zhang, Z.A.; Hsu, Y. Can digital financial inclusion promote China’s economic growth? Int. Rev. Financ. Anal. 2021, 78, 101889. [Google Scholar] [CrossRef]
- Xu, T.T.; Chen, X.J. Poverty Alleviation Mechanisms and Spatial Effects of Rural Inclusive Insurance. Insur. Stud. 2021, 42, 3–21. [Google Scholar] [CrossRef]
- Wen, Z.L.; Ye, B.J. Mediation Effect Analysis: Methods and Model Development. Adv. Psychol. Sci. 2014, 22, 731–745. [Google Scholar] [CrossRef]
- Zhao, T.; Zhang, Z.; Liang, S.K. Digital Economy, Entrepreneurship, and High-Quality Economic Development: Empirical Evidence from Urban China. J. Manag. World 2020, 36, 65–76. [Google Scholar] [CrossRef]
- Li, S.F. Financial Agglomeration, Innovation and Entrepreneurship Vitality and Urban Economic Resilience. Econ. Surv. 2023, 40, 26–36. [Google Scholar] [CrossRef]
- Cao, S.X.; Xiao, Y.D.; Zhao, X.Y. Empowering high-quality county-level economic development through digital inclusive finance: Based on a dual-driving mechanism of financial inclusion and real-economy entrepreneurship. China Popul. Resour. Environ. 2025, 35, 209–218. [Google Scholar]
- Lyu, W.; Hao, C.; Yu, L. Digital Financial Inclusion and Entrepreneurship: A Spatial Analysis of Rural China. Rev. Dev. Econ. 2026, 2, 1383–1399. [Google Scholar] [CrossRef]
- Pan, Y.R.; Wei, J. Digital Inclusive Finance and High-Quality Economic Development: Theoretical Mechanism, Empirical Evidence and Policy Choices. West Forum Econ. Manag. 2023, 34, 1–18. [Google Scholar]
- Chishti, M.Z.; Sinha, A. Do the shocks in technological and financial innovation influence the environmental quality? Evidence from BRICS economies. Technol. Soc. 2022, 68, 101828. [Google Scholar] [CrossRef]
- Liang, Q. Spatial limitation of knowledge spillover and agglomeration. Stud. Sci. Sci. 2004, 22, 76–81. [Google Scholar] [CrossRef]
- Chen, A.; Liu, X.L.; Chen, P. Research on mechanisms of the influential factors of spatial knowledge spill-off. Stud. Sci. Sci. 2011, 29, 883–889. [Google Scholar] [CrossRef]
- Hansen, B.E. Sample Splitting and Threshold Estimation. Econometrica 2000, 68, 575–603. [Google Scholar] [CrossRef]
- Tang, W.J.; Li, S.; Tao, Y.Q. The Development of Digital Inclusive Finance and Industrial Structure Upgrading: Empirical Evidence from 283 Cities. J. Guangdong Univ. Financ. Econ. 2019, 34, 35–49. [Google Scholar] [CrossRef]
- Guo, Y.; Wang, Y.Y.; Cao, X.Z.; Zeng, G. Technology diffusion effects of the G60 Science and Technology Innovation Corridor in the Yangtze River Delta. Geogr. Res. 2025, 44, 2919–2933. [Google Scholar]



| Variable Attribute | Variable Name | Measurement Method | Selection Criteria and Importance |
|---|---|---|---|
| Dependent variable | Industrial structure upgrading (isu) | The classical measurement method, which directly captures the allocation efficiency of information factors across industries, serves as the core outcome variable for validating the information transmission effect of digital finance. | |
| Explanatory variables | Digital Financial Information Flow (dfi) | Peking University Digital Inclusive Finance Index | The authoritative and widely adopted index, which systematically captures the multi-dimensional characteristics of digital financial information flows, serves as the core driving force of this study. |
| Digital payment information flow (payment) | The “Payment Sub-Index” of the Peking University Digital Inclusive Finance Index | ||
| Digital credit information flow (credit) | The “credit Sub-Index” of the Peking University Digital Inclusive Finance Index | ||
| Digital insurance information flow (insurance) | The “insurance Sub-Index” of the Peking University Digital Inclusive Finance Index | ||
| Mediating variables and threshold variables | Technological innovation information (info_tech_patent) | The number of patents authorized to large-scale industrial enterprises in the current year | It captures the generation density and accumulation level of technological information within a region, with high data accessibility. This paper seeks to verify that it exerts a partial mediating effect in the pathway from digital finance to industrial upgrading. |
| Entrepreneurial activity (new_firm) | The number of newly registered enterprises in each city during the current year | It directly captures the response efficiency of entrepreneurial information, and this paper seeks to verify that it exerts both local mediating effects and spatial mediating effects. | |
| Information infrastructure level (info_internet_mobile) | Number of mobile phone users per million people | It captures the regional information absorption capacity, and this paper employs it to test the threshold effect of digital finance’s spatial spillover. | |
| Control variables | Government behavior (gov) | The ratio of government fiscal expenditure to GDP | This variable controls for the interference of the public sector on the industrial structure, while uncovering the nonlinear impact of policy information. |
| Openness (open) | Total value of imports and exports of the region | This variable controls for external information shocks, and a higher degree of openness is associated with more frequent exchanges of technological and market information. | |
| Fixed asset investment (fa_ratio) | The ratio of fixed asset investment to GDP | This variable controls for the influence of traditional capital factors on industrial upgrading, thereby mitigating omitted variable bias. | |
| Economic development level (growth_gdp) | GDP growth rate | This variable controls for the phased characteristics of macroeconomic growth. |
| Year | Industrial Structure Upgrading | Digital Inclusive Finance | ||||
|---|---|---|---|---|---|---|
| Moran’s I | Z Value | p Value | Moran’s I | Z Value | p Value | |
| 2011 | 0.5313 | 4.7037 | 0.0000 | 0.4992 | 4.4792 | 0.0000 |
| 2012 | 0.5354 | 4.7567 | 0.0000 | 0.5171 | 4.5789 | 0.0000 |
| 2013 | 0.54 | 4.7983 | 0.0000 | 0.5148 | 4.5253 | 0.0000 |
| 2014 | 0.5128 | 4.5798 | 0.0000 | 0.5168 | 4.5796 | 0.0000 |
| 2015 | 0.4769 | 4.3233 | 0.0000 | 0.5539 | 4.8526 | 0.0000 |
| 2016 | 0.4365 | 3.9789 | 0.0001 | 0.6277 | 5.4529 | 0.0000 |
| 2017 | 0.198 | 1.9642 | 0.0495 | 0.5821 | 5.1013 | 0.0000 |
| 2018 | 0.3705 | 3.426 | 0.0006 | 0.58 | 5.0704 | 0.0000 |
| 2019 | 0.3103 | 2.9521 | 0.0032 | 0.573 | 5.0277 | 0.0000 |
| 2020 | 0.3584 | 3.3387 | 0.0008 | 0.5727 | 5.0346 | 0.0000 |
| 2021 | 0.3352 | 3.1593 | 0.0016 | 0.5055 | 4.4749 | 0.0000 |
| 2022 | 0.331 | 3.1334 | 0.0017 | 0.5566 | 4.8955 | 0.0000 |
| 2023 | 0.2985 | 2.8625 | 0.0042 | 0.5833 | 5.1213 | 0.0000 |
| Test Method | Test Statistic | p Value |
|---|---|---|
| LM-Error Test | 2.793 | 0.095 |
| Robust LM-Error Test | 10.929 | 0.001 |
| LM-Lag Test | 16.662 | 0.000 |
| Robust LM-Lag Test | 24.798 | 0.000 |
| Likelihood-Ratio Test of SDM Against SAR | 50.82 | 0.000 |
| Likelihood-Ratio Test of SDM Against SEM | 44.64 | 0.000 |
| Variables | OLS | SAR | SEM | SDM |
|---|---|---|---|---|
| ln_dfi | −0.332 ** | 0.087 | −0.015 | −0.622 ** |
| (−2.19) | (0.45) | (−0.06) | (−2.41) | |
| ln_dfi2 | 0.048 *** | 0.008 | 0.022 | 0.081 *** |
| (3.21) | (0.32) | (0.77) | (2.75) | |
| gov | −1.362 ** | −0.749 * | −0.763 * | −1.393 *** |
| (−2.33) | (−1.95) | (−1.94) | (−3.65) | |
| gov2 | 3.313 * | 1.425 | 1.739 | 3.868 *** |
| (1.88) | (1.38) | (1.57) | (3.59) | |
| open | 0.064 *** | −0.033 ** | −0.043 *** | −0.027 * |
| (4.97) | (−2.45) | (−3.18) | (−1.94) | |
| fa_ratio | −0.107 *** | −0.019 ** | −0.019 ** | −0.024 *** |
| (−8.20) | (−2.46) | (−2.51) | (−3.15) | |
| growth_gdp | 0.317 *** | 0.002 | −0.002 | 0.006 |
| (5.41) | (0.05) | (−0.08) | (0.22) | |
| Constant | 2.957 *** | |||
| (7.59) | ||||
| W*ln_dfi | 1.617 *** | |||
| (3.59) | ||||
| W*ln_dfi2 | −0.196 *** | |||
| (−3.64) | ||||
| ρ | 0.483 *** | 0.403 *** | ||
| (7.43) | (5.82) | |||
| λ | 0.491 *** | |||
| (6.95) | ||||
| Observations | 351 | 351 | 351 | 351 |
| R-squared | 0.652 | 0.701 | 0.710 | 0.67 |
| Log-likelihood | 778.3774 | 775.2885 | 800.6972 |
| Variables | Direct Effects | Indirect Effects | Total Effects |
|---|---|---|---|
| ln_dfi | −0.463 * | 2.120 *** | 1.657 *** |
| (−1.90) | (3.34) | (2.80) | |
| ln_dfi2 | 0.062 ** | −0.252 *** | −0.190 ** |
| (2.18) | (−3.22) | (−2.46) | |
| gov | −1.528 *** | −2.364 * | −3.892 *** |
| (−4.04) | (−1.76) | (−2.60) | |
| gov2 | 3.974 *** | 2.863 | 6.837 * |
| (3.88) | (0.86) | (1.87) | |
| open | −0.019 | 0.108 ** | 0.088 * |
| (−1.37) | (2.37) | (1.67) | |
| fa_ratio | −0.028 *** | −0.062 ** | −0.090 *** |
| (−3.30) | (−2.12) | (−2.62) | |
| growth_gdp | 0.010 | 0.056 | 0.066 |
| (0.31) | (0.56) | (0.55) |
| Variables | Model 1 | Model 2 | Model 3 | Model 4 |
|---|---|---|---|---|
| ln_dfi | −5.287 *** | −5.061 *** | −0.614 ** | −1.294 ** |
| (−4.06) | (−4.30) | (−2.17) | (−2.29) | |
| ln_dfi2 | 0.582 *** | 0.558 *** | 0.080 ** | 0.137 ** |
| (3.90) | (4.14) | (2.45) | (2.38) | |
| gov | −7.463 *** | −5.990 *** | −1.490 ** | −1.860 *** |
| (−3.87) | (−3.44) | (−2.05) | (−4.51) | |
| gov2 | 23.123 *** | 17.974 *** | 4.206 ** | 5.057 *** |
| (4.26) | (3.66) | (2.35) | (4.42) | |
| open | −0.227 *** | −0.204 *** | −0.023 | −0.033 * |
| (−3.28) | (−3.26) | (−0.51) | (−1.86) | |
| fa_ratio | −0.137 *** | −0.153 *** | −0.024 * | −0.023 ** |
| (−3.58) | (−4.41) | (−1.74) | (−2.24) | |
| zgdp | 0.155 | 0.129 | 0.004 | 0.015 |
| (1.15) | (1.05) | (0.22) | (0.53) | |
| W*ln_dfi | 8.919 *** | 8.485 *** | 1.715 ** | 4.702 *** |
| (3.89) | (4.09) | (2.53) | (4.92) | |
| W*ln_dfi2 | −1.134 *** | −1.087 *** | −0.207 *** | −0.516 *** |
| (−4.15) | (−4.40) | (−2.58) | (−5.21) | |
| rho | 0.167 ** | 0.157 * | 0.390 *** | 0.331 *** |
| (2.08) | (1.95) | (4.68) | (4.21) |
| Variables | Direct Effects | Indirect Effects | Total Effects |
|---|---|---|---|
| ln_payment | 0.182 *** | 0.144 * | 0.326 *** |
| (4.59) | (1.89) | (4.97) | |
| ln_credit | 0.090 ** | 0.463 *** | 0.554 *** |
| (2.54) | (4.64) | (5.15) | |
| ln_insurance | 0.081 *** | −0.039 | 0.042 |
| (4.17) | (−0.72) | (0.71) |
| (1) isu | (2) ln_new_firm | (3) isu | |
|---|---|---|---|
| Direct effect | |||
| ln_dfi | −0.463 * | −4.548 ** | −0.388 * |
| (0.244) | (1.840) | (0.232) | |
| ln_dfi2 | 0.062 ** | 0.474 ** | 0.055 ** |
| (0.028) | (0.211) | (0.027) | |
| ln_new_firm | 0.029 *** | ||
| (0.008) | |||
| Indirect effect | |||
| ln_dfi | 2.120 *** | 6.447 ** | 2.013 *** |
| (0.635) | (3.255) | (0.616) | |
| ln_dfi2 | −0.252 *** | −0.622 | −0.246 *** |
| (0.078) | (0.387) | (0.077) | |
| ln_new_firm | 0.060 * | ||
| (0.032) | |||
| Total effect | |||
| ln_dfi | 1.657 *** | 1.899 | 1.625 *** |
| (0.592) | (2.485) | (0.599) | |
| ln_dfi2 | −0.190 ** | −0.148 | −0.191 ** |
| (0.077) | (0.322) | (0.079) | |
| ln_new_firm | 0.089 ** | ||
| (0.036) | |||
| Control variable | yes | yes | yes |
| R2 | 0.66 | 0.54 | 0.68 |
| N | 351 | 351 | 351 |
| isu | ln_info_tech_patent | isu | |
|---|---|---|---|
| Direct effect | |||
| ln_dfi | −0.463 * | 1.179 *** | −0.393 * |
| (0.244) | (0.363) | (0.229) | |
| ln_dfi2 | 0.062 ** | 0.051 * | |
| (0.028) | (0.027) | ||
| ln_info_tech_patent | 0.029 *** | ||
| (0.007) | |||
| Indirect effect | |||
| ln_dfi | 2.120 *** | −0.134 | 1.925 *** |
| (0.635) | (0.760) | (0.643) | |
| ln_dfi2 | −0.252 *** | −0.230 *** | |
| (0.078) | (0.080) | ||
| ln_info_tech_patent | −0.008 | ||
| (0.026) | |||
| Total effect | |||
| ln_dfi | 1.657 *** | 1.045 | 1.532 ** |
| (0.592) | (0.688) | (0.641) | |
| ln_dfi2 | −0.190 ** | −0.179 ** | |
| (0.077) | (0.084) | ||
| ln_info_tech_patent | 0.020 | ||
| (0.029) | |||
| Control variable | yes | yes | yes |
| R2 | 0.66 | 0.66 | 0.65 |
| N | 351 | 351 | 351 |
| Threshold Variable | Number of Thresholds | F- Statistic | p- Value | Critical Value (10%) | Critical Value (5%) | Critical Value (1%) | Threshold Value | 95% Confidence Interval |
|---|---|---|---|---|---|---|---|---|
| ln_dfi | Single threshold | 37.50 * | 0.080 | 34.72 | 42.77 | 56.80 | 5.15 | (5.4561, 5.5200) |
| Double threshold | 19.32 * | 0.068 | 16.33 | 21.81 | 32.10 | 5.51 | (5.1279, 5.1538) | |
| Triple threshold | 7.21 | 0.622 | 24.78 | 30.32 | 35.98 | - | - | |
| info_internet_mobile | Single threshold | 65.09 *** | 0.000 | 22.70 | 32.36 | 41.99 | 0.79 | (0.7700, 0.8000) |
| Double threshold | 16.67 | 0.202 | 20.92 | 26.12 | 37.35 | - | - |
| Variables | isu | isu |
|---|---|---|
| ln_dfi(info_internet_mobile ≤ 0.79) | 0.0881 *** | |
| (0.0136) | ||
| ln_dfi(info_internet_mobile > 0.79) | 0.1007 *** | |
| (0.0120) | ||
| ln_dfi(ln_dfi ≤ 5.15) | 0.0608 *** | |
| (0.0087) | ||
| ln_dfi(5.15 < ln_dfi ≤ 5.51) | 0.0680 *** | |
| (0.0090) | ||
| ln_dfi(ln_dfi > 5.51) | 0.0726 *** | |
| (0.0086) | ||
| Constant | 1.9347 *** | 2.1418 *** |
| (0.0651) | (0.0857) | |
| Observations | 351 | 351 |
| Number of id | 27 | 27 |
| R-squared | 0.756 | 0.750 |
Disclaimer/Publisher’s Note: The statements, opinions and data contained in all publications are solely those of the individual author(s) and contributor(s) and not of MDPI and/or the editor(s). MDPI and/or the editor(s) disclaim responsibility for any injury to people or property resulting from any ideas, methods, instructions or products referred to in the content. |
© 2026 by the authors. Licensee MDPI, Basel, Switzerland. This article is an open access article distributed under the terms and conditions of the Creative Commons Attribution (CC BY) license.
Share and Cite
Wu, P.; Wang, Y.; Li, G. Research on the Nonlinear and Spatial Effects of Digital Financial Information Flow on Industrial Structure Upgrading. Information 2026, 17, 510. https://doi.org/10.3390/info17050510
Wu P, Wang Y, Li G. Research on the Nonlinear and Spatial Effects of Digital Financial Information Flow on Industrial Structure Upgrading. Information. 2026; 17(5):510. https://doi.org/10.3390/info17050510
Chicago/Turabian StyleWu, Pengzhuo, Yao Wang, and Guodong Li. 2026. "Research on the Nonlinear and Spatial Effects of Digital Financial Information Flow on Industrial Structure Upgrading" Information 17, no. 5: 510. https://doi.org/10.3390/info17050510
APA StyleWu, P., Wang, Y., & Li, G. (2026). Research on the Nonlinear and Spatial Effects of Digital Financial Information Flow on Industrial Structure Upgrading. Information, 17(5), 510. https://doi.org/10.3390/info17050510