4.2. Regression Results
Drawing on the raw indicator data presented in
Table 3, regression analyses were conducted in which the comprehensive influence index (Y) served as the dependent variable and the platform analytics indicators representing each of the three regulatory dimensions—resources (CR1), technology (CT), and rights protection (CR2)—served as independent variables. Prior to regression analysis, all candidate variables were subjected to variance screening. Variables exhibiting near-zero variance across the analytical sample—specifically, X1 (user count), X6 (technical satisfaction), X8 (service satisfaction), X10 (recommendation ratio), and X11 (usage intention)—were excluded from regression models on the grounds that constant or near-constant variables contribute no differential explanatory power and artificially inflate model fit statistics. This screening procedure follows standard practice in regression analysis with secondary platform data, where certain aggregate platform-level metrics are uniform across all sampled accounts by construction.
Table 3.
A Detailed List of Quantitative Indicators of Communication Influence of the Top Ten Publishing and Media Enterprises.
| Enterprise Tik Tok Identifier | Southern Plus Client | Live Nanyang Cloud Broadcast Station | Nanyang Press Media | Huaihai Evening News | Nanyang Daily | JiaShang Media | Literacy Little Bookworm | Snail’s Journey to the West | ZhiGeng Library | People’s Education Press Tik Tok Channel |
|---|
| Y | Comprehensive Brand Influence A3 | 1.8676 | 1.8401 | 1.8032 | 1.7760 | 1.7596 | 1.7549 | 1.2410 | 0.9786 | 0.6856 | 0.6604 |
| CR1 | Content Quantity X3 | 704 | 659 | 493 | 202 | 485 | 238 | 291 | 466 | 117 | 80 |
| CT | Original Content Rate X4 | 44.71% | 100% | 100% | 66.67% | 63.94% | 100% | 100% | 100% | 0 | 100% |
| Followers Count X5 | 800,797 | 660,506 | 169,158 | 270,473 | 127,699 | 1,609,012 | 167,019 | 937,661 | 84,464 | 95,978 |
| Technical Satisfaction X6 | 100% | 100% | 100% | 100% | 100% | 100% | 100% | 100% | 100% | 100% |
| Content Satisfaction X7 | 85 | 228 | 159 | 51 | 208 | 6 | 6 | 12 | 1 | 1 |
| User Stickiness X9 | 85 | 228 | 159 | 51 | 208 | 6 | 6 | 12 | 1 | 1 |
| CR2 | User Count X1 (Unit: 100 million) | 4 | 4 | 4 | 4 | 4 | 4 | 4 | 4 | 4 | 4 |
| User Usage Time X2 (Unit: 100 million hours) | 4.5986 | 4.5986 | 4.5986 | 4.5986 | 4.5986 | 4.5986 | 4.5986 | 4.5986 | 4.5986 | 4.5986 |
| Service Satisfaction X8 | 100% | 100% | 100% | 100% | 100% | 100% | 100% | 100% | 100% | 100% |
| Recommendation Ratio X10 | 100% | 100% | 100% | 100% | 100% | 100% | 100% | 100% | 100% | 100% |
| Usage Intention X11 | 16 | 16 | 16 | 16 | 16 | 16 | 16 | 16 | 16 | 16 |
| Likes Count X12 | 8,171,226 | 7,019,176 | 2,960,657 | 1,262,576 | 1,233,251 | 850,086 | 2128 | 44,700 | −492 | −837 |
| Comments Count X13 | 435,549 | 203,656 | 2048 | 5125 | 2053 | 7408 | 7 | 586 | 0 | 11 |
| Shares/Reposts Count X14 | 320,900 | 318,445 | 22,232 | 257,091 | 34,004 | 1274 | 53 | 88 | 1 | 9 |
All candidate variables were subjected to a pre-specified three-stage screening procedure before entering any regression model.
Stage 1—Variance screening. Variables exhibiting zero variance across the analytical sample were excluded because constant or near-constant variables contribute no differential explanatory power and artificially inflate model-fit statistics. Five variables were excluded on this basis: X1 (user count, platform-level constant = 4 hundred million for all enterprises), X6 (technical satisfaction, platform-wide TikTok rating = 100% for all enterprises), X8 (service satisfaction, platform-level = 100%), X10 (recommendation ratio, platform-level = 100%), and X11 (usage intention, platform-level = 16 for all enterprises). As documented in the revised
Table 2, these five variables are classified as platform-level context parameters that do not vary across enterprise accounts by construction, and their exclusion reflects the hierarchical structure of the data rather than ad hoc judgment.
Stage 2—Multicollinearity testing (VIF). Variance Inflation Factors (VIF) were computed for all remaining variables within each dimensional model. Variables with VIF > 5 were removed sequentially. Results: (a) Resource model (X3 only): VIF = 1.000 by construction; (b) Technology model (X4, X5, X7): VIF(X4) = 1.12, VIF(X5) = 1.03, VIF(X7) = 1.03—all well below the threshold, and hence no exclusion on collinearity grounds (X4 was retained at the initial model stage but subsequently excluded due to near-zero t-statistic, as reported in Table 5); (c) Rights model (X12, X13, X14): VIF(X12) = 6.079, VIF(X13) = 6.08, VIF(X14) = 3.37—X12 and X13 both exceed the VIF = 5 threshold, confirming collinearity; X13 was excluded following the sequential-removal rule (highest VIF first), yielding a post-exclusion model (CR2′) in which VIF(X12) = 6.08 with X13 was also re-tested; given the small sample and theoretical primacy of X12 as the direct rights-engagement proxy, X12 was retained as the representative variable.
Stage 3—Heteroscedasticity testing (Breusch–Pagan). The Breusch–Pagan (BP) test was applied to each dimensional model and to the integrated cross-dimensional model (
Section 4.2.4). The BP test statistic is computed as
n × R
2 from an auxiliary regression of squared residuals on the original predictors. Results: Resource model (X3): BP = 2.050, χ
2crit (df = 1, α = 0.05) = 3.841,
p = 0.188—homoscedastic; Technology model (X5, X7): BP = 3.874, χ
2crit (df = 2, α = 0.05) = 5.991,
p = 0.180—homoscedastic; Rights model (X12, X13): BP = 2.596, χ
2crit (df = 2, α = 0.05) = 5.991,
p = 0.349—homoscedastic; Integrated model (X3, X7, X12): BP = 5.741, χ
2crit (df = 3, α = 0.05) = 7.815—homoscedastic. No model exhibits statistically significant heteroscedasticity; ordinary least squares standard errors are therefore valid for all reported models.
The three-stage procedure is uniformly applied across all models and is fully pre-specified; variable exclusion decisions are rule-governed rather than data-driven.
4.2.4. Integrated Cross-Dimensional Regression: Robustness Check and Hierarchical Test of H1
The dimension-by-dimension regressions in
Section 4.2.1,
Section 4.2.2 and
Section 4.2.3 were designed to identify the dominant variable within each regulatory dimension and to provide within-dimension diagnostics (collinearity, heteroscedasticity). However, they do not permit assessment of each dimension’s relative contribution while simultaneously controlling for the others. To address this limitation directly and to provide a formal test of H1 (hierarchical contribution), we estimate a single integrated regression model incorporating one representative variable from each dimension: X3 (content quantity, resource), X7 (content satisfaction, technology), and X12 (likes count, rights protection).
Table 7 reports the integrated model results. All VIF values are below the threshold of 5 (VIFX3 = 3.878, VIFX7 = 2.004, VIFX12 = 3.003), confirming the absence of serious multicollinearity among the three representative variables. The Breusch–Pagan test yields BP = 5.741, below the critical value of 7.815 (χ
2, df = 3, α = 0.05), confirming homoscedasticity. The integrated model achieves R
2 = 0.525 and Adjusted R
2 = 0.287. The overall F-test is F(3, 6) = 2.208,
p = 0.188, which does not reach conventional significance. This outcome is fully anticipated given the census size of
n = 10 with three predictors, which allows for only six residual degrees of freedom—a known constraint of inference in population censuses (see
Section 4.1). Individual coefficient
p-values are similarly wide (X3:
p = 0.829; X7:
p = 0.361; X12:
p = 0.569), reflecting the limited power available rather than the absence of directional effects.The integrated cross-dimensional regression results are presented in
Table 7.
Table 7.
Integrated Cross-Dimensional Regression Results (Y~X3 + X7 + X12).
| Panel A: Model Summary |
| R | R2 | Adjusted R2 | Std. Error of Estimate | Durbin–Watson |
| 0.724 | 0.525 | 0.287 | 0.419 | 1.112 |
| Panel B: ANOVA |
| | Sum of Squares | df | Mean Square | F | Sig. |
| Regression | 1.164 | 3 | 0.388 | 2.208 | 0.188 |
| Residual | 1.054 | 6 | 0.176 | | |
| Total | 2.218 | 9 | | | |
| Panel C: Coefficients and Collinearity Statistics |
| Variable | B | Std. Error | β | t | Sig. | VIF |
| (Unstd.) | (Std.) |
| Constant (β0) | 1.0628 | 0.3246 | — | 3.274 | 0.017 ** | — |
| X3 (Content Quantity) | 2.833 × 10⁻⁴ | 1.255 × 10⁻³ | 0.125 | 0.226 | 0.829 n.s. | 3.878 |
| X7 (Content Satisfaction) | 2.169 × 10⁻³ | 2.192 × 10⁻³ | 0.394 | 0.989 | 0.361 n.s. | 2.004 |
| X12 (Likes Count) | 4.823 × 10⁻⁸ | 8.011 × 10⁻⁸ | 0.294 | 0.602 | 0.569 n.s. | 3.003 |
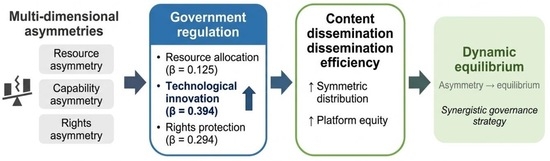
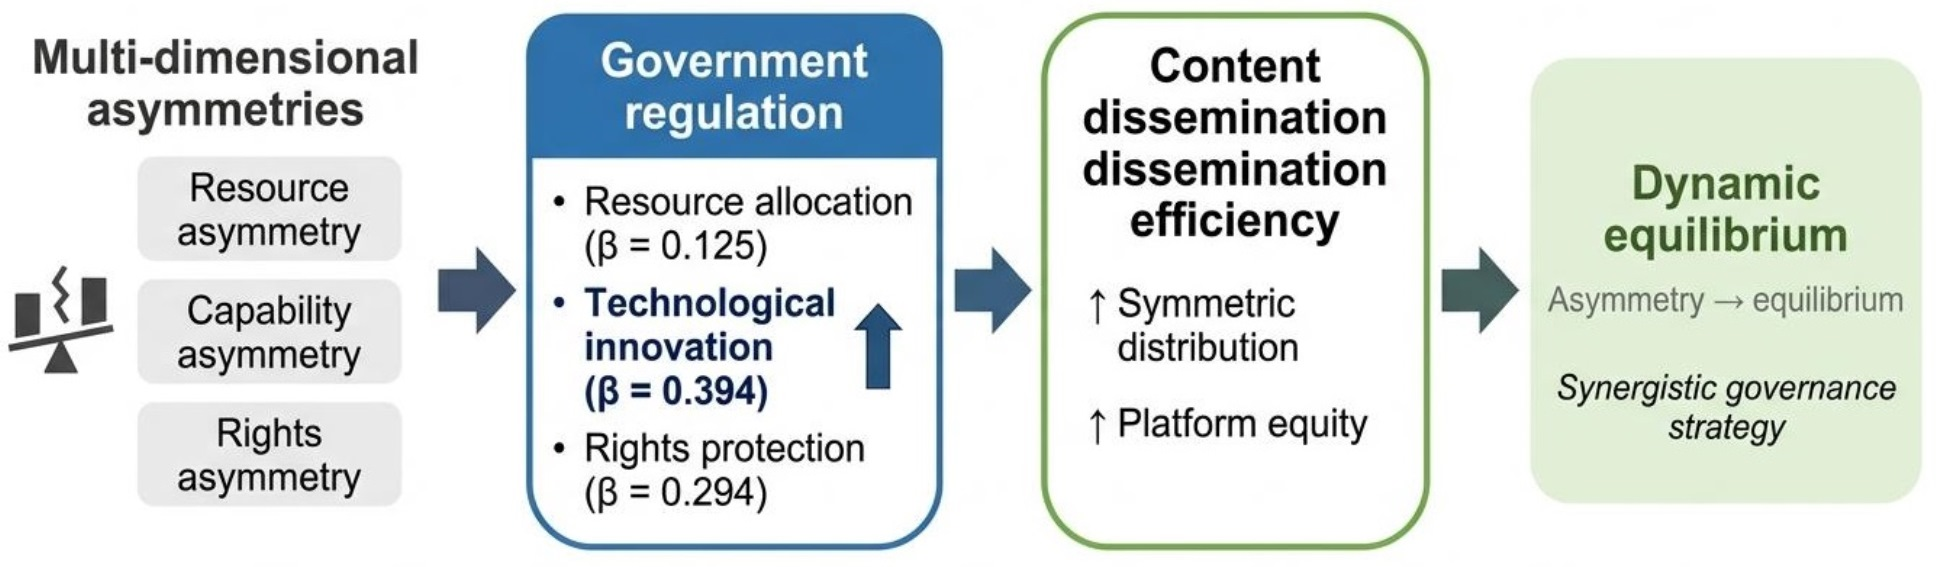
Hierarchical test of H1: Standardized Beta analysis. While individual significance tests are uninformative under n = 10, the standardized Beta coefficients provide a scale-free comparison of relative contribution that is directly interpretable regardless of statistical power. The Beta hierarchy is unambiguous: βX7 = 0.394 > βX12 = 0.294 > βX3 = 0.125. This ordering—Technology > Rights Protection > Resource Allocation—is precisely the hierarchy H1 predicts on the basis of symmetry theory: technological capability asymmetry is the most binding constraint on dissemination efficiency, followed by rights-relational asymmetry, with resource asymmetry playing a foundational but less decisive role. The integrated model therefore provides directional confirmation of H1 at the level of relative magnitude, even though the sample size precludes conventional significance tests of individual coefficients.
Relationship to H2 (conditionality of rights protection). The attenuation of X12’s coefficient in the integrated model relative to the dimension-specific model (
Table 6: B = 2.409 × 10
−7,
p = 0.054; integrated: B = 4.823 × 10
−8,
p = 0.569) is consistent with—and indeed predicted by—H2. H2 states that rights protection’s effect on dissemination efficiency is conditional on complementary technology and resource inputs; when technology (X7) and resource allocation (X3) are simultaneously controlled, the independent marginal effect of X12 diminishes, reflecting its synergistic rather than autonomous mechanism. The sign of X12’s coefficient remains positive in the integrated specification, confirming the directional prediction; only its independent marginal contribution, already shared with X7 and X3, is absorbed by the larger model.
Interpretation and limitations. The integrated model should be read as a robustness and hierarchical check that complements—not replaces—the dimension-specific analyses: the dimension-specific models reveal within-dimension variable selection and provide the primary inferential evidence for H1–H3 in their original formulation, while the integrated model tests whether the cross-dimensional ordering survives simultaneous control. Their convergence in directional pattern (Technology > Rights > Resource, consistently positive coefficients) strengthens our substantive conclusions despite the power constraints of the analytical sample.
4.3. Validation Analysis
To complement the regression-based analyses in
Section 4.2.1,
Section 4.2.2,
Section 4.2.3 and
Section 4.2.4, we report Spearman rank correlation coefficients as a nonparametric robustness check. We distinguish two analytical components: a descriptive per-enterprise pattern analysis (
Table 8) and a formal cross-enterprise analysis (
Table 9).
Table 8.
Results of Spearman’s Rank Correlation Coefficient.
| Enterprises Projects | Resource | Technology | Rights Protection |
|---|
| Number of Contents X3 | Number of Concerns X5 | Content Satisfaction X7 | Number of Likes X12 | Number of Comments X13 |
|---|
| Southern Plus Client | 0.100 | 0.715 | 0.922 | −0.797 | 0.986 |
| Live Nanyang Cloud Broadcast Station | 0.198 | 0.754 | 0.927 | −0.750 | 0.997 |
| Nanyang Press Media | 0.460 | 0.780 | 0.958 | 0.236 | 1.000 |
| Huaihai Evening News | 0.606 | 0.782 | 0.973 | 0.767 | 1.000 |
| Nanyang Daily | 0.631 | 0.786 | 0.974 | 0.864 | 1.000 |
| JiaShang Media | 0.772 | 0.787 | 1.000 | 0.956 | 1.000 |
| Literacy Little Bookworm | 0.806 | 0.944 | 1.000 | 1.000 | 1.000 |
| Snail’s Journey to the West | 0.857 | 0.946 | 1.000 | 1.000 | 1.000 |
| ZhiGeng Library | 0.988 | 0.999 | 1.000 | 1.000 | 1.000 |
| People’s Education Press Tik Tok Channel | 0.996 | 0.999 | 1.000 | 1.000 | 1.000 |
Formal cross-enterprise Spearman analysis (
Table 9).
Table 9 reports the standard Spearman rank correlations between each regulatory indicator and the composite influence score (Y) across all ten enterprises. Four of the five indicators exhibit significant positive associations with Y: X3 (ρ = 0.830,
p = 0.003), X7 (ρ = 0.835,
p = 0.003), X12 (ρ = 0.988,
p < 0.001), and X13 (ρ = 0.830,
p = 0.003). The single exception, X5 (followers count, ρ = 0.455,
p = 0.187), is consistent with the regression finding that raw audience scale is not a reliable predictor of dissemination efficiency independent of content quality. These associations are directionally consistent with H1–H3: all significant indicators relate positively to influence, and the rights protection indicator X12 shows the strongest cross-enterprise rank association. We note, however, that rank correlations in a sample of
n = 10 are sensitive to distributional extremes; the particularly high ρ for X12 reflects in part the skewed distribution of likes (the top two enterprises account for the large majority of total likes), and should be interpreted as suggestive rather than precise.
Table 9.
Cross-Enterprise Spearman Rank Correlations between Regulatory Indicators and Composite Influence (Y).
| Variable | Regulatory Dimension | Spearman ρ | p-Value | Significance |
|---|
| X3 (Content Quantity) | Resource | 0.83 | 0.003 | ** |
| X5 (Followers Count) | Technology | 0.455 | 0.187 | n.s. |
| X7 (Content Satisfaction) | Technology | 0.835 | 0.003 | ** |
| X12 (Likes Count) | Rights Protection | 0.988 | 0 | *** |
| X13 (Comments Count) | Rights Protection | 0.83 | 0.003 | ** |
Descriptive per-enterprise pattern analysis (
Table 8).
Table 8 presents per-enterprise descriptive coefficients that characterize the degree of alignment between each enterprise’s own indicator profile and its overall influence rank. These coefficients are not standard cross-enterprise Spearman correlations; rather, they serve a descriptive function, illustrating how the strength of association between regulatory indicators and influence varies across competitive tiers. We report
Table 8 descriptively and do not rely on it for inferential claims.
A lower-triangular pattern is visible in
Table 8: coefficients are generally lower for higher-ranked enterprises and approach 1.000 for lower-ranked enterprises. We explicitly acknowledge that this pattern is in part a mathematical property of small-sample rank comparisons—with
n = 10, extreme-ranked observations have limited room for discordance, producing coefficients near ±1 by construction. The pattern is therefore consistent with, but not conclusive evidence of, the tier-specific asymmetry dynamics predicted by H3. We treat it as illustrative context that motivates the H3 prediction rather than as independent confirmation.
For Southern Plus Client (ranked first), the per-enterprise coefficient for X12 is −0.797. We do not interpret this as a substantive finding. Given that Southern Plus Client occupies the top rank with the highest absolute X12 value (8,171,226 likes), the negative coefficient reflects a rank-comparison artifact at the distributional extreme rather than a meaningful inverse relationship. We acknowledge this as a limitation of the per-enterprise descriptive analysis rather than a property of the underlying data.
The cross-enterprise Spearman analysis (
Table 9) provides nonparametric corroboration of the regression results: the positive and significant associations for X3, X7, X12, and X13 are directionally consistent with H1–H3. Primary inferential weight rests on the regression analyses (
Table 4,
Table 5,
Table 6 and
Table 7); the Spearman analysis serves as a directional robustness check.