Article

A Spanish Language Proficiency Dataset for AI Evaluation

by
Anselmo Peñas
1,
Álvaro Rodrigo
1,*,
Javier Fruns-Jiménez
2,
Inés Soria-Pastor
2,
Sergio Moreno-Álvarez
1,
Alberto Pérez
1 and
Julio Reyes-Montesinos
1
1
NLP&IR, Departamento de Lenguajes y Sistemas Informáticos, Universidad Nacional de Educación a Distancia, 28040 Madrid, Spain
2
Instituto Cervantes, 28014 Madrid, Spain
*
Author to whom correspondence should be addressed.
Information 2026, 17(2), 159; https://doi.org/10.3390/info17020159
Submission received: 10 December 2025 / Revised: 26 January 2026 / Accepted: 28 January 2026 / Published: 5 February 2026
(This article belongs to the Section Artificial Intelligence)

Abstract

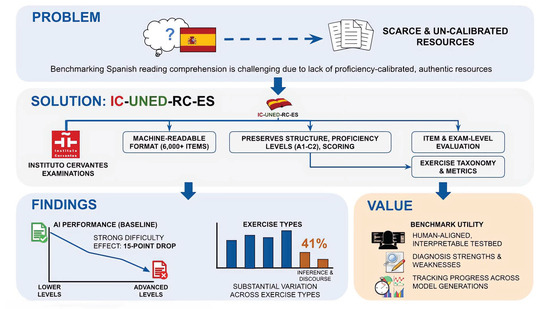
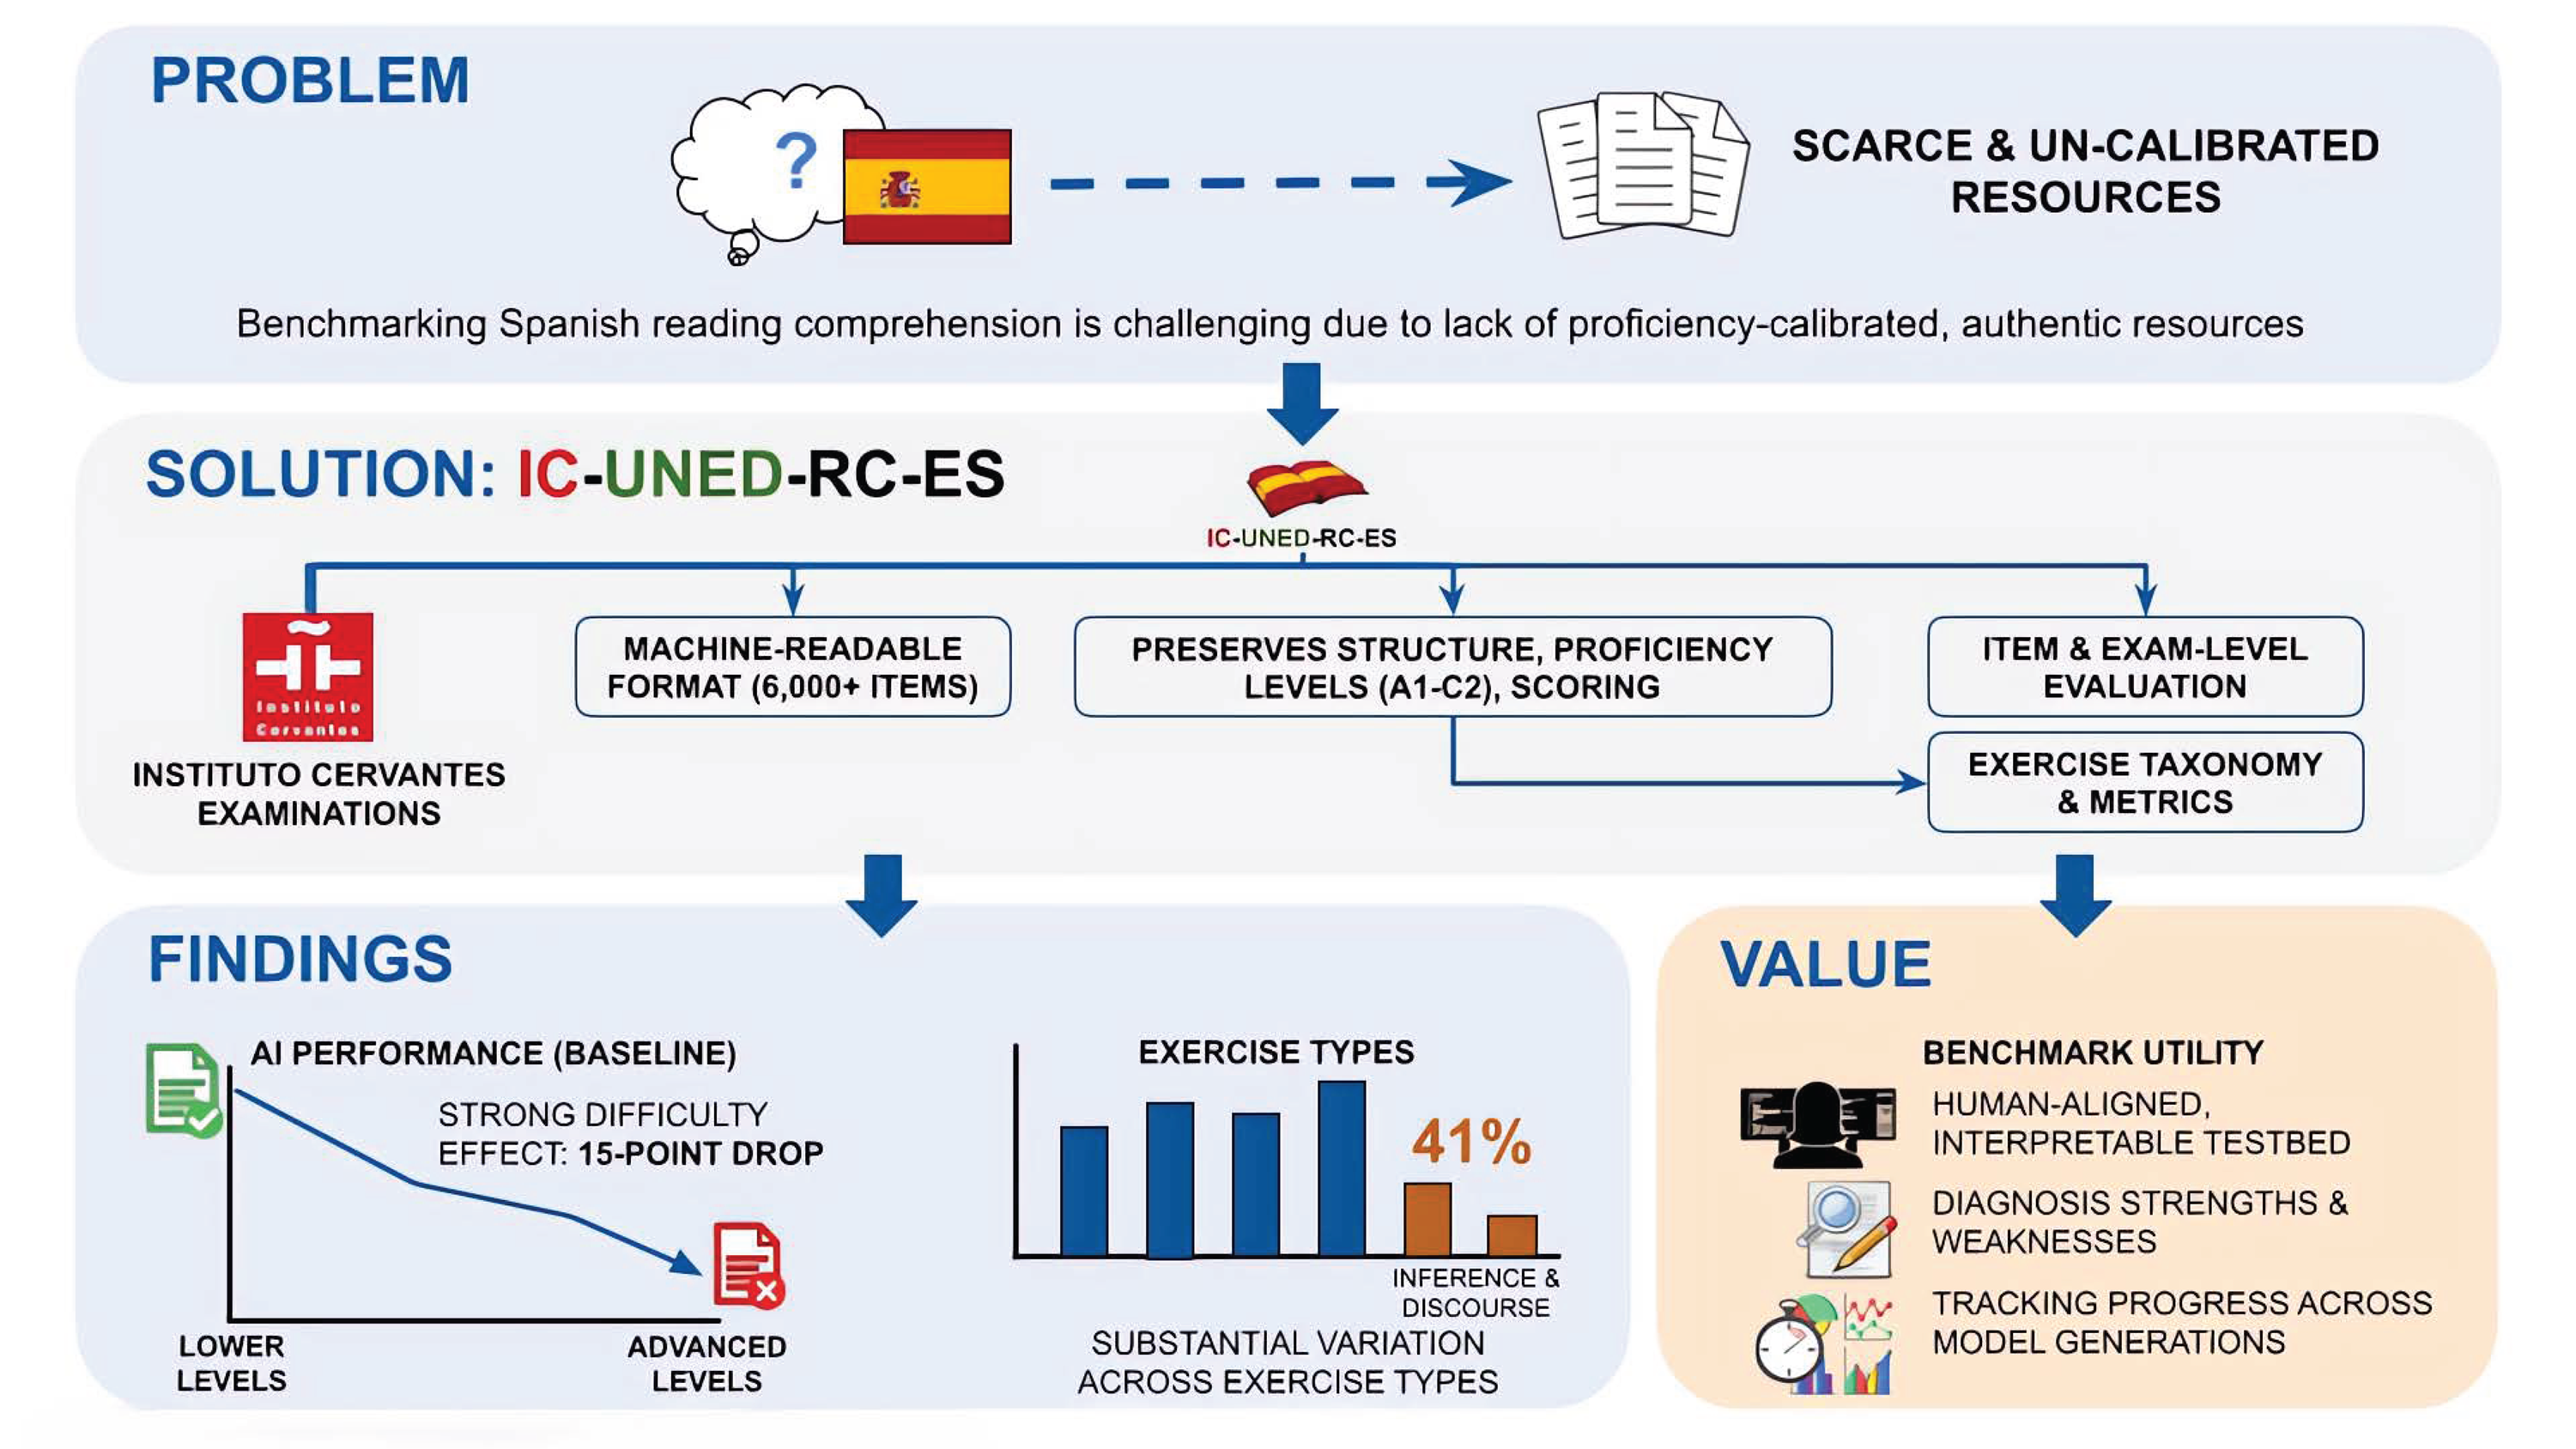
Benchmarking Spanish reading comprehension remains challenging due to the scarcity of proficiency-calibrated resources grounded in authentic human assessments. We introduce IC-UNED-RC-ES, a benchmark comprising more than 6000 items derived from Instituto Cervantes examinations, converted to a machine-readable format while preserving exam structure, proficiency levels, and scoring criteria. Unlike many existing resources, IC-UNED-RC-ES includes a diverse set of exercise formats, combining common multiple-choice questions with new formats such as matching and fill-in-the-gap, which support a broader assessment of reading skills. The benchmark supports evaluation at both the item and exam levels and includes an exercise taxonomy with category-specific metrics. Baseline results with current AI systems reveal a strong difficulty effect (a 15-point drop from lower to advanced levels) and substantial variation across exercise types, with inference- and discourse-heavy categories reaching only 41%. IC-UNED-RC-ES provides a human-aligned, interpretable testbed for diagnosing strengths and weaknesses in Spanish reading comprehension and for tracking progress across model generations.

Graphical Abstract

1. Introduction

The rapid progress of Large Language Models (LLMs) has heightened the need for benchmarks that measure language understanding in a robust, interpretable, and comparable way across systems. This challenge is not specific to any single language: evaluations must capture genuine comprehension (rather than superficial cues), offer diagnostic insight into model behavior, and remain stable enough to track progress over time. However, the current evaluation landscape is strongly English-centric. Many influential benchmarks and leaderboards are primarily available for English, while evaluation resources for other widely used languages are substantially fewer. In Spanish in particular, the limited availability of proficiency-calibrated and diagnostically rich benchmarks makes it harder to quantify progress and to identify strengths and weaknesses in reading comprehension.
A promising way to close this gap is to connect computational benchmarking with established educational measurement. Standardized language exams encode externally validated difficulty progressions, clear administration rules, and transparent scoring schemes. In particular, the Instituto Cervantes (IC) DELE exams are internationally recognized assessments aligned with the Common European Framework of Reference for Languages (CEFR) [1], covering levels A1 to C2. Their reading comprehension component is a closed-response test designed for consistent scoring, making it suitable for reproducible benchmarking while preserving a realistic testing setting.
Despite recent efforts toward structured and diagnostic evaluations for modern AI systems [2,3], there is limited availability of benchmarks built from authentic, validated exam materials used to assess humans that span multiple proficiency levels. Benchmarks that satisfy these properties are important because they enable direct human–machine comparability under the same testing conditions and allow performance to be analyzed as a function of proficiency, not only as a single aggregate score.
To address this gap, we introduce IC-UNED-RC-ES, a Spanish reading-comprehension benchmark derived from original Instituto Cervantes (IC) examination materials. The benchmark contains more than 6000 items and preserves the full exam structure, including the same instructions provided to human examinees. It covers multiple CEFR levels and includes several exercise formats beyond standard multiple-choice, such as matching and gap-filling (fill-in-the-gap) tasks. In addition to item-level scoring, we release exam-level results and pass/fail outcomes to improve interpretability and to enable evaluation under human-aligned criteria. The aim of this study is to provide a proficiency-calibrated, exam-structured benchmark for evaluating Spanish reading comprehension in contemporary AI systems under conditions comparable to standardized human assessment.
Our main contributions are as follows: (1) an exam-faithful Spanish reading-comprehension benchmark grounded in authentic IC materials; (2) a multi-level CEFR evaluation setup that supports difficulty-aware analysis; (3) coverage of diverse exercise types, including formats underrepresented in common LLM benchmarks; and (4) a set of evaluation protocols and baseline results reported at both the question and exam levels, including pass/fail outcomes.
The remainder of the paper is organized as follows. We first discuss related resources and motivate the design choices behind IC-UNED-RC-ES. We then describe the construction methodology, the exercise taxonomy, and the evaluation metrics. Finally, we report baseline results and analyze what they reveal about current AI systems on Spanish reading comprehension.

2. Related Work

2.1. Existing Datasets for Reading Comprehension Evaluation

Machine reading comprehension (MRC) benchmarks typically pair a text with questions and gold answers, differing mainly in the expected response format. The most common settings are: (i) extractive QA, where the system must select an exact span from the input text [4]; (ii) multiple-choice QA, where the system selects one option from a set of candidates [5]; and (iii) generative QA, where the system produces a free-form answer that is compared against references [6]. These choices directly affect annotation cost, evaluation reliability, and what aspects of comprehension a benchmark can probe.
From a data-construction perspective, early evaluation campaigns such as TREC, CLEF, and NTCIR relied on expert-driven collection building. These resources were carefully designed but often limited in scale (frequently below 1000 items per edition), which later proved insufficient for training neural models [7]. The widespread adoption of crowd-sourcing enabled substantially larger benchmarks, including MS MARCO (questions from Bing query logs with human answers) [8], TriviaQA [9], NewsQA [10], and SQuAD [11]. While these datasets accelerated progress, they also introduced well-known challenges: annotation artifacts, spurious correlations, and limited diversity in question types. For example, ref. [12] showed that lexical cues can become unexpectedly predictive in large-scale labeled corpora, and crowd-sourced QA collections often overrepresent simple factoid questions (e.g., 40% of NarrativeQA questions are factoids) [13].
Several benchmarks and protocols have been proposed to improve the diagnostic value of MRC evaluation. QuAIL, for instance, aims to reduce spurious correlations in multiple-choice QA and to balance question types, but this comes with substantial annotation costs, especially for creating plausible distractors [14]. Other approaches incorporate adversarial filtering, where models are used to reject questions that are too easy or that expose annotation shortcuts, trading dataset size for harder, less artifact-prone evaluation [15]. These efforts highlight a recurring trade-off: scaling data collection is feasible, but achieving controlled difficulty and interpretability remains costly.
An alternative is to reuse human examinations, which are typically designed under strict quality-control procedures and can support evaluation under conditions comparable to those of standardized testing. RACE was built from English exams used in China and provides a large-scale multiple-choice benchmark with two difficulty levels [16]. A related example is the dataset developed for the Entrance Exams task at CLEF (2013–2015), consisting of multiple-choice questions from English university admission exams in Japan [17]. Exam-derived resources offer authentic materials and externally grounded difficulty, but they usually focus on a single format (often multiple-choice) and may face redistribution constraints that complicate broad reuse [18].
In contrast to most existing MRC resources, IC-UNED-RC-ES is designed to broaden both the structure and the task coverage of reading-comprehension evaluation. Beyond question–answer formats, it includes exercises based on text matching, a format that is common in semantic similarity evaluation [19] but remains underrepresented in MRC benchmarks. It also includes gap-filling exercises (cloze-style) [20]; unlike typical cloze formulations that use single words or short phrases as candidates, our setting uses longer text candidates, which increases the need for discourse-level understanding. Moreover, our benchmark preserves exam structure and supports evaluation at both the item and full-exam levels, enabling interpretable outcomes such as pass/fail decisions.
Finally, another line of work explores the automatic generation of QA benchmarks to reduce human effort [21], which is particularly attractive in domain-specific settings [22]. However, automatically generated resources often compromise quality control and may not align with the goal of measuring reading comprehension under standardized testing conditions.

2.2. Datasets in Spanish

The evaluation ecosystem is strongly English-centric, and Spanish remains comparatively under-resourced in reading-comprehension benchmarking. Many Spanish QA resources are available mainly through multilingual datasets where the original content is created in English and then translated. MLQA [23] includes Spanish among several languages, but its questions are authored in English and translated. Similarly, XQuAD [24] is derived from SQuAD v1.1 via professional translation into multiple languages, and other efforts focus on automatic Spanish translations of SQuAD [25]. While valuable for cross-lingual evaluation, translation-based benchmarks may inherit English-centric design choices and do not typically provide proficiency-calibrated difficulty progressions grounded in human testing.
Native Spanish resources do exist, but they are often focused on extractive QA and restricted domains. For example, QuALES (IberLEF 2022) provides an extractive benchmark built from COVID-19 news [26]. SQAC is another extractive QA corpus that combines documents from Spanish Wikipedia, Wikinews, and the Spanish AnCora corpus [27,28]. In comparison, there have been fewer efforts to build Spanish benchmarks that include multiple-choice settings and alternative exercise formats or that preserve the structure of standardized human examinations.
IC-UNED-RC-ES addresses this gap by providing a Spanish reading-comprehension evaluation based on authentic Instituto Cervantes examination materials, spanning multiple CEFR levels and retaining the full exam structure and instructions. Its combination of proficiency calibration, diverse exercise types (including matching and gap-filling), and exam-level interpretability (including pass/fail outcomes) enables more diagnostic and human-aligned evaluation than typical Spanish QA benchmarks.

3. Methodology for the Elaboration of Exams

3.1. Specifications for Exam Design

The Instituto Cervantes administers DELE exams according to a set of test specifications that define the structure of each administration. These specifications describe the tests included in the exam and the tasks that compose each test. For every test, they record the duration and the number of tasks; for comprehension tests, they also define the number of items.
For reading comprehension, the specifications constrain the input texts (e.g., genre and approximate length), the comprehension targets (e.g., main ideas, specific details, inference, grammar and vocabulary in context, and text organization), and the response format (e.g., multiple-choice or matching). This blueprinting process ensures that different forms are comparable and that each CEFR level is assessed under consistent conditions.

3.2. Difficulty and Quality Control in DELE

DELE uses a fixed cut-off score to support an interpretable pass/fail decision for candidates and test users. To keep exam forms comparable in difficulty, Instituto Cervantes follows a multi-stage quality-control workflow aligned with established testing guidelines [29,30]. We summarize the main steps below:
1.
Task authoring under the test specifications. Item writers create tasks that match the blueprint (task models, number of items, and time constraints) so that each form targets the same construct.
2.
Use of reference documents. Writers anchor content selection to the Instituto Cervantes Curriculum Plan, which lists grammatical, lexical, pragmatic, and functional inventories expected at each CEFR level.
3.
Successive expert revisions. The coordinating author performs an initial review and then coordinates a validation cycle with expert reviewers. Depending on the test, the workflow includes multiple review rounds (typically 4–7) until the tasks meet quality criteria.
4.
Pre-testing with learners. Instituto Cervantes pilots each form with approximately 100–200 learners who resemble the target candidate population. The pilot includes an anchor task (kept constant across pilots but excluded from operational administrations) to link results across forms.
5.
Psychometric analysis. Analysts evaluate item functioning using standard indices. The difficulty coefficient estimates how easy/hard an item is relative to others, while the discrimination index measures whether the item separates higher- from lower-proficiency examinees.
6.
Item revision. When an item is too easy, too hard, or insufficiently discriminative, writers revise it and re-check it for consistency with the blueprint.
7.
Post-administration monitoring. After an operational call, Instituto Cervantes analyzes candidate results at scale to monitor item functioning and stores validated tasks in a task bank for potential reuse.

3.3. Scoring and Pass/Fail Criteria

DELE exams group skills into two blocks: (i) reading comprehension and written expression, and (ii) listening comprehension and oral expression. Candidates must achieve at least 60% of the maximum score in each block to pass.

3.4. Exercise Types and Mapping to IC-UNED-RC-ES

We reuse only the reading comprehension exercises. DELE includes several task models for assessing reading comprehension; the original formats can be summarized as follows:
1.
A single text followed by several questions.
2.
Several short texts with one question each.
3.
Several texts that must be related to several statements.
4.
Reconstruction of a text.
5.
Multiple texts paired with a larger set of statements/questions; each statement must be assigned to the correct text (with distractors).
6.
Gap-filling: a text with removed fragments and response options.
For IC-UNED-RC-ES, we map these task models into the following three machine-evaluable exercise types:
1.
Multiple-choice. The system must answer questions about a text by selecting the correct option among a small set of candidates (typically three).
2.
Matching. The system must match each query text (or statement) to the best candidate text in a second set. The candidate pool may include distractors, and each query has a single correct match.
3.
Fill-in-the-gap. The system must reconstruct a text by placing removed fragments into the correct gaps. Each gap has exactly one correct fragment, and the candidate pool may contain more fragments than gaps.

3.5. Selection of Exams for IC-UNED-RC-ES and Conversion to a Machine-Readable Format

We constructed IC-UNED-RC-ES from DELE exam booklets spanning 2004–2019, covering multiple CEFR levels and including both earlier and standardized formats.
The original booklets were designed for human test administration and optimized for layout and readability, not for machine parsing. Automatic PDF-to-text conversion is unreliable because visual layout does not necessarily follow the human reading order, and some exercises include non-textual elements. We therefore digitized the exams through a structured manual extraction workflow.
We defined a tabular schema (one row per item) that captures exam metadata (year/call, CEFR level), exercise type, instructions, source texts, questions/statements, candidate options/fragments, and the gold answer(s). This schema constrains the transcription process and supports automated validation.
To minimize transcription errors, we perform automatic checks. We generate checksum fields over critical columns to detect missing values, unintended changes, or inconsistent encodings. We also validate each record against a JSON schema to ensure field completeness and type correctness.
After validation, we convert the tables into JSON to enable (i) programmatic evaluation, (ii) detection of missing fields and structural errors, and (iii) preservation of the exam hierarchy (exam → task → item) together with the original instructions.

4. Description of IC-UNED-RC-ES Dataset

The complete dataset contains 282 exams with 855 exercises. The total number of evaluation points is 6146 (among 16,570 options), distributed by exercise type as shown in Table 1.
The following shows the dataset’s statistics. These are divided by exercise type; concretely, Table 2, Table 3, Table 4 and Table 5 refer to the multiple-choice task, Table 6, Table 7 and Table 8 to the matching task, and Table 9, Table 10 and Table 11 to the fill-in-the-gap task.
The initial table in each exercise type set (Table 2, Table 6 and Table 9) shows the number of elements in each category (e.g., exercises, questions, and options), along with the corresponding token count for each text. Additionally, we calculate the probability of selecting the correct answer for each task, assuming it is selected at random. In this context, each question is analyzed independently, without incorporating information from other questions within the same exercise. The system identifies the correct answer from the complete set of available options for each question, effectively transforming all scenarios into a multiple-choice format, irrespective of whether the same answer appears across multiple questions in matching or fill-in-the-gap exercises.
The rest of the tables display some text complexity measures computed based on the library shared by [31] (Some metrics were slightly modified to fix some runtime errors and to adapt the Fernández-Huerta readability score according to [32], source code available at https://github.com/alpgarcia/text-complexity (accessed on 9 December 2025)). These measures are intended to provide clearer insights into the expected difficulty of addressing the different exercise types, going beyond mere reporting of system performance statistics typically presented in other collections. A subset of the metrics introduced in the referenced article is computed and described as follows:
  • Lexical complexity [33], determined by the number of different content words per sentence (Lexical Complexity Index) and the number of low-frequency words per 100 content words (Index of Low Frequency Words). The higher the former, the greater the difficulty in reading comprehension.
  • Complexity of sentences [33], focuses on measuring the number of words per sentence, thus obtaining the sentence length index (average sentence length), and the number of complex sentences per sentence, from a complex sentence index (complex sentences).
  • Readability of Fernández-Huerta [34] is an adaptation of the Flesch Reading Ease score [35] into Spanish, based on the number of syllables and the number of sentences. We use the corrected version of the formula as suggested by [32]. A higher score indicates that the text is easier to read: 0–30 is very hard, 30–50 is hard, 50–60 is slightly hard, 60–70 is normal for an adult, 70–80 is slightly easy, 80–90 is easy, and 90–100 is very easy.
  • Readability of Flesch-Szigrist (IFSZ) is a modification of the Flesch Reading Ease score [35] adapted to Spanish by [36]. The metric combines the average number of syllables per word and the average number of words per sentence in the text.
  • Mean dependency tree depth [37] aims at capturing syntactic complexity in terms of recursive or nested structures. Higher depth means the text is more complex to read.
  • Minimum age to understand [38], adapted into Spanish from the Flesch Reading Ease score [35], measures the average number of syllables per word and the average number of words per sentence to obtain the minimum age needed to understand a text.
Thus, we can summarize the most relevant aspects of the dataset as follows:
  • First, it is important to highlight that fill-in-the-gap and matching exercises are uncommon in other collections, regardless of the language. Results indicate that the probability of randomly choosing the correct answer in these types of exercises (around 0.1) is lower than in multiple-choice exercises (around 0.3). Thus, in addition to the difficulty of their own content, matching and fill-in-the-gap exercises introduce the added complexity of more combinations, making it more challenging to succeed through random guessing. This makes our dataset especially relevant for research purposes in the field.
  • Comparing the complexity measures across the different exercise types reveals consistent trends and values at each level, except for readability measures in the fill-in-the-gap tasks, which show the lowest scores. This indicates that the texts used in this exercise type are more difficult to read.
  • In general, our results align with the exam levels, validating them and opening the door for assessing the expected exercise difficulty for each level.
  • Although these measures have proven effective as indicators of proficiency, certain aspects relevant to the most advanced levels may be only partially captured, as examiners may look for the use of specific syntactic constructions that do not necessarily imply more complex texts but rather deeper language understanding. Additional mechanisms may be required to account for specific lexical or grammatical structures in order to more accurately determine the complexity of texts at those levels. This is reflected in the last rows of the complexity metrics tables, where several cases show similar values for B2 to C2 levels, compared with the previous ones.
We will delve deeper into specific results in the following subsections, offering a detailed analysis of each exercise type.

4.1. Multiple-Choice

As shown in Table 2, Table 3, Table 4 and Table 5, the lexical complexity increases as the level does for the text and question fragments, until the B2 level. For C* levels, the lexical complexity remains slightly under the B2 level. A plausible explanation is that, at these levels, the grades are more focused on the use of specific terminology or grammatical constructions rather than on the complexity, understood as the number of different words used. For the option texts, greater variability is observed, likely due to their brevity, which makes it difficult to capture substantial differences in word usage.
The complexity of sentences follows a similar overall pattern, although some values deviate from the expected trend for levels A1E and A2B1E. These examinations are in special formats that grant certification across multiple levels, which may account for the increased complexity of sentence length. The number of exercises available for these two levels, as well as for C1, is smaller than for the remaining levels, a factor that may also contribute to the observed deviations.
Fernández-Huerta and IFSZ readability measures follow a similar pattern. For the texts, readability decreases from A1 to C1, then increases to C2, which remains the same as B2. As for the complexity measures, this could be due to a different focus on how to measure language proficiency, which is not achieved by increasing syntactic complexity but by utilizing specific lexical or grammatical resources. Questions consist of relatively short texts, which generally results in high readability values. However, two exceptions are observed at levels B1 and C1, where readability decreases noticeably. In the case of C1, this outcome may be attributed to the small sample size, which reduces the measure’s reliability. For B1, no clear explanation for the low readability value can be identified. Nevertheless, considering the brevity of these texts, variations in the metric may be regarded as acceptable. Option texts are the shortest (except for level A2B1E) and exhibit a decreasing readability trend up to level B1. At higher levels, readability improves compared to B1, although it remains lower than at the A* levels, with a gradual increase in readability as the proficiency level rises.
The mean dependency tree depth for the texts is higher at the higher levels (B2, C*), and is quite similar among the rest (except A2B1E). This metric is not applicable to questions and options because they have a limited number of tokens. The Minimum Age to Understand measure is self-explanatory and exhibits a clear, consistent, increasing pattern.
In general, for multiple-choice questions, we observed higher readability values, which we believe are related to the nature of the exercises. We also found that the complexity metrics usually increase as the exam level rises up to B2. The most proficient levels, from B2 to C2, are more balanced because the examiners probably look for specific expressions or syntactic constructions that do not necessarily imply an increase in text complexity in terms of statistical data of terminology usage; that is, they look for specific terms or sentences that do not relevantly increase the number of different terms used or the number of terms by sentence, nor the syllables or sentence structure tree depth, but they indicate a higher knowledge of the use of the language by their mere understanding.

4.2. Matching

Table 6, Table 7 and Table 8 demonstrate that answers are usually longer than questions, given their number of tokens, which makes sense given the nature of the exercise. Answer length generally increases with proficiency level, with the exception of C2, which will be discussed later in relation to the results of the complexity measures.
Lexical complexity shows a low value (given the trend) for B2 level questions, probably because the number of tokens is more similar to A* levels than to B1 and C* levels. The same pattern applies to the complexity of sentences. For both metrics, the C2 level deviates from the expected increasing pattern. Since the number of tokens per answer is considerably smaller than at the B2 and C1 levels, the observed complexity at C2 is likely attributable to the use of specific lexical and grammatical structures, as previously noted in the case of multiple-choice exercises.
Regarding the readability measures, question texts show decreasing readability as the proficiency level increases, with the exception of C2. This deviation at C2 is influenced by the same factors identified for the previous measures.
Mean dependency tree depth and minimum age to understand follow a very similar pattern (minimum age to understand shows a slightly decreasing B2 level value, but it is so close to B1 that it is not taken into account; the same happens with the mean dependency tree depth for the C1 level). For the answers, the patterns are also very similar for the lexical complexity, complexity of sentences, readability, and minimum age to understand measures, except for the A1E and A2B1E levels. The mean dependency tree depth for the answers decreases at the C1 and C2 levels, a result explained by the lower average number of tokens in these responses compared with those at the other levels.
Overall, the measures show the expected increase in linguistic complexity across proficiency levels, with C2 diverging more frequently due to its shorter texts and more targeted structures. Questions become less readable and more complex as levels rise, while answers generally follow the same pattern, though low-level groups and the C1–C2 range introduce small irregularities. These deviations are largely explained by differences in token counts and the specific lexical–grammatical choices characteristic of certain levels, as explained in the previous Section 4.2.

4.3. Fill-in-the-Gap

As observed in Table 9, Table 10 and Table 11, the number of tokens in the texts is always greater than in the options. Both numbers increase as the level increases. In this case, all measures vary according to the level of the exam for both text and options: Lexical complexity and complexity of sentences increase level by level; Readability measures suggest that as the level increases, the texts are more complex to comprehend; Mean dependency tree depth is very similar for B* and C1 levels, while for C2 it shows a more remarkable increase in both cases; Minimum age to understand values are closer within B* levels, with a bigger difference between B2 and C1 levels and between C1 and C2 levels, especially for the options (always displaying an increasing pattern). Globally, the options texts seem to be slightly more complex than the texts for C* levels. For B* levels, the global trend is more oriented towards finding texts somewhat more complex than the options.
The fill-in-the-gap data show a consistent rise in text and option length across proficiency levels, with all complexity measures increasing accordingly. Lexical and sentence complexity, readability difficulty, and minimum age to understand all scale upward from B levels through C2, while mean dependency depth remains stable until a sharper jump at C2. Overall, options tend to be slightly more complex than texts at the C levels, whereas the opposite pattern appears at the B levels. This shows that the complexity increases with the levels, validating the data for this exercise type as well.

5. Evaluation Metrics

5.1. Human Evaluation

The evaluation conducted by the Instituto Cervantes assesses individuals based on the total number of correct answers in each exam, without deducting points for incorrect responses.
As defined above, examinees must meet a 60% cut score to pass. This value is not an arbitrary threshold introduced in this study, but the official passing standard established by the Instituto Cervantes. To verify that this cut score is appropriate, the development of each exam includes an expert-judgment standard-setting process to establish and validate the cut score, and a psychometric analysis of the first operational test form trialed with candidates at the target level, specifically to confirm that examinees calibrated as being at that level obtain a “Pass” outcome. In addition, the institution applies systematic procedures to ensure comparability across different test forms, including adherence to detailed test specifications and reference frameworks. The same threshold is retained in our experiments to preserve the official evaluation conditions for the reading comprehension component, thereby assessing the system under the same criterion applied to a standard test in that section. Note that our evaluation does not include the Listening Comprehension and Oral Expression evaluations.

5.2. Machine Evaluation

In line with the criteria applied in human evaluation, accuracy (defined as the proportion of correct responses) is adopted as the evaluation metric, since each question provides only a single correct option. This approach enables a direct comparison between the performance of automatic systems and that of human examinees under equivalent conditions.
No penalty for incorrect answers is introduced to adjust for random guessing, in order to preserve comparability with human results [39]. Moreover, such penalization lacks a solid theoretical foundation and is unnecessary in examinations with a large number of questions and multiple response options, as is the case with the present dataset [40].
The exact evaluation per exercise type is as follows:
  • Multiple-choice exercises: We measure accuracy as the proportion of questions correctly answered.
  • Matching exercises: We measure accuracy as the proportion of correctly matched texts.
  • Fill-in-the-gap exercises: We measure accuracy as the proportion of correctly filled gaps.
On the other hand, two different perspectives are used for system evaluation:
  • At the question level, where correct answers are counted across all exercises associated with the same task, providing an assessment of task-specific performance.
  • At the exam level, where scores for each exam are considered. Each exam contains several exercises of different types. An exam is deemed to be passed if an accuracy score (calculated as the proportion of correct answers) above 0.6 is reached. Then, the proportion of passed exams is given as a global score. The idea is to summarize functional performance across task types with varying cognitive demands, providing an indicator of overall assessment difficulty.

6. Experimental Analysis

Three baselines were evaluated under a zero-shot approach to assess the dataset’s difficulty for current technologies and establish an initial set of reference results. For the first baseline, namely multiple-choice, intermediate-task fine-tuning is applied to adapt the model to the multiple-choice reading-comprehension formulation. In this regard, no system was trained with task-specific data from this resource. The baseline models were executed on four NVIDIA A30 GPUs, each equipped with 24 GB of RAM.
The experimental evaluation comprises tasks with distinct output structures, which motivates the use of appropriate baselines rather than a single model family across all tasks. This choice preserves each natural formulation and avoids additional specific engineering introduced solely to compensate for architectural mismatch. This enables a representative baseline suite that spans both established encoder-based approaches and current instruction-tuned generative models.
For the multiple-choice questions, the selected model is an XLM-RoBERTa-Large finetuned on the RACE dataset [16]. The fine-tuning is intentionally lightweight and uses only RACE data, aiming to adapt the model to the decision mechanism and input representation rather than to the target exam content. The selection of this dataset is based on the similarity of the task compared to multiple-choice. The hyperparameters selected for fine-tuning the model are the following. The learning rate is set to 3 × 10⁻⁵ during 3 epochs with a batch size of 4. The selected optimizer is AdamW. The evaluation is conducted by loading the fine-tuned checkpoint with the same configuration.
Regarding the matching questions, generative models are employed; concretely, Llama-3-8b (https://huggingface.co/Kukedlc/LLaMa-3-8b-Spanish-RAG-v2.1 (accessed on 9 December 2025)) is used to select the correct answer. The model represents a variant of the original architecture that has been fine-tuned on high-quality Spanish corpora, thereby enhancing its Spanish text-generation capabilities and aligning it closely with the linguistic characteristics of the proposed dataset. The evaluation is performed with an asymmetric, non-uniform quantization of 4 bits, using double quantization with bfloat16 as the computation data type.
Following the dynamic of the matching task on using generative models, the model known as Mixtral-8x7b (https://huggingface.co/TheBloke/Mixtral-8x7B-Instruct-v0.1-GPTQ (accessed on 9 December 2025)) is used for the fill-in-the-gap task. The main branch uses 4-bit quantization. The remaining hyperparameters are maintained by default, and the torch data types are set to bfloat16. The parameters are a sequence length of 8192, without group size, and lower VRAM requirements.

6.1. Question Level Results

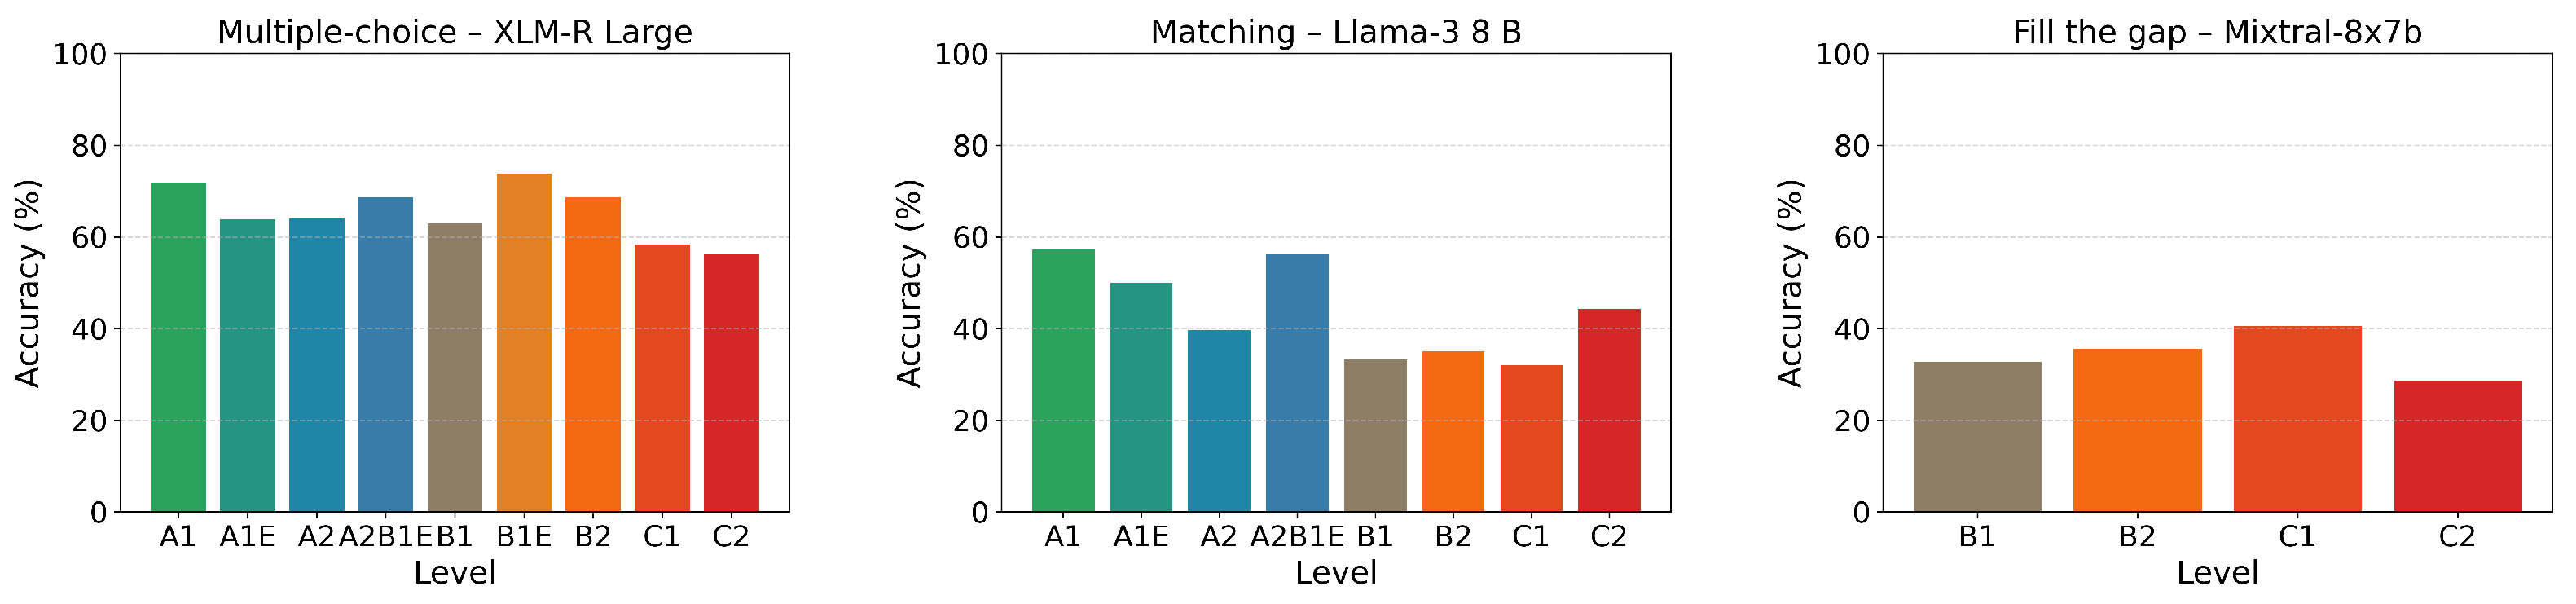
The analysis first considers question-level accuracy, in which each item is evaluated independently rather than aggregated into pass–fail criteria at the exam level. The results, presented in Table 12, indicate that performance generally declines as the proficiency level increases within the same task type. A detailed evaluation of each task at this level is provided in the subsequent sections, and a summary of the results is illustrated in Figure 1.
For the multiple-choice task, accuracy remains robust through the lower and intermediate proficiency levels, reaching almost 72% at A1 and peaking at nearly 74% for the B1E subset. The model handles the A-series and most B-series questions with only modest variation, concretely, between 63% and 69%, despite increases in the average number of questions. Performance deteriorates sharply in the advanced C-levels, dropping to 58% at C1 and 56% at C2. This decline reflects the greater lexical nuance and syntactic complexity of these levels. Overall, the XLM-RoBERTa-Large model demonstrates dependable competence for automated scoring up to B2 difficulty but would benefit from further domain adaptation to address the subtleties of higher-level examinations. Notably, XLM-RoBERTa often performs well through strong lexical and semantic alignment and effective modeling of local context. However, as item difficulty increases, performance increasingly depends on deeper inference and fine-grained semantic distinctions that are not fully captured by generic multilingual pretraining and limited task adaptation. In addition, its fixed input length and typical truncation strategies can omit relevant evidence in longer passages, a limitation that longer-context architectures and evidence-selection approaches can mitigate. Similar results are observed with RACE-C using BERT [41] after fine-tuning on the same dataset.
The matching task exhibits markedly lower and more variable accuracy across all difficulty tiers. The Llama-3 8B model achieves the best score of 57% at A1, slips to roughly 40% at A2, and reaches a minimum of 33% at B1. A transient recovery to 56% on the A2B1E subset suggests occasional leverage of explicit lexical cues, yet performance remains below 45% for the advanced C-levels. This pronounced degradation indicates that the eight-billion-parameter model struggles with the fine-grained semantic alignment required for matching exercises, particularly as linguistic complexity increases. Specifically, this task requires the model to induce a globally consistent alignment between two sets whose items are often near-paraphrases distinguished by subtle entailment cues. As an instruction-tuned generative model, it produces the mapping via free-form generation rather than discrete classification, which increases susceptibility to locally plausible but globally inconsistent assignments and allows early errors to propagate across subsequent matches. Each query item is processed sequentially against the candidate text set, mirroring the procedure followed by examinees. The baseline constrains the model to produce outputs in a fixed, structured schema in which each query identifier is associated with exactly one label from the admissible set. This design ensures that the reported accuracy captures decision quality under the task constraints, rather than artifacts arising from output formatting variability. These weaknesses are amplified at higher proficiency levels, where distinctions rely less on lexical overlap and more on inference. As a solution, larger models, specialized alignment training, or hybrid retrieval-generation strategies appear necessary to attain reliable accuracy for this task type. Fine-tuning on a closely related task can enhance the model’s decision-making capability. Also, a multi-agent training framework could be considered as an additional approach to improve performance.
The fill-in-the-gap task is evaluated under the Mixtral-8×7B. Question-level accuracy is assessed only for intermediate and advanced tiers. The obtained accuracies, markedly lower than the multiple-choice results obtained with the XLM-RoBERTa-Large model and comparable to the matching outcomes of Llama-3 8B, highlight the considerable lexical-contextual reasoning required to supply a correct token rather than selecting an option. The findings for this model are consistent with both the demands of the fill-in-the-gap task and the generative operation underlying it. The model must jointly identify the appropriate insertion point and distinguish among highly similar candidate fragments by leveraging discourse coherence and fine-grained lexical–syntactic compatibility with the surrounding context. In our setup, the full text and all candidate fragments are provided, and the model must produce the complete set of placements in a single pass, which increases the risk of globally inconsistent assignments and of propagating errors across gaps. As a sparse Mixture-of-Experts model, Mixtral is optimized for next-token prediction, whereas zero-shot structured placement demands precise long-range grounding and explicit global consistency that are not directly enforced by the training objective. This limitation is reflected in the sharp drop at C2, where lower-frequency constructions further amplify uncertainty in fragment selection and placement.
As previously mentioned, tasks are evaluated under a zero-shot approach and only with specific task fine-tuning on the multiple-choice task. Within this constraint, the recorded accuracies attest to each model’s linguistic capability rather than to any familiarity gained from exposure to specific item formats or subject matter. As a summary, the XLM-RoBERTa-Large model leverages broad lexical coverage and contextual representations to perform reliably on lower- and mid-level multiple-choice questions. However, the absence of targeted adaptation becomes evident at the C levels, where idiomatic usage and syntactic subtlety outstrip the model’s pretrained knowledge. The weak performance of Llama-3 8B on matching tasks is likewise unsurprising. The model requires fine-grained semantic alignment without access to examples of the pairing structure during training, an operation that typically benefits from supervised calibration. In the fill-in-the-gap task, the model must supply an exact lexical item rather than choose among alternatives; the task demands tighter lexical–contextual coupling than either multiple-choice or matching. Taken together, these results confirm that zero-shot performance across all three tasks primarily reflects each model’s underlying representational capacity. Overall, the proposed dataset aligns with established methodologies for benchmark construction in the literature, such as RACE-C [41]. Model performance generally declines as domain specificity and access to external knowledge diminish, which limits the ability to perform higher-level reasoning. A consistent degradation in accuracy is also observed across tasks as inference becomes more context-dependent and less recoverable from surface cues, a trend reported in related benchmark studies [42].

6.2. Exam Level Results

Following the question-level analysis by task type, we perform an exam-level evaluation by aggregating scores across all tasks within each exam and comparing the resulting overall score against the 60% passing threshold defined earlier.
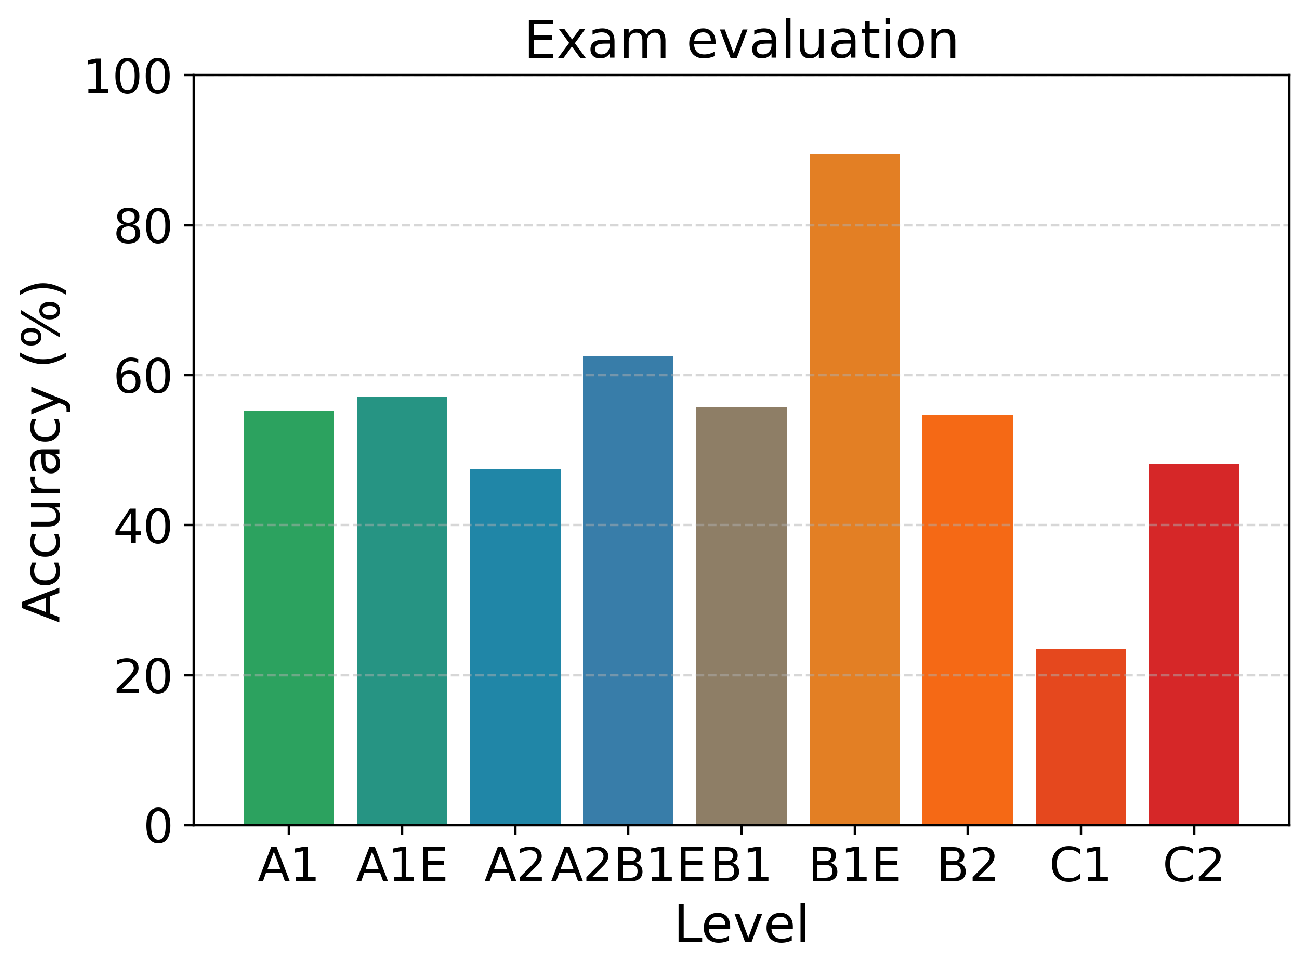
Table 13 aggregates question-level outputs across exercise types into a single exam-level outcome (pass or fail) and reports the proportion of exams exceeding the threshold. The corresponding results are also visualized in Figure 2. Since distinct baselines are adopted for different task formats, the resulting exam-level score reflects a composite evaluation pipeline that aggregates task-specific systems (XLM-RoBERTa for multiple-choice, LLaMA-3 8B for matching, and Mixtral-8×7B for fill-in-the-gap) rather than the performance of a single unified model. Accordingly, this measure should be interpreted as an ensemble-style summary of baseline coverage and overall benchmark difficulty across task types, rather than an end-to-end exam-taking score for a single model. This is reserved for the task-level analyses, where each system is evaluated consistently within its corresponding exercise format. The exam-level aggregation is included to characterize how a representative set of current state-of-the-art approaches, spanning different language processing paradigms, performs when considered jointly at the exam-form level. Under this setting, performance is comparatively stable up to B2 difficulty, while generalization degrades for advanced materials requiring finer lexical nuance and cross-sentence discourse reasoning.

7. Conclusions

Reading comprehension provides a demanding test bed for evaluating whether contemporary AI systems can perform language understanding. However, many widely used benchmarks have been designed primarily for machine evaluation convenience, often overlooking the pedagogical principles that underpin reliable assessment of comprehension. This situation is further compounded by the strong English bias of existing resources and by the widespread inclusion of benchmark data in model pre-training, which weakens their value as independent evaluation instruments.
In this work, we introduced IC-UNED-RC-ES, a Spanish reading-comprehension benchmark grounded in authentic Instituto Cervantes examination materials originally developed for human proficiency assessment. Because these exams were designed under strict quality-control procedures and aligned with CEFR proficiency levels, the resulting benchmark supports evaluation under standardized and interpretable conditions. This enables direct comparison between human and machine performance, not only at the level of individual items but also at the level of full exam sittings and pass/fail outcomes. The inclusion of multiple exercise formats, including matching and fill-in-the-gap tasks that are rarely used in machine reading comprehension benchmarks, further broadens the evaluation’s diagnostic scope.
Beyond its immediate contribution as a Spanish-language resource, IC-UNED-RC-ES highlights the value of leveraging validated educational assessments for computational benchmarking. Framing model performance in terms of externally defined proficiency targets facilitates more meaningful interpretation than raw accuracy alone and supports longitudinal tracking of progress across model generations. This approach also opens the door to more transparent and accountable evaluation practices, particularly in multilingual settings where comparable resources remain scarce.
At the same time, several limitations must be acknowledged. First, although DELE exams are carefully designed, they reflect specific pedagogical assumptions, cultural contexts, and language-use scenarios. As a result, models trained or evaluated exclusively on DELE-derived data may inherit biases toward specific text genres, registers, or test-taking strategies. Second, the benchmark focuses solely on reading comprehension and does not cover other dimensions of communicative competence, such as listening, writing, or interaction, which are also central to language proficiency. Third, while the dataset is released for evaluation, safeguarding it against contamination through inclusion in future training corpora remains an ongoing challenge that requires active curation and responsible use.
Regarding cross-lingual applicability, the methodology adopted in this work is not inherently language-specific. The principles of exam-faithful data reuse, proficiency calibration, and exam-level evaluation can be transferred to other languages where standardized assessments exist. However, direct cross-lingual comparison of scores should be approached with caution, as proficiency frameworks, test design traditions, and sociolinguistic factors differ across languages. Extending this line of work, therefore, requires both technical adaptation and close collaboration with language-assessment experts.
Future work will focus on extending IC-UNED-RC-ES along two directions. First, we plan to incorporate multimodal questions that combine text and images, reflecting authentic exam tasks that require integrated interpretation. Second, we aim to explore controlled extensions to other skill areas and languages, further strengthening the role of standardized educational assessments as a foundation for fair and interpretable evaluation of AI language systems.

Author Contributions

Conceptualization, A.P. (Anselmo Peñas), J.F.-J., I.S.-P.; methodology, A.P. (Anselmo Peñas) and Á.R.; software, S.M.-Á., A.P. (Alberto Pérez) and J.R.-M.; validation, Á.R., S.M.-Á., A.P. (Alberto Pérez) and J.R.-M.; formal analysis, S.M.-Á. and A.P. (Alberto Pérez); investigation, A.P. (Anselmo Peñas), Á.R., S.M.-Á. and A.P. (Alberto Pérez); resources, J.F.-J. and I.S.-P.; data curation, A.P. (Anselmo Peñas) and J.R.-M.; writing—original draft preparation, A.P. (Anselmo Peñas), Á.R., S.M.-Á. and A.P. (Alberto Pérez); writing—review and editing, A.P. (Anselmo Peñas), Á.R., S.M.-Á. and A.P. (Alberto Pérez); visualization, A.P. (Alberto Pérez); supervision, A.P. (Anselmo Peñas) and Á.R.; project administration, A.P. (Anselmo Peñas); funding acquisition, A.P. (Anselmo Peñas) and Á.R. All authors have read and agreed to the published version of the manuscript.

Funding

This work has been partially supported by the DeepInfo (PID2021-127777OB-C22) and DeepSocial (PID2024-159202OB-C22) projects funded by MCIN/AEI/10.13039/501100011033 and by FEDER.

Institutional Review Board Statement

No identifiable personal information or sensitive data were accessed in the study. So the Institutional Review Board approval is not needed.

Informed Consent Statement

Informed consent was obtained from all subjects involved in the study.

Data Availability Statement

The dataset described in this paper can be found at https://zenodo.org/records/15790139 (accessed on 9 December 2025).

Conflicts of Interest

The authors declare no conflicts of interest.

References

  1. European-Council. Relating Language Examinations to the CEFR. Highlights from the Manual. 2011. Available online: https://www.ecml.at/Portals/1/documents/ECML-resources/2011_10_10_relex._E_web.pdf?ver=2018-03-21-100940-823 (accessed on 9 December 2025).
  2. De Rodrigo, I.; Sanchez-Cuadrado, A.; Boal, J.; Lopez-Lopez, A.J. The MERIT Dataset: Modelling and Efficiently Rendering Interpretable Transcripts. Pattern Recognit. 2025, 172, 112502. [Google Scholar] [CrossRef]
  3. Alawwad, H.A.; Alhothali, A.; Naseem, U.; Alkhathlan, A.; Jamal, A. Enhancing textual textbook question answering with large language models and retrieval augmented generation. Pattern Recognit. 2025, 162, 111332. [Google Scholar] [CrossRef]
  4. Wang, L.; Zheng, K.; Qian, L.; Li, S. A Survey of Extractive Question Answering. In Proceedings of the 2022 International Conference on High Performance Big Data and Intelligent Systems (HDIS), Tianjin, China, 10–11 December 2022; pp. 147–153. [Google Scholar] [CrossRef]
  5. Aydin, B.I.; Yilmaz, Y.S.; Li, Y.; Li, Q.; Gao, J.; Demirbas, M. Crowdsourcing for multiple-choice question answering. In Proceedings of the Twenty-Eighth AAAI Conference on Artificial Intelligence, Québec City, QC, Canada, 27–31 July 2014; AAAI Press: Palo Alto, CA, USA, 2014; pp. 2946–2953. [Google Scholar]
  6. Chen, A.; Stanovsky, G.; Singh, S.; Gardner, M. Evaluating Question Answering Evaluation. In Proceedings of the 2nd Workshop on Machine Reading for Question Answering, Hong Kong, China, 4 November 2019; pp. 119–124. [Google Scholar] [CrossRef]
  7. Voorhees, E.M.; Tice, D.M. Building a Question Answering Test Collection. In Proceedings of the 23rd Annual International ACM SIGIR Conference on Research and Development in Information Retrieval, New York, NY, USA, 24–28 July 2000; pp. 200–207. [Google Scholar] [CrossRef]
  8. Nguyen, T.; Rosenberg, M.; Song, X.; Gao, J.; Tiwary, S.; Majumder, R.; Deng, L. MS MARCO: A Human Generated MAchine Reading COmprehension Dataset. In Proceedings of the Workshop on Cognitive Computation: Integrating Neural and Symbolic Approaches 2016 Co-Located with the 30th Annual Conference on Neural Information Processing Systems (NIPS 2016), Barcelona, Spain, 9 December 2016; Volume 1773, p. 112278. [Google Scholar]
  9. Joshi, M.; Choi, E.; Weld, D.S.; Zettlemoyer, L. TriviaQA: A Large Scale Distantly Supervised Challenge Dataset for Reading Comprehension. In Proceedings of the 55th Annual Meeting of the Association for Computational Linguistics (Volume 1: Long Papers), Vancouver, BC, Canada, 30 July–4 August 2017; pp. 1601–1611. [Google Scholar]
  10. Trischler, A.; Wang, T.; Yuan, X.; Harris, J.; Sordoni, A.; Bachman, P.; Suleman, K. NewsQA: A Machine Comprehension Dataset. In Proceedings of the 2nd Workshop on Representation Learning for NLP, Vancouver, BC, Canada, 3 August 2017; pp. 191–200. [Google Scholar] [CrossRef]
  11. Rajpurkar, P.; Jia, R.; Liang, P. Know What You Don’t Know: Unanswerable Questions for SQuAD. In Proceedings of the 56th Annual Meeting of the Association for Computational Linguistics (ACL), Melbourne, Australia, 15–20 July 2018; Volume 2, pp. 784–789. [Google Scholar]
  12. Gururangan, S.; Swayamdipta, S.; Levy, O.; Schwartz, R.; Bowman, S.; Smith, N.A. Annotation Artifacts in Natural Language Inference Data. In Proceedings of the 2018 Conference of the North American Chapter of the Association for Computational Linguistics: Human Language Technologies, Volume 2 (Short Papers), New Orleans, LA, USA, 1–6 June 2018; pp. 107–112. [Google Scholar] [CrossRef]
  13. Kočiský, T.; Schwarz, J.; Blunsom, P.; Dyer, C.; Hermann, K.M.; Melis, G.; Grefenstette, E. The NarrativeQA Reading Comprehension Challenge. Trans. Assoc. Comput. Linguist. 2018, 6, 317–328. [Google Scholar] [CrossRef]
  14. Rogers, A.; Kovaleva, O.; Downey, M.; Rumshisky, A. Getting Closer to AI Complete Question Answering: A Set of Prerequisite Real Tasks. In Proceedings of the AAAI Conference on Artificial Intelligence, Atlanta, GA, USA, 11–15 July 2020; Volume 34, pp. 8722–8731. [Google Scholar] [CrossRef]
  15. Dua, D.; Wang, Y.; Dasigi, P.; Stanovsky, G.; Singh, S.; Gardner, M. DROP: A Reading Comprehension Benchmark Requiring Discrete Reasoning Over Paragraphs. In Proceedings of the 2019 Conference of the North American Chapter of the Association for Computational Linguistics: Human Language Technologies, Volume 1 (Long and Short Papers), Minneapolis, MN, USA, 4 June 2019; pp. 2368–2378. [Google Scholar] [CrossRef]
  16. Lai, G.; Xie, Q.; Liu, H.; Yang, Y.; Hovy, E. RACE: Large-scale ReAding Comprehension Dataset From Examinations. In Proceedings of the 2017 Conference on Empirical Methods in Natural Language Processing, Copenhagen, Denmark, 9–11 September 2017; pp. 785–794. [Google Scholar] [CrossRef]
  17. Peñas, A.; Rodrigo, Á.; Magnini, B.; Forner, P.; Hovy, E.H.; Sutcliffe, R.F.E.; Giampiccolo, D. Results and Lessons of the Question Answering Track at CLEF. In Information Retrieval Evaluation in a Changing World-Lessons Learned from 20 Years of CLEF; The Information Retrieval Series; Springer: Berlin/Heidelberg, Germany, 2019; Volume 41, pp. 441–460. [Google Scholar] [CrossRef]
  18. Rodrigo, Á.; Peñas, A.; Miyao, Y.; Kando, N. Do systems pass university entrance exams? Inf. Process. Manag. 2018, 54, 564–575. [Google Scholar] [CrossRef]
  19. Chandrasekaran, D.; Mago, V. Evolution of Semantic Similarity—A Survey. ACM Comput. Surv. 2021, 54, 1–37. [Google Scholar] [CrossRef]
  20. Jensen, K.; Elbro, C. Clozing in on reading comprehension: A deep cloze test of global inference making. Read. Writ. Interdiscip. J. 2022, 35, 1221–1237. [Google Scholar] [CrossRef]
  21. Pradeesh, N.; Remya, T.; MG, T.; K Arun, K.; Pranav, V. Retrieval-Augmented Generation for Multiple-Choice Questions and Answers Generation. Procedia Comput. Sci. 2025, 259, 504–511. [Google Scholar] [CrossRef]
  22. Saadaoui, S.; Alonso, E. Coordinated LLM multi-agent systems for collaborative question-answer generation. Knowl.-Based Syst. 2025, 330, 114627. [Google Scholar] [CrossRef]
  23. Lewis, P.; Oguz, B.; Rinott, R.; Riedel, S.; Schwenk, H. MLQA: Evaluating Cross-lingual Extractive Question Answering. In Proceedings of the 58th Annual Meeting of the Association for Computational Linguistics, Online, 5–10 July 2020; pp. 7315–7330. [Google Scholar] [CrossRef]
  24. Artetxe, M.; Ruder, S.; Yogatama, D. On the Cross-lingual Transferability of Monolingual Representations. In Proceedings of the 58th Annual Meeting of the Association for Computational Linguistics, Online, 5–10 July 2020; pp. 4623–4637. [Google Scholar] [CrossRef]
  25. Carrino, C.P.; Costa-jussà, M.R.; Fonollosa, J.A.R. Automatic Spanish Translation of SQuAD Dataset for Multi-lingual Question Answering. In Proceedings of the Twelfth Language Resources and Evaluation Conference, Marseille, France, 11–16 May 2020; pp. 5515–5523. [Google Scholar]
  26. Rosá, A.; Chiruzzo, L.; Bouza, L.; Dragonetti, A.; Castro, S.; Etcheverry, M.; Góngora, S.; Goycoechea, S.; Machado, J.; Moncecchi, G.; et al. Overview of QuALES at IberLEF 2022: Question Answering Learning from Examples in Spanish. Proces. Leng. Nat. 2022, 69, 273–280. [Google Scholar]
  27. Gutiérrez-Fandiño, A.; Armengol-Estapé, J.; Pàmies, M.; Llop-Palao, J.; Silveira-Ocampo, J.; Carrino, C.P.; Armentano-Oller, C.; Penagos, C.R.; Gonzalez-Agirre, A.; Villegas, M. MarIA: Spanish Language Models. Proces. Leng. Nat. 2022, 68, 39–60. [Google Scholar]
  28. Taulé, M.; Martí, M.A.; Recasens, M. AnCora: Multilevel Annotated Corpora for Catalan and Spanish. In Proceedings of the Sixth International Conference on Language Resources and Evaluation (LREC’08), Marrakech, Morocco, 26 May–1 June 2008; pp. 96–101. [Google Scholar]
  29. Cervantes, I. Plan Curricular del Instituto Cervantes. Niveles de Referencia Para el Español. 2006. Available online: https://cvc.cervantes.es/ensenanza/biblioteca_ele/plan_curricular/ (accessed on 9 December 2025).
  30. European-Council. Marco Común Europeo de Referencia Para las Lenguas: Enseñanza, Aprendizaje y Evaluación. 2001. Available online: https://cvc.cervantes.es/ensenanza/biblioteca_ele/marco/cvc_mer.pdf (accessed on 9 December 2025).
  31. López-Anguita, R.; Collado-Montañez, J.; Montejo-Ráez, A. The Text Complexity Library. Proces. Leng. Nat. 2020, 65, 127–130. [Google Scholar]
  32. Law, G. Error in the Fernandez Huerta Readability Formula. 2011. Available online: https://linguistlist.org/issues/22/2332/ (accessed on 9 December 2025).
  33. Anula, A. Lecturas adaptadas a la enseñanza del español como L2: Variables lingüísticas para la determinación del nivel de legibilidad. Dialnet 2008, 2, 162–170. [Google Scholar]
  34. Fernández Huerta, J. Medidas sencillas de lecturabilidad. Consigna 1959, 214, 29–32. [Google Scholar]
  35. Flesch, R. A new readability yardstick. J. Appl. Psychol. 1948, 32, 221. [Google Scholar] [CrossRef] [PubMed]
  36. Pazos, F.S. Sistemas Predictivos de Legilibilidad del Mensaje Escrito: Fórmula de Perspicuidad. Ph.D. Thesis, Universidad Complutense de Madrid, Madrid, Spain, 1993. [Google Scholar]
  37. Saggion, H.; Štajner, S.; Bott, S.; Mille, S.; Rello, L.; Drndarevic, B. Making it simplext: Implementation and evaluation of a text simplification system for spanish. ACM Trans. Access. Comput. TACCESS 2015, 6, 1–36. [Google Scholar] [CrossRef]
  38. García Lopez, J.A. Legibilidad de los folletos informativos. Pharm. Care Esp. 2001, 1, 49–56. [Google Scholar]
  39. Akyol, P.; Key, J.; Krishna, K. Hit or Miss? Test Taking Behavior in Multiple Choice Exams; NBER Working Papers 22401; National Bureau of Economic Research, Inc.: Cambridge, MA, USA, 2016. [Google Scholar]
  40. Valadares, J. Correcting scores of tests taking into account the guessing factor: Yes or no. Int. J. Cross-Discip. Subj. Educ. 2011, 2, 381–387. [Google Scholar] [CrossRef]
  41. Liang, Y.; Li, J.; Yin, J. A New Multi-choice Reading Comprehension Dataset for Curriculum Learning. In Proceedings of the Eleventh Asian Conference on Machine Learning, PMLR, Nagoya, Japan, 17–19 November 2019; Volume 101, pp. 742–757. [Google Scholar]
  42. Pal, A.; Umapathi, L.K.; Sankarasubbu, M. MedMCQA: A Large-scale Multi-Subject Multi-Choice Dataset for Medical domain Question Answering. In Proceedings of the Conference on Health, Inference, and Learning, PMLR, Virtually, 7–8 April 2022; Volume 174, pp. 248–260. [Google Scholar]
Figure 1. Bar plots showcasing the results for the question-level evaluation across all tasks. Difficulty is indicated by the level label and color, with green being the easiest and red the hardest.
Information 17 00159 g001
Figure 2. Exam level graph for all difficulty levels. Difficulty is indicated by the level label and color, with green being the easiest and red the hardest.
Information 17 00159 g002
Table 1. Distribution of evaluation points by exercise type.
Exercise TypeNumber of Responses
Multiple-choice3544
Matching2309
Fill-in-the-gap293
Total6146
Table 2. Probability of selecting the correct option and average number of tokens in multiple-choice tasks, segmented by level.
LevelExercisesQuestionsOptionsProbabilitiesTokens
MeanMedianMinMaxInstructionsTextQuestionOptions
A1391646320.2620.2500.2500.33342.59199.6416.2953.936
A1E181083240.3330.3330.3330.33346.056204.3335.7013.405
A249097629280.3330.3330.3330.33323.324132.4066.7915.944
A2B1E8481440.3330.3330.3330.33337.125479.1256.8547.528
B1422100228670.3560.3330.3330.50019.654134.9629.2513.099
B1E811805120.3590.3330.3330.50018.951121.0629.6423.116
B219461217040.3700.3330.2500.50018.954407.07211.4214.473
C114842520.3330.3330.3330.33331.071694.9299.6907.992
C21083249720.3330.3330.3330.33318.000664.93510.1516.907
Table 3. Average text complexity metrics for multiple-choice tasks, segmented by level.
LevelLexical
Complexity
Complexity of
Sentences
Fernández-Huerta
Readability
IFSZ
Readability
Mean Dep.
Tree Depth
Min. Age
to Understand
A12.4029.57179.97775.7825.9968.129
A1E3.74019.84473.05069.2275.66710.381
A24.05614.65559.88855.2646.71611.103
A2B1E4.10518.66161.55957.2067.29211.409
B14.45915.94665.07660.7106.49610.680
B1E4.88518.75965.58061.3836.65110.980
B26.26728.48046.08041.7168.01514.454
C15.31426.63239.48334.7568.22614.907
C25.89328.25746.88042.5187.98014.299
Table 4. Average question complexity metrics for multiple-choice tasks, segmented by level.
LevelLexical
Complexity
Complexity of
Sentences
Fernández-Huerta
Readability
IFSZ
Readability
Mean Dep.
Tree Depth
Min. Age
to Understand
A11.8963.91790.63286.5465.1836.271
A1E1.6953.64287.21282.9434.9866.518
A21.7724.05280.93876.4915.0577.344
A2B1E1.7033.40674.19369.4844.9388.063
B12.5057.04768.86264.0975.8138.989
B1E2.6097.38971.96467.3495.8948.728
B22.8358.26376.90872.6036.1658.477
C12.5057.12563.28658.3435.9409.674
C22.4827.21080.73776.5075.9547.896
Table 5. Average option complexity metrics for multiple-choice tasks, segmented by level.
LevelLexical
Complexity
Complexity of
Sentences
Fernández-Huerta
Readability
IFSZ
Readability
Mean Dep.
Tree Depth
Min. Age
to Understand
A11.2782.91880.94776.3544.4796.997
A1E1.1192.42877.00472.2314.0587.353
A21.8344.79970.95166.0875.3808.343
A2B1E2.2986.07468.91864.0736.0048.789
B11.3232.15646.05040.0664.04910.639
B1E1.3002.08144.57638.5333.99710.793
B21.6613.56450.18944.4504.74410.395
C12.3626.05054.26248.8865.92410.445
C22.1825.78860.94555.7665.8169.584
Table 6. Probability of selecting the correct answer and average number of tokens in matching tasks, segmented by level.
LevelExercisesQuestionsAnswersProbabilitiesTokens
MeanMedianMinMaxInstructionsQuestionsAnswers
A1372223330.1110.1110.1110.11137.7305.98224.444
A1E1166990.1110.1110.1110.11150.4556.78828.818
A21046769870.1050.1000.1000.11144.9718.05843.033
A2B1E848720.1110.1110.1110.11150.25029.64644.569
B1171021530.1110.1110.1110.11153.52922.97153.843
B210100400.2500.2500.2500.25041.70011.210148.975
C1756420.1670.1670.1670.16741.57115.107135.381
C2403923840.1050.1000.1000.16726.60016.33952.139
Table 7. Average question complexity metrics for matching tasks, segmented by level.
LevelLexical
Complexity
Complexity of
Sentences
Readability of
Fernández-Huerta
IFSZ
Readability
Mean Dep.
Tree Depth
Min. Age
to Understand
A11.9234.6282.78878.3855.5927.082
A1E2.1325.39879.30874.7955.5157.511
A22.4166.55775.49670.9416.2858.168
A2B1E3.60211.67967.80463.2486.9469.691
B14.02712.82964.87460.2767.12510.173
B22.8549.4863.48958.6617.639.905
C14.19713.72348.51443.3447.53612.071
C23.38511.05766.36561.7466.8719.827
Table 8. Average answer complexity metrics for matching tasks, segmented by level.
LevelLexical
Complexity
Complexity of
Sentences
Fernández-Huerta
Readability
IFSZ
Readability
Mean Dep.
Tree Depth
Min. Age
to Understand
A12.6427.45676.42772.0125.3858.314
A1E2.4256.78179.02274.6495.4327.898
A23.55511.64562.23957.4946.01510.351
A2B1E3.12110.06466.6861.9815.899.578
B14.5714.93758.13153.4567.0411.328
B25.24621.35356.03151.617.96812.347
C16.07723.10542.02237.1947.5114.165
C24.5918.17561.25556.8557.22311.36
Table 9. Probability of selecting the correct answer and average number of tokens in fill-in-the-gap tasks, segmented by level.
LevelExercisesGapsOptionsProbabilitiesTokens
MeanMedianMinMaxInstructionsTextOptions
B1171021360.1250.1250.1250.12553.000318.94118.919
B21060800.1250.1250.1250.12551.200319.20019.425
C1742490.1430.1430.1430.14351.571420.00040.224
C2424280.1430.1430.1430.14351.000439.75041.500
Table 10. Average text complexity metrics for fill-in-the-gap tasks, segmented by level.
LevelLexical
Complexity
Complexity of
Sentences
Fernández-Huerta
Readability
IFSZ
Readability
Mean Dep.
Tree Depth
Min. Age
to Understand
B14.5319.12656.48151.9717.87512.046
B24.76220.00454.77550.2587.87312.369
C15.55124.09945.88941.2947.81913.945
C26.02826.5842.07437.4438.40314.62
Table 11. Average option complexity metrics for fill-in-the-gap tasks, segmented by level.
LevelLexical
Complexity
Complexity of
Sentences
Fernández-Huerta
Readability
IFSZ
Readability
Mean Dep.
Tree Depth
Min. Age
to Understand
B14.71416.47458.09353.4717.69911.463
B24.84617.33456.87552.2647.93811.73
C16.87726.36747.23842.8187.96614.093
C27.96829.41137.87433.3138.66115.619
Table 12. Performance metrics for the multiple-choice, matching, and fill-in-the-gap tasks, segmented by difficulty level for the question level evaluation.
TaskMetricLevel
A1A1EA2A2B1EB1B1EB2C1C2
Multiple-choiceExam min questions4.004.005.006.003.003.006.006.009.00
Exam max questions8.008.009.006.0010.0010.0012.006.009.00
Exam avg questions4.206.006.026.006.596.6710.926.009.00
Accuracy (%)71.9563.8964.0468.7563.0773.8968.6358.3356.17
MatchingExam min questions6.006.006.006.006.00-10.008.008.00
Exam max questions6.006.007.006.006.00-10.008.0010.00
Exam avg questions6.006.006.506.006.00-10.008.009.80
Accuracy (%)57.2150.0039.6456.2533.33-35.0032.1444.39
Fill-in-the-gapExam min questions----5-556
Exam max questions----6-666
Exam avg questions----5.94-5.96.05.25
Accuracy (%)----32.67-35.5940.4828.57
Table 13. Performance metrics for the exam level task, segmented by difficulty level.
MetricLevel
A1A1EA2A2B1EB1B1EB2C1C2
Exams3814158813119641756
Passed exams218755731735427
Accuracy (%)55.2657.1447.4762.5055.7389.4754.5923.5348.21
Disclaimer/Publisher’s Note: The statements, opinions and data contained in all publications are solely those of the individual author(s) and contributor(s) and not of MDPI and/or the editor(s). MDPI and/or the editor(s) disclaim responsibility for any injury to people or property resulting from any ideas, methods, instructions or products referred to in the content.