Article

ECA-RepNet: A Lightweight Coal–Rock Recognition Network Using Recurrence Plot Transformation

1
College of Mining Engineering, Taiyuan University of Technology, Taiyuan 030024, China
2
Jinneng Holdings Coal Group Wangjialing Coal Company, Xinzhou 036600, China
3
College of Safety and Emergency Management Engineering, Taiyuan University of Technology, Taiyuan 030024, China
4
Center of Shanxi Engineering Research for Coal Mine Intelligent Equipment, Taiyuan University of Technology, Taiyuan 030024, China
5
State Key Laboratory of Intelligent Mining Equipment Technology, Xuzhou 221116, China
6
College of Mechanical and Vehicle Engineering, Taiyuan University of Technology, Taiyuan 030024, China
7
Shanxi TZCO Intelligent Mining Equipment Technology Co., Ltd., Taiyuan 030032, China
*
Author to whom correspondence should be addressed.
Information 2026, 17(2), 140; https://doi.org/10.3390/info17020140
Submission received: 22 November 2025 / Revised: 20 January 2026 / Accepted: 27 January 2026 / Published: 1 February 2026

Abstract

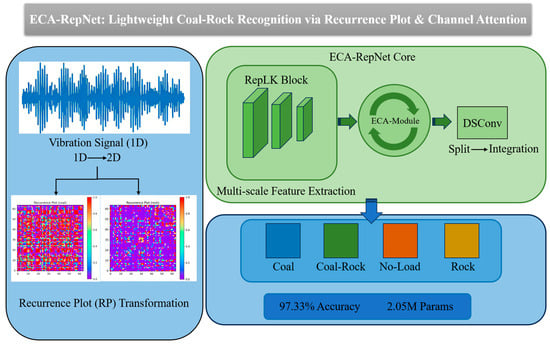
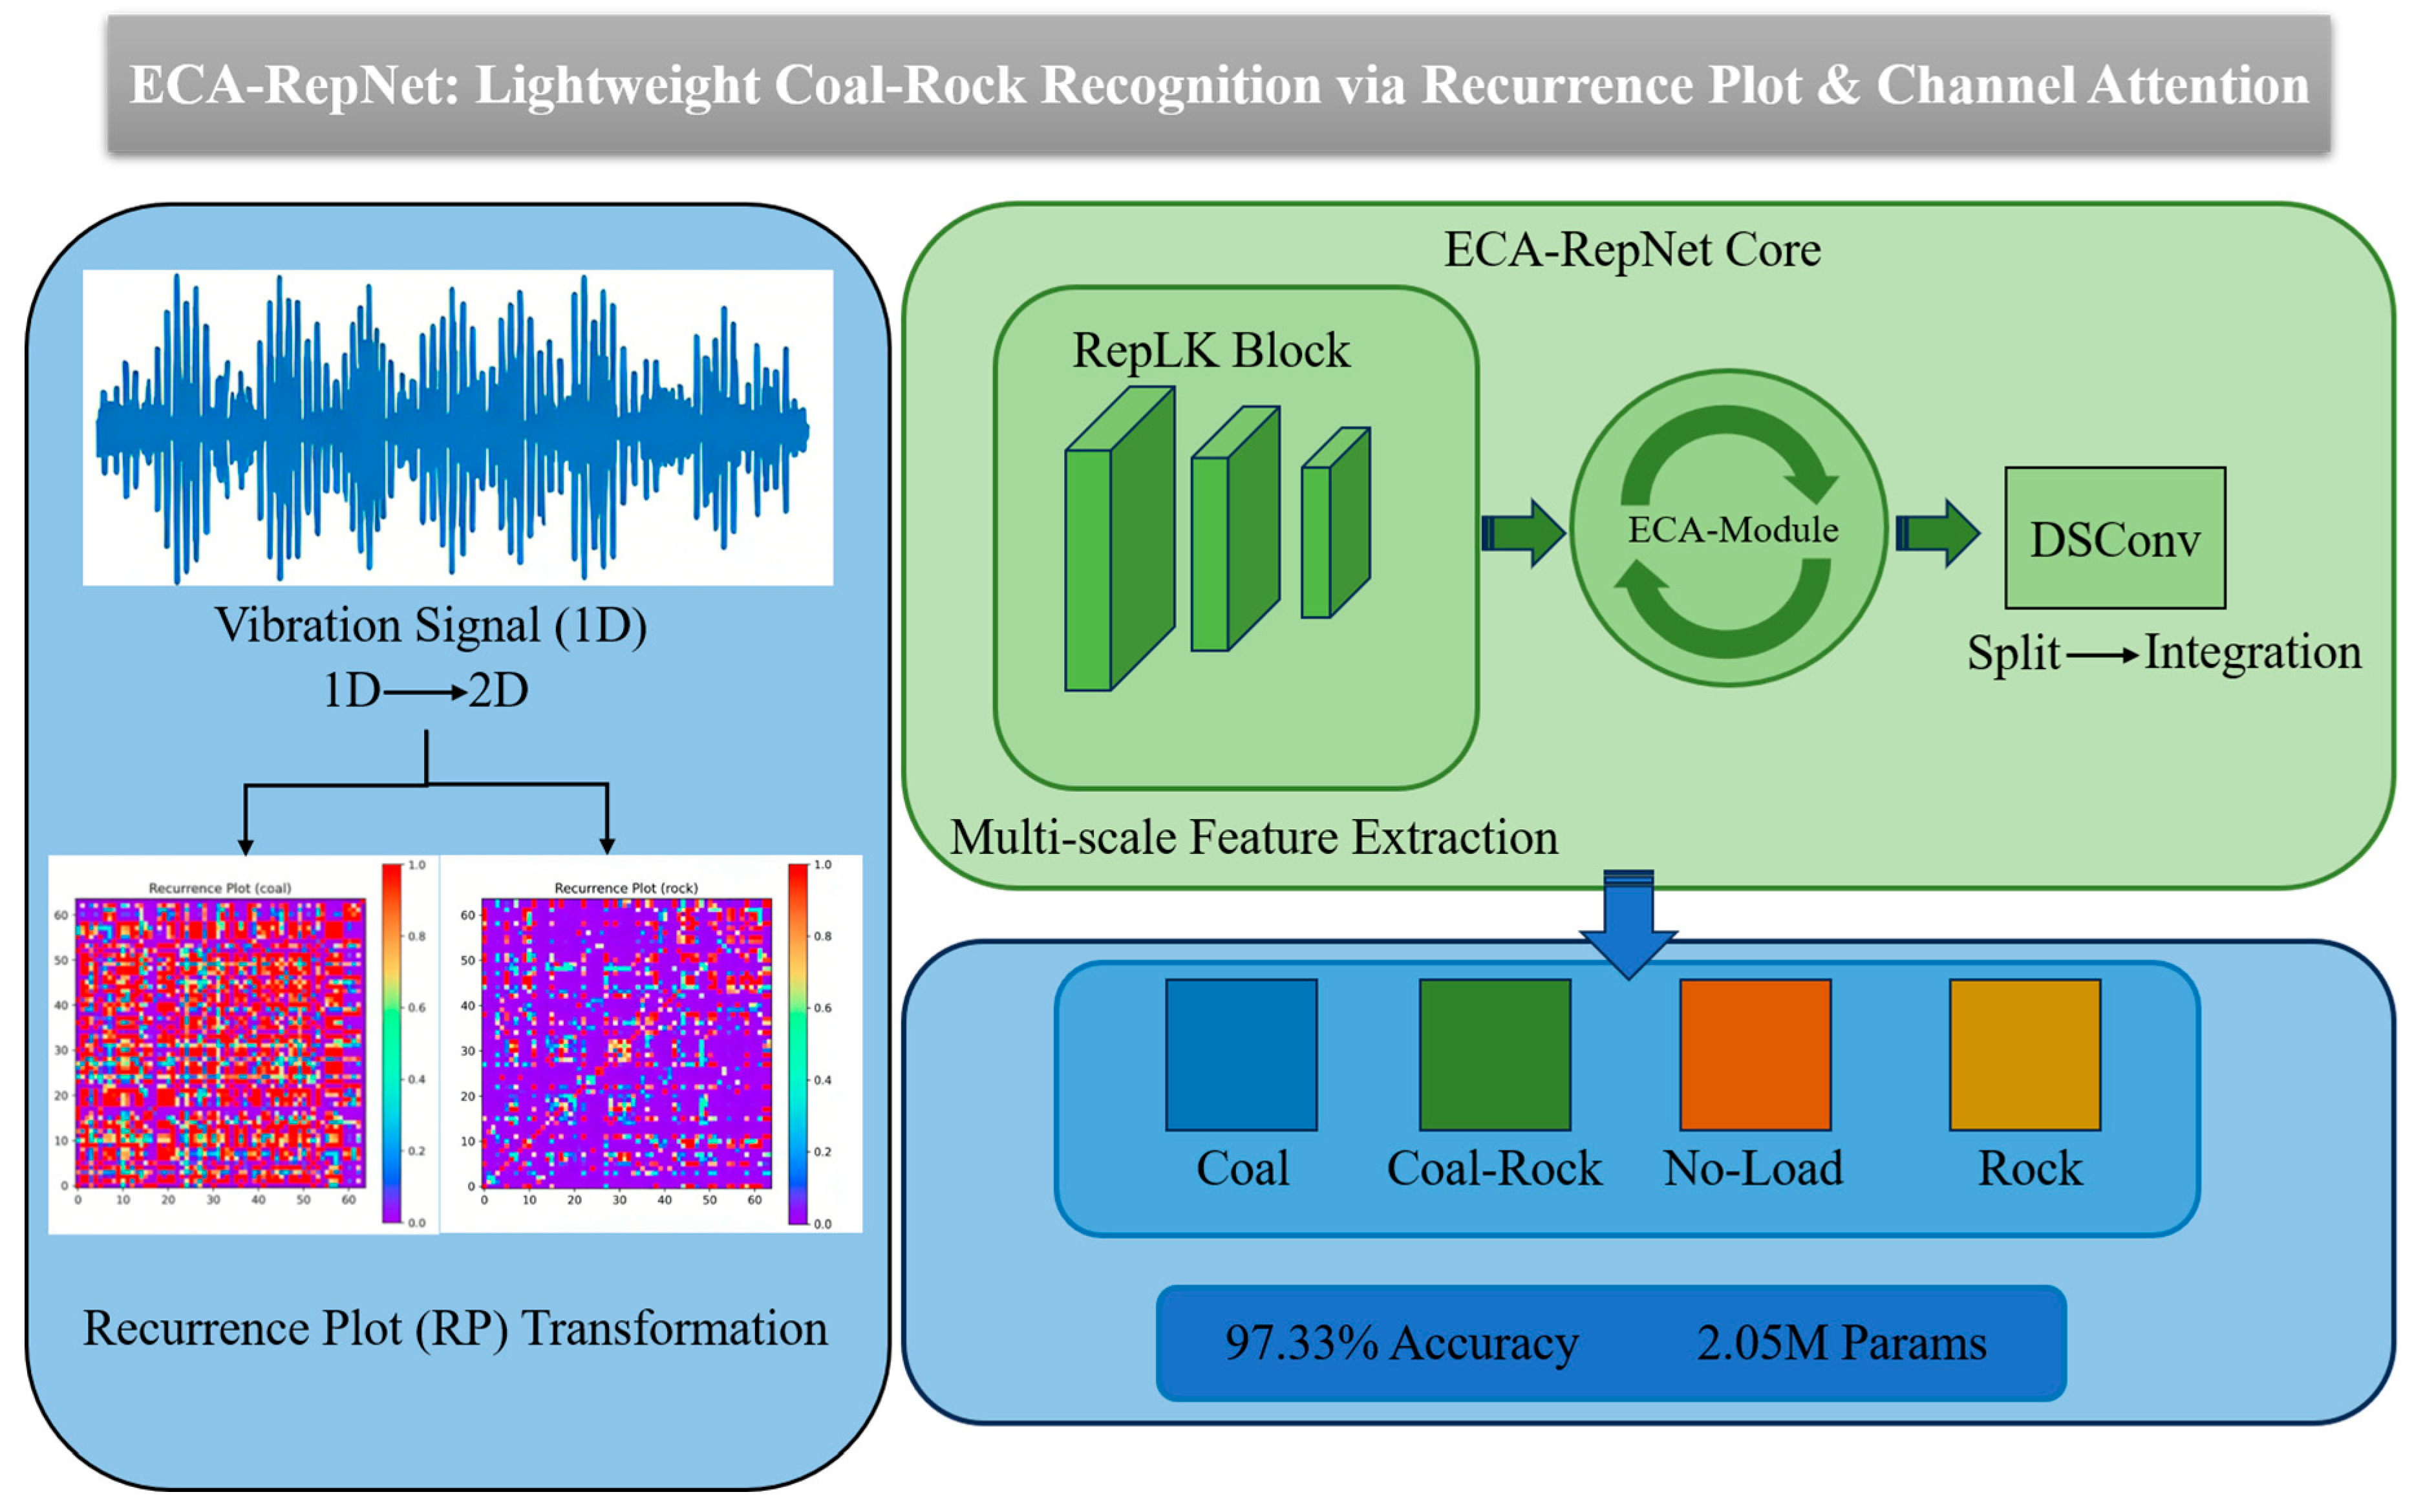
Coal and rock recognition is one of the key technologies in mining production, but traditional methods have limitations such as single-feature representation dimension, insufficient robustness, and unbalanced performance in lightweight design under noise interference and complex feature conditions. To address these issues, an Efficient Channel Attention Reparameterized Network (ECA-RepNet) based on recurrence plot and Efficient Channel Attention mechanism is proposed. The one-dimensional vibration signal is mapped to the two-dimensional image space through a recurrence plot (RP), which retains the dynamic characteristics of the time series while capturing the complex patterns in the signal. Multi-scale feature extraction and lightweight design are achieved through the reparameterized large kernel block (RepLK Block) and the depthwise separable convolution (DSConv) module. The ECA module is introduced to embed multiple convolutional layers. Through global average pooling, one-dimensional convolution, and dynamic weight allocation, the modeling ability of inter-channel dependencies is enhanced, the model robustness is improved, and the computational overhead is reduced. Experimental results demonstrate that the ECA-RepNet model achieves 97.33% accuracy, outperforming classic models including ResNet, CNN, and MobileNet in parameter efficiency, training time, and inference speed.

Graphical Abstract

1. Introduction

Accelerating the intelligent development of the coal industry chain is the core task of ensuring a stable energy supply [1]. In traditional coal mining operations, coal–rock interface judgment mainly relies on workers’ experience, with problems including recognition lag and high misjudgment rates, which often cause equipment failures like abnormal pick wear and sudden roller load changes, seriously threatening underground safety [2]. Coal–rock recognition technology provides a decision-making basis for automatic height adjustment of shearers by real-time sensing of physical property differences between coal seams and rock strata and has become a core breakthrough in intelligent mine construction [3]. Existing recognition technologies are mainly divided into image recognition [4,5,6,7,8], process signal monitoring [9,10,11], electromagnetic wave recognition [12,13,14], infrared imaging technology [15,16,17], and multi-sensor fusion [18,19]. In view of the complexity of coal–rock recognition, domestic and foreign scholars have conducted a lot of research on coal–rock recognition and proposed a variety of improvement methods. Si et al. [20] proposed a coal–rock interface recognition method based on a convolutional neural network, combined with a regularization strategy and data augmentation to improve anti-overfitting capability. Xu et al. [21] and others optimized the model using an open visual reasoning and neural network optimization toolkit, which increased the average frame rate of coal–rock images by 144.97%. Sun et al. [22] and others used a multi-channel residual attention mechanism and a full-scale connection structure to achieve deep extraction of coal–rock semantic features and improved recognition accuracy. Recent deep learning advances in image-based coal–rock recognition have focused on addressing environmental adaptability and lightweight deployment. Liu et al. [23] proposed a Transformer-based full-scale visual enhancement framework, integrating reflectance denoising and multi-scale luminance adjustment to mitigate low-light and overexposure issues in underground images. Xu et al. [21] developed the EBD-YOLO model based on YOLOv11n, incorporating the C3K2-EMA attention module and BiFPN feature fusion to enhance low-light feature extraction and reduce computational complexity. While these studies have achieved remarkable results in controlled experimental environments, image recognition technology faces inherent bottlenecks in practical underground mining scenarios [24]. Severe dust, low illumination, and mechanical occlusion degrade image quality significantly, and class sample imbalance further impairs model generalization. Due to the impact of these adverse environmental conditions, the reliability of image recognition methods under harsh mine conditions needs to be improved, making it urgent to develop alternative technological solutions with stronger environmental adaptability.
To address the aforementioned limitations of image recognition, vibration signals have emerged as a promising research focus in recent years. Unlike images, vibration signals directly reflect the mechanical characteristics of coal–rock cutting [25], and their acquisition is not affected by environmental visibility or lighting conditions—an essential merit for underground mining scenarios with heavy dust and limited light. Si et al. [26] and others optimized the support vector machine model by improving the adaptive fruit fly optimization algorithm (IFOA) to achieve cutting state recognition. Yang et al. [27] and others spliced signal sequences and studied the influence of parameters on the coal gangue recognition accuracy of the SVM algorithm, providing a research basis for the application of signal sequence splicing methods in coal gangue recognition. Zhang et al. [28] integrated one-dimensional original vibration acceleration signals under multiple working conditions and constructed a DCGAN-RFCNN model based on deep learning theory to improve recognition accuracy. For vibration-based recognition, 2024–2025 deep learning studies have advanced in high-order feature mining and multi-sensor integration: Li et al. [29] proposed a hypergraph convolution rebalancing cascade broad learning model, which captures high-order correlations among vibration signal features and mitigates class imbalance. Another work [30] developed the ACI-GNN, a graph neural network framework tailored for multi-sensor vibration signals, which realizes efficient interaction of multi-channel vibration features through lightweight graph convolution. However, although the vibration signal method is stable, as one-dimensional time-series data, its features are scattered, and the implicit information is complex [31]. Traditional feature extraction and modeling methods are difficult to fully utilize the signal’s potential and extract its deeper features.
To address these issues, this paper proposes a time-series classification model based on an Efficient Channel Attention network—ECA-RepNet. Recent studies have shown that recurrence-based representations, when combined with neural networks, can effectively support time-series classification by capturing nonlinear dynamical patterns. Among various time-series imaging methods, the recurrence plot (RP) is selected as the core encoding strategy for the following reasons. Although methods such as Gramian Angular Difference Field (GADF) and Markov Transition Field (MTF) can also preserve temporal dynamics through angular or probabilistic mappings, they require additional transformations and matrix constructions, which introduce higher computational overhead. In contrast, RP directly constructs a similarity matrix from the original vibration signal using a simple distance threshold, enabling a more computationally efficient representation. Moreover, the threshold-based recurrence mechanism of RP provides inherent robustness to random noise commonly present in mechanical vibration signals, as small-amplitude disturbances are less likely to alter the global recurrence structure. These properties make RP particularly suitable for vibration-based coal–rock recognition under complex and noisy industrial environments.
It is noteworthy that this model is not a simple combination of ECA, RepLK modules, and recursive graphs (RP), but rather a collaborative design targeted at the core limitations of vibration coal–rock recognition. By introducing recursive graph technology, one-dimensional vibration signals are transformed into two-dimensional images, solving the problems of feature dispersion and loss of dynamic characteristics in traditional time-series processing, while fully exploiting the deep feature information of vibration signals. Compared with traditional methods, this approach not only preserves the stability of vibration signals but also enhances the richness of feature representation through visualization, significantly improving recognition performance in complex environments with noise and mechanical interference. The main contributions of this paper are as follows:
(1)
The design of the ECA-RepNet model combines re-parameterized large convolution kernels (RepLK module) with Efficient Channel Attention (ECA). The RepLK module achieves a balance between multi-scale feature extraction and lightweight design, while the dynamic channel weights of ECA are used to optimize the fusion efficiency of multi-scale features, thereby improving the feature extraction efficiency and classification accuracy of coal–rock recognition. At the same time, it reduces model complexity to meet the needs of efficient computation in industrial scenarios.
(2)
By converting one-dimensional time-series vibration signals into two-dimensional images, the time-series dynamic characteristics of the signals are fully captured, providing higher-quality feature representation for deep learning models.
(3)
Through multi-category coal–rock recognition experiments, it is proven that ECA-RepNet is superior to traditional models in terms of classification accuracy and generalization ability, providing a feasible solution for recognition tasks in complex industrial scenarios.

2. Methods

2.1. Recurrence Plot

RP is a feature encoding method for time-series signals. It converts one-dimensional vibration signals into two-dimensional image representations, enabling a structured characterization of the signal’s dynamic properties [32]. Based on the similarity measurement of time-series data points, a hierarchical graph structure is constructed to reveal the correlation between data. The RP recurrence plot uses recursive hierarchical processing to capture the complex patterns in the signal while retaining the original time-series dynamic features. Its implementation process can be divided into the following four key stages:
(1)
Time-series data normalization: time series are mapped to the zone   1 , 1 using min–max normalization to ensure that the data values are within the constrained range suitable for subsequent recurrence plot construction.
(2)
Constructing a recurrence plot structure: First, map the time series to nodes in the graph, where each node represents a data point in the time series. The edges of the graph represent the similarity or relationship between nodes, and recursively construct the graph structure, as shown in Equation (1):
G ( l ) = V ( l ) , E ( l ) ,   l = 1 , 2 , , L
where G ( l ) denotes the recurrence graph constructed at the l -th recurrence level, V ( l ) = { x i } i = 1 N represents the set of signal samples used for recurrence calculation, E ( l ) V ( l ) × V ( l ) denotes the set of edges defined by pairwise similarity between states, and l is the recurrence level index used to describe the recurrence construction process.
(3)
Calculating the similarity between nodes: Let nodes represent the two nodes on the layer, respectively. The similarity between nodes can be calculated by a distance metric, as shown in Equation (2):
R i j = 1 , if   x i x j 2 ε 0 , otherwise
where 2 denotes the Euclidean distance between two signal samples, and ε is a predefined distance threshold.
In this study, a direct recurrence plot without phase-space embedding is employed. The one-dimensional vibration signal is directly used to compute the pairwise Euclidean distance matrix, without introducing time-delay embedding. Therefore, the embedding dimension is implicitly set to m = 1 , and the time delay parameter τ is not involved.
A binary recurrence plot is constructed by applying a distance threshold ε . Specifically, two states are considered recurrent if their Euclidean distance is less than or equal to ε . In this study, ε is set to 0.1. Since the input vibration signals are normalized to the range [0, 1] through min–max normalization, a threshold of 0.1 corresponds to 10% of the maximum phase-space diameter. This selection follows the established guidelines proposed by Marwan et al. [33], which suggest that the threshold should not exceed 10% of the maximum phase-space diameter to ensure a balance between capturing dynamic structures and maintaining a meaningful recurrence rate. The resulting recurrence matrix is resized and visualized using a pseudo-color mapping to generate RP images for CNN-based classification.
(4)
Generation of RP recursive images: The final generated 2D matrix or image represents the hierarchical structure and dynamic properties in the time-series data as input data to the model.

2.2. Efficient Channel Attention Mechanism (ECA)

To enhance channel-wise feature representation with minimal computational overhead, an Efficient Channel Attention (ECA) mechanism is incorporated into the proposed network.
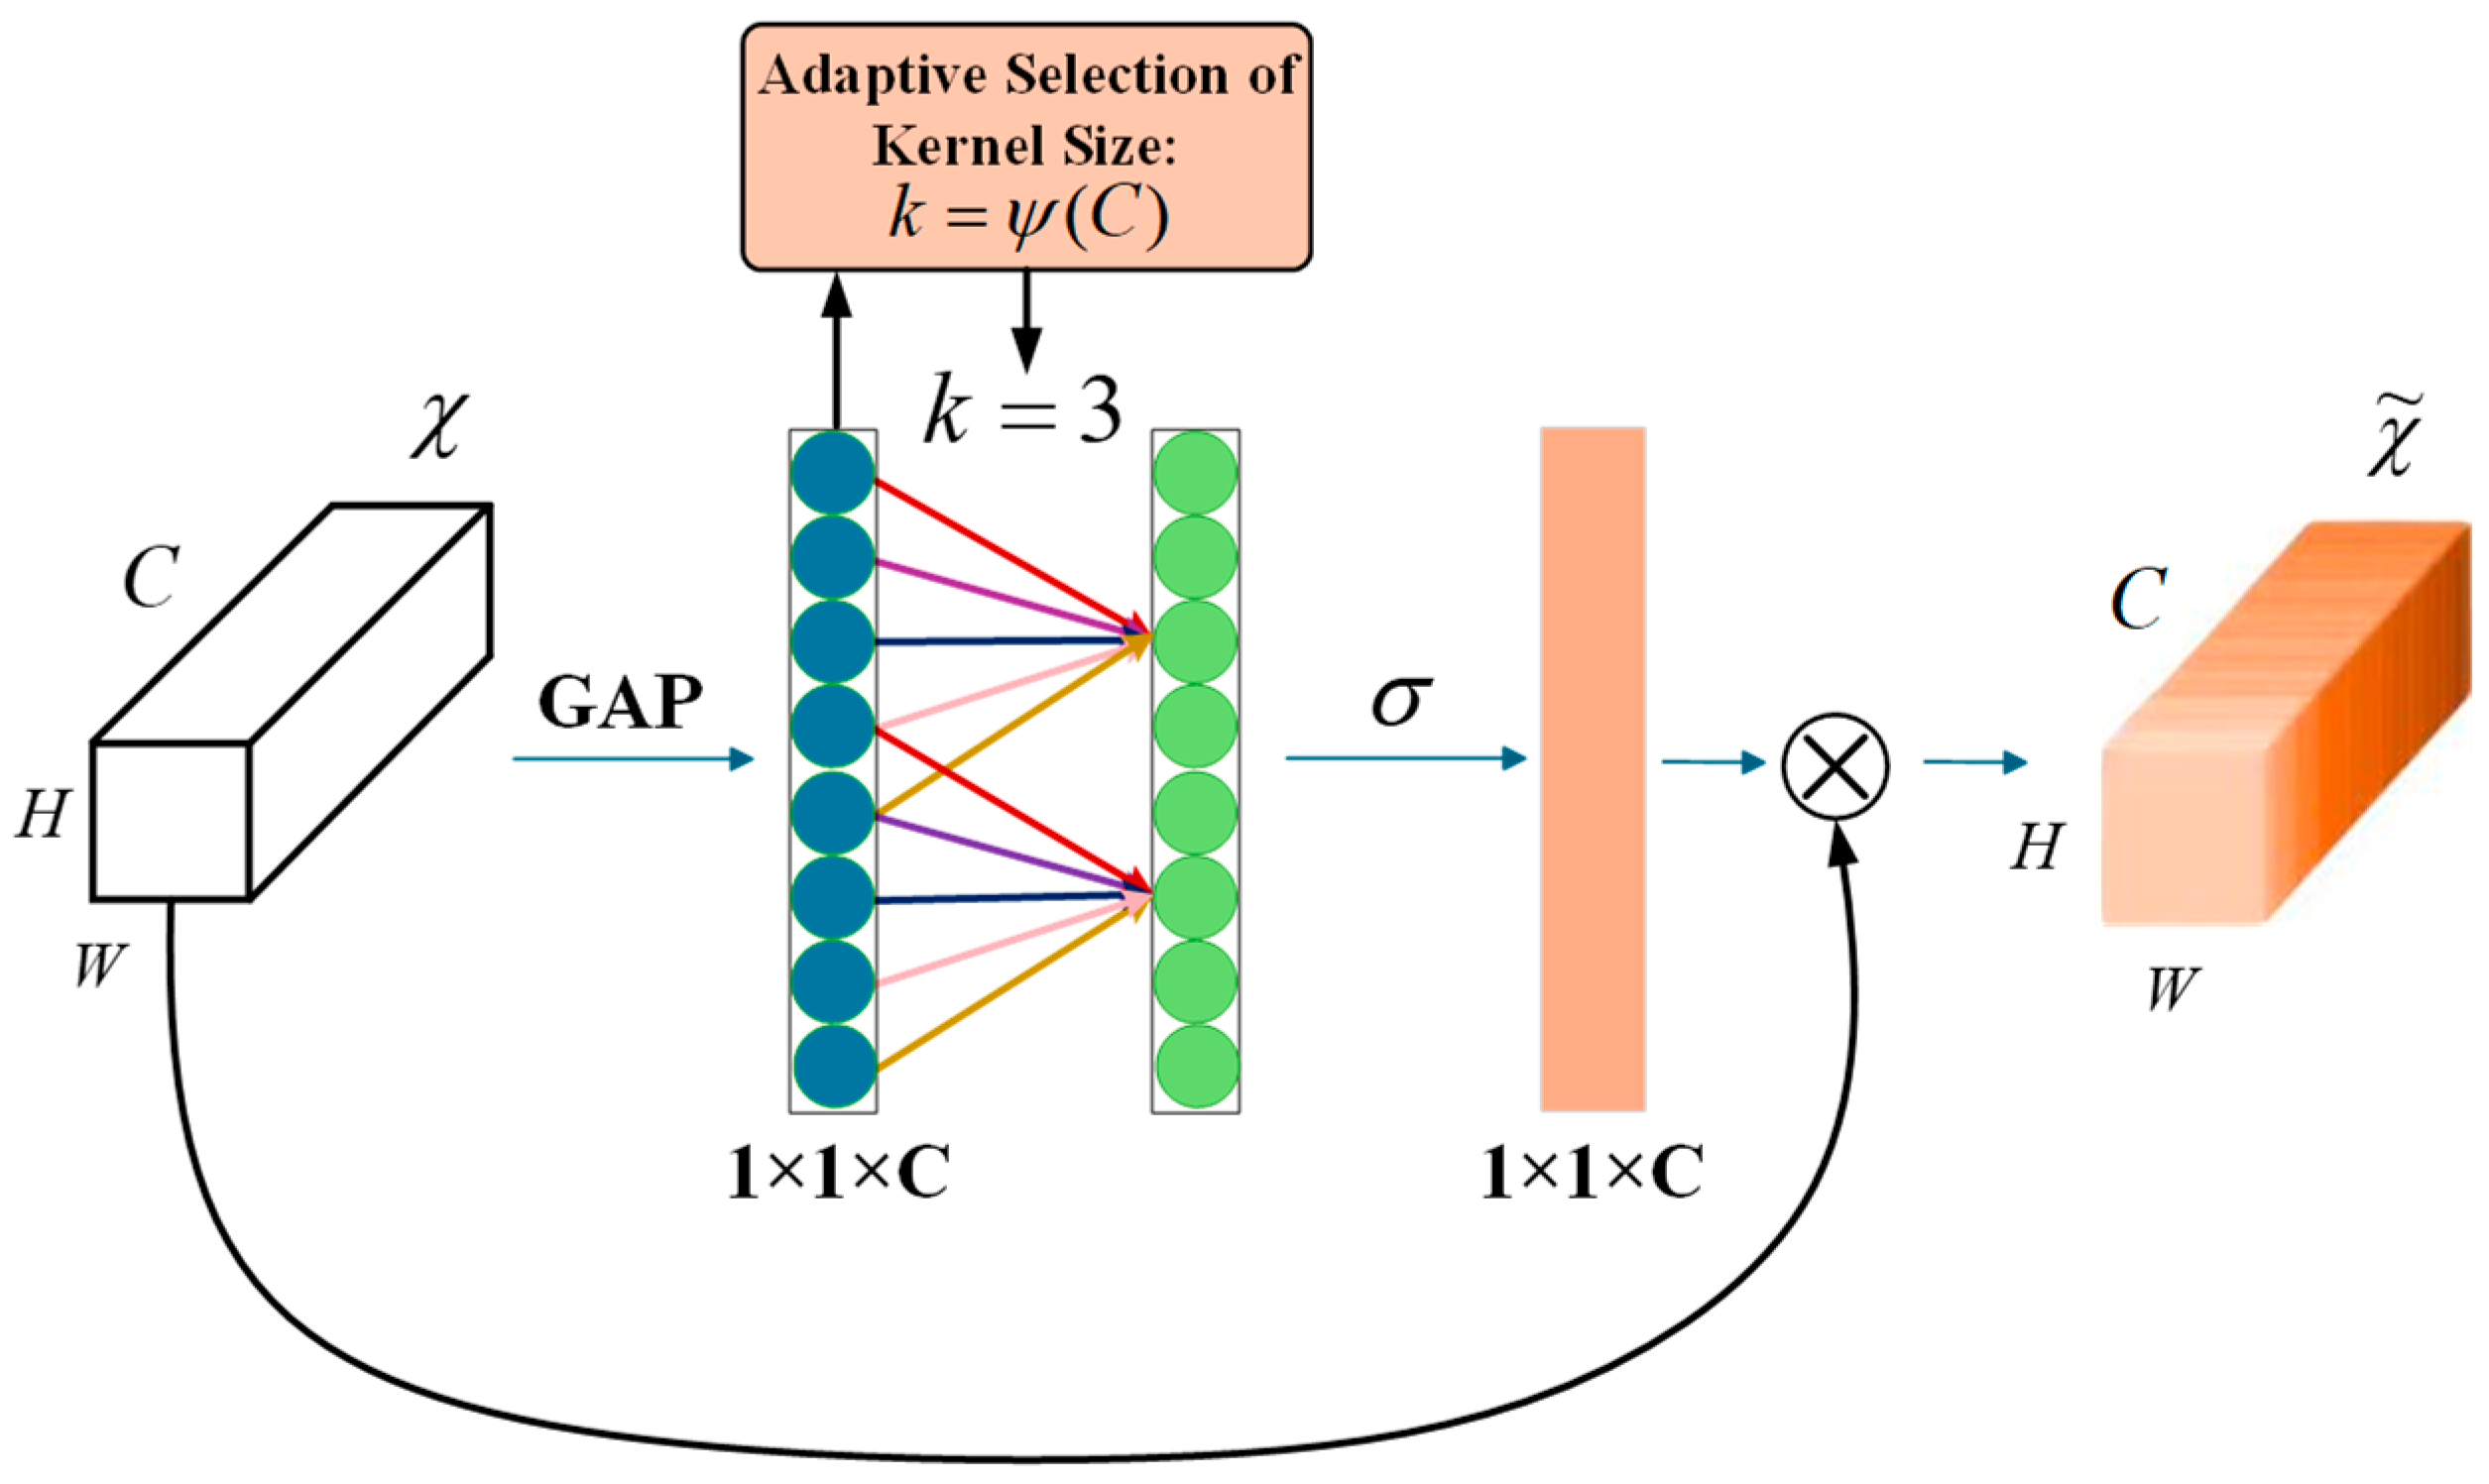
In this study, a grouped ECA structure is employed, where the input feature channels are evenly divided into multiple groups. For each group, global average pooling is first applied to generate a compact channel descriptor, followed by a one-dimensional convolution to capture local cross-channel interactions.
A fixed one-dimensional convolution kernel with a size of 3 is used in the implemented ECA module instead of an adaptive kernel selection strategy. The resulting attention weights are normalized using a sigmoid activation function and applied to the corresponding feature maps through channel-wise multiplication (Figure 1).
The ECA mechanism is mainly realized through the following steps:
(1)
Channel Weight Initialization: First, apply GAP to each channel c of the input feature map X = x 1 , x 2 , , x n   to compress each channel into a scalar value to form a channel vector.
(2)
Local Channel Modeling: Channel vectors are modeled using one-dimensional convolution with a learnable kernel size k , which is adaptively determined according to the channel dimension and optimized during training to capture dependencies between different channels, where the convolution kernel size is k dynamically adjusted to fit the dependency range of a particular feature layer.
(3)
Calculate Channel Weights: The output of the one-dimensional convolution is normalized by the Sigmoid activation function to generate attentional weights for each channel and adjust the weighting for each channel of the input feature map.
(4)
Feature Map Enhancement: According to the generated attention weights, they are redistributed to each channel of the original feature map, so as to dynamically enhance the feature expression ability of important channels.

2.3. ECA-RepNet Network

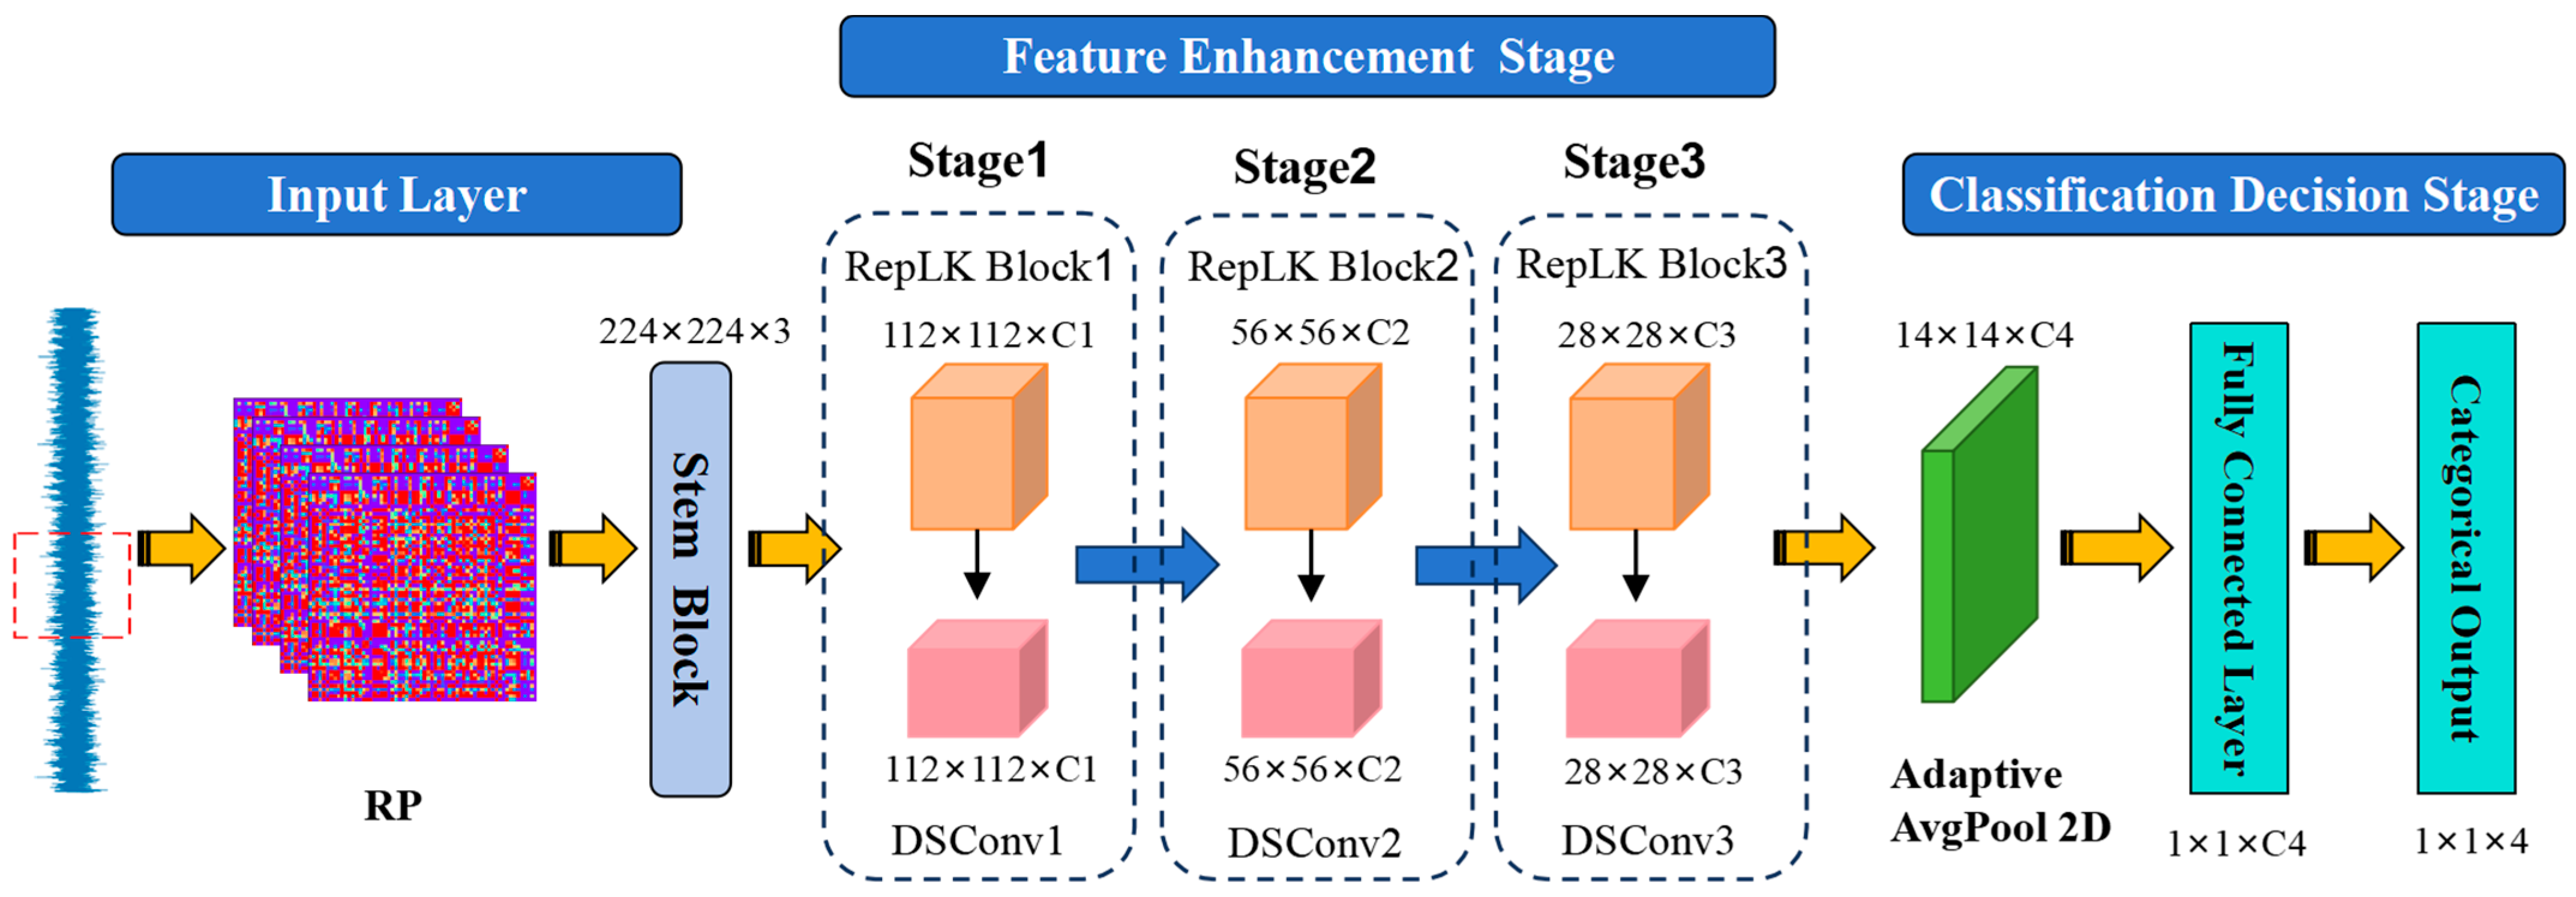
The ECA-RepNet Network adopts an end-to-end hierarchical architecture design, as shown in Figure 2. The input layer receives the RP map generated by the vibration signal, performs preliminary feature encoding through a stem block, uses a large-receptive-field convolution kernel for spatial filtering, and cooperates with batch normalization and the GELU activation function to output a 32-channel feature map with a size of 112 × 112 × 32, which compresses computational redundancy while retaining the details of coal–rock impact texture.
The feature enhancement stage consists of three levels of composite module groups connected in series; each level contains a RepLK Block and a DSConv. RepLK Block is the core feature extraction module. It uses a re-parameterized large convolution kernel to extract multi-scale features in parallel. It extracts global context information and local high-frequency details through a parallel large- and small-kernel structure. The multi-scale features it outputs dynamically calibrate the channel weights through the ECA module to adaptively enhance the key modes in the coal–rock cutting process. DSConv adopts a depthwise separable convolution strategy. By decoupling spatial filtering and channel fusion operations, it gradually expands the channel dimension while maintaining the spatial size of the feature map, achieving a balance between local detail enhancement and global semantic abstraction.
In the classification decision stage, the final feature map is first compressed into a global description vector through adaptive average pooling, which removes spatial redundancy. The resulting feature vector is then mapped to a four-dimensional category space via a fully connected layer. The Softmax function outputs the probability distribution of four working conditions: Coal, Coal–Rock, No-Load, and Rock.
The entire architecture achieves efficient modeling and classification of input images through recurrence plot-driven feature adaptation, multi-scale-attention collaborative feature enhancement, and lightweight operator design, while maintaining the characteristics of lightweight and high performance.

2.3.1. RepLK Block Module

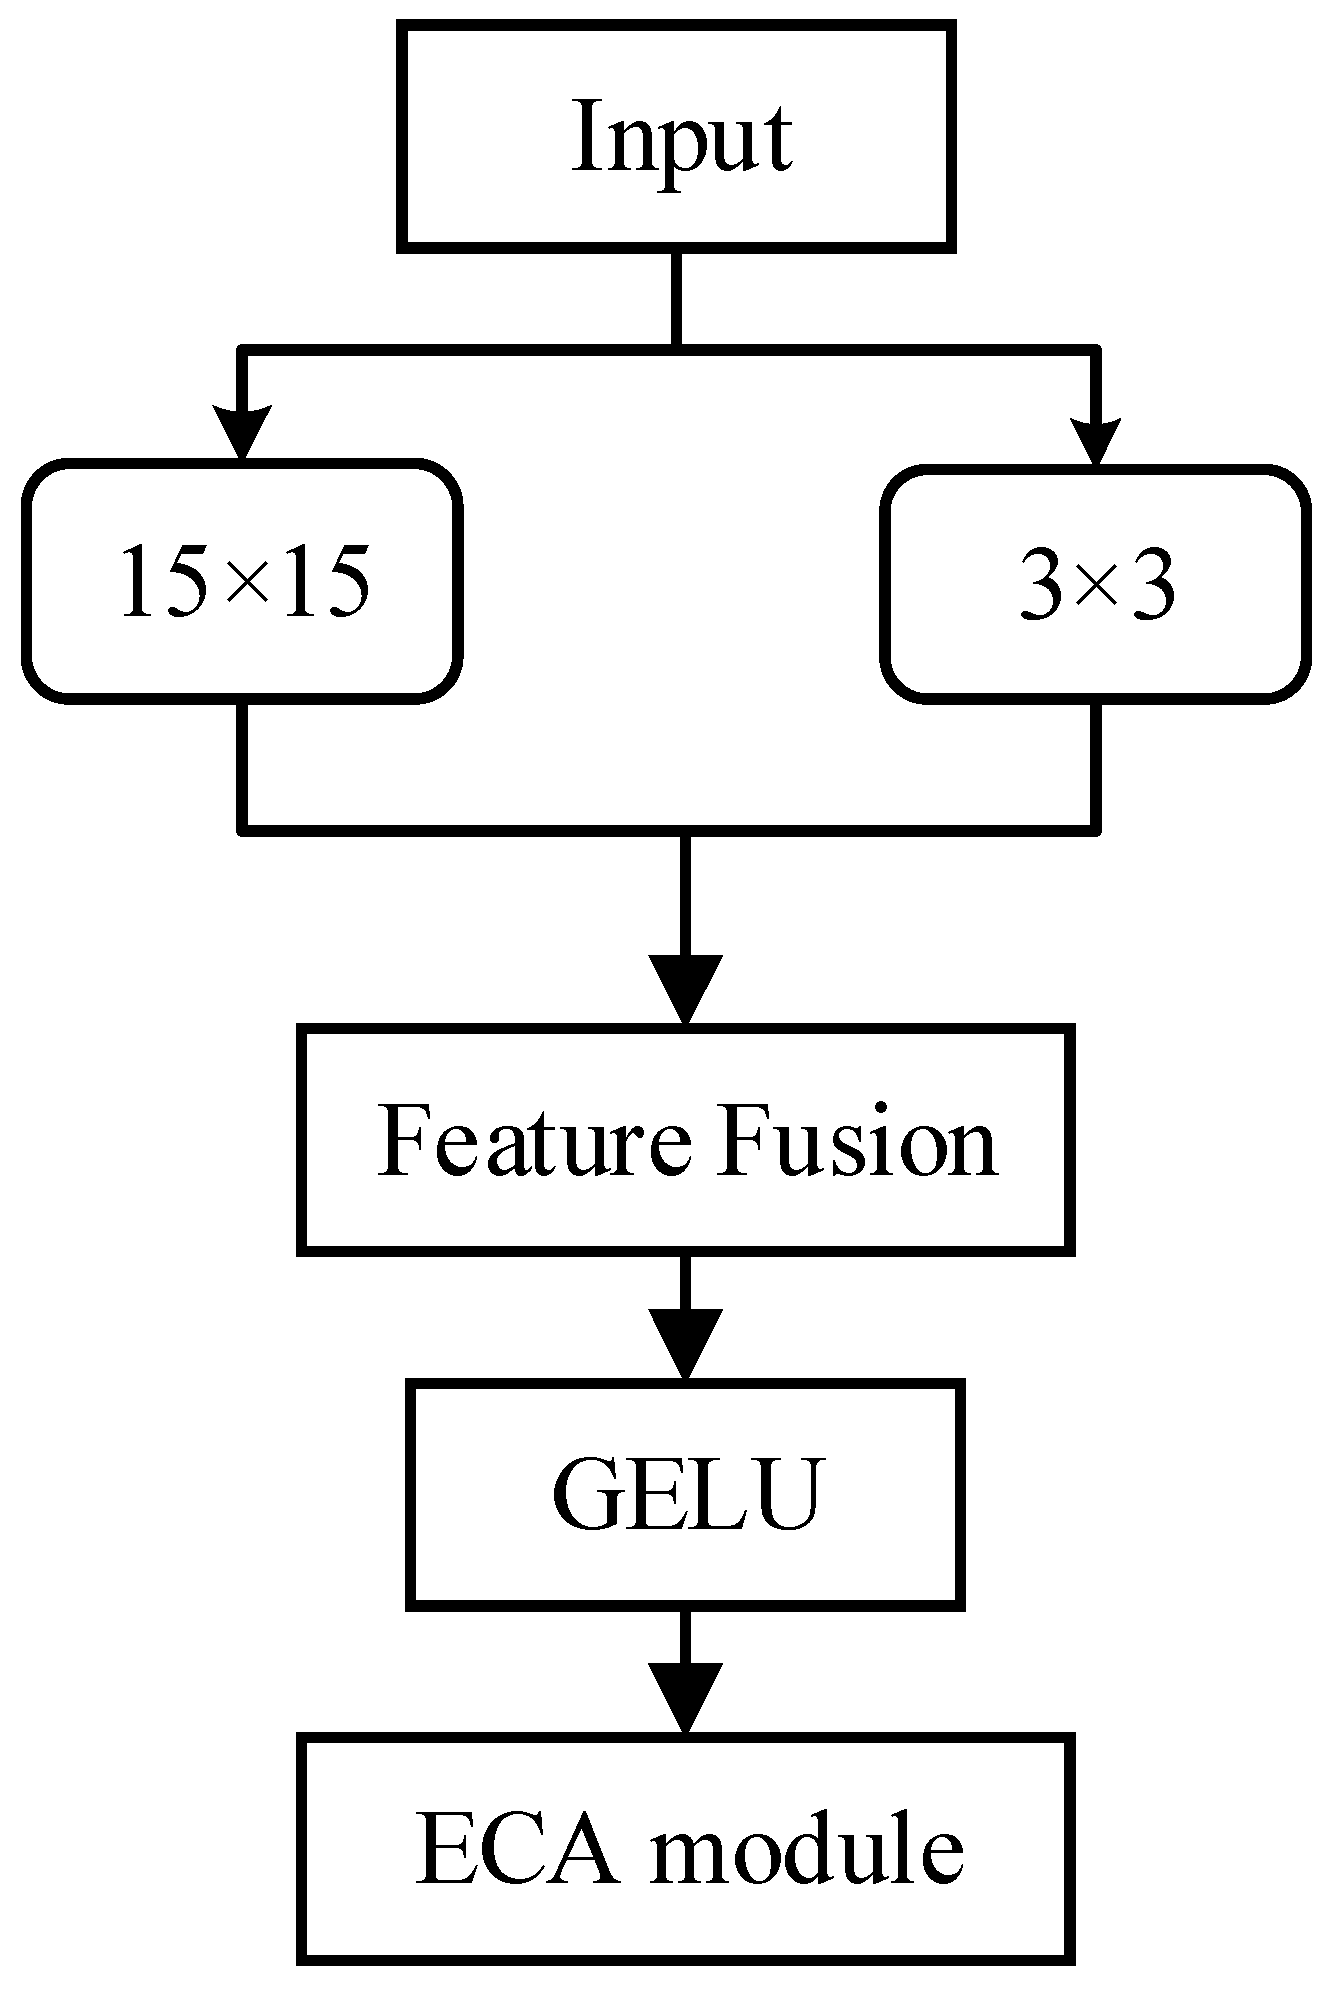
RepLK Block is the core feature extraction module of ECA-RepNet. It is designed based on the dual mechanisms of re-parameterized multi-scale fusion and channel attention enhancement. It utilizes the efficient feature extraction capability of large convolution kernels and combines the local detail capture capability of small convolution kernels to form a multi-scale feature fusion mechanism, which aims to solve the problem of efficient modeling of long-range dependencies and local transient features in coal–rock vibration signals. RepLK Block uses multi-scale large-size convolutional kernels (15 × 15, 11 × 11, and 7 × 7) to capture global contextual information and efficiently model long-range dependencies in the image, and at the same time, extracts localized detail features, focusing on capturing high-frequency details in the image.
The specific kernel sizes (15 × 15, 11 × 11, and 7 × 7) were selected based on the characteristic texture scale of recurrence plot (RP) images and the progressive reduction in feature map resolution (112 × 112 → 56 × 56 → 28 × 28). In the shallow stage, RP images exhibit prominent global diagonal structures and large-scale block patterns, which encode long-range temporal regularities of vibration signals. A larger kernel (15 × 15) is therefore required to provide a sufficiently wide effective receptive field to capture these continuous geometric textures, whereas smaller kernels would fragment such global patterns into isolated local responses. As the network depth increases and the spatial resolution decreases, the kernel size is progressively reduced to 11 × 11 and 7 × 7 to maintain a reasonable ratio between the receptive field and feature map size. This pyramidal kernel scaling strategy prevents over-smoothing of high-level semantic features on small spatial maps while avoiding unnecessary computational overhead.
The complete structure of the RepLK Block is shown in Figure 3. The RepLK Block adopts the same internal structure across all stages of the network, with only the channel dimensions varying between stages.
The output feature maps from the large-kernel and small-kernel convolution branches are fused via element-wise summation to achieve multi-scale feature integration. This parameter-free fusion strategy preserves the lightweight design of the network and avoids introducing additional computational overhead. Compared with concatenation followed by a 1 × 1 convolution or learnable weighted fusion, element-wise summation enforces direct feature alignment across different receptive-field branches and encourages complementary multi-scale representations without increasing the parameter count. The subsequent batch normalization layer implicitly balances the contributions of different branches, providing adaptive feature scaling without explicit learnable fusion weights, while the GELU activation enhances feature nonlinearity and training stability. In addition, the RepLK Block incorporates an Efficient Channel Attention (ECA) module, which dynamically recalibrates channel-wise feature responses through global average pooling and one-dimensional convolution, further enhancing discriminative feature representation.

2.3.2. Depthwise Separable Conv Module (DSConv)

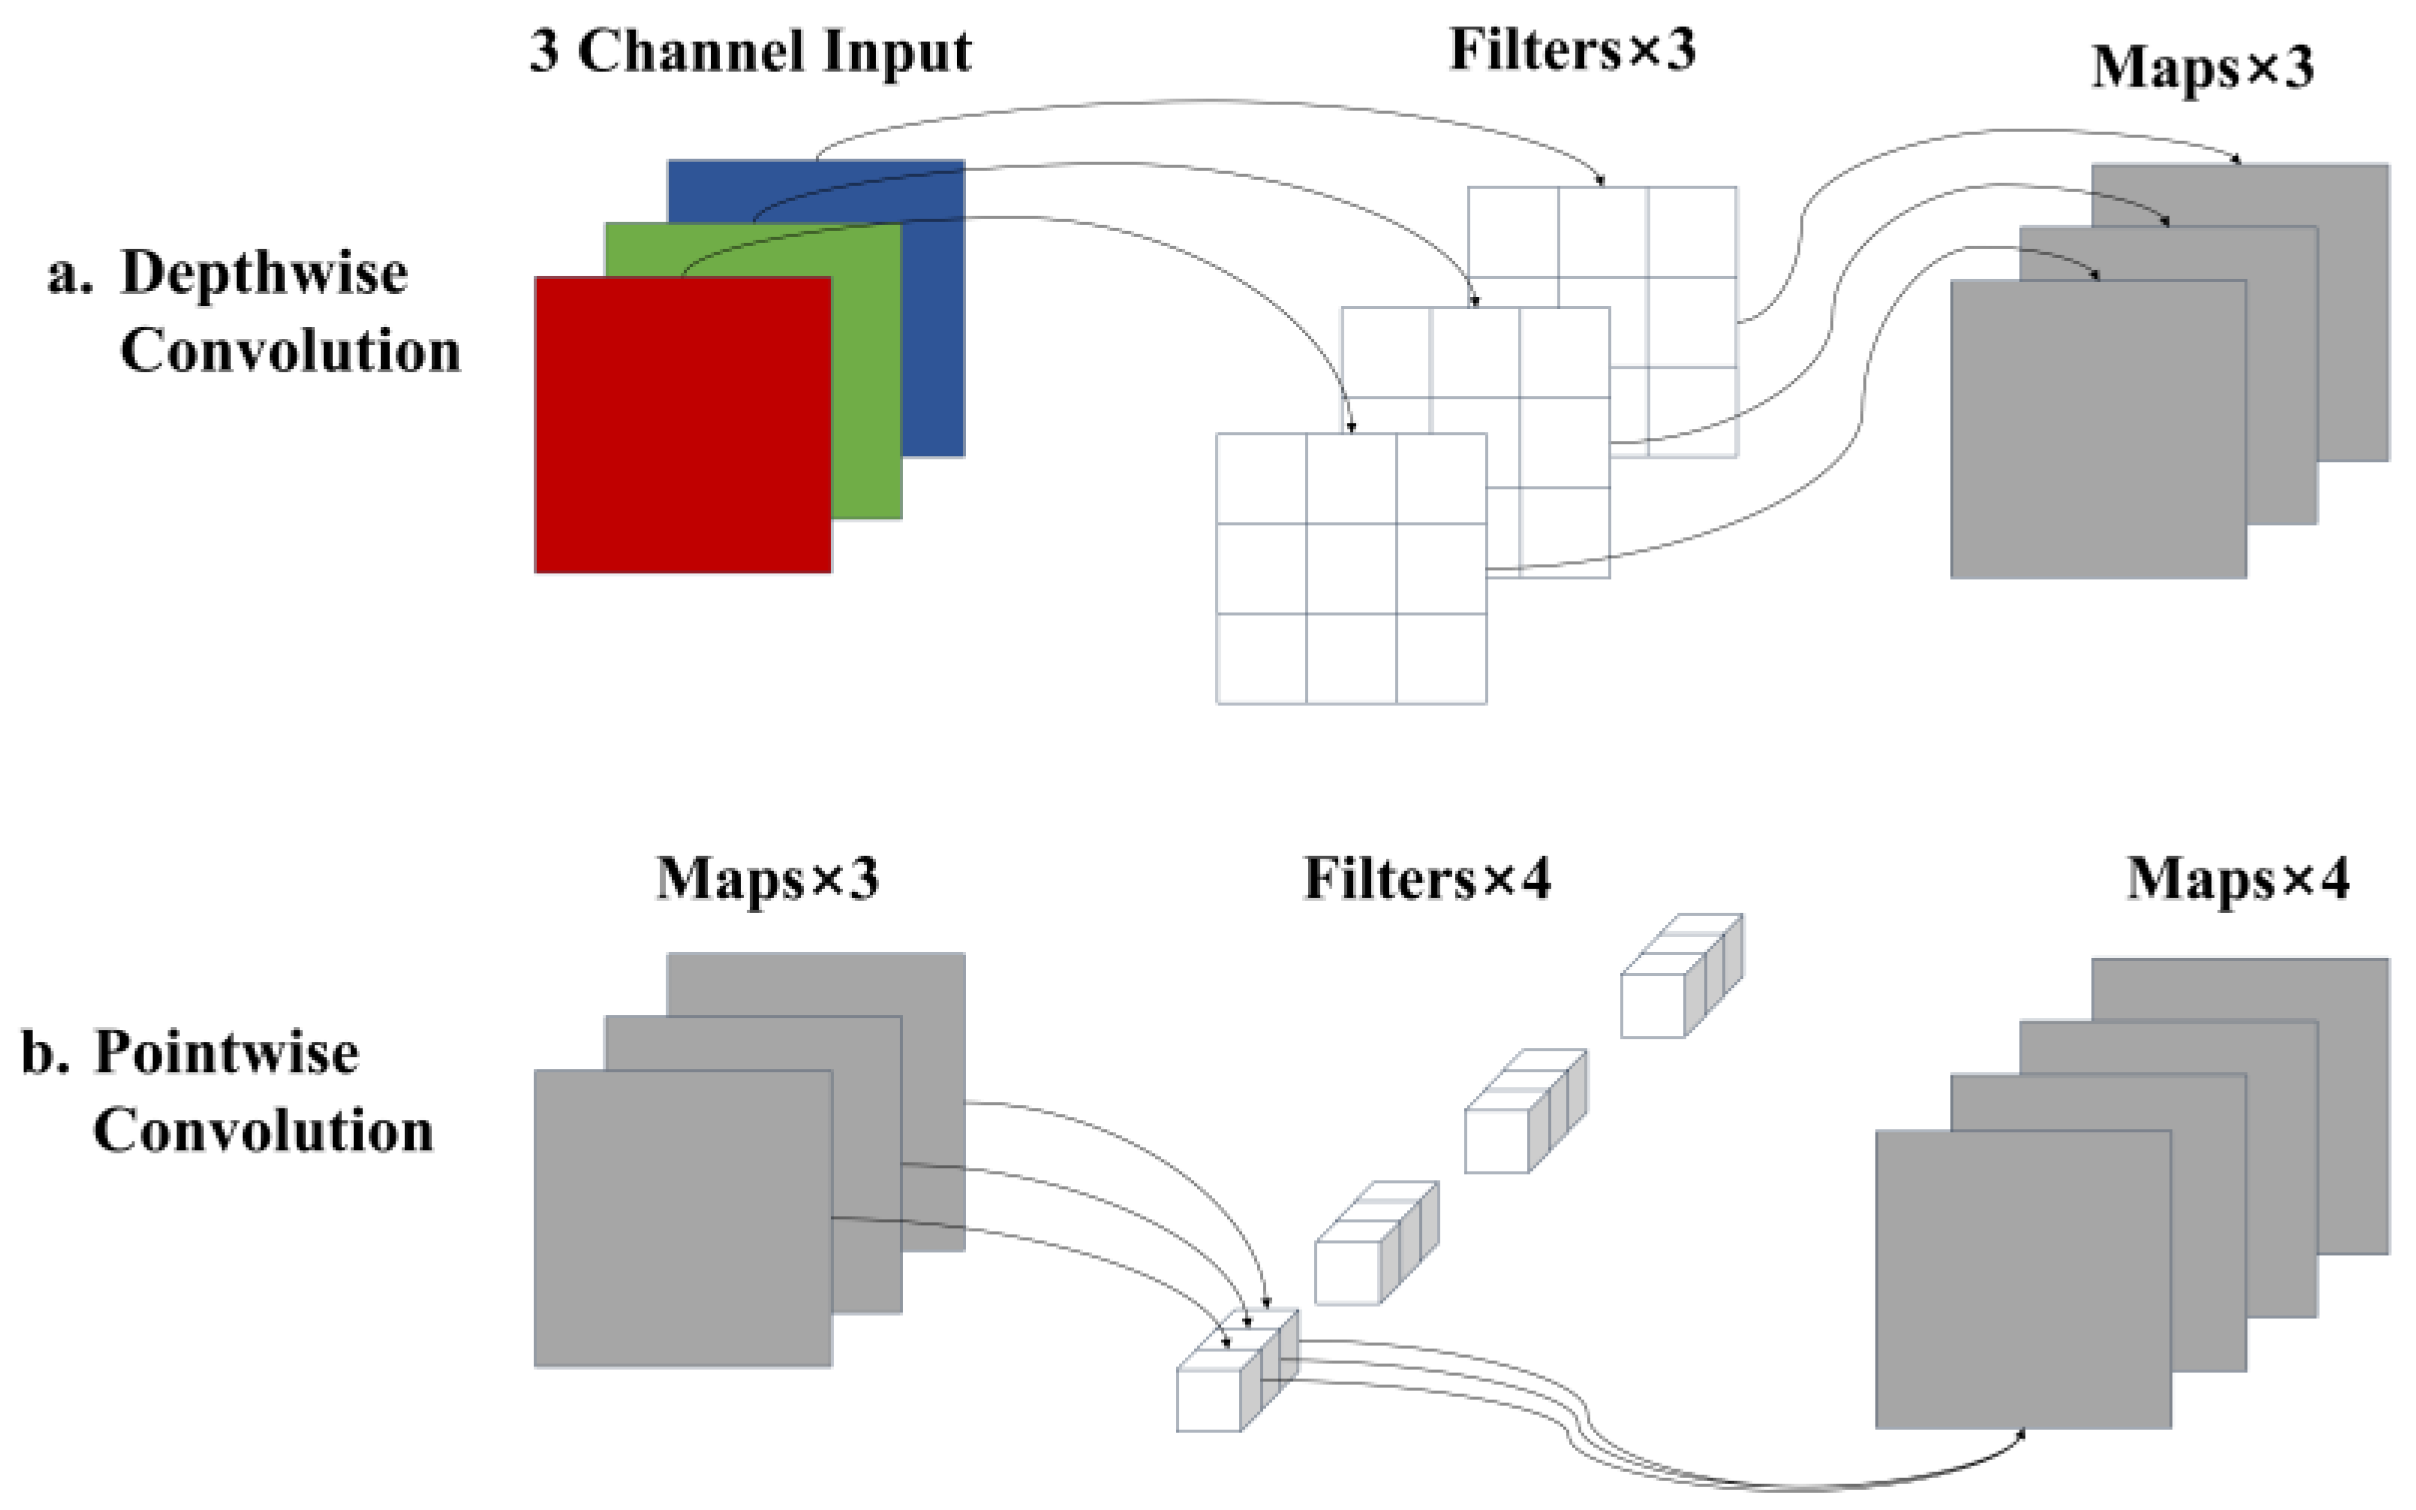
The DSConv module achieves efficient feature extraction through a cascade design of depthwise convolution and pointwise convolution. As shown in Figure 4, the module first performs deep convolution on the input 3-channel feature map, uses 3 independent 3 × 3 filters to process each input channel separately, as shown in Figure 4a, and performs convolution operations on the spatial dimension without changing the number of channels. The channel mixing calculation of the standard convolution is decoupled into pure spatial filtering, which significantly reduces the computational complexity.
The 3-channel feature map output by the deep convolution then enters the pointwise convolution stage, and the cross-channel information is fused through 4 1 × 1 convolution kernels to adjust the channel dimension from 3 to 4, as shown in Figure 4b. Since the 1 × 1 convolution only acts on the channel dimension and does not change the spatial size of the feature map, the model size is further compressed. The collaborative work of the two stages not only retains the spatial feature extraction capability of the standard convolution but also achieves a step-by-step improvement in computational efficiency by decoupling the spatial and channel processing dimensions.
Finally, the module batch normalizes the 4-channel feature maps output by point-by-point convolution, accelerates training convergence by normalizing the distribution of activation values, and enhances the model’s robustness to input scale changes. This three-stage design of “spatial filtering–channel fusion–feature stabilization” enables DSConv to maintain feature expression capabilities comparable to standard convolution while reducing the number of parameters, providing core support for lightweight network architectures.

3. Experiments

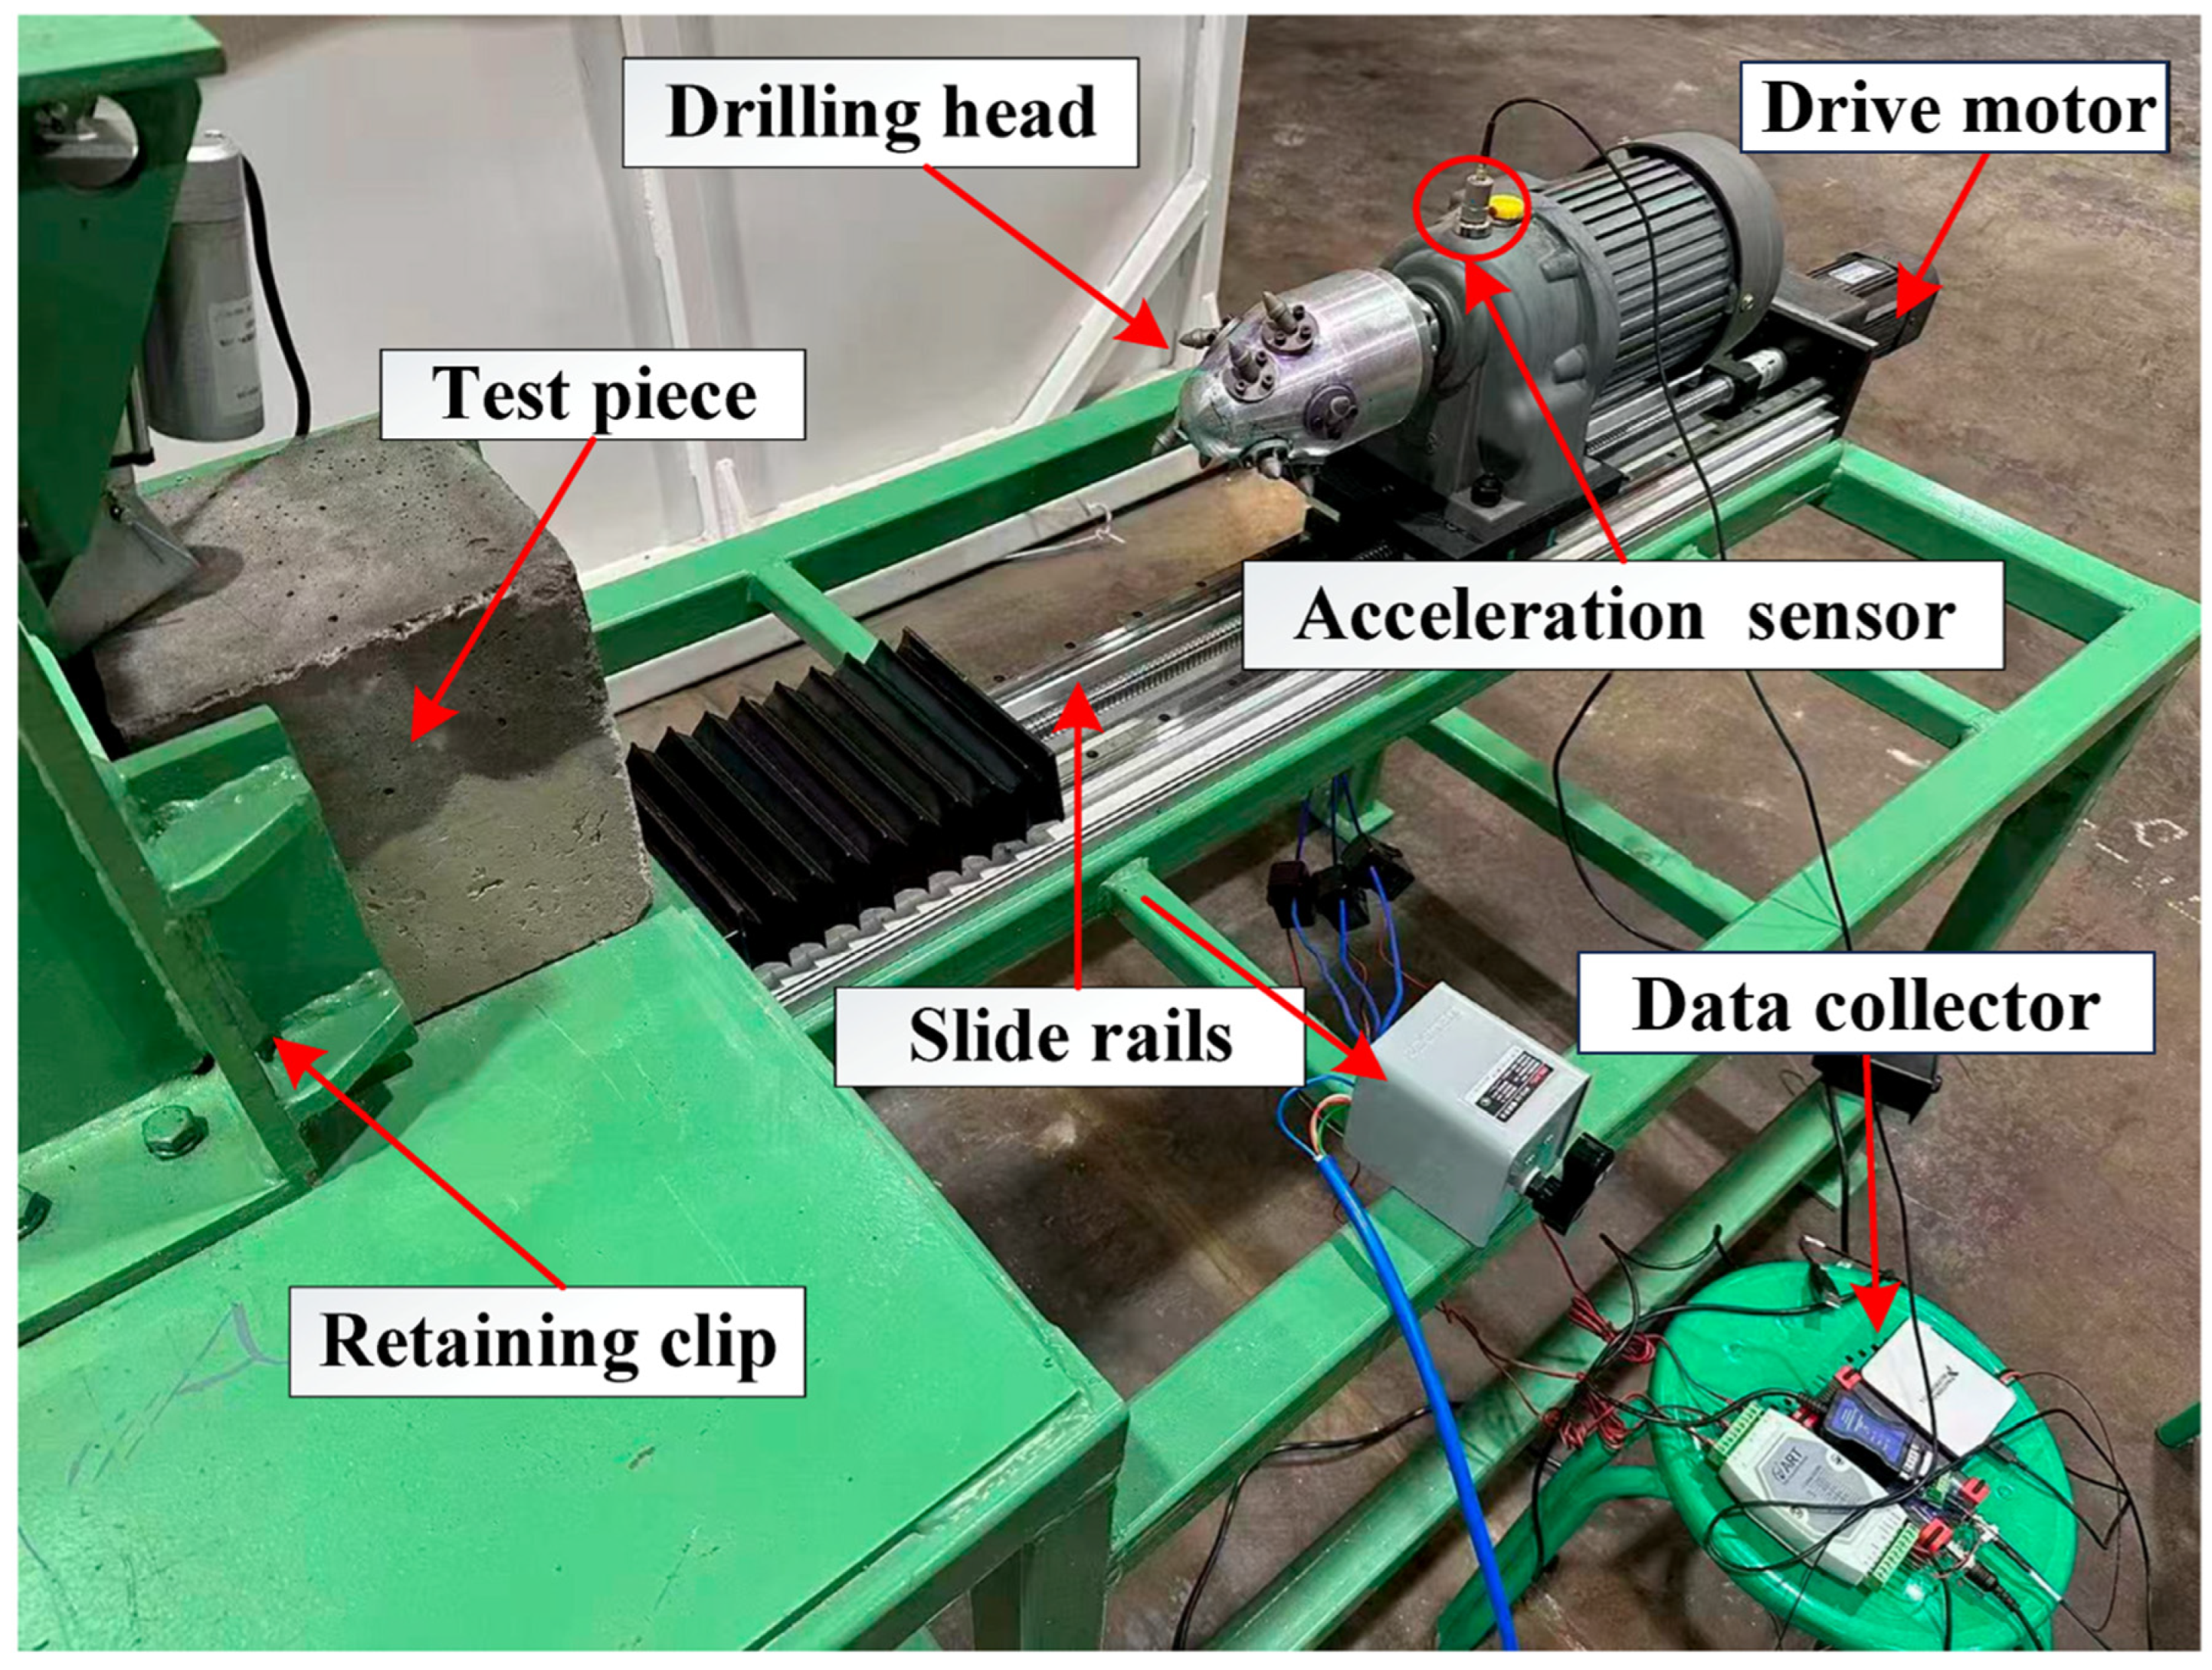
The experimental cutting platform system consists of a cutting execution unit and a traveling drive unit, and its operation mechanism is based on the principle of drum rotary feed cutting, which is designed to simulate the working process of underground coal mining equipment. As shown in Figure 5, the structure is schematic. The selected cutting power source is a three-phase asynchronous motor with a rated voltage of 380 V, a rated power of 0.55 kW, and a rated speed of 1500 r/min. The transmission system configuration has a reduction ratio of 38:1. Cutting drum design parameters include a working diameter of 120 mm, an effective cutting depth of 50 mm, and an actual operating speed of 60.53 r/min.
In this study, vibration signals were collected using a piezoelectric accelerometer (Jiangsu Lianneng Electronic Technology Co., Ltd., Yangzhou, China), which was mounted on the stainless steel bracket of the scraper conveyor’s cutting drum—approximately 10 cm from the drum axis. This installation design directly captures the vibration responses generated by coal–rock cutting while minimizing interference from irrelevant mechanical vibrations. The key technical parameters of the data acquisition system are specified as follows: sampling frequency = 800 Hz; resolution = 16-bit; measurement range = ±500 g. Prior to formal data collection, the sensor was calibrated with a standard signal source, and the calibration coefficients were recorded for subsequent data processing to eliminate system-induced errors.
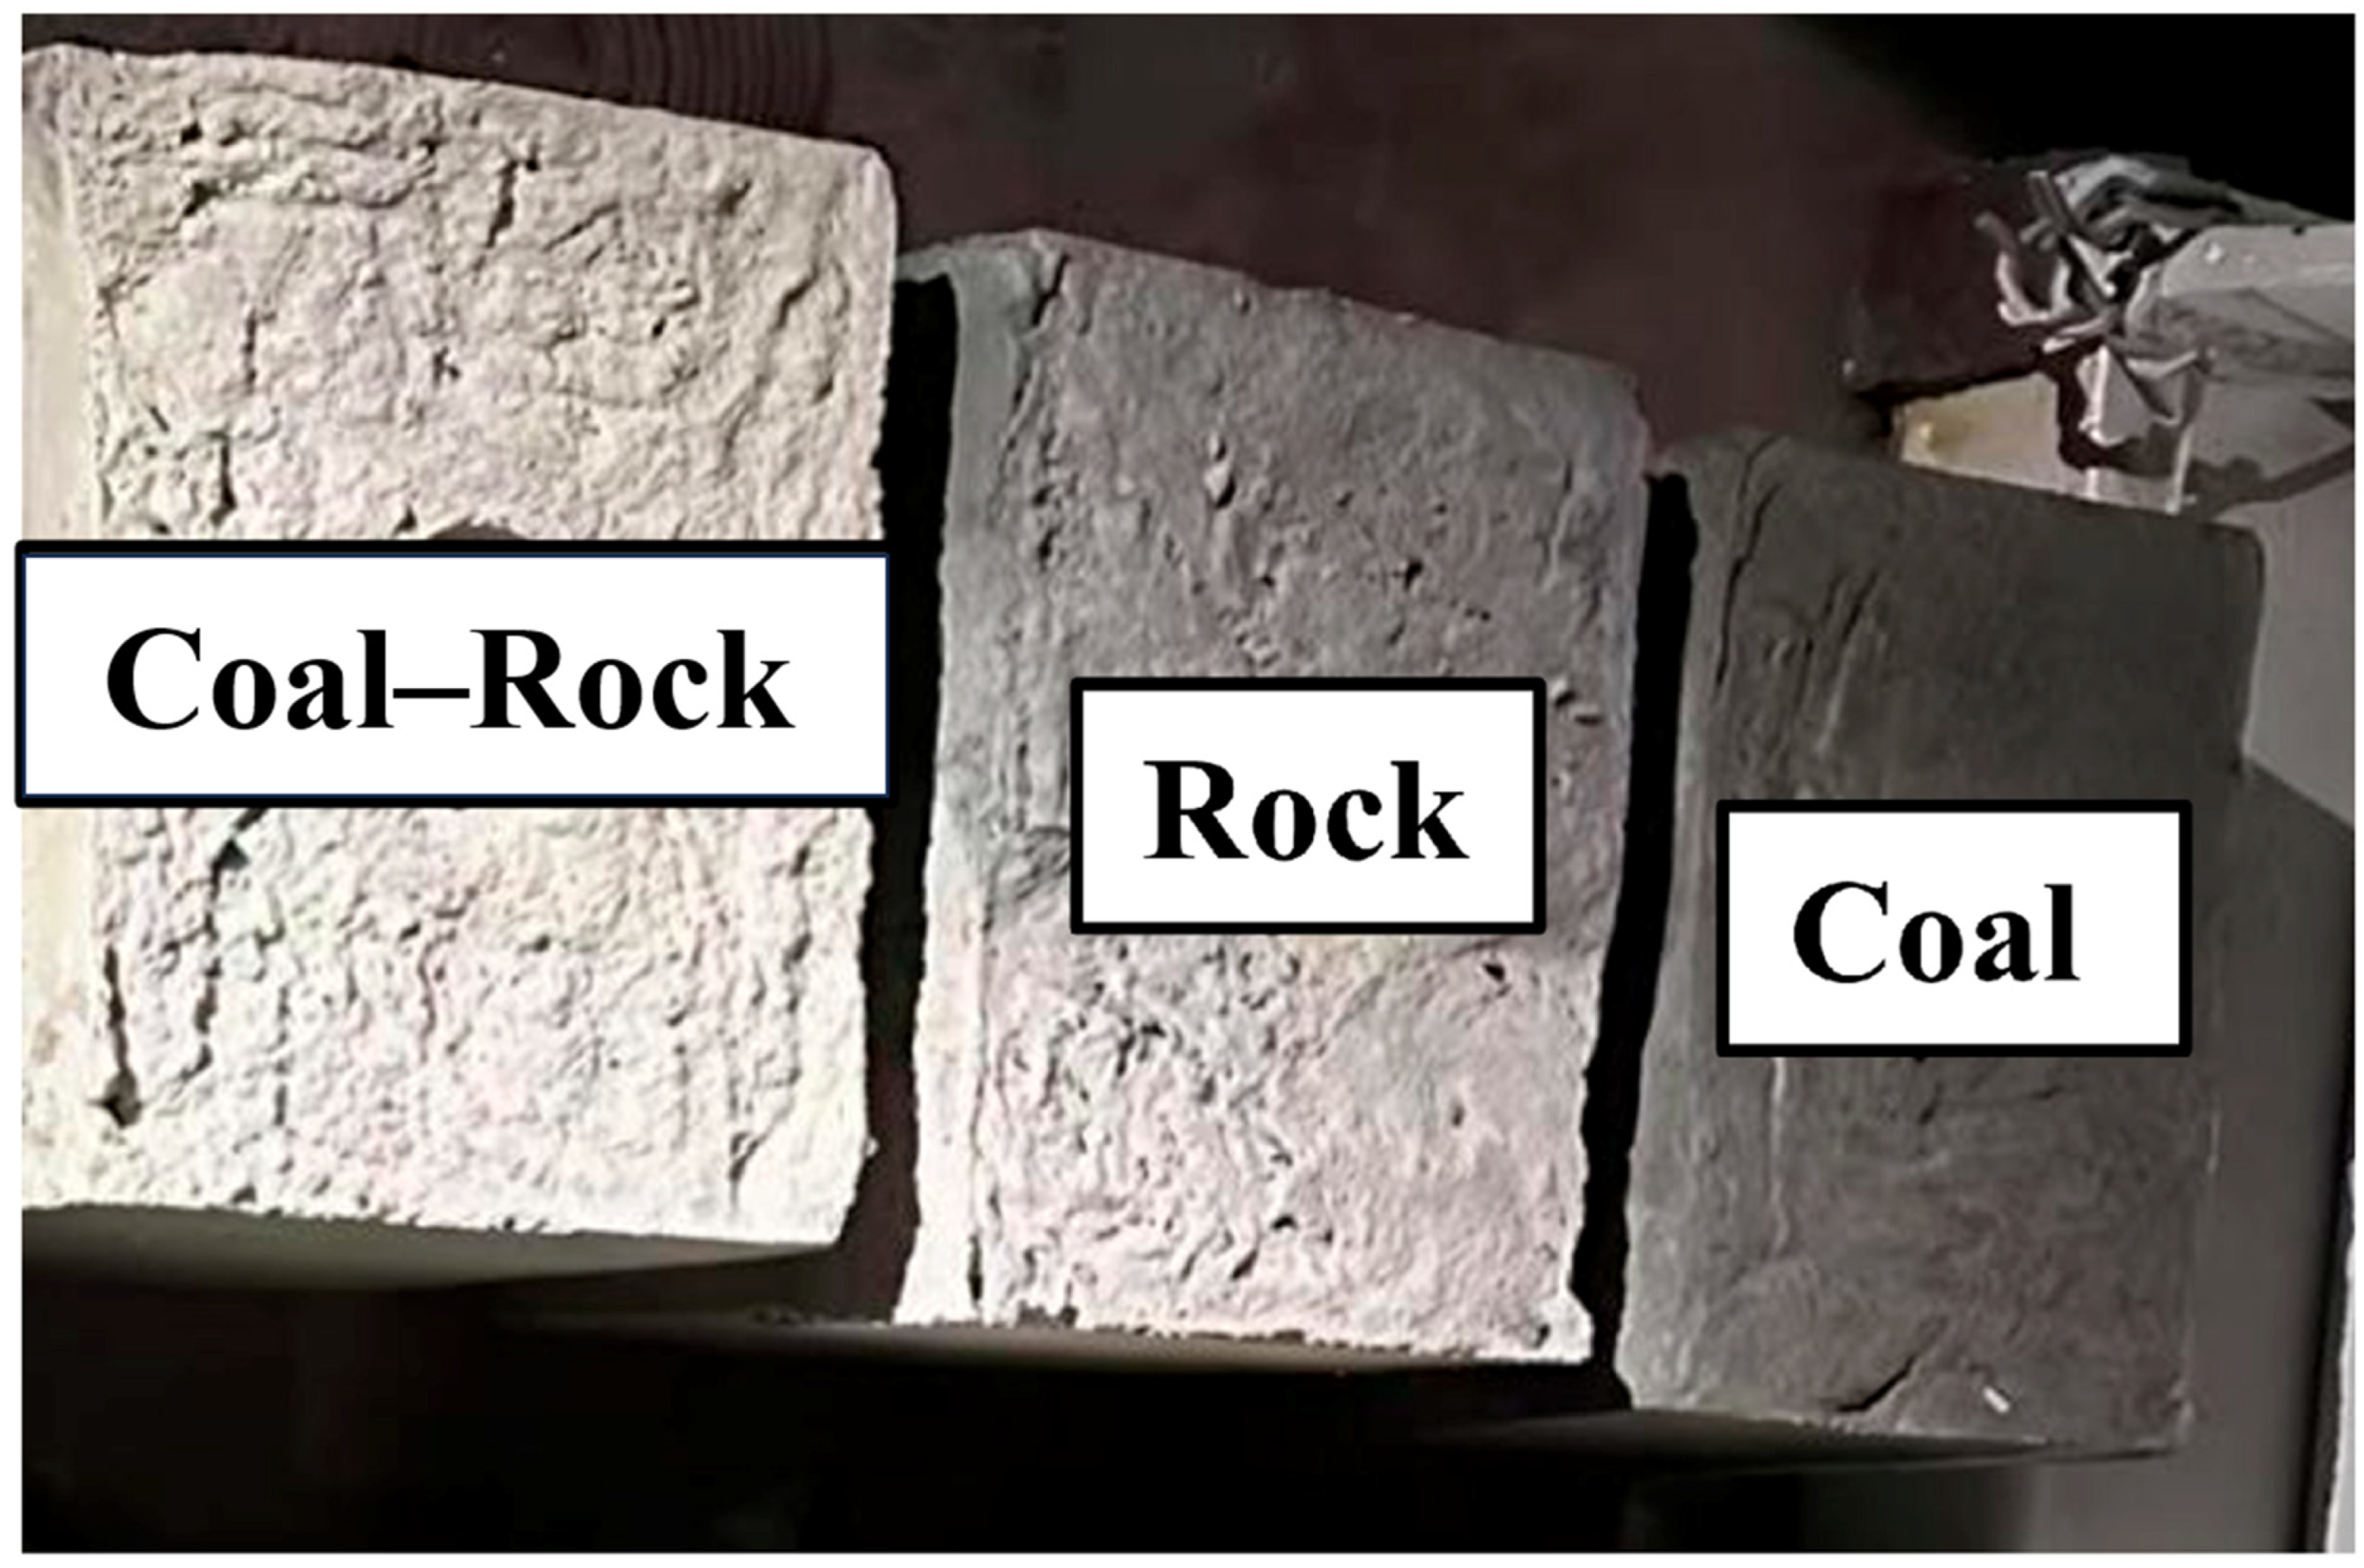
In order to simulate different types of coal–rock, sand, cement, gypsum, and water were used as raw materials to configure the rock samples in a certain proportion. According to a similar principle, 3 coal–rock specimens were made by adjusting the proportion of materials, as shown in Figure 6. The specific coal–rock composition is shown in Table 1. For the coal–rock interface specimen, the coal–rock mixture is defined based on the contact-length ratio between the cutting head and the coal-like and rock-like components, denoted as L1/L2 [30]. To describe this physically, the ratio is mathematically expressed as follows:
λ = L 1 L 2
where λ represents the coal–rock proportion, L 1 denotes the effective cutting arc length of the drum within the coal-like component, and L 2 represents the cutting arc length within the rock-like component during a single rotation cycle.
To clarify the scale of the experimental dataset and ensure the transparency of class balance, we supplement detailed statistical information on the dataset in Table 2. The dataset is divided into training, validation, and test sets at a ratio of 7:2:1, covering four working conditions (Coal, Coal–Rock, No-Load, Rock).
The experiments were conducted using the PyTorch framework (Version 1.13.1) with an Intel(R) Core(TM) i7-10875H CPU @ 2.30 GHz processor, Windows 11 operating system, 32 GB of RAM, and an NVIDIA Quadro P620 graphics card for model training. The model is implemented in PyTorch. We adopt the AdamW optimizer with an initial learning rate of 3 × 10⁻⁴ and a weight decay of 0.05. The learning rate is scheduled by CosineAnnealingLR with T_max = 100 epochs. The loss function is cross-entropy with label smoothing (0.1). The model is trained for 100 epochs with a batch size of 32. The detailed parameters of the model are shown in Table 3. The detailed training and optimization settings are summarized in Table 4.
In this paper, the signal is sampled, each window contains 1024 points, and the vibration signals are sampled at a frequency of 800 Hz. Therefore, each window containing 1024 sampling points corresponds to a time duration of 1.28 s. The window’s movement step is set to 50% of its size, generating approximately 30–40 windows for each original signal, in order to more effectively extract local features of the data. To ensure the effectiveness of model training and the reliability of evaluation, the dataset is divided according to the ratio of 7:2:1. The dataset was split into training, validation, and test sets with a ratio of 7:2:1 using class-balanced random sampling. In total, 980 RP samples were obtained, including 250 Coal samples, 240 Rock samples, 250 Coal–Rock samples, and 240 No-Load samples. Specifically, the numbers of samples in the training/validation/test sets for each class are Coal 175/50/25, Rock 168/48/24, Coal–Rock 175/50/25, and No-Load 168/48/24. At the same time, random sampling is used to proportionally allocate each category of data to the training set, validation set, and test set to ensure a balanced distribution of categories in different datasets. In addition, in order to optimize data management and enhance the efficiency of model training, all samples are stored in the corresponding folders according to categories and further divided into training, validation, and testing subdirectories.

4. Results and Discussion

4.1. Data Visualizations

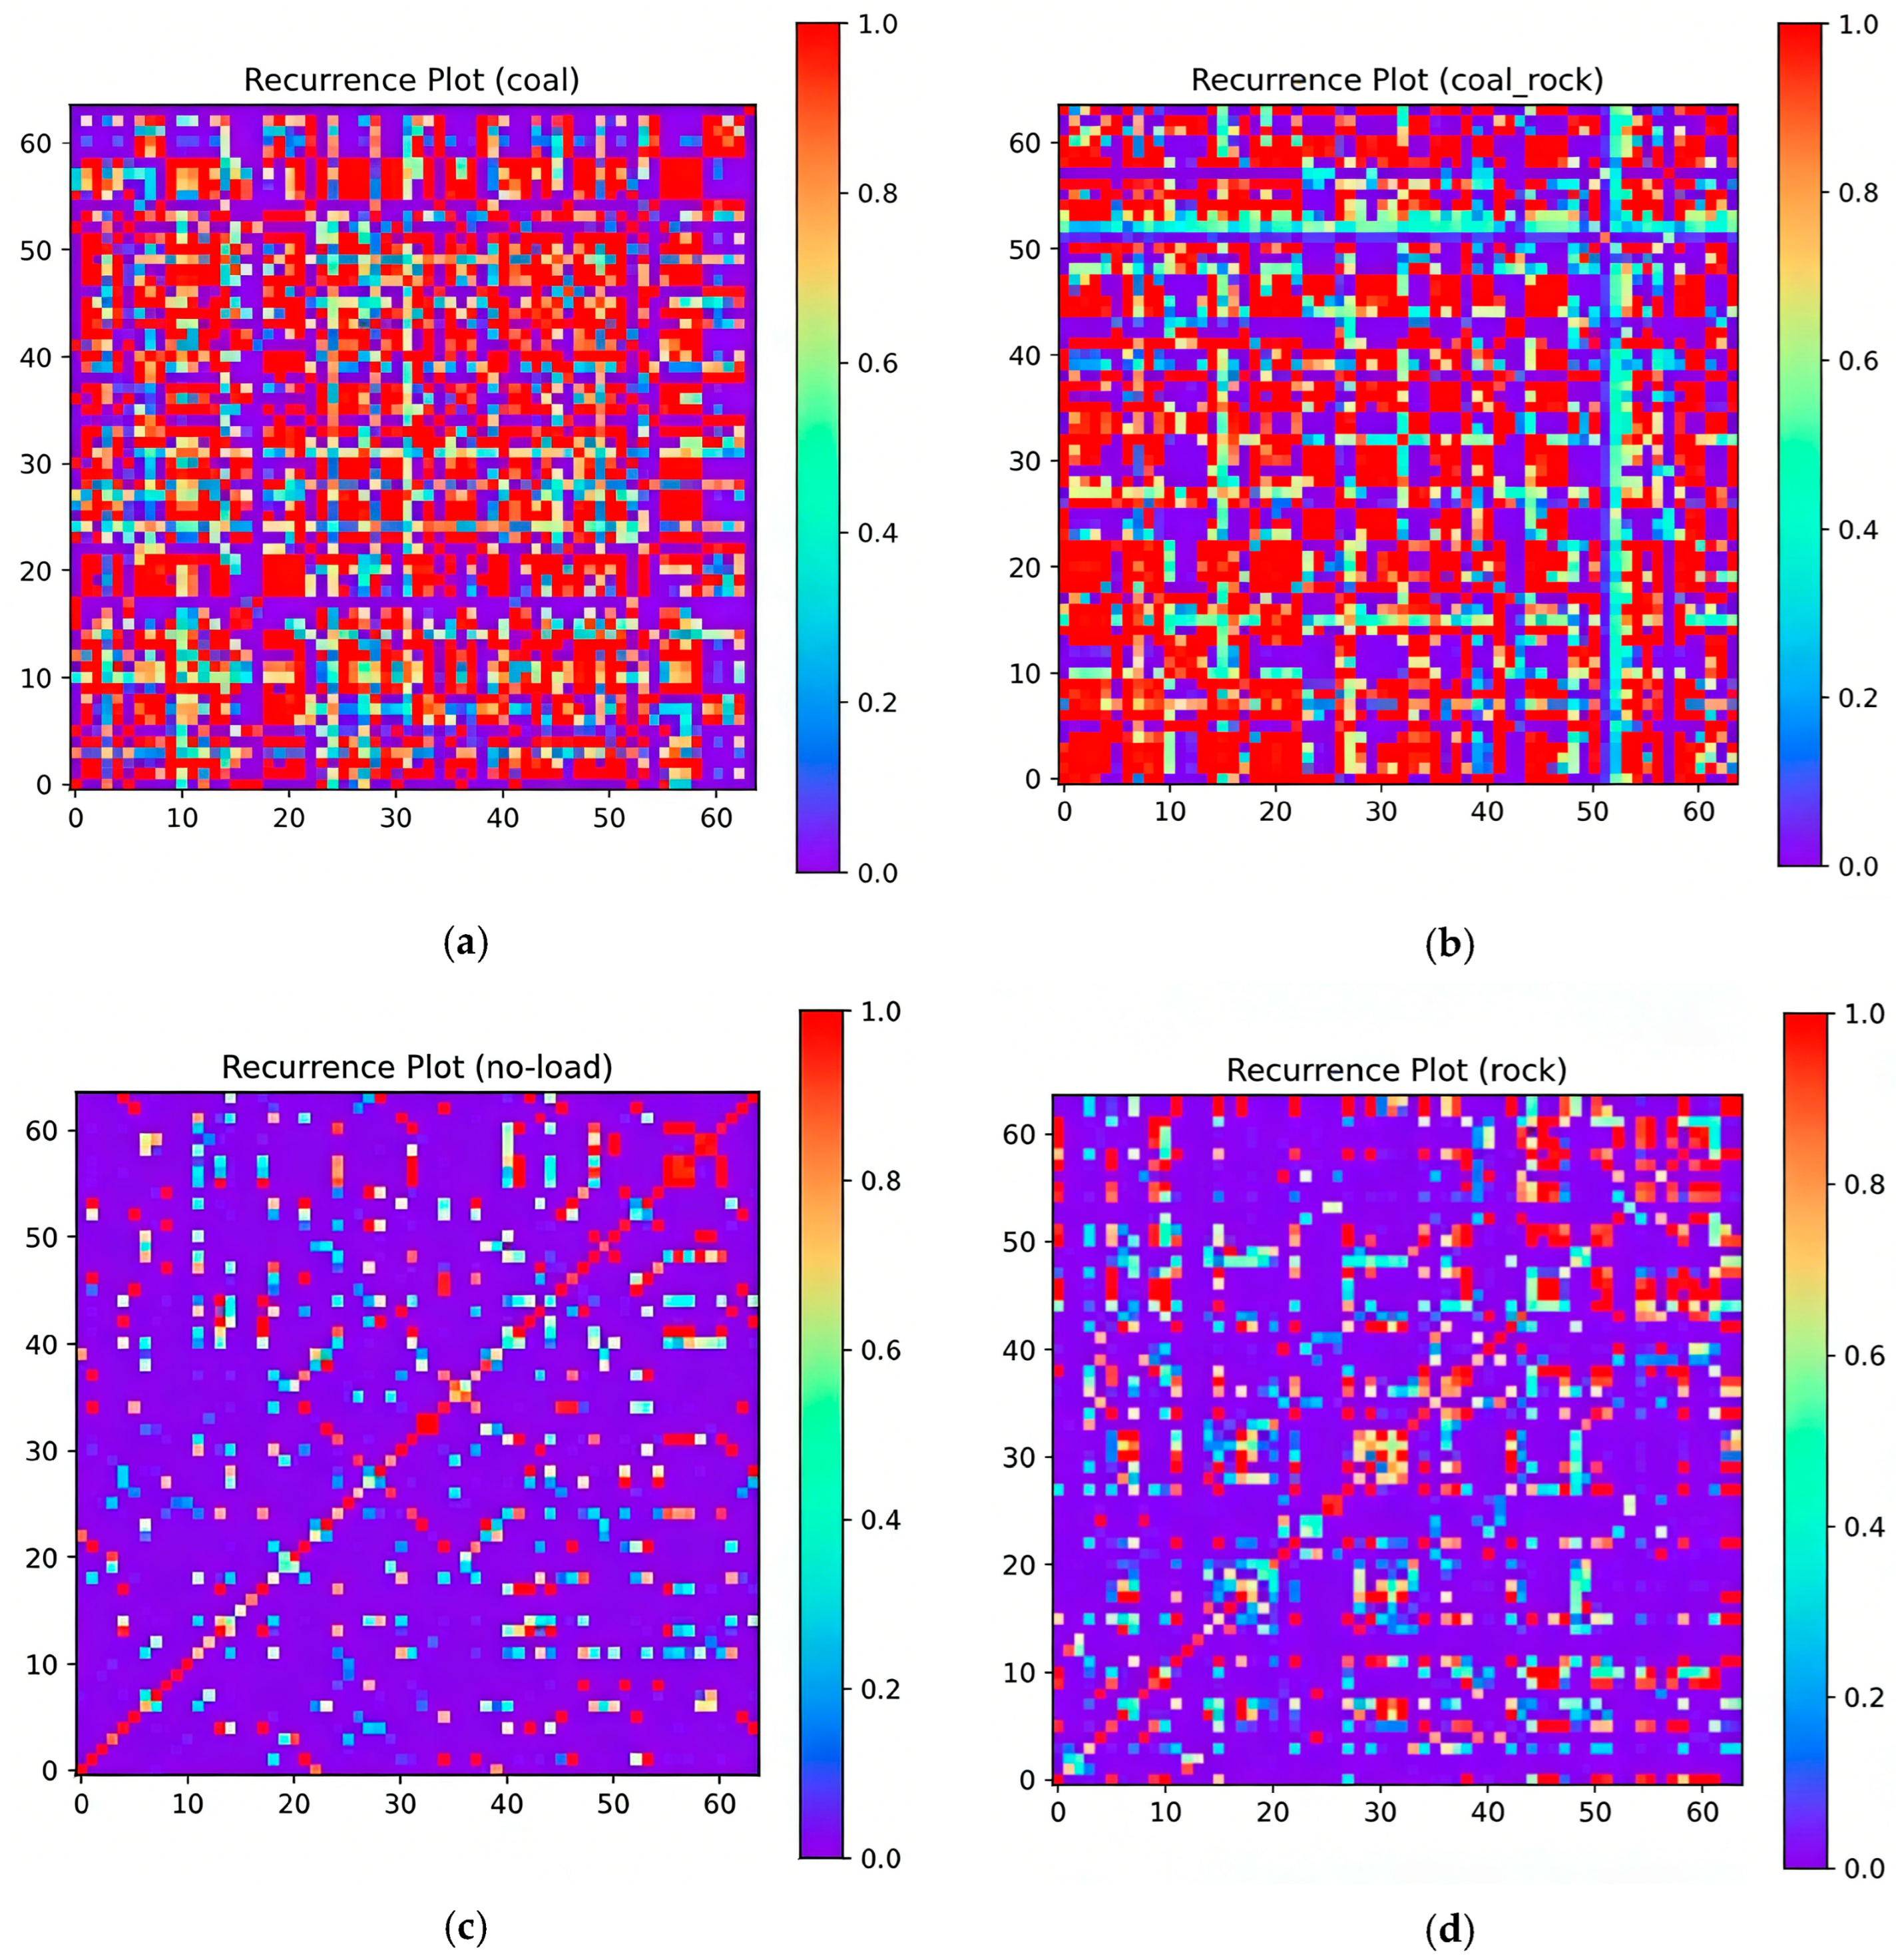
In order to intuitively display the data distribution and sample characteristics, different categories of RP images were visualized and analyzed. Each type of sample image spatially displays the dynamic characteristics of the original vibration signal, as shown in Figure 7.
The recurrence plot analysis clearly reveals the differences in the vibration characteristics of the four working conditions during coal–rock cutting. The recurrence plot of the coal sample shows a uniformly distributed red area and a continuous diagonal patch structure, as shown in Figure 7a. This highly recursive intensity pattern directly reflects the uniformity characteristics of the coal body. Although the overall pattern of the coal–rock mixed state is similar to that of the coal body, the local blue spots and patch cracks indicate that the rock component introduces transient impact disturbances, resulting in local divergence of the phase space trajectory and non-uniform coupling effects, as shown in Figure 7b. The no-load state shows typical random vibration characteristics, which are manifested as a sparse blue distribution and unstructured patterns, consistent with the vibration characteristics dominated by background noise, as shown in Figure 7c. The recurrence plot of the rock shows alternating distribution of short-range red stripes and high-frequency blue grids, reflecting the brittle fracture caused by the high hardness of the rock and the nonlinear chaotic response of high-frequency stress waves, as shown in Figure 7d. The differences in color gradient, patch continuity, and spatial pattern of the four types of recurrence plots provide an interpretable visualization basis for the real-time coal–rock recognition algorithm based on deep feature fusion. The recurrence plot can characterize the time-frequency characteristics of vibration signals in multiple dimensions, giving it a unique advantage in operating status monitoring in complex industrial scenarios.
To further support the above qualitative observations with quantitative evidence, recurrence quantification analysis (RQA) metrics are introduced to characterize the recurrence plots numerically. Specifically, recurrence rate (RR) reflects the density of recurrent states in the recurrence plot, determinism (DET) measures the degree of structured and deterministic patterns, and entropy (ENTR) characterizes the complexity of the underlying dynamic behavior. The calculated RQA metrics for different operating conditions are summarized in Table 5. These metrics provide a quantitative basis for distinguishing coal–rock states based on their physical cutting mechanics.
As shown in Table 5, the rock-cutting condition exhibits the highest RR and DET values (0.41 and 0.89, respectively). This indicates highly regular and deterministic vibration patterns, which are physically attributed to the stable, high-frequency fracture cycles generated by the high stiffness of the rock material. In contrast, the coal–rock cutting condition yields the highest entropy (2.72). This significant increase in signal complexity arises from the interaction between heterogeneous materials: as the cutting head alternates between soft coal and hard rock, it induces frequent regime shifts, transient impulses, and nonlinear coupling effects. This heterogeneity creates a varying distribution of diagonal line lengths in the recurrence plot, thereby maximizing the system’s Shannon entropy compared to the more uniform single-material cutting states. Meanwhile, the no-load condition shows the lowest RR and DET values, reflecting a lack of structural periodicity in the noise-dominated signal.

4.2. Comparative Experiments

This study uses a comparative experimental method to systematically evaluate the performance of the ECA-RepNet model. Five representative deep learning models, including ResNet, CNN, MobileNet, DenseNet, and ShuffleNet, were selected as benchmarks for comparison. To ensure the fairness and reproducibility of performance comparison, the key configurations of all compared baseline models are detailed in Table 6. These configurations are consistent with their official implementations and industry-standard settings for coal–rock vibration signal classification tasks, avoiding artificial performance biases caused by improper parameter adjustment.
To ensure a rigorous evaluation of the architectural advantages and eliminate the interference of manual hyperparameter tuning bias, a unified optimization protocol was applied to all models. Specifically, the AdamW optimizer combined with cosine annealing was selected as the standard setting due to its proven robustness and convergence stability across various CNN architectures (including ResNet and DenseNet).
While model-specific hyperparameter fine-tuning might yield marginal performance gains for baselines like DenseNet, this study prioritizes a controlled comparison of parameter efficiency and feature extraction capability under standardized industrial deployment conditions. Under this unified protocol, differences in performance can be more directly attributed to the inherent characteristics of the network structures rather than optimization tricks.
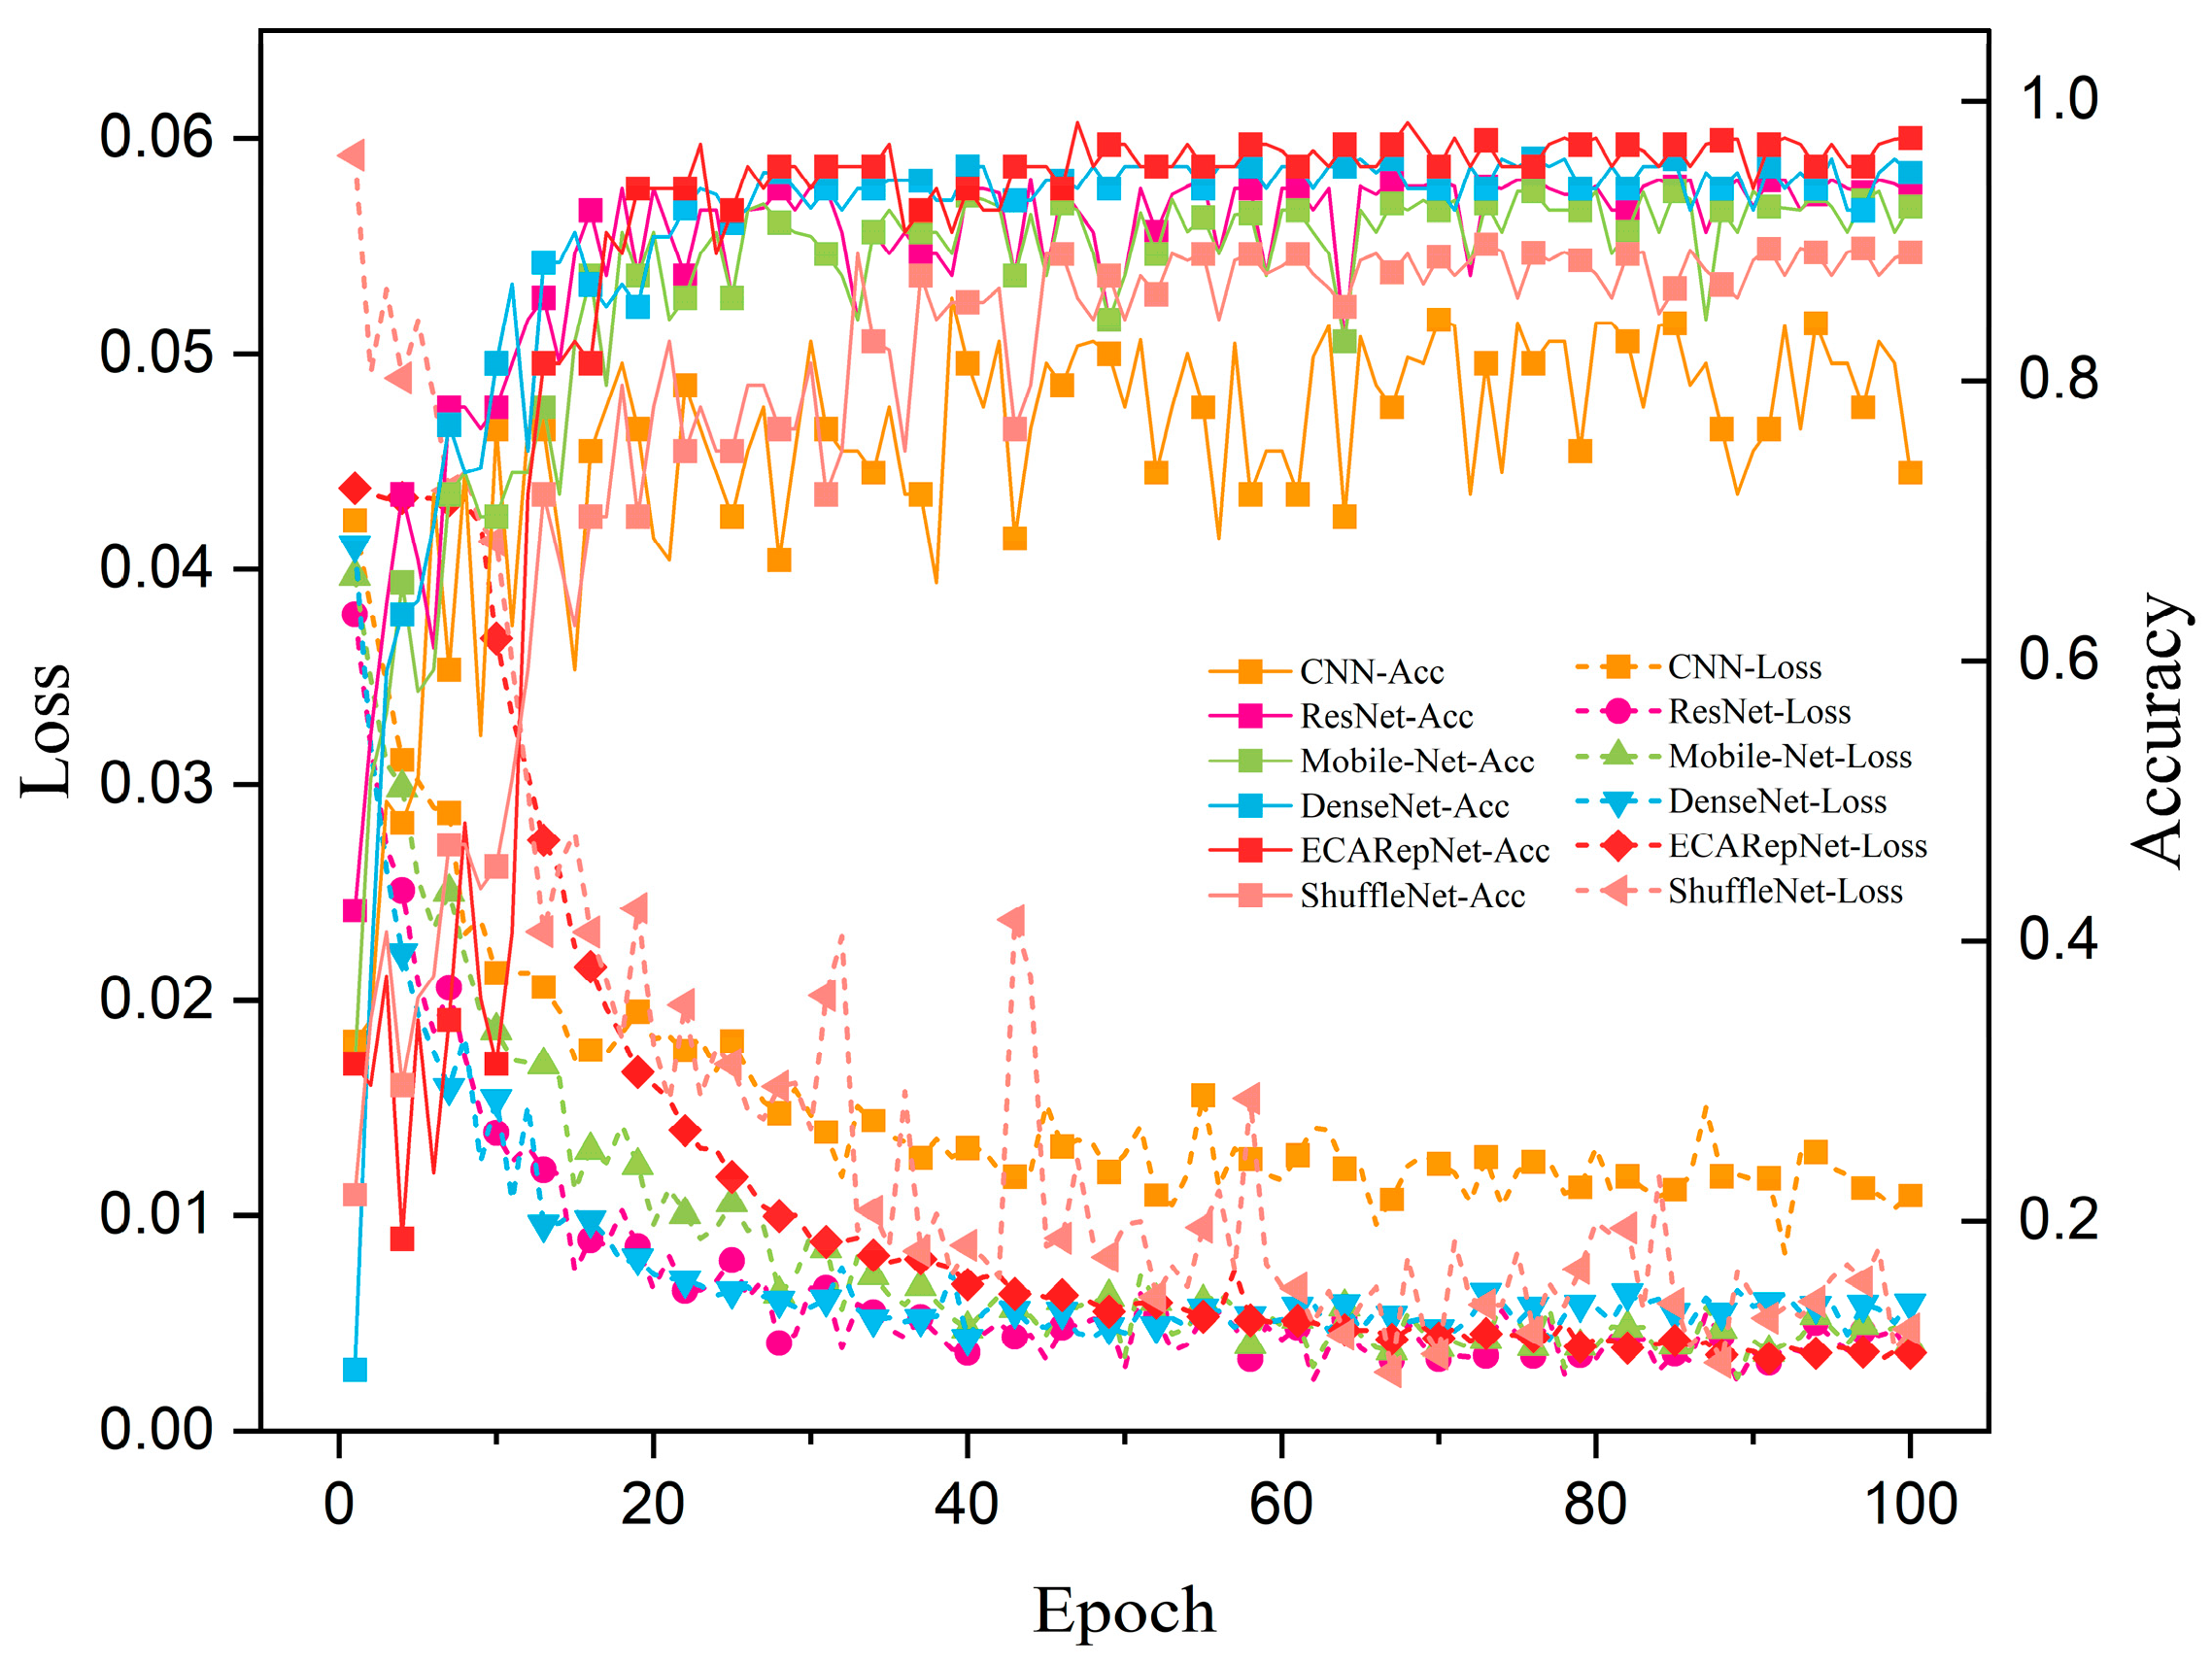
Through the design of comparative experiments, ECA-RepNet has shown significant advantages in multiple performance indicators with its Efficient Channel Attention mechanism and task-oriented optimization design. The comparison of each model is shown in Figure 8 and Table 7.
According to the training curve in Figure 8, ECA-RepNet shows a comprehensive and balanced performance advantage. The accuracy of ECA-RepNet (red diamond) quickly climbed to more than 90% within 20 epochs, while ResNet and DenseNet required 30 and 28 epochs, respectively, and were significantly higher than the convergence values of ResNet and DenseNet. Its loss value (red square) stabilized below 0.01 after 40 epochs, verifying the optimization effect of the ECA module on the feature learning path. Although CNN converges quickly, its final accuracy is not high, revealing the limitations of traditional convolutional structures in capturing vibration signal features.
From the horizontal comparison in Table 7, it can be seen that ECA-RepNet achieves the best balance between accuracy and efficiency at 2.05 M parameters. Although its parameter volume is larger than that of MobileNet, it is improved by 3.8 percentage points; compared with ResNet, the accuracy rate is improved by 3.01 percentage points while the parameter volume is reduced by 3.8%; the accuracy rate of CNN is only 84.13%, which is far lower than ECA-RepNet and even lower than the lightweight MobileNet, indicating that the traditional CNN has deficiencies in feature extraction capabilities and is difficult to adapt to the high-precision requirements of complex tasks. Compared with MobileNet and ShuffleNet, ECA-RepNet has achieved higher classification performance by enhancing the inter-channel feature modeling capabilities while maintaining a lightweight design, demonstrating its excellent performance in lightweight networks. In terms of computational efficiency, each round of training of ECA-RepNet takes less time, which is 25% faster than DenseNet; the inference speed is better than ResNet and DenseNet, and is close to MobileNet and ShuffleNet, which fully reflects the good balance between performance and efficiency.
From a statistical perspective, considering the test set scale, the 95% confidence interval for the observed accuracy (97.33%) is approximately ± 3.16 % . While ECA-RepNet yields a higher numerical accuracy compared to established baselines like ResNet18 (96.65%), the overlapping confidence bounds suggest that our model delivers comparable and robust classification performance within a standard margin of error. Crucially, the merit of ECA-RepNet is further substantiated by its superior trade-off between accuracy and efficiency as it achieves state-of-the-art performance with a significantly reduced parameter footprint and lower computational complexity (FLOPs), facilitating its deployment in resource-constrained industrial scenarios.
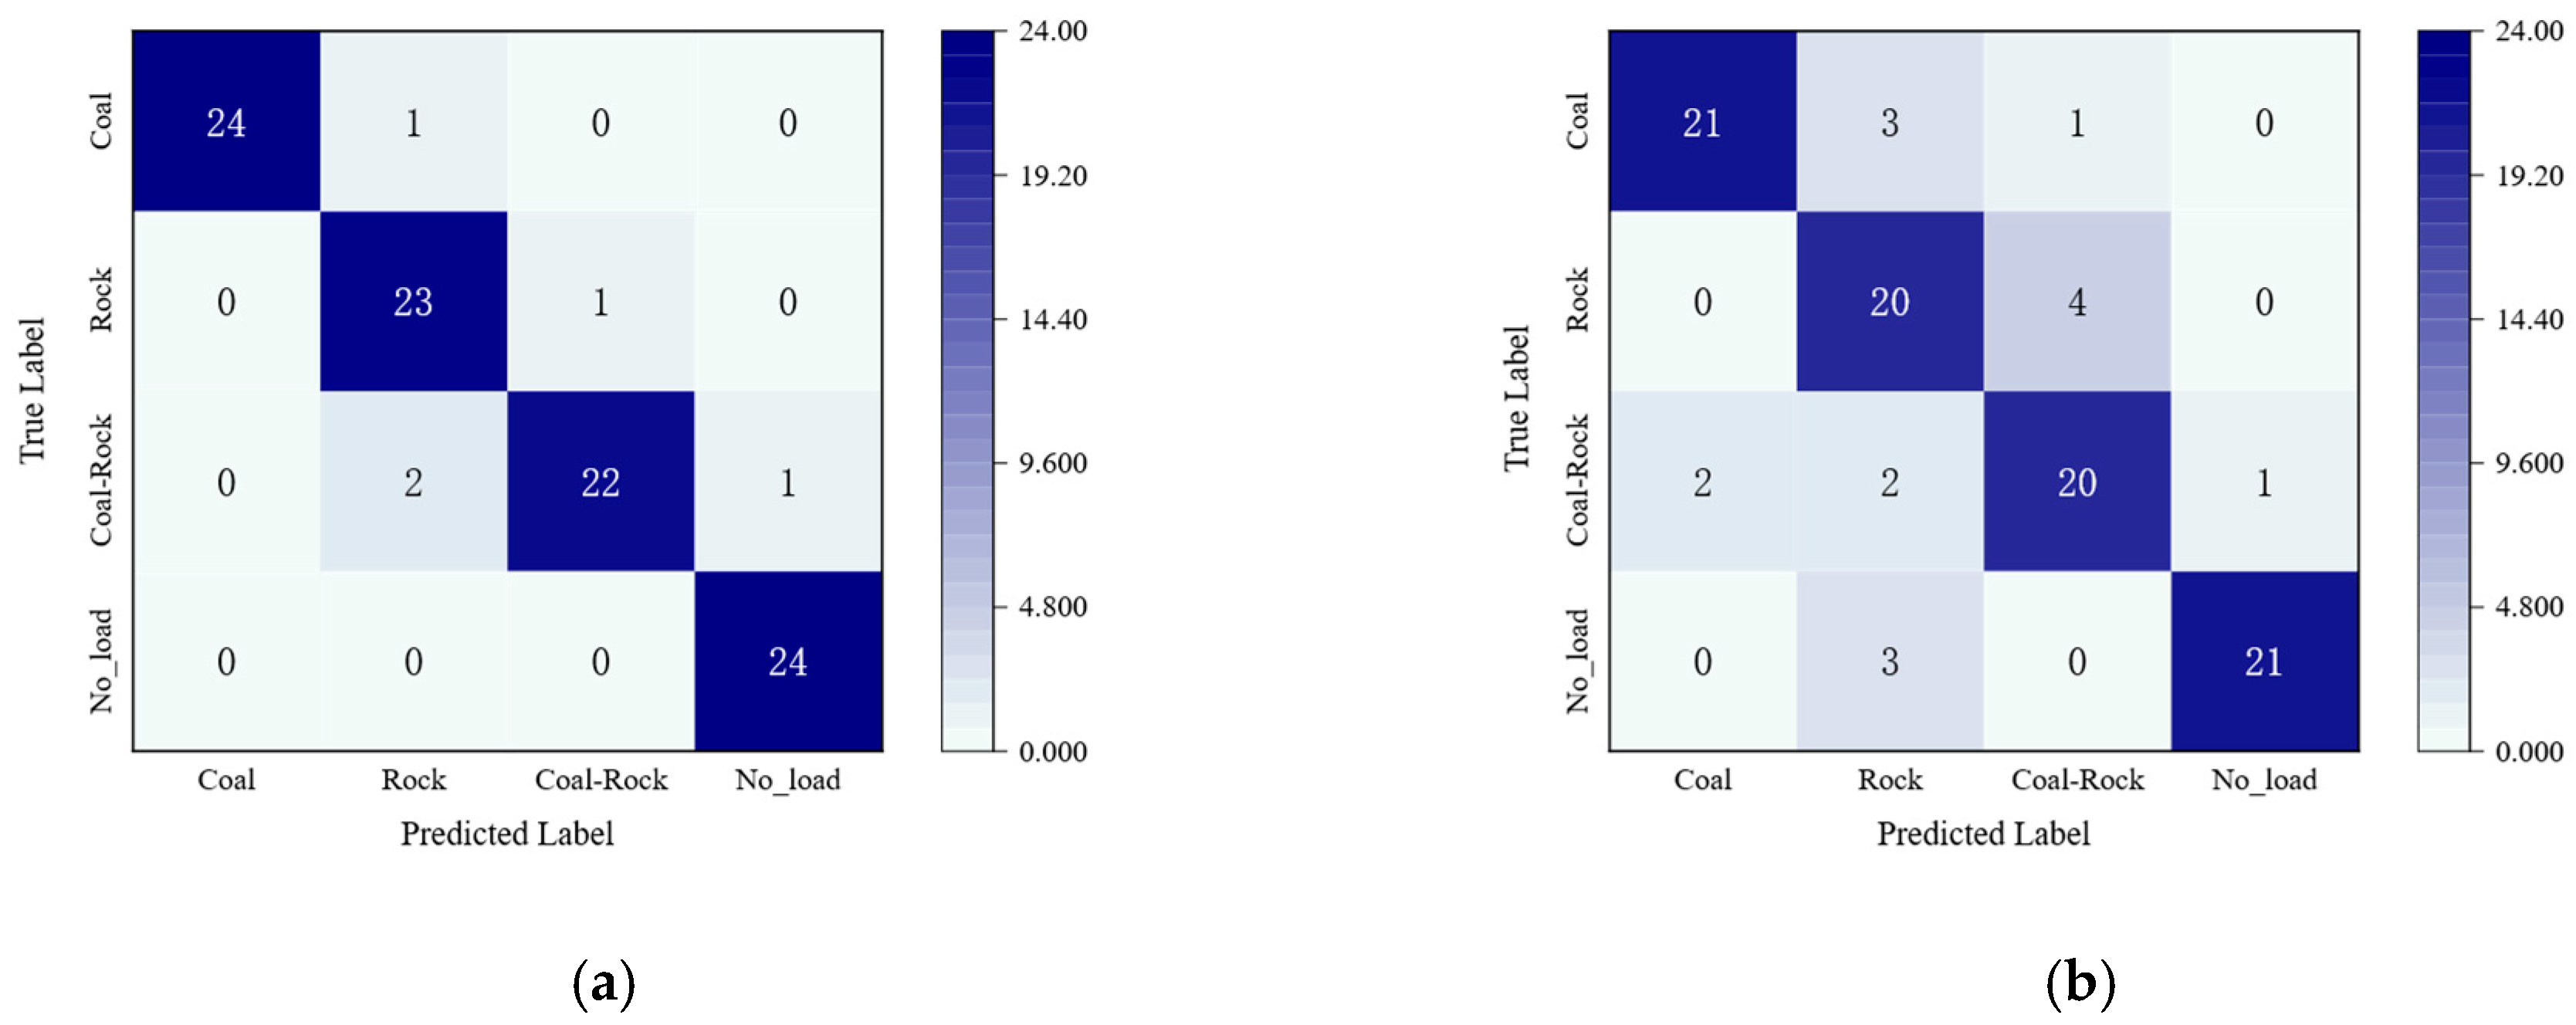
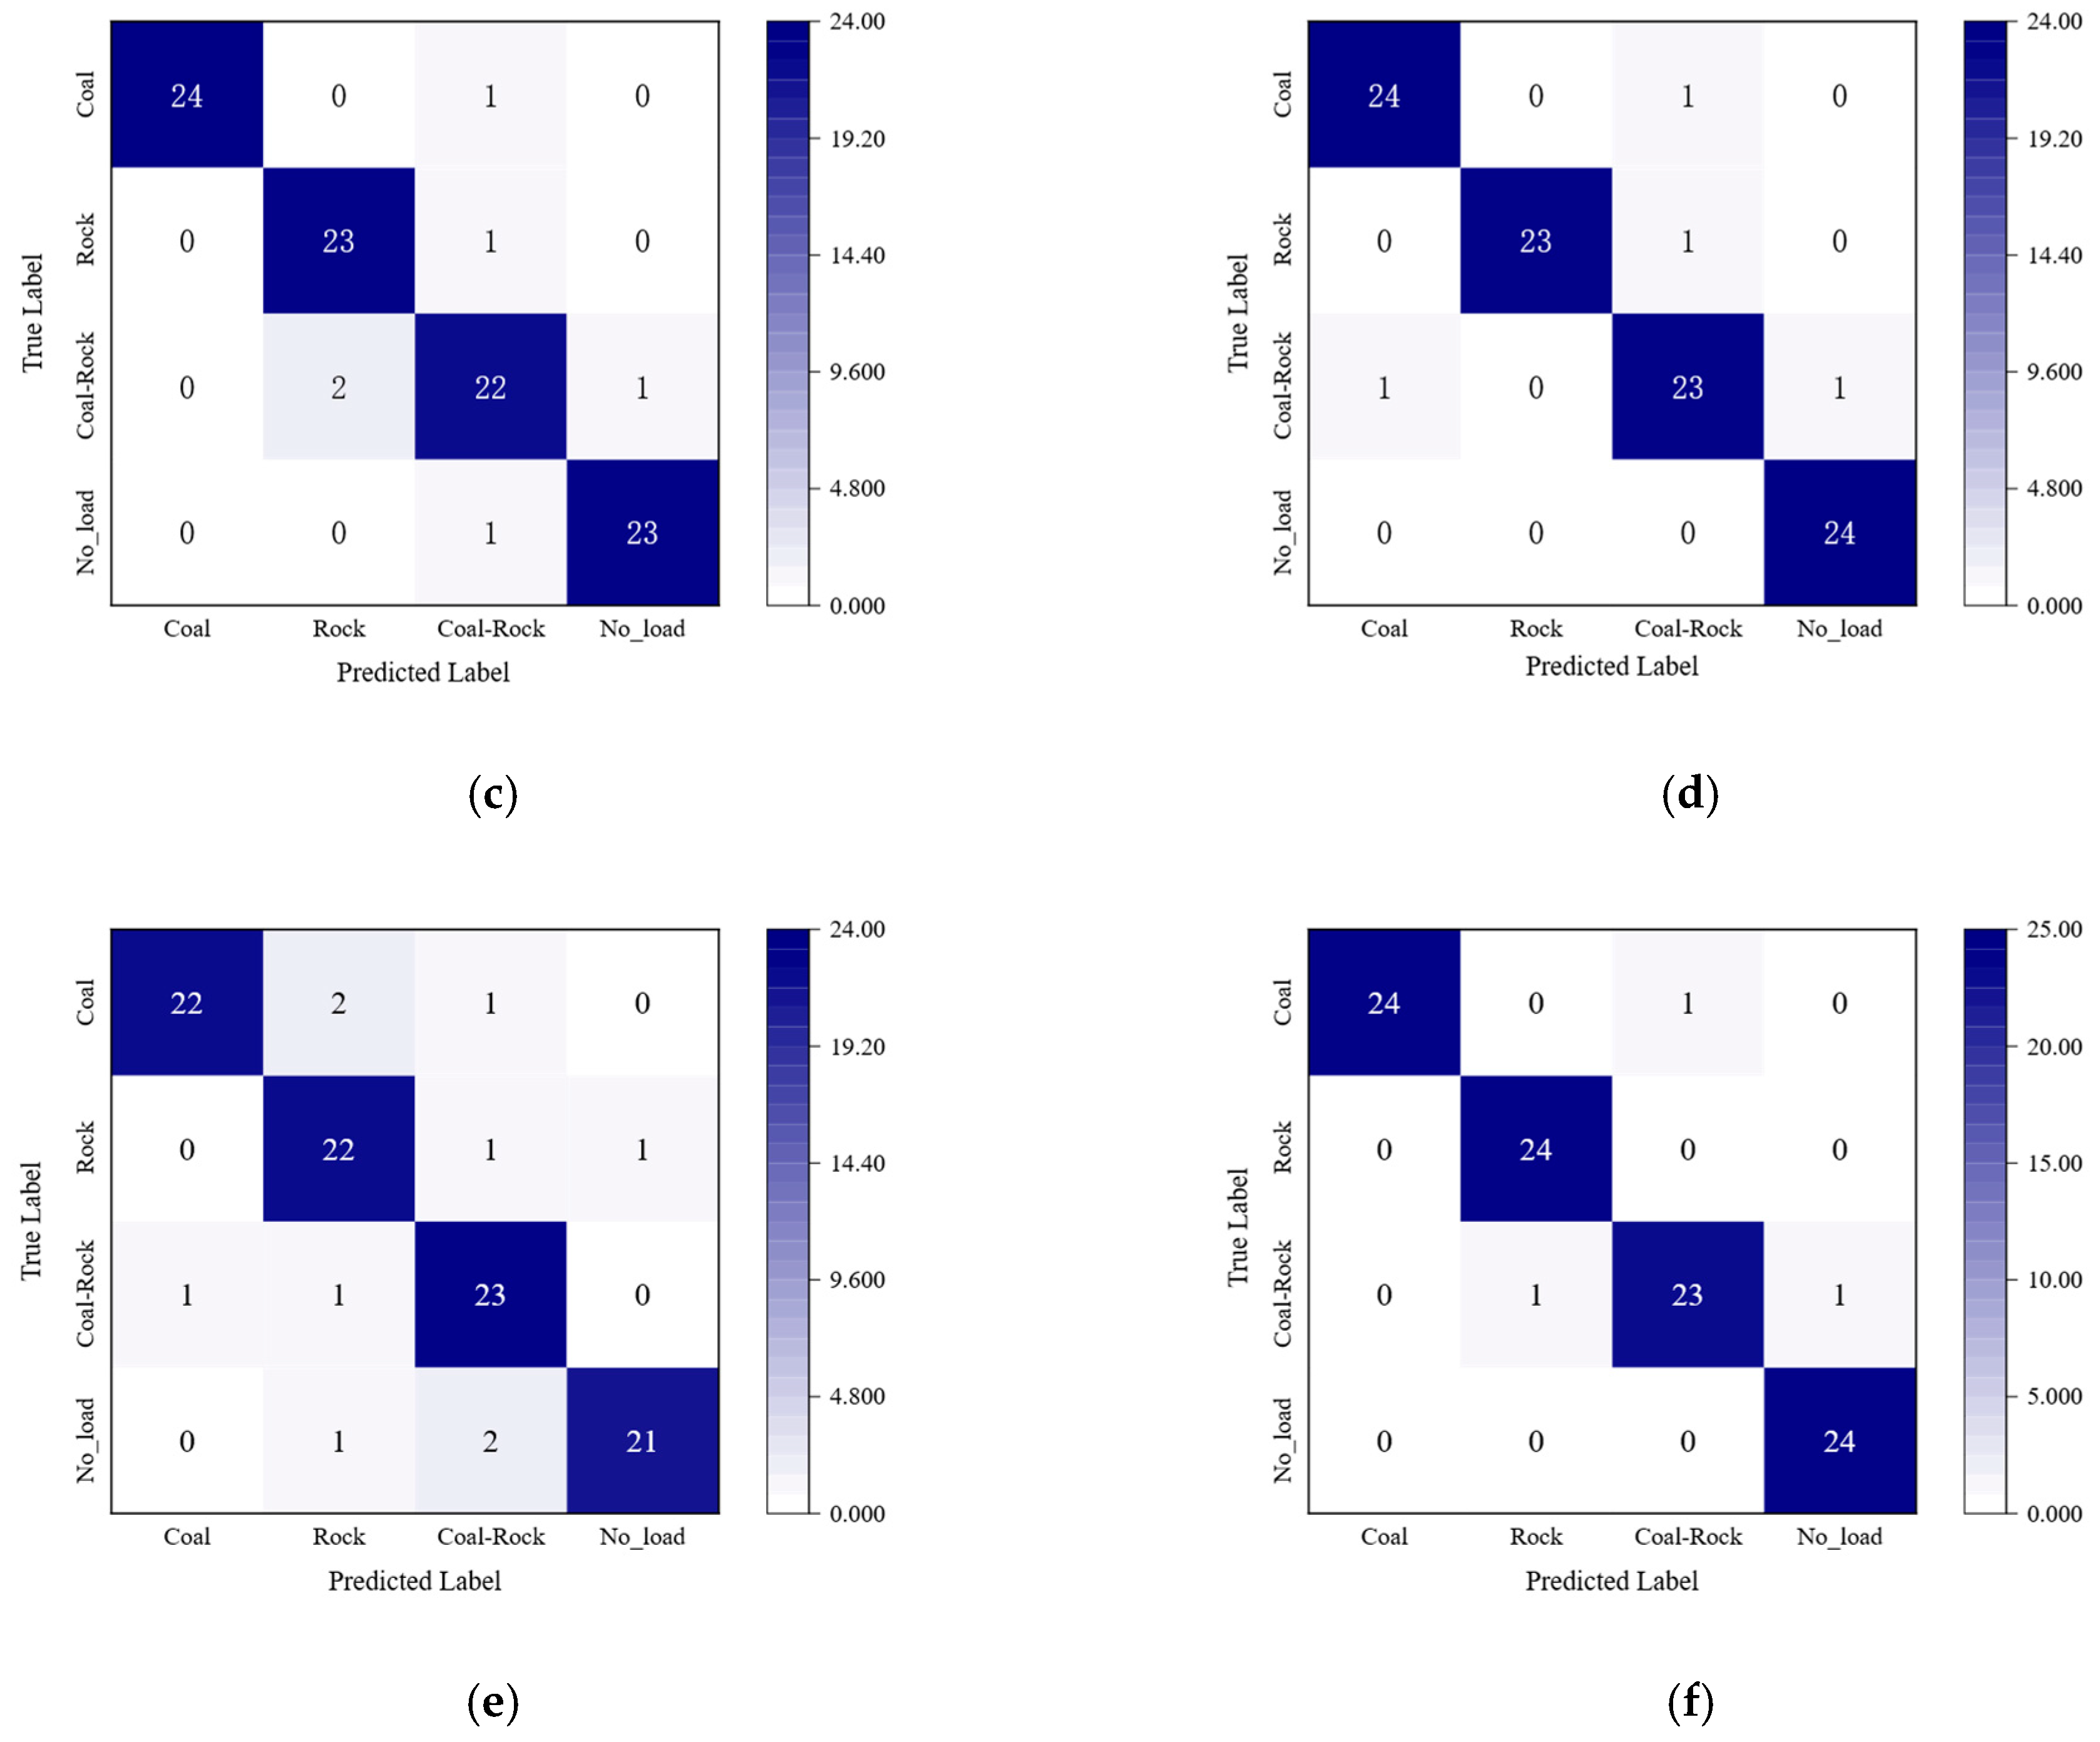
In order to systematically evaluate the differences in the recognition characteristics of the model for each category of samples, this study uses the confusion matrix method to quantitatively visualize and analyze the classification results. The specific confusion matrix results are shown in Figure 9. In addition to the confusion matrix shown in Figure 9, class-wise precision, recall, and F1-score are reported in Table 8 for a more detailed performance assessment.
Through the systematic analysis of the confusion matrices of the six models, there are obvious differences in the classification performance of each architecture. ResNet performed well in all categories, with five misjudgments, as shown in Figure 9a; the traditional CNN had an error rate of 16% in the coal category and 16.7% in the rock category, and the overall classification performance was the weakest, as shown in Figure 9b. Among the lightweight models, MobileNet had three misjudgments in the coal–rock mixed category, as shown in Figure 9c; ShuffleNet had two misjudgments in this category, as shown in Figure 9e, revealing the limitations of lightweight design in capturing complex features. Dense-Net showed good balanced performance, but there were still two category errors in the coal–rock category, as shown in Figure 9d. ECA-RepNet had the best classification performance in all categories, with only three misjudgments in all categories, as shown in Figure 9f, verifying the synergistic advantages of multi-scale feature fusion and dynamic channel optimization.

4.3. Ablation Experiments

In order to systematically verify the core contribution of each module to the feature extraction capability of the model, the study designed a controlled ablation experiment. By gradually removing each module in the model architecture and observing its impact on the model performance, the contribution of each module in improving the feature expression capability and overall performance is systematically evaluated. The details are shown in Table 9.
After removing RepLK Block, the accuracy decreases from 97.33% to 94.12%, and the number of parameters is also reduced to 1.98 M, indicating that RepLK Block is able to significantly improve the feature extraction capability through multi-scale convolutional kernel while introducing a small number of parameters. After removing DSConv, the accuracy decreases to 95.07%, and the number of parameters increases accordingly, indicating that its lightweight design can still effectively extract features while reducing the number of parameters. After removing the ECA Module, the accuracy rate decreases to 94.85%, and the number of parameters decreases slightly, indicating that the channel attention mechanism is able to enhance the important features through dynamic weight allocation and has less impact on the number of parameters.
Further analysis shows that after removing RepLK Block and ECA Module at the same time, the accuracy rate decreases dramatically, indicating that the two have a synergistic effect on the performance enhancement; while after removing DSConv and ECA Module at the same time, the accuracy rate decreases, and the parameters are increased instead, indicating that DSConv reduces the number of parameters while maintaining high performance together with ECA Module.
To further investigate the contribution of each module to the overall performance of the proposed model, a series of controlled ablation experiments was conducted. By selectively removing or replacing specific components in the network architecture, the impact of each module on classification accuracy and model complexity can be systematically evaluated. The detailed ablation results are summarized in Table 10.
As shown in Table 10, removing the RepLK Block leads to the most significant performance degradation, indicating that the proposed multi-scale large-kernel design plays a critical role in extracting discriminative features. When depthwise separable convolution is replaced or removed, the accuracy decreases while the number of parameters increases, demonstrating the efficiency advantage of DSConv. In addition, the removal of the ECA module results in a noticeable decline in classification performance with only a slight reduction in model parameters, highlighting the importance of channel attention in enhancing feature representation. Overall, the ablation results confirm that each component contributes positively to the final performance, and their integration achieves an effective balance between accuracy and efficiency.
Furthermore, the comparison among different attention mechanisms provides additional insight into the effectiveness of ECA. Compared with SE, which employs channel compression through fully connected layers, ECA preserves fine-grained channel dependencies without dimensionality reduction. In contrast to CBAM, which introduces additional spatial attention operations, ECA focuses on efficient local cross-channel interaction with minimal computational overhead. This parameter-efficient design makes ECA particularly suitable for lightweight architectures and explains its superior performance in the proposed ECA-RepNet.

4.4. Synthetic Noise Robustness Evaluation

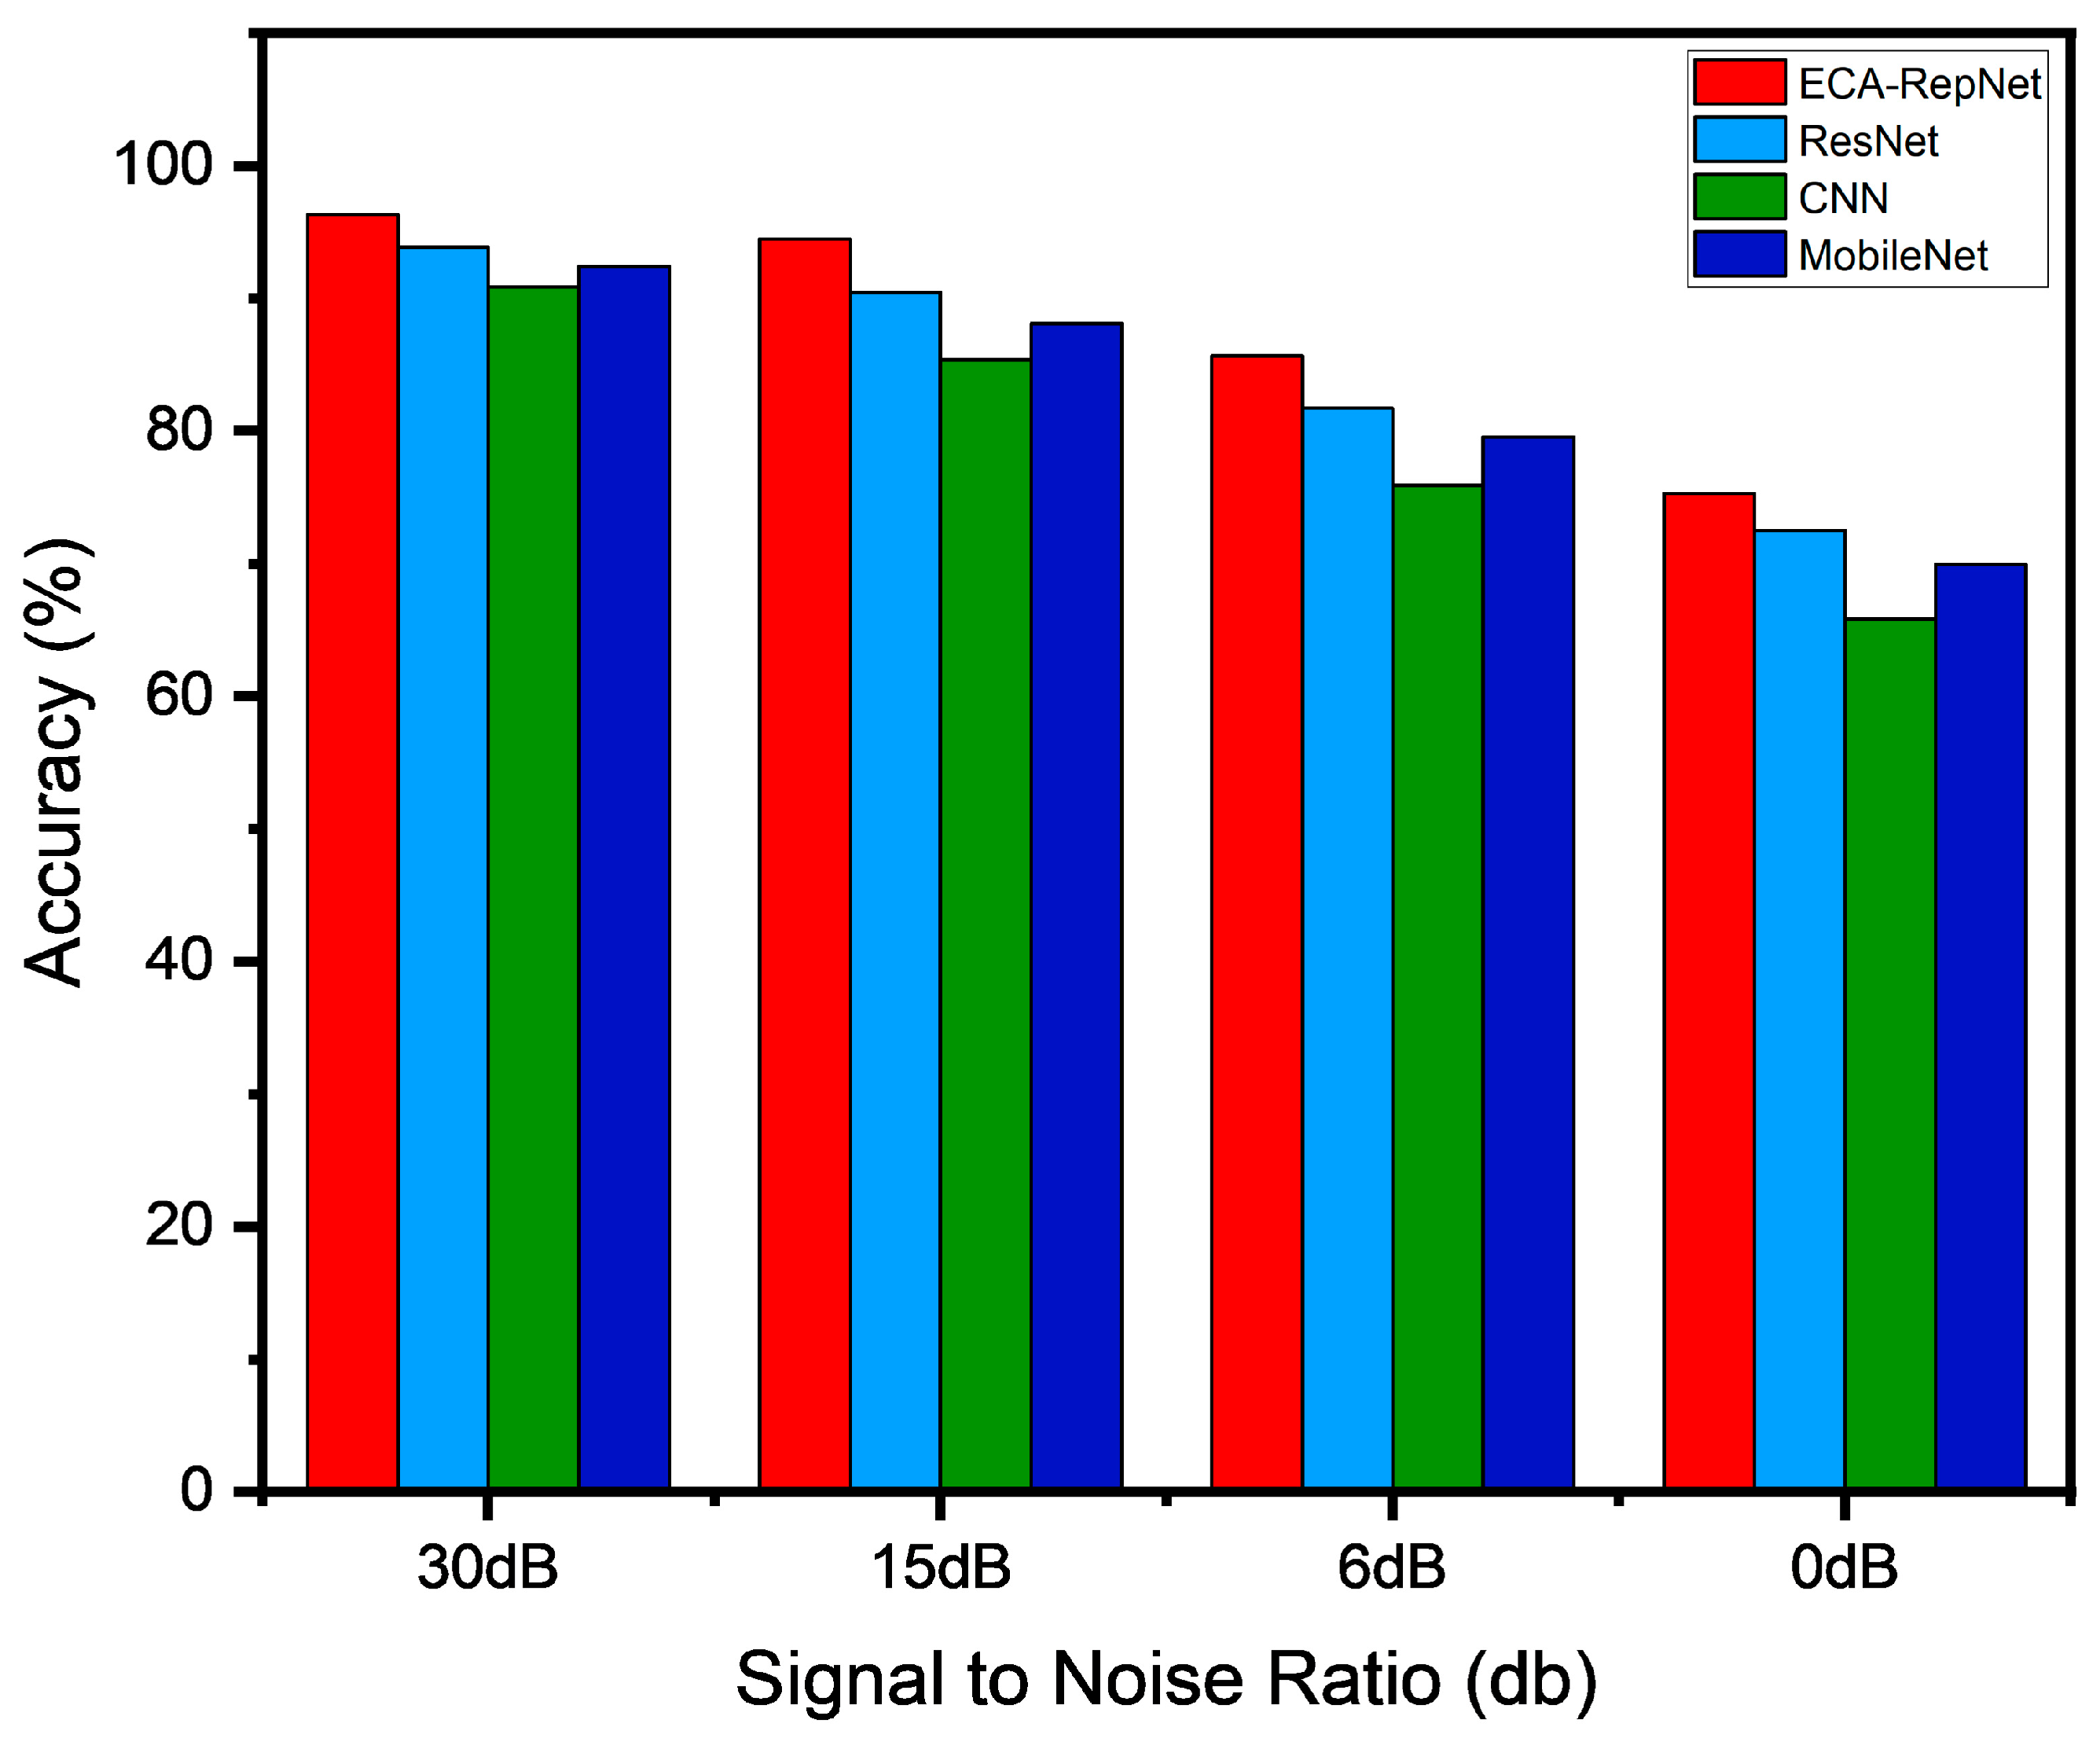
In practical applications, signal processing systems are often confronted with complex, noisy environments, which pose significant challenges to the robustness of the models. To evaluate the adaptability and noise resistance of ECA-RepNet under various signal-to-noise ratio (SNR) conditions, a series of classification tasks was designed, covering a wide range of noise environments from high SNR (30 dB) to extremely low SNR (0 dB). By comparing with classical models (ResNet, CNN, and MobileNet), we aim to comprehensively verify the performance advantages of ECA-RepNet under complex, noisy conditions. The specific results are shown in Table 11 and Figure 10.
It should be noted that the robustness evaluation in this section is conducted under synthetic Gaussian noise conditions. While Gaussian noise is commonly used as a baseline for controlled robustness assessment, it does not fully capture the complex, non-stationary disturbances present in real underground mining environments. Therefore, the results presented here should be regarded as a preliminary validation of the model’s noise robustness.
ECA-RepNet demonstrates significant advantages in classification accuracy, retention, and noise resistance. In an SNR = 30 dB environment, the accuracy reached 96.33%, which is close to the ideal state. As noise intensity increases, ECA-RepNet’s performance degradation is minimal, with accuracies remaining at 85.67% and 75.32% in SNR = 6 dB and SNR = 0 dB environments, respectively, showing its robustness under complex noise conditions. In comparison, ResNet’s accuracy is 93.88% at SNR = 30 dB, but it declines more significantly with increasing noise, particularly at SNR = 0 dB, where it drops to 72.55%. CNN performs the worst in noisy environments; although CNN achieves a reasonable accuracy of 90.89% at SNR = 30 dB, its accuracy significantly decreases in SNR = 6 dB and SNR = 0 dB, dropping to 75.94% and 65.83%, respectively, indicating poor robustness under noise interference. MobileNet, although a lightweight model, performs worse than ECA-RepNet in noisy environments, with an accuracy of only 69.97% at SNR = 0 dB, indicating its weaker robustness in noise conditions.
From the above analysis, it can be seen that ECA-RepNet, by combining the ECA module and RP image transformation, shows clear advantages in noisy environments. This is mainly due to the channel attention mechanism of the ECA module, which effectively extracts key features in noisy environments, while the RP transformation enhances the model’s ability to express temporal features. This enables ECA-RepNet to exhibit stronger adaptability and robustness to changes in signal-to-noise ratio.

4.5. Visualization Experiment

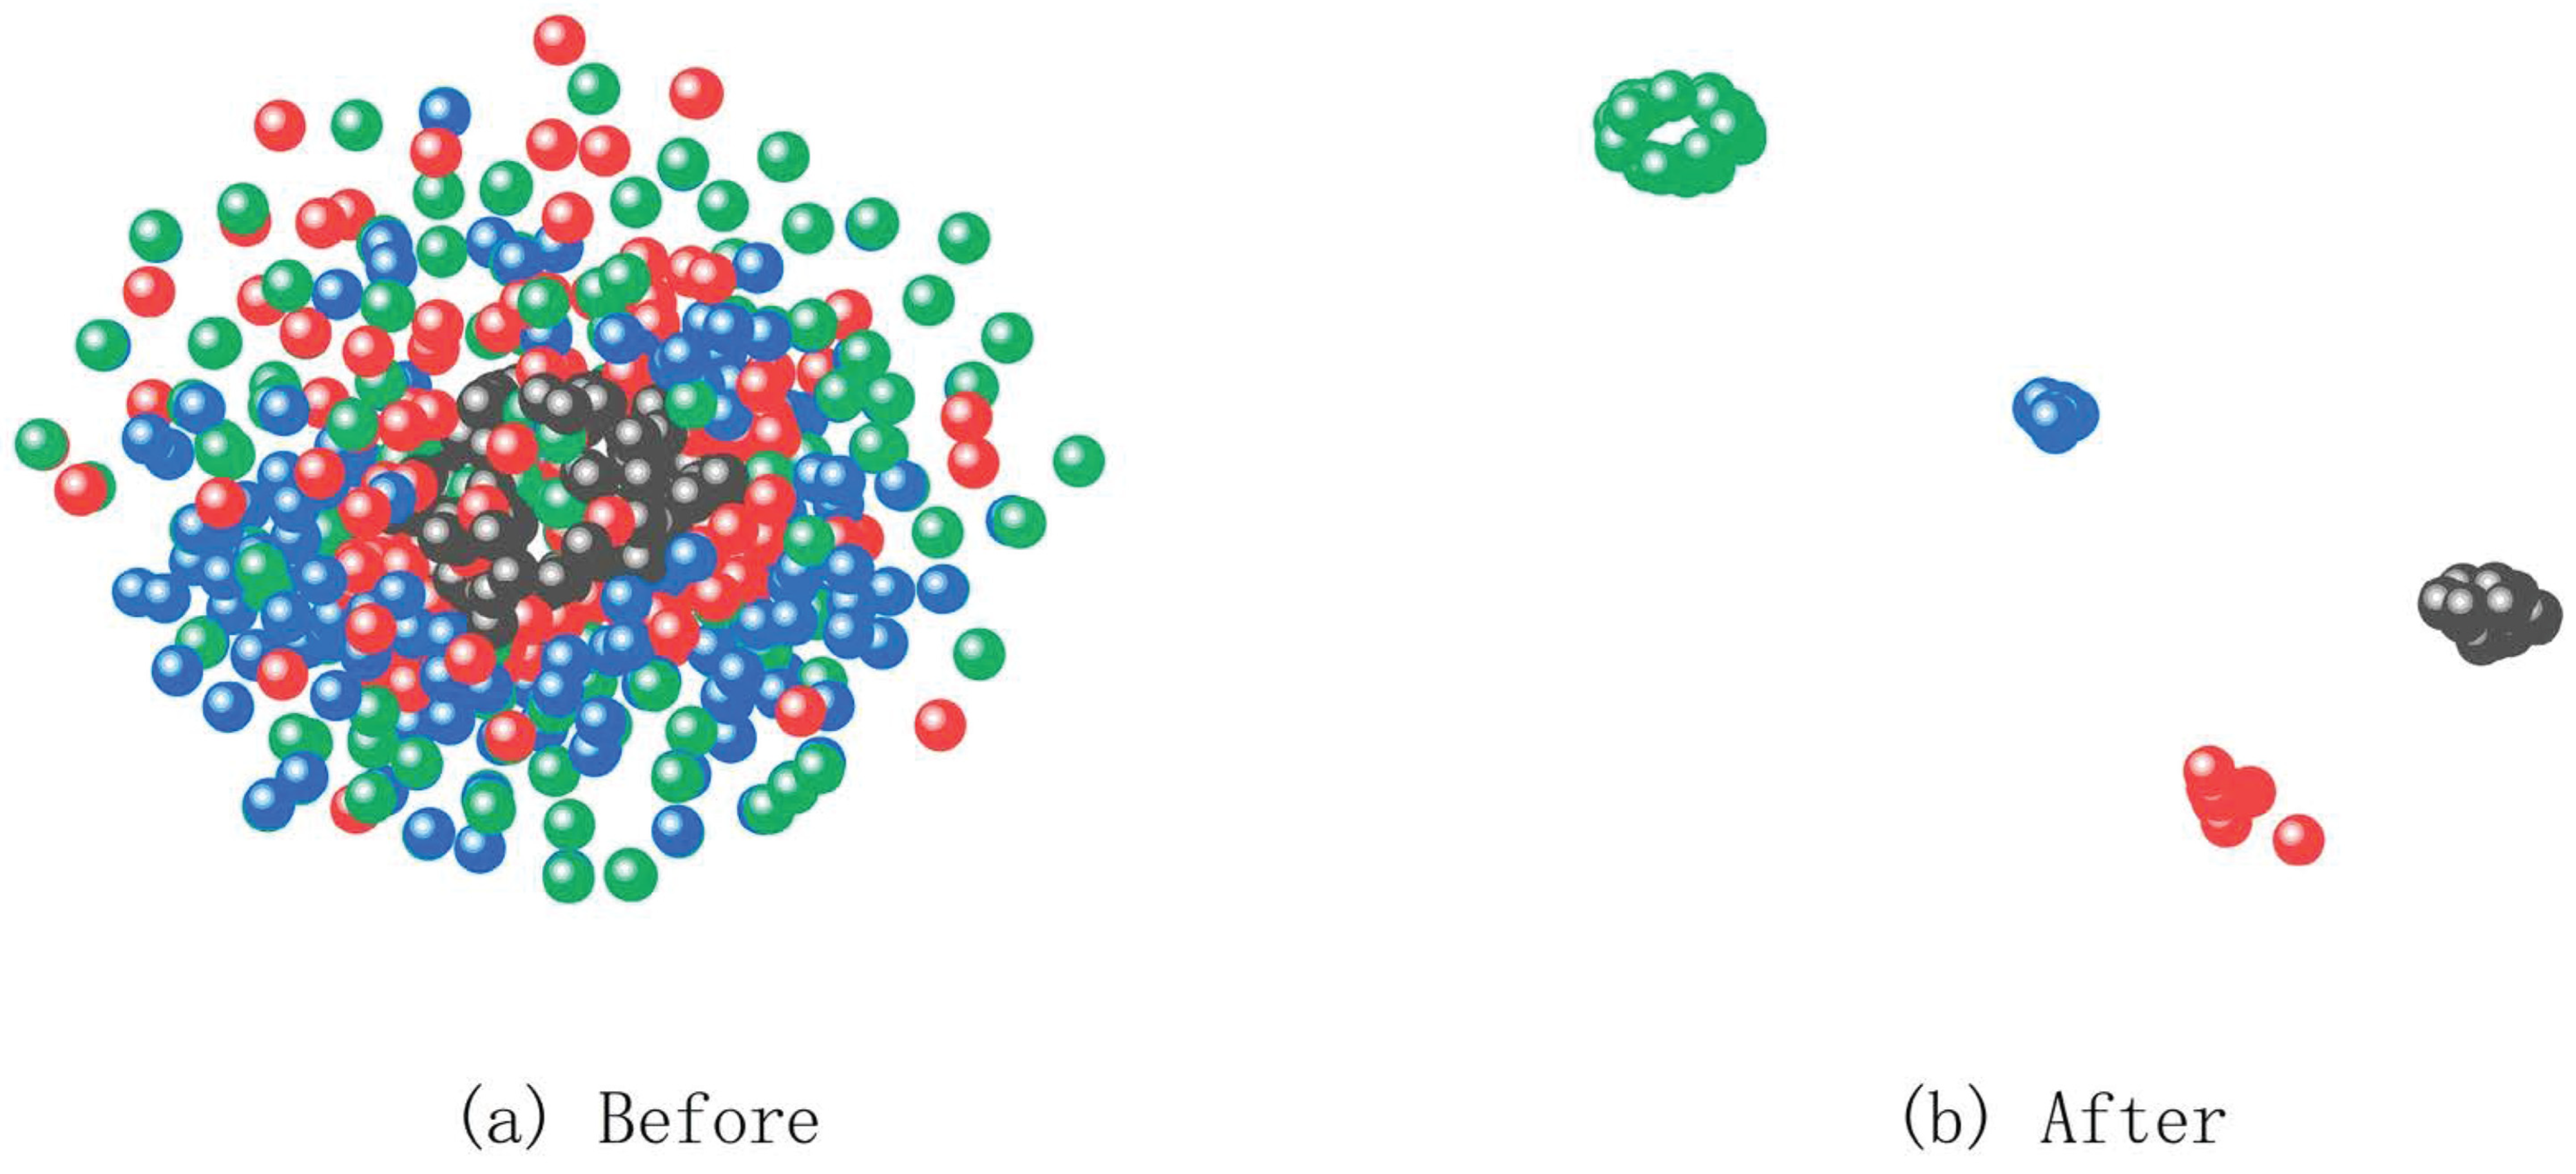
To reveal the intrinsic distribution patterns of coal–rock signals in the high-dimensional feature space, this study employs (t-SNE) t-distributed Stochastic Neighbor Embedding, a nonlinear dimensionality reduction technique, to effectively map and visualize the high-dimensional time-series signal features extracted from the ECA-RepNet model. Specifically, the deep features extracted from the penultimate layer of the network were used for t-SNE visualization, with a perplexity value of 30. The t-SNE method not only accurately projects complex high-dimensional data into a two-dimensional space but also better preserves the local structural information between neighboring samples, thereby facilitating intuitive observation of the distribution characteristics and differentiation effectiveness of each signal category. The detailed classification and visualization results are shown in Figure 11.
From the t-SNE classification results, it can be seen that the original feature map before dimensionality reduction shows obvious color interweaving and chaotic scattering phenomena. As shown in Figure 11a, there is no obvious distinction between different categories of signals, which makes classification difficult and the potential category boundaries unclear. The signal is a feature extracted by the ECA-RepNet model and dimensionality reduced by t-SNE. Figure 11b shows four clearly clustered and hierarchical category areas after classification by the ECA-RepNet model. The distribution is highly concentrated, and the intra-class tightness is significant. The above hierarchical clustering phenomenon shows that the model can not only distinguish between categories with large differences but also maintain strong discrimination performance when facing category feature interweaving. The t-SNE dimensionality reduction and visualization research fully demonstrates the superiority of the ECA-RepNet model in coal–rock signal classification, and verifies that it can effectively capture the complex feature differences between coal and rock categories and achieve high-precision recognition; at the same time, it provides intuitive evidence for the model feature performance, and lays a solid theoretical foundation for real-time monitoring and automatic identification of coal and rock status in the process of intelligent mining in coal mines.
Despite the encouraging results, this study has several limitations. First, the proposed method may experience performance degradation when the vibration signals are heavily contaminated by complex, non-stationary noise commonly encountered in real mining environments. Second, the current model is trained and evaluated on laboratory-scale data, and domain discrepancies between experimental conditions and real underground scenarios may affect generalization performance. In addition, the classification accuracy may decrease when coal–rock interfaces exhibit highly irregular structures or when the cutting state transitions rapidly. These limitations will be addressed in future work by incorporating real mining data, more realistic noise models, and adaptive domain generalization strategies.

5. Conclusions

In this paper, an ECA-RepNet-based coal–rock recognition method is proposed, which incorporates the RP image conversion technique to efficiently convert one-dimensional vibration signals into two-dimensional images and to strengthen the feature expression ability of the temporal signals. By combining the three-stage RepLKBlock architecture with the ECA module, the model further improves the modeling effect of the dependencies between channels. The experimental results show the following:
(1)
ECA-RepNet achieved an accuracy of 97.33% on a self-built dataset, significantly outperforming traditional deep learning models such as ResNet and CNN, and has excellent classification performance.
(2)
The RP conversion technology effectively captures the dynamic characteristics of the vibration signal; at the same time, the three-stage RepLK Block architecture module can optimize channel feature modeling, significantly improving the model’s ability to recognize complex working conditions.
(3)
ECA-RepNet uses lightweight channel attention to optimize feature expression, while maintaining a low number of parameters and faster computing efficiency, significantly enhancing the model’s feature extraction ability and classification performance, providing an efficient solution for vibration signal processing tasks.
Future research will extend this work by incorporating larger-scale datasets and more comprehensive evaluation protocols, aiming to further assess the model’s robustness and applicability in complex industrial environments.

Author Contributions

Conceptualization, J.Z.; Methodology, J.Z., Z.J. and H.W.; Software, H.W. and W.C.; Validation, X.G. and Q.K.; Formal analysis, J.L.; Investigation, Z.L. All authors have read and agreed to the published version of the manuscript.

Funding

This work was supported by the National Natural Science Foundation of China (52404176), Shanxi Basic Research Program (202203021222105), the Shanxi Basic Research Program (202303021212074), and the National Key Laboratory Independent Research Project (ZNCK20240108).

Institutional Review Board Statement

Not applicable.

Informed Consent Statement

Not applicable.

Data Availability Statement

The data that support the findings of this study are available from the corresponding author upon reasonable request.

Conflicts of Interest

Authors Jianping Zhou, Xipeng Gu and Qingyu Kong were employed by Jinneng Holdings Coal Group Wangjialing Coal Company; authors Zhixin Jin, Hongwei Wang, Wenyan Cao, Jianzhong Li and Zeping Liu were employed by the State Key Laboratory of Intelligent Mining Equipment Technology; authors Jianzhong Li and Zeping Liu were employed by Shanxi TZCO Intelligent Mining Equipment Technology Co., Ltd. All the above employment relationships are regular work affiliations for the authors; the funding projects listed are public scientific research programs, and no additional commercial or interest-related conditions were attached to the funding that could affect the objectivity of the study. The remaining authors declare that the research was conducted in the absence of any commercial or financial relationships that could be construed as potential conflicts of interest.

References

  1. Chen, W.; Jie, Z. New advances in automatic shearer cutting technology for thin seams in Chinese underground coal mines. Energy Explor. Exploit. 2022, 40, 3–16. [Google Scholar] [CrossRef] [Scilit]
  2. Zhu, Y.; Wang, P. Research Status and Prospects of Auto-height Adjustment Strategy for Shearer. Min. Metall. Explor. 2024, 41, 1755–1770. [Google Scholar]
  3. Wo, X.; Li, G.; Sun, Y.; Li, J.; Yang, S.; Hao, H. The changing tendency and association analysis of intelligent coal mines in China: A policy text mining study. Sustainability 2022, 14, 11650. [Google Scholar] [CrossRef] [Scilit]
  4. Zhao, Y.; Wang, W. YOLOv8-POS: A lightweight model for coal-rock image recognition. PeerJ Comput. Sci. 2025, 11, E2820. [Google Scholar] [CrossRef] [Scilit]
  5. Ruxin, G.; Yabo, D.; Tengfei, W. Research on coal gangue classification recognition method based on the combination of CNN and SVM. J. Real-Time Image Process. 2023, 20, 110. [Google Scholar] [CrossRef] [Scilit]
  6. Qin, Z.; Jing, J.; Li, L.; Yuan, Y.; Li, Y.; Li, B. Research on image segmentation and defogging technique of coal gangue under the influence of dust gradient. Appl. Sci. 2025, 15, 1947. [Google Scholar] [CrossRef] [Scilit]
  7. Gao, L.; Yu, P.; Dong, H.; Wang, W. Multi-scale fusion lightweight target detection method for coal and gangue based on EMBS-YOLOv8s. Sensors 2025, 25, 1734. [Google Scholar] [CrossRef] [Scilit] [PubMed]
  8. Zhang, K.; Yang, X.; Xu, L.; Thé, J.; Tan, Z.; Yu, H. Enhancing coal-gangue object detection using GAN-based data augmentation strategy with dual attention mechanism. Energy 2024, 287, 129654. [Google Scholar]
  9. Wei, W.; Li, L.; Shi, W.-F.; Liu, J.-P. Ultrasonic imaging recognition of coal-rock interface based on the improved variational mode decomposition. Measurement 2021, 170, 108728. [Google Scholar] [CrossRef] [Scilit]
  10. Ding, Z.W.; Li, X.F.; Huang, X.; Wang, M.B.; Tang, Q.B.; Jia, J.D. Feature extraction, recognition, and classification of acoustic emission waveform signal of coal rock sample under uniaxial compression. Int. J. ROCK Mech. Min. Sci. 2022, 160, 105262. [Google Scholar] [CrossRef] [Scilit]
  11. Chen, X.; Wang, S.; Liu, H.; Yang, J.; Liu, S.; Wang, W. Coal gangue recognition using multichannel auditory spectrogram of hydraulic support sound in convolutional neural network. Meas. Sci. Technol. 2022, 33, 015107. [Google Scholar] [CrossRef] [Scilit]
  12. Jiang, Z.; Meng, T.; Yang, C.; Huang, L.; Liu, H.; Hu, W. Research on the application of THz-TDS in coal–rock interface recognition. Appl. Sci. 2024, 14, 1431. [Google Scholar] [CrossRef] [Scilit]
  13. Chen, G.; Li, Q.X.; Liu, Z.Y.; Chen, L.; Zhang, Y. Detection method of coal-rock interface and low-resistivity anomalous body based on azimuth electromagnetic wave. Appl. Geophys. 2023, 20, 157–166. [Google Scholar] [CrossRef] [Scilit]
  14. Ding, Z.W.; Zhang, C.F.; Huang, X.; Liu, Q.S.; Liu, B.; Gao, F.; Li, L.; Liu, Y.X. Recognition method of coal–rock reflection spectrum using wavelet scattering transform and bidirectional long–short-term memory. Rock Mech. Rock Eng. 2024, 57, 1353–1374. [Google Scholar] [CrossRef] [Scilit]
  15. Eshaq, R.M.A.; Hu, E.; Li, M.; Alfarzaeai, M.S. Separation between coal and gangue based on infrared radiation and visual extraction of the YCbCr color space. IEEE Access 2020, 8, 55204–55220. [Google Scholar] [CrossRef] [Scilit]
  16. Hu, F.; Bian, K. Accurate identification strategy of coal and gangue using infrared imaging technology combined with convolutional neural network. IEEE Access 2022, 10, 8758–8766. [Google Scholar] [CrossRef] [Scilit]
  17. Zhang, Q.; Sun, S.; Zhang, K.; Zhang, X.; Guo, T. Coal and rock interface identification based on active infrared excitation. J. China Coal Soc. 2020, 45, 3363–3370. [Google Scholar]
  18. Qiao, Y.; Su, S.; Qiao, W.; Gao, Y. A multi-module fusion network for coal and rock identification. Measurement 2025, 247, 116861. [Google Scholar] [CrossRef] [Scilit]
  19. Wang, H.; Zhang, Q. Dynamic identification of coal-rock interface based on adaptive weight optimization and multi-sensor information fusion. Inf. Fusion 2019, 51, 114–128. [Google Scholar] [CrossRef] [Scilit]
  20. Si, L.; Xiong, X.; Wang, Z.; Tan, C. A Deep Convolutional Neural Network Model for Intelligent Discrimination between Coal and Rocks in Coal Mining Face. Math. Probl. Eng. 2020, 2020, 2616510. [Google Scholar] [CrossRef] [Scilit]
  21. Xu, S.; Jiang, W.; Liu, Q.; Wang, H.; Zhang, J.; Li, J.; Huang, X.; Bo, Y. Coal-rock interface real-time recognition based on the improved YOLO detection and bilateral segmentation network. Undergr. Space 2025, 21, 22–43. [Google Scholar] [CrossRef] [Scilit]
  22. Sun, C.; Li, X.; Chen, J.; Wu, Z.; Li, Y. Coal-rock image recognition method for complex and harsh environment in coal mine using deep learning models. IEEE Access 2023, 11, 80794–80805. [Google Scholar] [CrossRef] [Scilit]
  23. Liu, Y.; Si, L.; Wang, Z.; Chen, M.; Li, X.; Wei, D.; Gu, J. A novel coal-rock recognition method in coal mining face based on fusing laser point cloud and images. Int. J. Min. Sci. Technol. 2025, 35, 1057–1071. [Google Scholar] [CrossRef] [Scilit]
  24. He, Y.; Li, H.; Hu, M.; Xue, J. Overview of the development of coal rock recognition technology. Ind. Min. Autom. 2023, 49, 1–11. [Google Scholar]
  25. Si, L.; Wang, Z.; Jiang, G. Fusion Recognition of Shearer Coal-Rock Cutting State Based on Improved RBF Neural Network and D-S Evidence Theory. IEEE Access 2019, 7, 122106–122121. [Google Scholar] [CrossRef] [Scilit]
  26. Si, L.; Wang, Z.; Liu, X.; Tan, C.; Liu, Z.; Xu, J. Identification of Shearer Cutting Patterns Using Vibration Signals Based on a Least Squares Support Vector Machine with an Improved Fruit Fly Optimization Algorithm. Sensors 2016, 16, 90. [Google Scholar] [CrossRef] [Scilit]
  27. Yang, Y.; Zeng, Q. Multipoint Acceleration Information Acquisition of the Impact Experiments Between Coal Gangue and the Metal Plate and Coal Gangue Recognition Based on SVM and Serial Splicing Data. Arab. J. Sci. Eng. 2021, 46, 2749–2768. [Google Scholar] [CrossRef] [Scilit]
  28. Zhang, M.; Zhao, L.; Shi, B. Analysis and construction of the coal and rock cutting state identification system in coal mine intelligent mining. Sci. Rep. 2023, 13, 3489. [Google Scholar] [CrossRef] [Scilit]
  29. Li, X.; Chen, H.; Wei, D.; Zou, X.; Wang, Z.; Si, L. Hypergraph Convolution Rebalancing Cascade Broad Learning for Coal-Rock Cutting State Recognition. IEEE Sens. J. 2024, 24, 41753–41766. [Google Scholar]
  30. Jin, Z.; Cheng, J.; Cao, W.; Wang, H.; Zhang, J.; Liu, Z.; Wang, H.; Li, J. ACI-GNN: Lightweight All-Channel Interaction Graph Neural Network for Multi-Sensor Coal-Rock Cutting Recognition. Sensors 2025, 25, 6820. [Google Scholar] [CrossRef] [Scilit] [PubMed]
  31. Wang, H.; Zhang, J.; Cao, W.; Yao, L.; Fang, Z.; Li, C. Interpretable coal-rock cutting vibration recognition with Markov transition field and selective neural networks. Meas. Sci. Technol. 2024, 35, 116114. [Google Scholar] [CrossRef] [Scilit]
  32. Johari, S.; Yaghoobi, M.; Kobravi, H.R. Nonlinear model predictive control based on hyper chaotic diagonal recurrent neural network. J. Cent. South Univ. 2022, 29, 197–208. [Google Scholar] [CrossRef] [Scilit]
  33. Marwan, N.; Romano, M.C.; Thiel, M.; Kurths, J. Recurrence plots for the analysis of complex systems. Phys. Rep. 2007, 438, 237–329. [Google Scholar] [CrossRef] [Scilit]
Figure 1. ECA module structure. Conceptual illustration of the Efficient Channel Attention (ECA) mechanism. The figure illustrates the general principle of modeling local cross-channel interactions, where the convolution kernel size k can be adaptively related to the channel dimension C. In the proposed implementation, a grouped ECA module with a fixed one-dimensional convolution kernel of size 3 is adopted, which balances performance and computational efficiency.
Information 17 00140 g001
Figure 2. ECA-RepNet architecture.
Information 17 00140 g002
Figure 3. Complete structural illustration of the RepLK Block.
Information 17 00140 g003
Figure 4. DSConv module: (a) depthwise convolution module; (b) pointwise convolution module.
Information 17 00140 g004
Figure 5. Experimental cutting platform.
Information 17 00140 g005
Figure 6. Test specimens.
Information 17 00140 g006
Figure 7. Convert vibration signal into RP image: (a) Coal; (b) Coal–Rock; (c) No-Load; (d) Rock.
Information 17 00140 g007
Figure 8. Variations of overall accuracy and loss with an increasing number of epochs.
Information 17 00140 g008
Figure 9. Confusion matrix results of different models: (a) ResNet; (b) CNN; (c) MobileNet; (d) DenseNet; (e) ShuffleNet; (f) ECA-RepNet.
Information 17 00140 g009aInformation 17 00140 g009b
Figure 10. Accuracy under different noise conditions.
Information 17 00140 g010
Figure 11. Comparison of t-SNE before (a) and after (b) classification. The four circles of different colors correspond to four types of samples and their feature distributions.
Information 17 00140 g011
Table 1. Proportion of coal and rock specimens.
Test PieceFull CoalFull Rock
Material proportion4:13:1
Granulated coal/sand: cement
Table 2. Dataset scale and class distribution.
Dataset PartitionCategoryNumber of SamplesTotal Samples per Partition
Training SetCoal175686
Coal–Rock175
No-Load168
Rock168
Validation SetCoal50196
Coal–Rock50
No-Load48
Rock48
Test SetCoal2598
Coal–Rock25
No-Load24
Rock24
Total  980
Table 3. Network architecture and layer-wise configuration.
LayerChannelKernelStridePaddingActivate FunctionBatch NormOutput Size
Input3224 × 224 × 3
Stem Block325 × 522GELU()Yes112 × 112 × 32
RepLK Block (Stage 1)6415 × 1517GELU()Yes112 × 112 × 64
DSConv643 × 3 (DW)11GELU()Yes112 × 112 × 64
ECA 1643 × 1 (1D)Sigmoid()112 × 112 × 64
RepLK Block (Stage 2)12811 × 1125GELU()Yes56 × 56 × 128
DSConv1283 × 3 (DW)11GELU()Yes56 × 56 × 128
ECA 21283 × 1 (1D)Sigmoid()56 × 56 × 128
RepLK Block (Stage 3)2567 × 723GELU()Yes28 × 28 × 256
DSConv2563 × 3 (DW)11GELU()Yes28 × 28 × 256
ECA 32563 × 1 (1D)Sigmoid()28 × 28 × 256
Global Avg Pool1 × 1 × 256
FC 1ReLU()128
FC 2Softmax()4
Table 4. Training and optimization settings.
ItemSetting (Used in This Study)
FrameworkPyTorch
OptimizerAdamW
Initial learning rate3 × 10−4
Optimizer betasβ1 = 0.9, β2 = 0.999
Weight decay0.05
Learning-rate schedulerCosineAnnealingLR (Tmax = 100 epochs)
Batch size32
Training epochs100
Loss functionCross-entropy with label smoothing = 0.1
Batch normalization momentum0.1
Dropout (Conv blocks)Dropout2d = 0.1
Dropout (FC layers)0.6 and 0.3
Gradient clippingmax ‖g‖2 = 1.0
Table 5. Quantitative RP metrics of different operating conditions.
CLASSRRDETENTR
Coal0.320.812.45
Rock0.410.892.10
Coal–Rock0.360.852.72
No-Load0.180.631.95
Table 6. Detailed configurations of comparative baseline models.
ModelCore Configuration
ResNetResNet-18
18 layers (4 residual blocks × 2 layers each)
3 × 3 convolution kernels
final fully connected layer with 4 outputs
batch normalization applied after each convolution
CNNcustom lightweight CNN
3 convolutional layers, 3 × 3 kernels, 16 → 32 → 64 channels
2 max-pooling layers, stride = 2, padding = 1
1 fully connected layer (128 hidden units)
MobileNetMobileNetV2
17 convolution layers
inverted residual blocks with expansion factor 6
1 × 1 pointwise convolution for channel fusion
linear bottleneck structure
DenseNetDenseNet-121;
121 layers;
4 dense blocks, 6 → 12 → 24 → 16 layers each
growth rate = 32
transition layers with compression factor 0.5
global average pooling before classification
ShuffleNetShuffleNetV2;
16 layers; inverted residual blocks
channel shuffle for feature fusion
output channels = 1024 before classification layer
depthwise separable convolution
Table 7. Comparison of specific performance indicators of each model.
ModelAccuracy (%)Params (M)Average Training Time (s/Epoch)Inference Speed (s/Sample)Convergence Epoch
ResNet94.32%2.134.215.4230
CNN84.13%1.583.543.7825
MobileNet93.53%1.233.182.9522
DenseNet95.85%3.585.146.0128
ShuffleNet89.47%1.123.022.8124
ECA-RepNet97.33%2.053.864.1220
Table 8. Class-wise precision, recall, and F1-score of ECA-RepNet on the test set.
ClassPrecisionRecallF1-Score
Coal1.0000.9600.980
Rock0.9601.0000.980
Coal–Rock0.9580.9200.939
No-load0.9601.0000.980
Table 9. Performance results of each module.
Model VariantAccuracy (%)Params (M)
Baseline97.332.05
Remove RepLK Block94.121.98
Remove DSConv95.072.10
Remove ECA Module94.852.03
Remove RepLK Block and ECA Module93.451.96
Remove DSConv and ECA Module94.202.08
Table 10. Ablation experiments for each module.
VariantRepLKConvAttentionParams (M)Inference (s/Sample)Accuracy
(%)
Macro-F1Weighted-F1
Ours (ECA-RepNet)DSConvECA2.054.1297.330.9700.973
w/Standard ConvConvECA2.108.5595.070.9480.951
w/SEDSConvSE2.074.2596.450.9610.964
w/CBAMDSConvCBAM2.094.6896.820.9650.969
Table 11. Model accuracy under different noise conditions.
ModelSNR = 30 dBSNR = 15 dBSNR = 6 dBSNR = 0 dB
ECA-RepNet96.33%94.52%85.67%75.32%
ResNet93.88%90.45%81.72%72.55%
CNN90.89%85.37%75.94%65.83%
MobileNet92.45%88.12%79.55%69.97%
Disclaimer/Publisher’s Note: The statements, opinions and data contained in all publications are solely those of the individual author(s) and contributor(s) and not of MDPI and/or the editor(s). MDPI and/or the editor(s) disclaim responsibility for any injury to people or property resulting from any ideas, methods, instructions or products referred to in the content.