Article

A Gramian Angular Field-Based Convolutional Neural Network Approach for Crack Detection in Low-Power Turbines from Vibration Signals

by
Angel H. Rangel-Rodriguez
1,
Juan P. Amezquita-Sanchez
1,
David Granados-Lieberman
2,
David Camarena-Martinez
3,
Maximiliano Bueno-Lopez
4 and
Martin Valtierra-Rodriguez
1,*
1
ENAP-RG, CA-Sistemas Dinámicos y Control, Facultad de Ingeniería, Universidad Autónoma de Querétaro, Campus San Juan del Río, San Juan del Río 76806, Querétaro, Mexico
2
ENAP-RG, Departamento de Ingeniería Electromecánica, Tecnológico Nacional de México, Instituto Tecnológico Superior de Irapuato, Irapuato 36821, Guanajuato, Mexico
3
ENAP-RG, División de Ingenierías, Universidad de Guanajuato, Campus Irapuato-Salamanca, Salamanca 36885, Guanajuato, Mexico
4
Programa de Tecnología Eléctrica, Universidad Tecnológica de Pereira, Pereira 660003, Colombia
*
Author to whom correspondence should be addressed.
Information 2025, 16(9), 775; https://doi.org/10.3390/info16090775
Submission received: 22 June 2025 / Revised: 29 August 2025 / Accepted: 5 September 2025 / Published: 6 September 2025
(This article belongs to the Special Issue Signal Processing Based on Machine Learning Techniques)

Abstract

The detection of damage in wind turbine blades is critical for ensuring their operational efficiency and longevity. This study presents a novel method for wind turbine blade damage detection, utilizing Gramian Angular Field (GAF) transformations of vibration signals in combination with Convolutional Neural Networks (CNNs). The GAF method enables the transformation of vibration signals, which are captured using a triaxial accelerometer, into angular representations that preserve temporal dependencies and reveal distinctive texture patterns that can be associated with structural damage. This transformation facilitates the capability of CNNs to identify complex features correlated with crack severity in wind turbine blades, thereby enhancing the precision and effectiveness of turbine fault diagnosis. The GAF-CNN model achieved a notable classification accuracy over 99.9%, demonstrating its robustness and potential for automated damage detection. Unlike traditional methods, which rely on expert interpretation and are sensitive to noise, the proposed system offers a more efficient and precise tool for damage monitoring. The findings suggest that this method can significantly enhance wind turbine condition monitoring systems, offering reduced dependency on manual inspections and improving early detection capabilities.

1. Introduction

Wind energy has experienced significant growth in recent decades, particularly in the development of small-scale wind turbines for decentralized energy generation. However, the efficiency and operational lifespan of these turbines are directly influenced by structural integrity issues, notably blade fissures [1,2]. Aerodynamic stresses, environmental conditions, and cyclic loads can lead to the formation and propagation of cracks, compromising performance and safety [3]. Traditional damage detection techniques rely on periodic inspections and vibration-based monitoring, utilizing time-domain and frequency-domain analyses. While traditional damage detection methods are effective, they often require expert interpretation and are sensitive to noise and operational variations. Recent advancements in computational techniques, particularly machine learning and signal transformation methods, have opened new possibilities for more robust and automated damage detection systems [4,5,6].
Several studies have explored advanced signal processing and machine learning techniques for damage detection in wind turbine blades. Among signal processing approaches, Aranizadeh et al. [7] introduced a method based on frequency domain analysis using power spectral density (PSD) to detect faults in small-scale wind turbine blades. Their approach includes digital filtering and classification of structural conditions by comparing frequency components, emphasizing the superior performance of strain sensors over accelerometers, particularly for identifying torsional mode faults. Similarly, Chandrasekhar et al. [4] investigated the application of machine learning algorithms for detecting damage in operational wind turbine blades, demonstrating improved detection accuracy compared to traditional techniques. Raju et al. [8] presented a machine learning-based strategy to enhance wind turbine efficiency through intelligent fault detection and optimized turbine placement. Chenchen et al. [9] developed a precise and non-invasive approach for damage detection by analyzing acoustic signals using deep neural networks combined with advanced noise reduction techniques. Ogaili et al. [10] addressed the detection of multiple blade faults using classifiers such as k-nearest neighbors (KNNs), support vector machines (SVMs), and random forests, trained on vibration signal data. To improve model performance, they applied feature selection techniques including ReliefF, chi-square tests, and information gain. Catedra et al. [11] proposed a methodology combining fault trees and binary decision diagrams (FT–BDD) to evaluate the dynamic reliability of wind turbines and prioritize maintenance actions. While traditional machine learning approaches require manual feature selection, deep learning methods can automatically extract features directly from raw data, such as images. For example, Xiao et al. [12] employed UAV-acquired imagery to detect blade cracks using a deep learning-based image recognition model called Multivariate Information You Only Look Once (MI-YOLO). Gou et al. [13] advanced this further by combining deep convolutional neural networks (CNNs) with an AdaBoost cascade classifier, improving detection through hierarchical decision-making. Additionally, Memari et al. [14] conducted a comprehensive review on the integration of deep learning and UAV technologies for wind turbine blade inspection, highlighting the growing trend toward autonomous, data-driven monitoring systems. In addition to the aforementioned approaches, several studies, beyond the field of wind turbines, have proposed alternative strategies for transforming temporal signals into images to facilitate pattern recognition with neural networks. For instance, Short-Time Fourier Transform (STFT) has been successfully applied in fault detection tasks for electric motors, including prior work by the authors involving motor current signal analysis during transient states [15].
While these methods have shown promising results, the image generation process can be computationally intensive and often requires complex preprocessing steps to achieve meaningful representations. This complexity poses challenges for real-time monitoring systems or low-resource environments. Consequently, there is a growing interest in signal transformation techniques that can efficiently produce informative image representations while preserving essential temporal characteristics. One such method is the Gramian Angular Field (GAF), which enables the visualization of time-series data as structured images well-suited for deep learning-based classification. In the generation of images from time-series signals, various transformation methods have been proposed, for instance the STFT [15]. However, GAF stands out for its ability to move beyond classical frequency-based analysis, offering better results when dealing with cyclic data. This method preserves the temporal structure of signals, enabling more effective feature extraction for classification tasks. Zhang et al. [16] applied GAF-based imaging techniques combined with an improved convolutional neural network for fault detection in transmission lines. Similarly, Zhou et al. [17] performed bearing failure diagnosis using GAF and DenseNet through transfer learning. While these approaches have shown promise, there remains a need for a comprehensive methodology that effectively integrates GAF imaging with neural networks for fine-grained. The application of GAF to transform vibration signals into images presents a promising approach for detecting fissures in wind turbine blades. This method also facilitates the use of CNNs for effective classification [18].
This study presents a novel approach for wind turbine blade damage detection by leveraging vibration signals transformed into images through the GAF technique and analyzed using a single-layer hidden CNN. Unlike previous works focused on binary classification or conventional time-frequency methods, our approach enables multi-class classification across four damage severity levels: healthy, light, intermediate, and severe. The model is trained and tested using GAF images derived from all the vibration axes (x, y, and z) captured at two representative rotational speeds, i.e., 3 rps (start-up speed) and 12 rps (maximum operating speed), which allows the system to account for dynamic variations in turbine behavior. GAF plays a critical role by preserving the temporal dependencies and amplifying structural patterns within the signal, thus enabling the CNN to extract more meaningful spatial features for damage characterization. The proposed method achieved a classification accuracy of 99.9%, offering a robust and scalable solution for condition monitoring in wind turbines. This performance highlights its potential to outperform traditional approaches by minimizing reliance on expert interpretation and enhancing early detection capabilities.

2. Theoretical Background

The following section covers key topics essential for understanding the performance of this work, including wind turbines and the methods employed for analyzing vibration signals, i.e., GAF and CNN.

2.1. Wind Turbine (WT)

A wind turbine functions by transforming the kinetic energy of wind into electrical power. Among the various design configurations, the horizontal-axis wind turbine (HAWT) is predominantly employed due to its superior efficiency and high energy output potential. In this design, the rotor’s axis of rotation is aligned parallel to the ground [19]. HAWTs typically feature a rotating shaft positioned at the top of the tower and incorporate a yaw mechanism to continuously align with changes in wind direction. The primary components of this system include the rotor blades, responsible for power generation, and the hub. However, these blades can become unbalanced due to various factors, such as manufacturing or installation imperfections, interactions with wildlife, ice accumulation, and other environmental variables.
Vibration signals are extensively utilized for monitoring the operational condition of wind turbines. Through signal processing techniques, various faults, including structural imbalances and material degradation, can be identified. Consequently, a thorough analysis of the characteristic features of vibration signals is essential as a preliminary step in fault diagnosis [20].
The passage of the blades near the wind turbine tower induces vibrations, referred to as the tower effect. This phenomenon is commonly represented in vibration models and is mathematically described as follows [21]:
v t = m = 1 M A m s i n m ω t + φ m + n = 1 N A n sin 3 n ω t + φ n
The first term corresponds to the imbalance of the rotating components, while the second term represents the impact generated by the tower. A m and A n are the amplitude φ m and φ n of the vibrations generated in the rotor and tower effects, respectively.

2.2. Gramian Angular Field

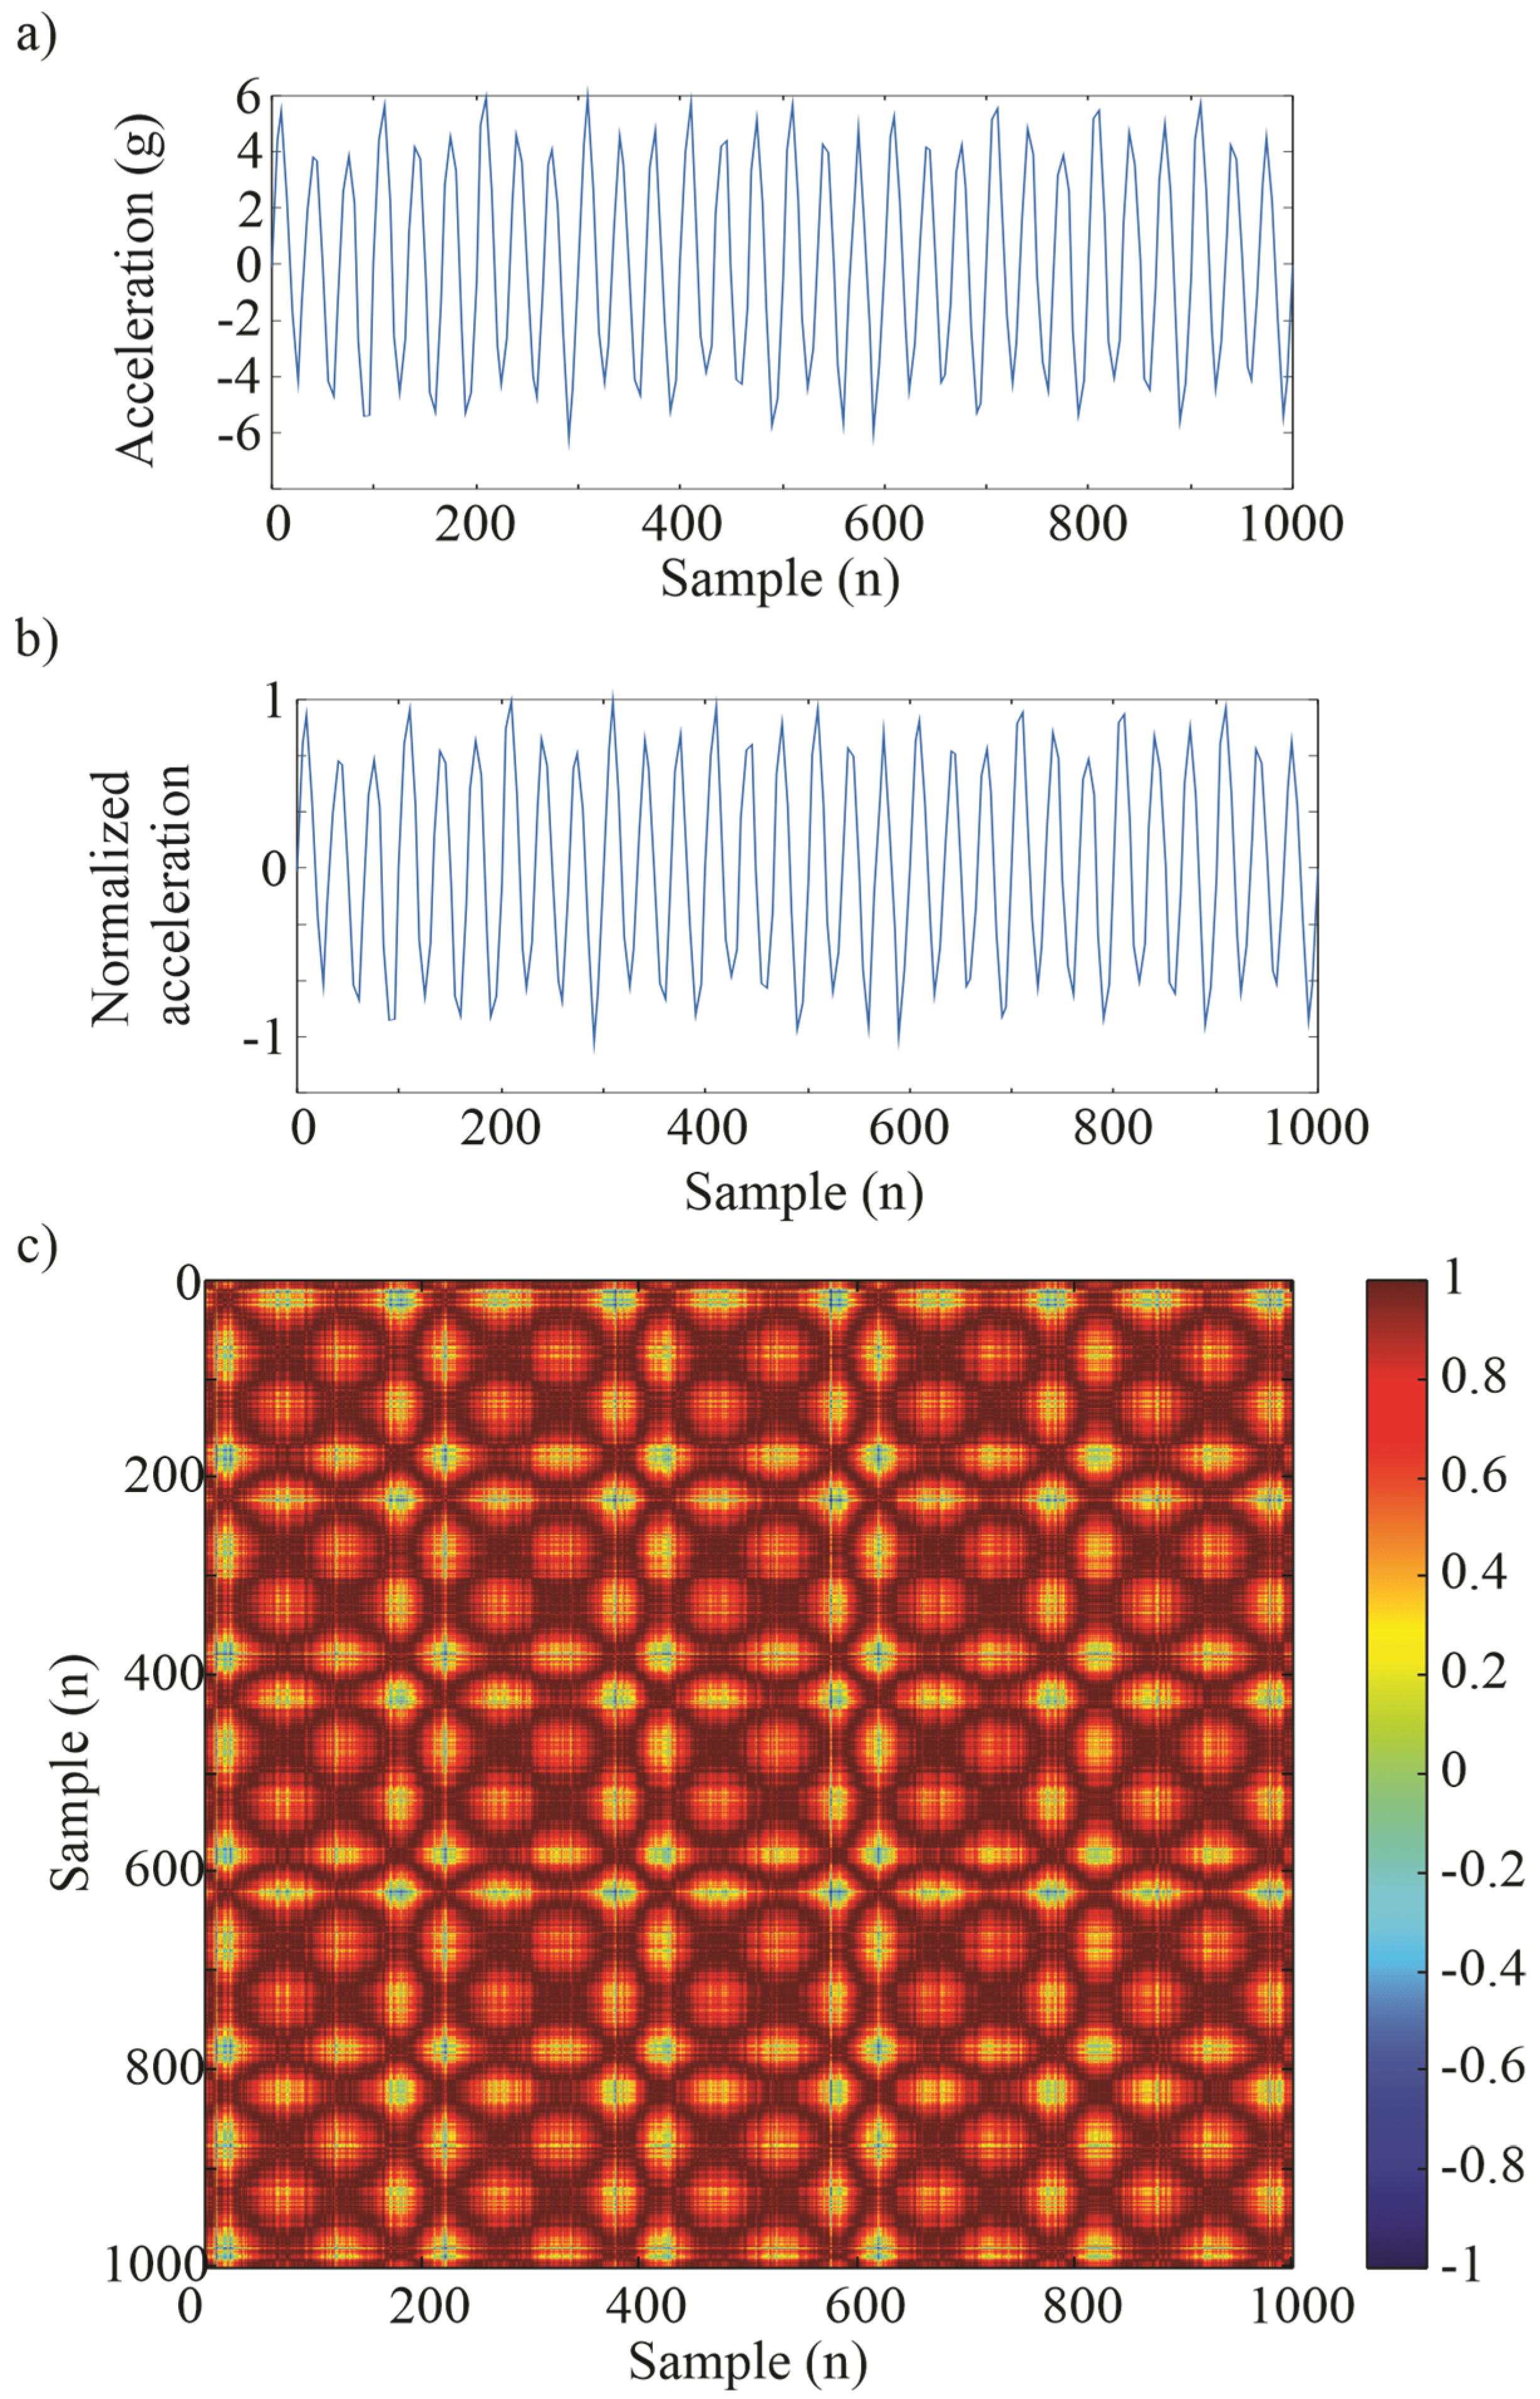
GAF is a technique that enables the transformation of temporal signals into two-dimensional image representations, making it particularly suitable for use with CNNs. This approach facilitates the extraction of spatial features from time-series data, enhancing pattern recognition and classification performance. Figure 1 illustrates the transformation process step by step: (a) the original vibration signal, (b) the normalized signal, and (c) the resulting GAF image.
This method has proven to be effective in detecting failures in mechanical components, such as bearings, by transforming vibration signals into heat maps that reflect complex temporal patterns [22].
Imaging from temporal signals using GAF involves two main steps: normalization of the signal and conversion of the normalized signal to an angular representation.

2.2.1. Signal Normalization

Given a Temporal Signal Vector X =   x 1 , x 2 , , x n , it is normalized using the formula:
X n o r m = X μ X σ X
where μ X is the average of the signal and σ X is the standard deviation of the signal. This normalization ensures that the signal values are in a standard range and improves the stability of the downstream process.

2.2.2. Conversion to Angular Representation

Once the signal has been normalized, the angular representation is obtained using the formula:
θ i = cos 1 X n o r m , i X n o r m
where X n o r m , i is the normalized value of the signal at the time i , and X n o r m is the standard of the standard signal (or its magnitude), which is calculated as:
X n o r m = i = 1 n x n o r m , i 2
Finally, the GAF is generated by calculating the product point between the angular representations of the normalized signals. GAF’s G matrix is defined as:
G i j = cos θ i θ j
where θ i and θ j are the angular representations of points i and j in the normalized sign. This product creates a symmetrical G-image, which captures the temporal correlations between different points of the signal.

2.3. Convolutional Neural Networks

CNNs are a class of deep neural networks modeled after the principles of visual perception. Since their introduction in the early 2000s, CNNs have demonstrated exceptional performance in tasks such as object detection, image segmentation, and region identification. These networks are specifically designed to process structured information efficiently [23]. Compared to traditional machine learning algorithms, CNNs offer several advantages, including robust automatic feature extraction, enhanced representational capacity, and architectural components that mitigate overfitting, such as deep hierarchical structures, nonlinear layers, pooling operations, and dropout mechanisms. Additionally, weight sharing reduces the total number of parameters, leading to a more efficient optimization process.
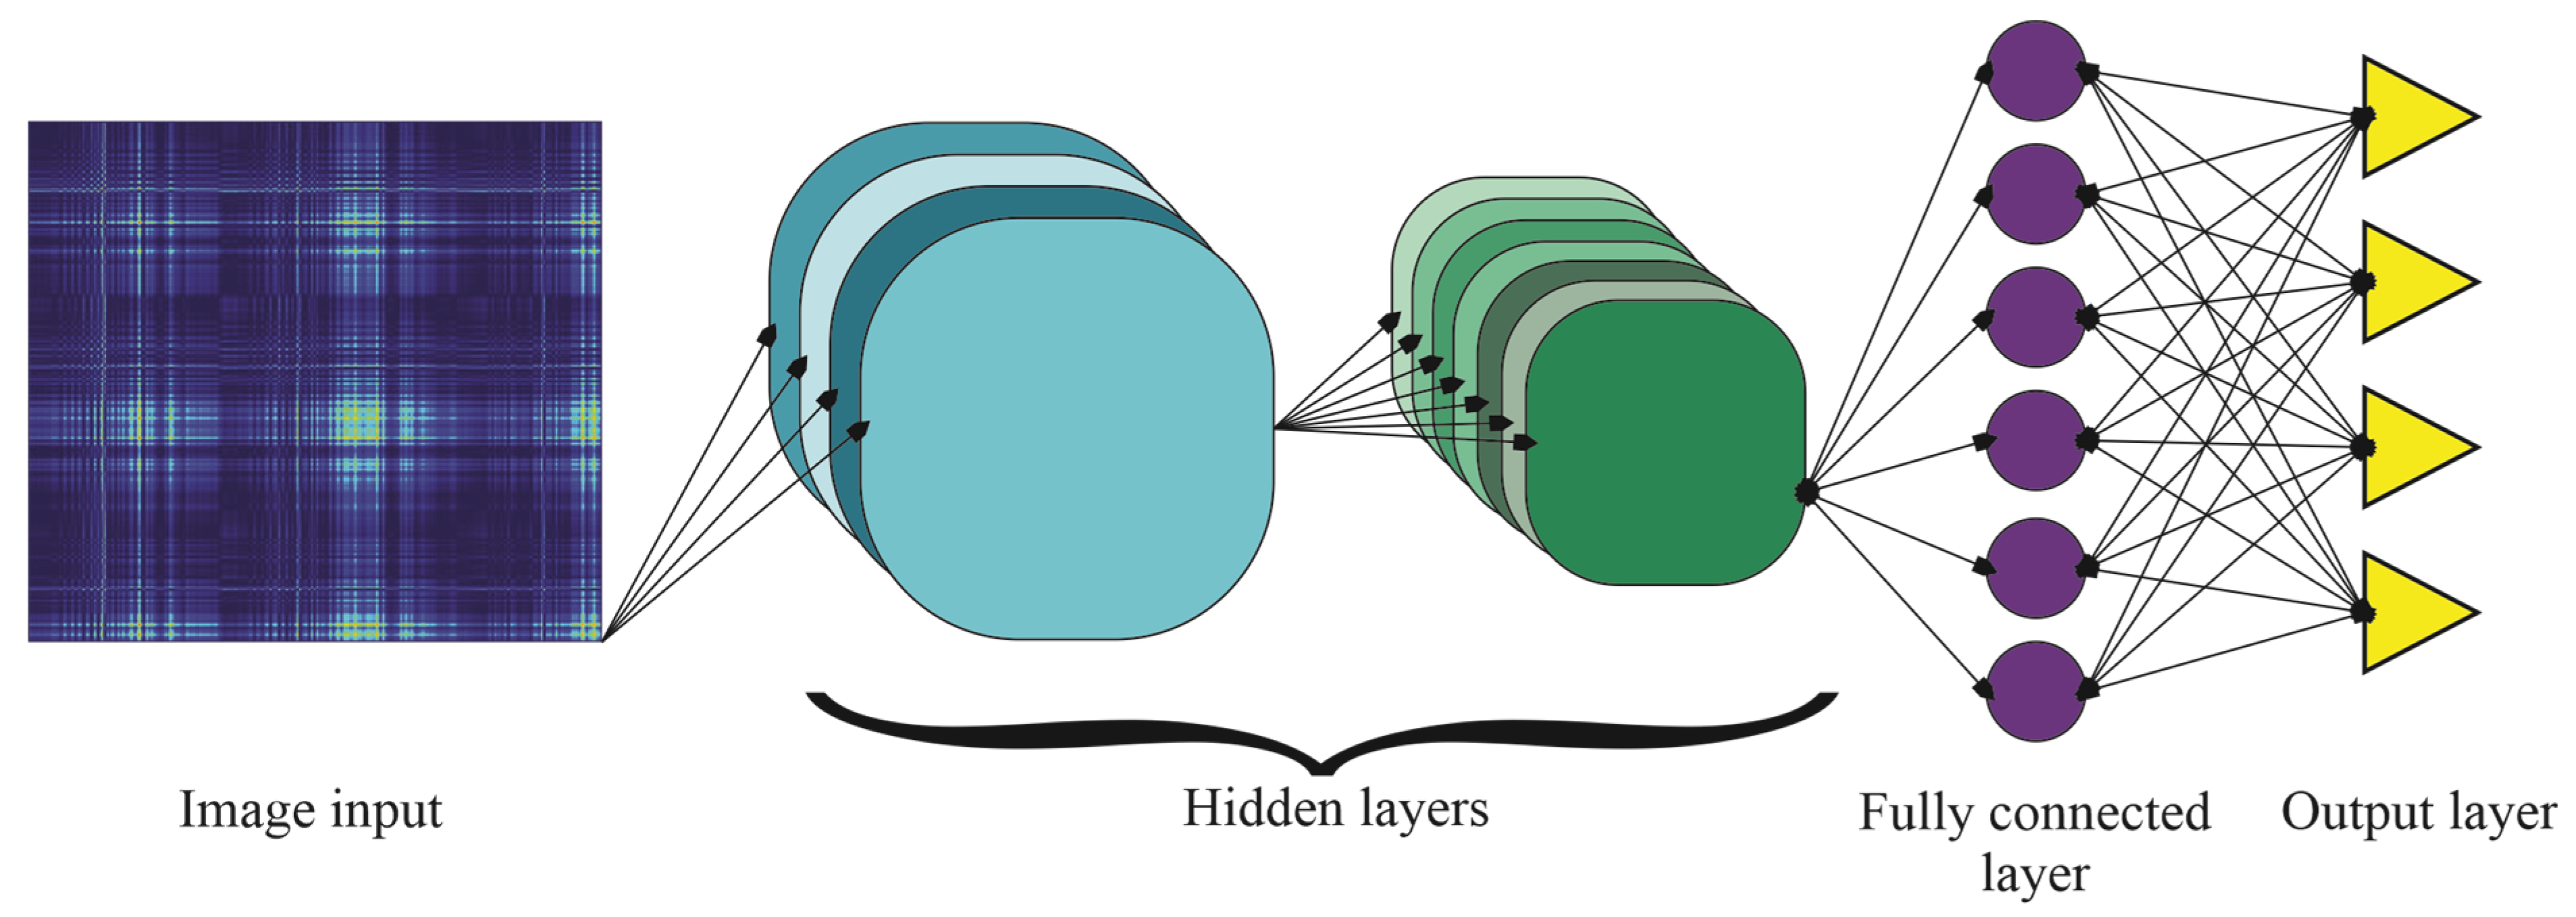
As illustrated in Figure 2, a CNN processes input images, such as those generated through the GAF transformation, through a sequence of layers designed to extract hierarchical features. The initial stage consists of convolutional layers, where a set of filters, denoted as w (also referred to as kernels), perform convolutions over the input image x to produce feature maps. Each filter shares weights across the input space and includes a bias term b , with the output passing through an activation function f . The collection of resulting feature maps is then processed by pooling layers and passed to fully connected layers, which are responsible for the final classification task. This layered architecture enables the CNN to learn increasingly abstract representations relevant to structural damage detection [21,24]. This process can be mathematically expressed as follows:
y = f w x + b

3. Methodology

The objective of this study is to assess the effectiveness of a novel methodology that combines GAF transformations with CNNs for the automatic detection of cracks in wind turbine blades. The proposed system is evaluated under four severity levels (healthy, light, intermediate, and severe) of crack damage on blade, as illustrated in Figure 3. The methodological framework employed is detailed below.

3.1. Vibration Data Collection

Vibration signals were acquired from a wind turbine using a triaxial accelerometer mounted at the top of the nacelle, enabling the capture of structural responses along the X, Y, and Z axes. The use of all three axes provides a more complete characterization of the turbine’s dynamic behavior under different loading conditions. Data was collected under four predefined damage conditions: healthy, light, intermediate, and severe, which reflect increasing levels of structural degradation and allow for a thorough evaluation of the proposed method’s sensitivity. Measurements were conducted at two rotational speeds: 3 revolutions per second (rps), corresponding to the turbine’s minimum start-up speed, and 12 rps, which represents its maximum steady-state operating speed. These two operating points were selected to capture the system’s vibrational behavior under both low and high dynamic loads, ensuring robustness of the approach across different real-world scenarios.

3.2. Transforming Signals into Images with GAF

The vibration signals were transformed into images using the GAF technique, applied separately for each axis (X, Y, Z) and for each rotational speed (3 rps and 12 rps), without combining them. This approach preserves the temporal structure of the signals and generates distinctive texture patterns that facilitate the visual representation of dynamic behaviors associated with structural damage. By converting time-series data into two-dimensional images, GAF enables the use of image-based deep learning models, such as CNNs, to effectively extract spatial features correlated with crack severity, thereby enhancing the interpretability and diagnostic power of the system. For each test case, vibration signals were segmented into windows containing 1200 samples at a 10,000 Hz sampling rate, resulting in GAF images with a fixed resolution of 879 × 600 pixels. These images, which preserved the original color mapping from the GAF transformation, were fed directly into the CNN without resizing, maintaining the full spatial information derived from the vibration signals. In total, 1000 signals were acquired for each class (healthy, light, intermediate, and severe) at each operating speed (3 rps and 12 rps) for each axis, corresponding to 4000 images per axis per speed and a total of 24,000 images in the complete dataset.

3.3. Classification with Convolutional Neural Networks

The images generated from the vibration signals were used as input for a CNN. The CNN model was trained to classify images into four severities: healthy, light, intermediate and severe. The model was trained with a classical distribution of 70% for training, 15% for validation, and 15% for testing.

4. Results

4.1. Experimental Setup

The experimental setup consists of a low-power wind turbine Air X model rated at 12 V and 400 W. To avoid external disturbances from the wind tunnel, the WT was mounted on an independent base firmly fixed to the ground. Vibration signals were captured using a KISTLER 8395A10 triaxial accelerometer mounted on the turbine nacelle and acquired through a National Instruments USB-6211 data acquisition board at a sampling rate of 10,000 Hz. Data collection and processing were conducted using MATLAB 2024a on a computer equipped with a 2.10 GHz CPU, 32 GB RAM, and a 64-bit operating system.
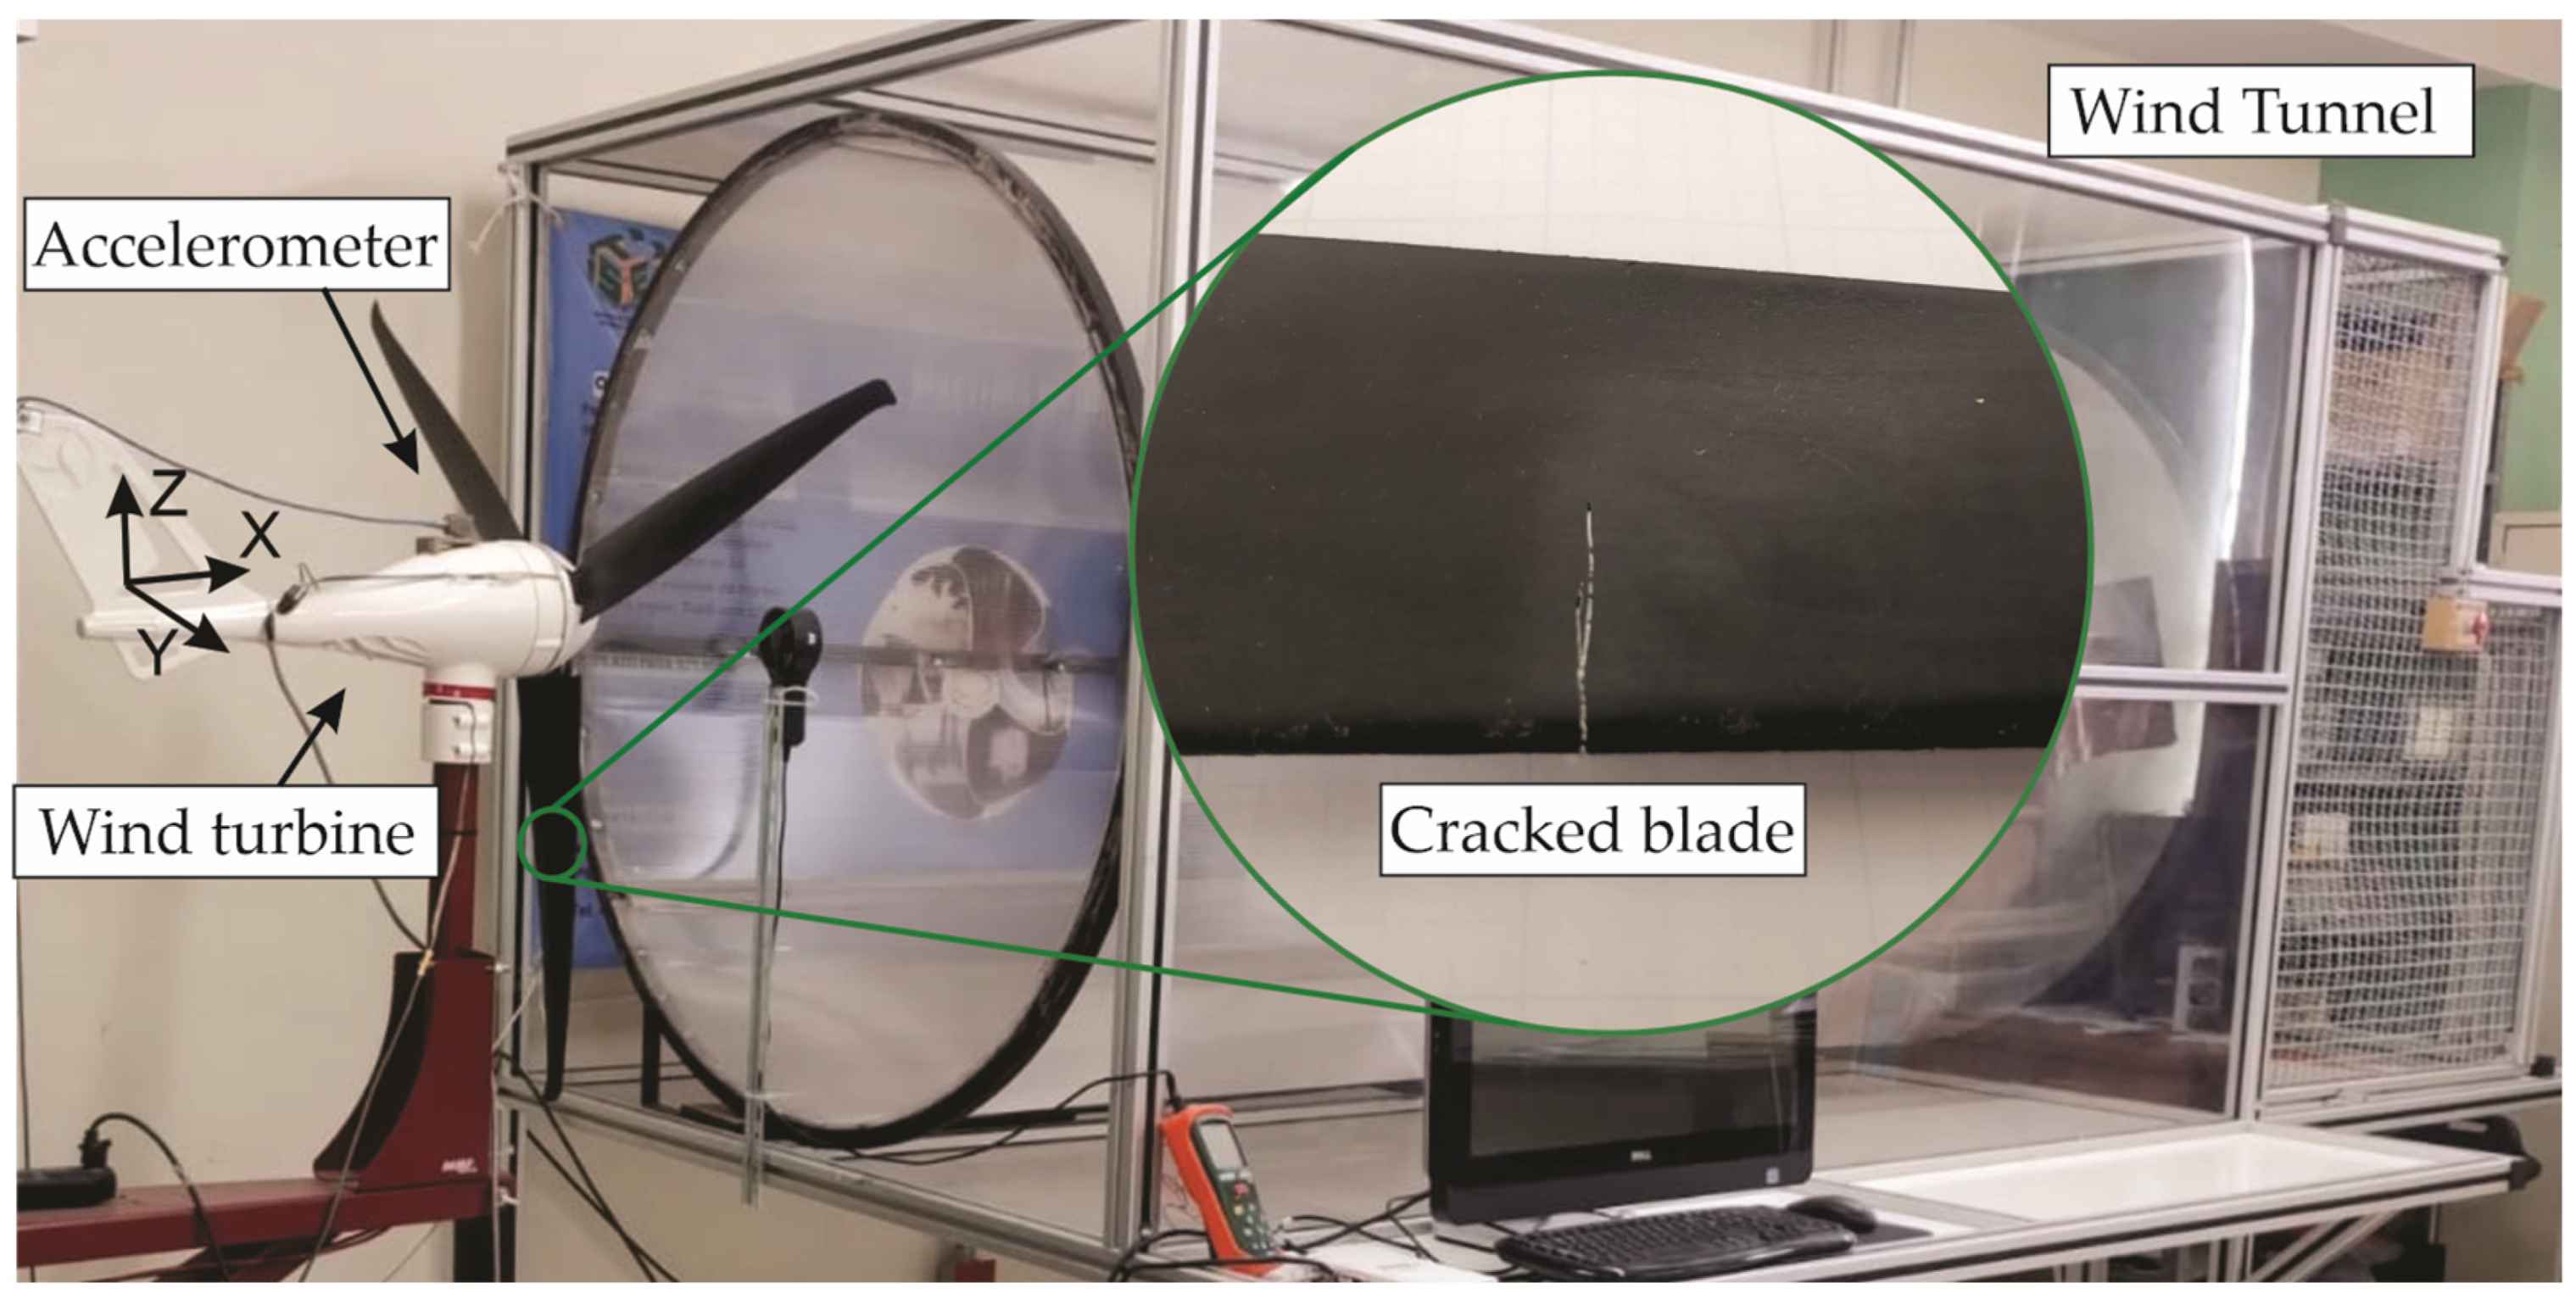
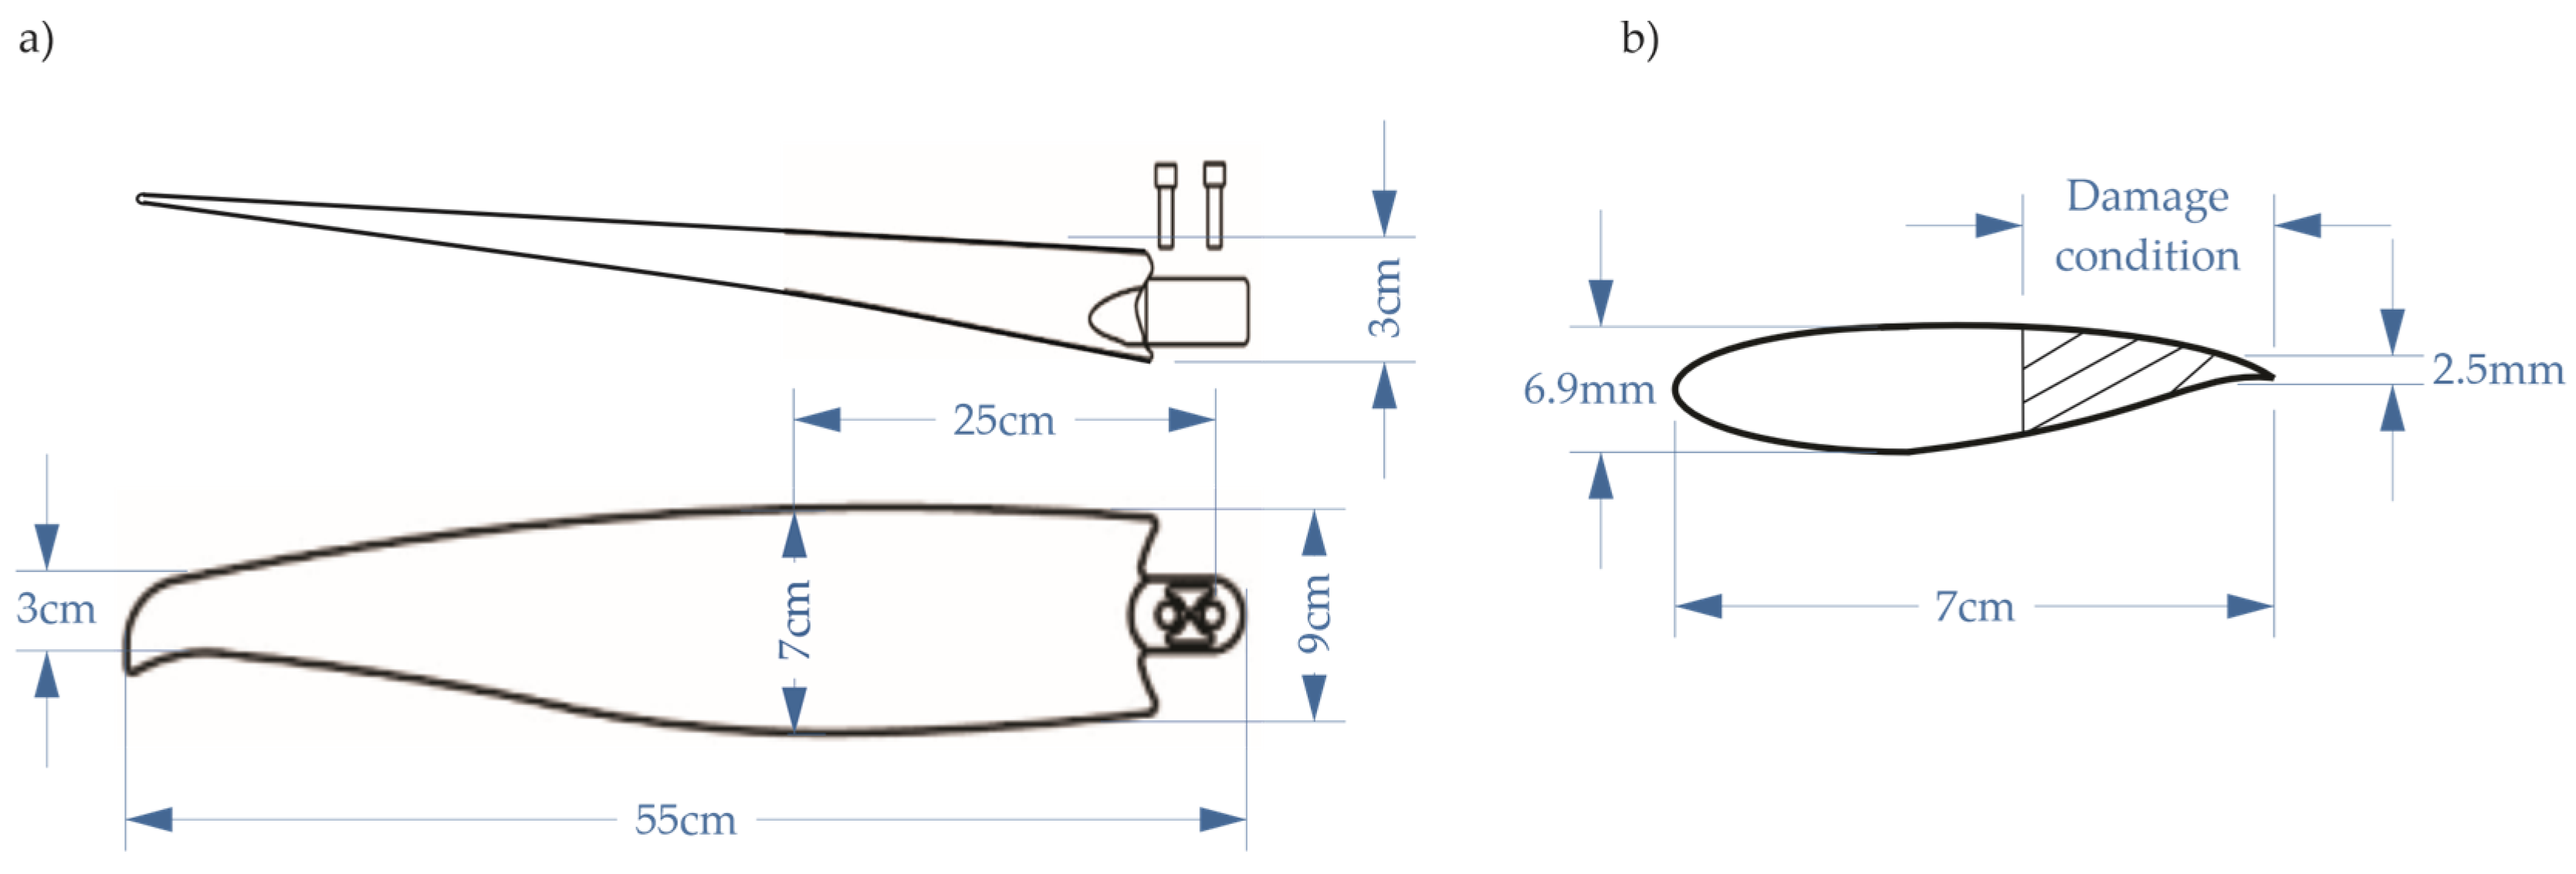
The damage conditions analyzed in this study were defined by the progressive development of a crack in one of the WT blades. Four severity levels were considered: healthy, light, intermediate, and severe. Each damaged condition corresponds to an incremental increase of 1 cm in crack length, specifically: 1 cm for light, 2 cm for intermediate, and 3 cm for severe. Figure 4 illustrates the complete experimental setup, highlighting the location of the crack on the blade. The wind turbine blades are made of homogeneous carbon fiber composite, with a length of 55 cm. The blade width decreases from 9 cm at the root to 3 cm at the tip. Cracks were introduced at a mid-span location, 25 cm from the hub, corresponding to a zone with reduced thickness and higher susceptibility to damage. The cuts were performed using a jeweler’s saw with a thick blade of less than 0.5 mm, ensuring precise and repeatable dimensions. Three severities were considered, defined by cuts corresponding to 14.3%, 28.6%, and 42.9% of the relative thickness at that location, which translated into crack lengths of 1 cm, 2 cm, and 3 cm. This configuration was selected to reflect increasing damage levels while maintaining structural integrity for testing.
The progression of the crack was carefully monitored and documented to ensure that the severity levels were consistent throughout the experiment. This incremental approach allowed for the detailed analysis of vibration signals at varying stages of damage, providing insight into how the crack’s advancement influences the vibration characteristics of the wind turbine blade. Figure 5 shows a dimensioned drawing of the blade, where (a) the blade plane and (b) the cross-section of the blade around the damaged area are illustrated. Likewise, experimental tests were conducted by placing a 0.5 kg mass at the tip of the blade under both healthy and severe conditions. A deflection difference of 0.01 m was obtained, indicating a minimal impact on the bending stiffness between the severe and healthy conditions, particularly considering that the wind load on the blade during the tests was lower. To provide more comprehensive information in the near future, a numerical analysis using the finite element method will be carried out.

4.2. Vibration Signals

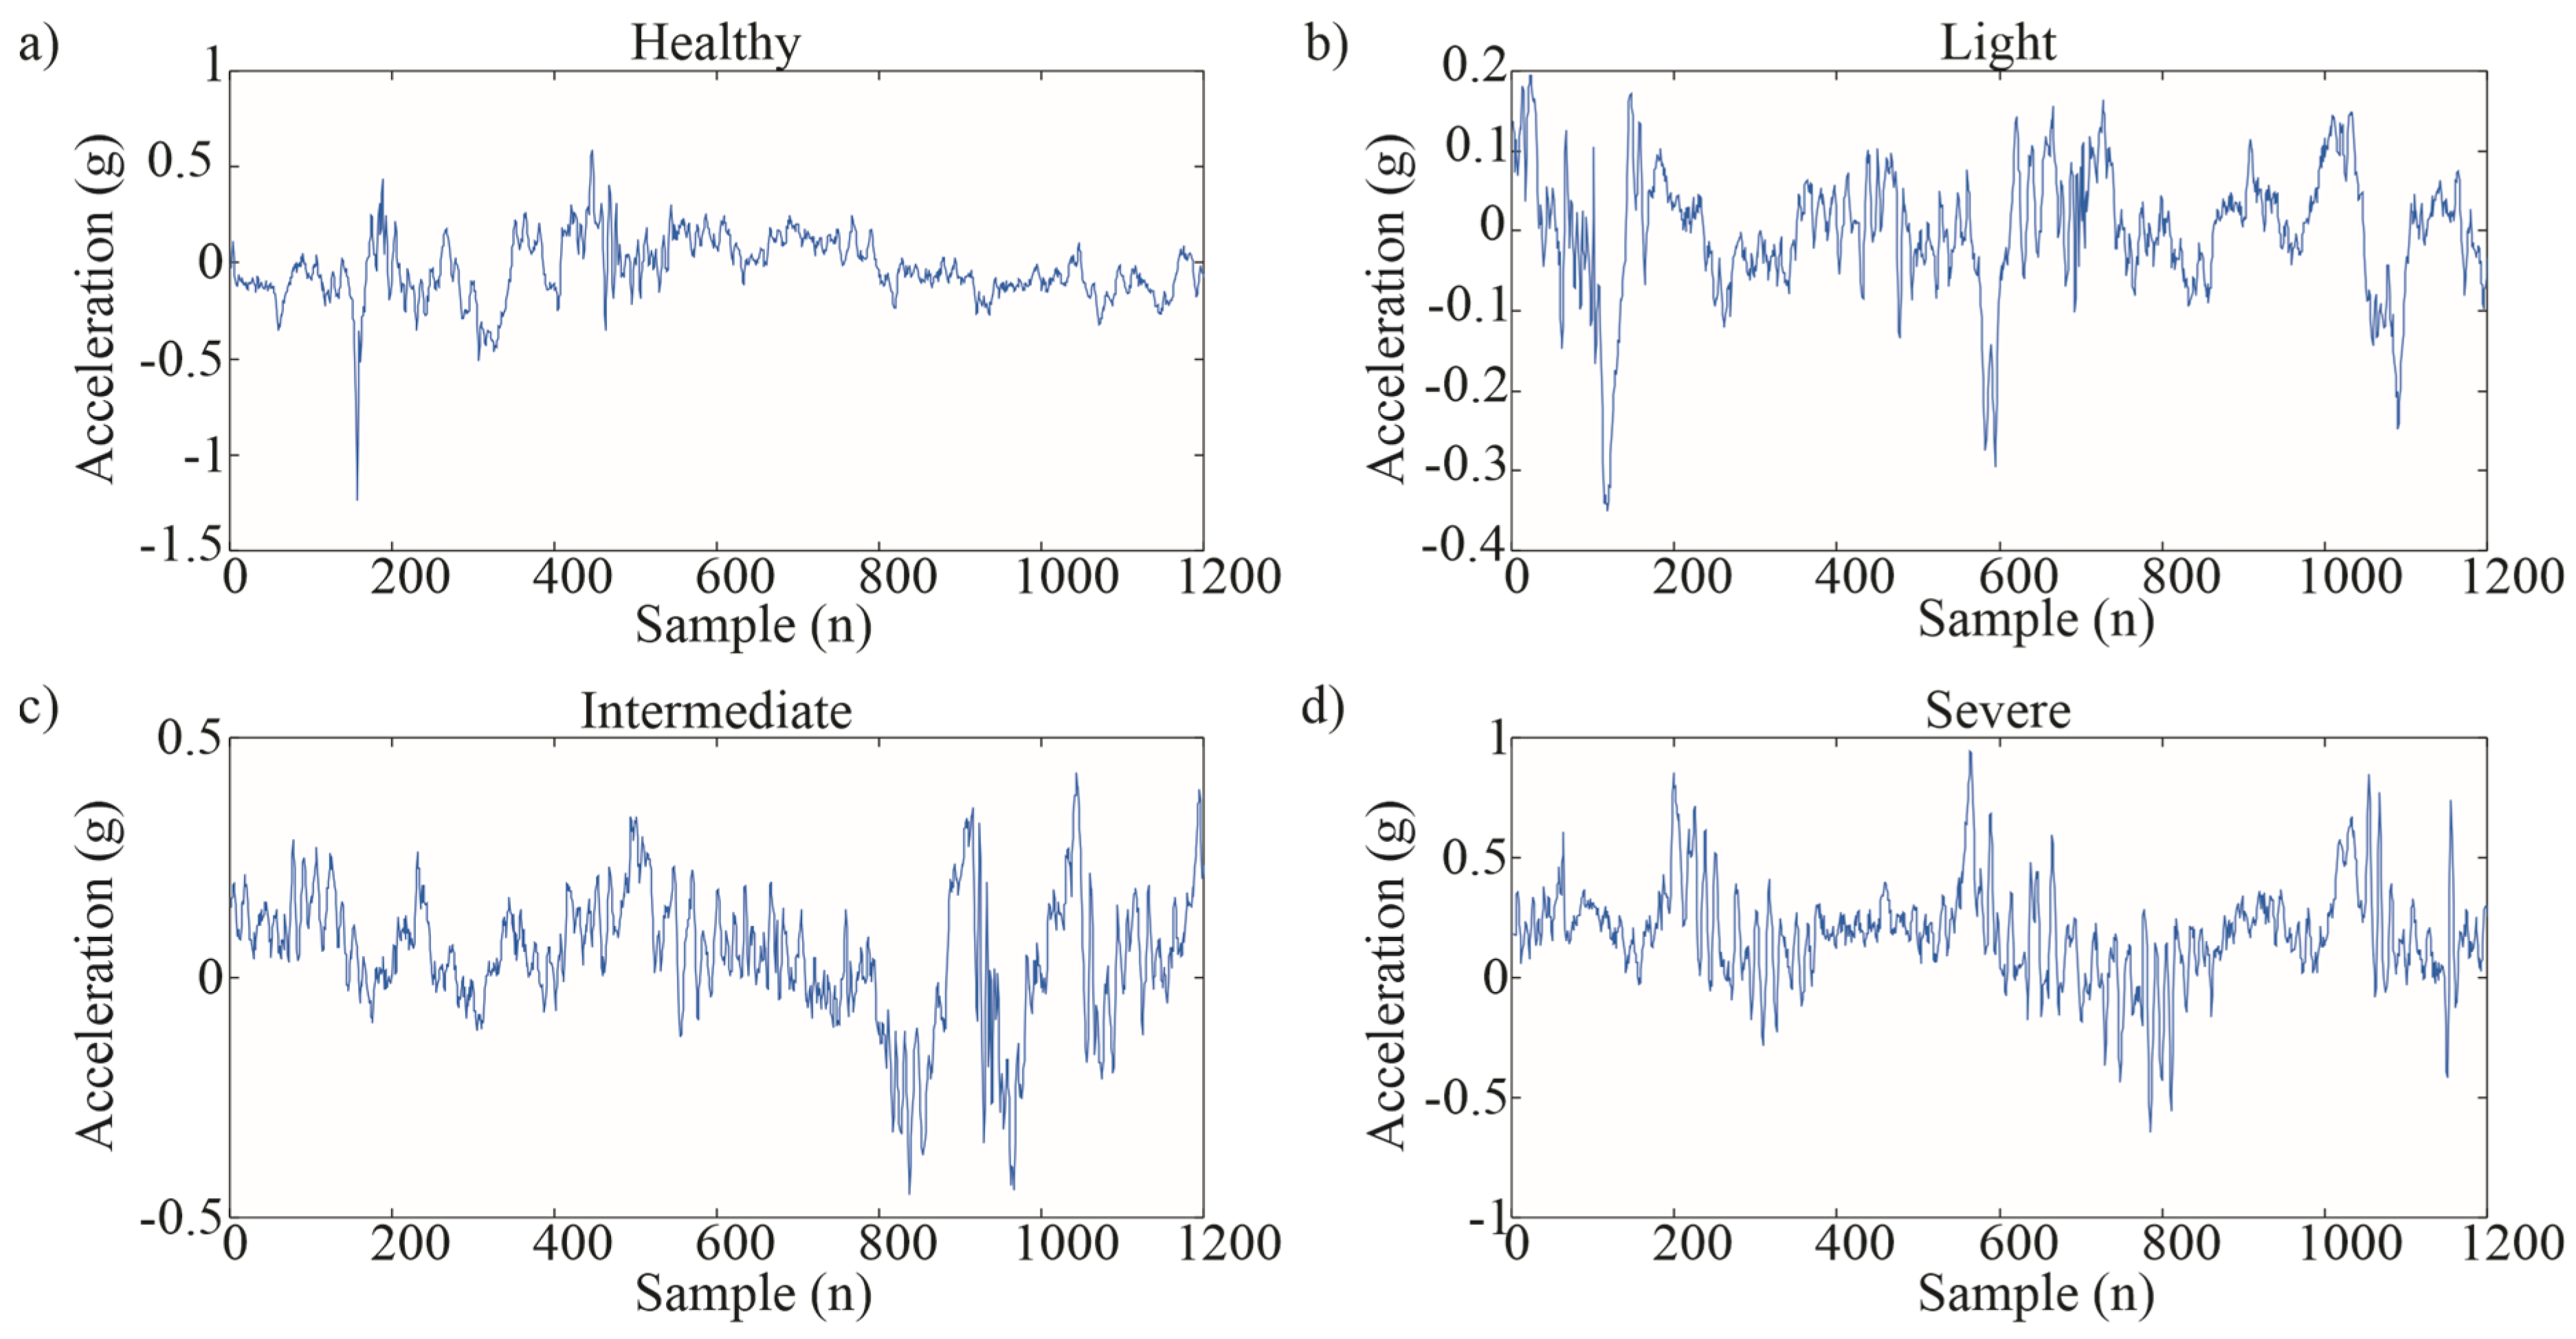
The vibration signals were obtained using a triaxial accelerometer mounted at the top of the wind turbine’s nacelle. Data were acquired at a sampling rate of 10,000 Hz across the three spatial axes (X, Y, and Z) to provide a more complete representation of the turbine’s structural dynamics. In contrast to previous studies that limited their analysis to a single axis, this work considers all three axes to enable a more robust and comprehensive evaluation of damage indicators. Measurements were conducted under two representative operating speeds: 3 rps during the turbine’s start-up phase, and 12 rps during steady-state operation, this latter being the maximum rated speed of the turbine. These speeds were selected because transient effects at low speeds may expose early-stage damage, while higher speeds can amplify fault-related components. However, identifying fault characteristics directly from time-domain signals is often challenging due to the complexity and variability of the vibration patterns. This limitation underscores the need for advanced feature extraction techniques, such as the proposed GAF-based transformation. Figure 6 illustrates representative time-domain signals corresponding to the four damage severity conditions. The signals shown in this figure corresponds to the Y-axis; yet, in the next figures, the signals for each axis are shown with their respective results. Table 1 summarizes the number of trials conducted for each case study 1000 tests per severity level across all axes.
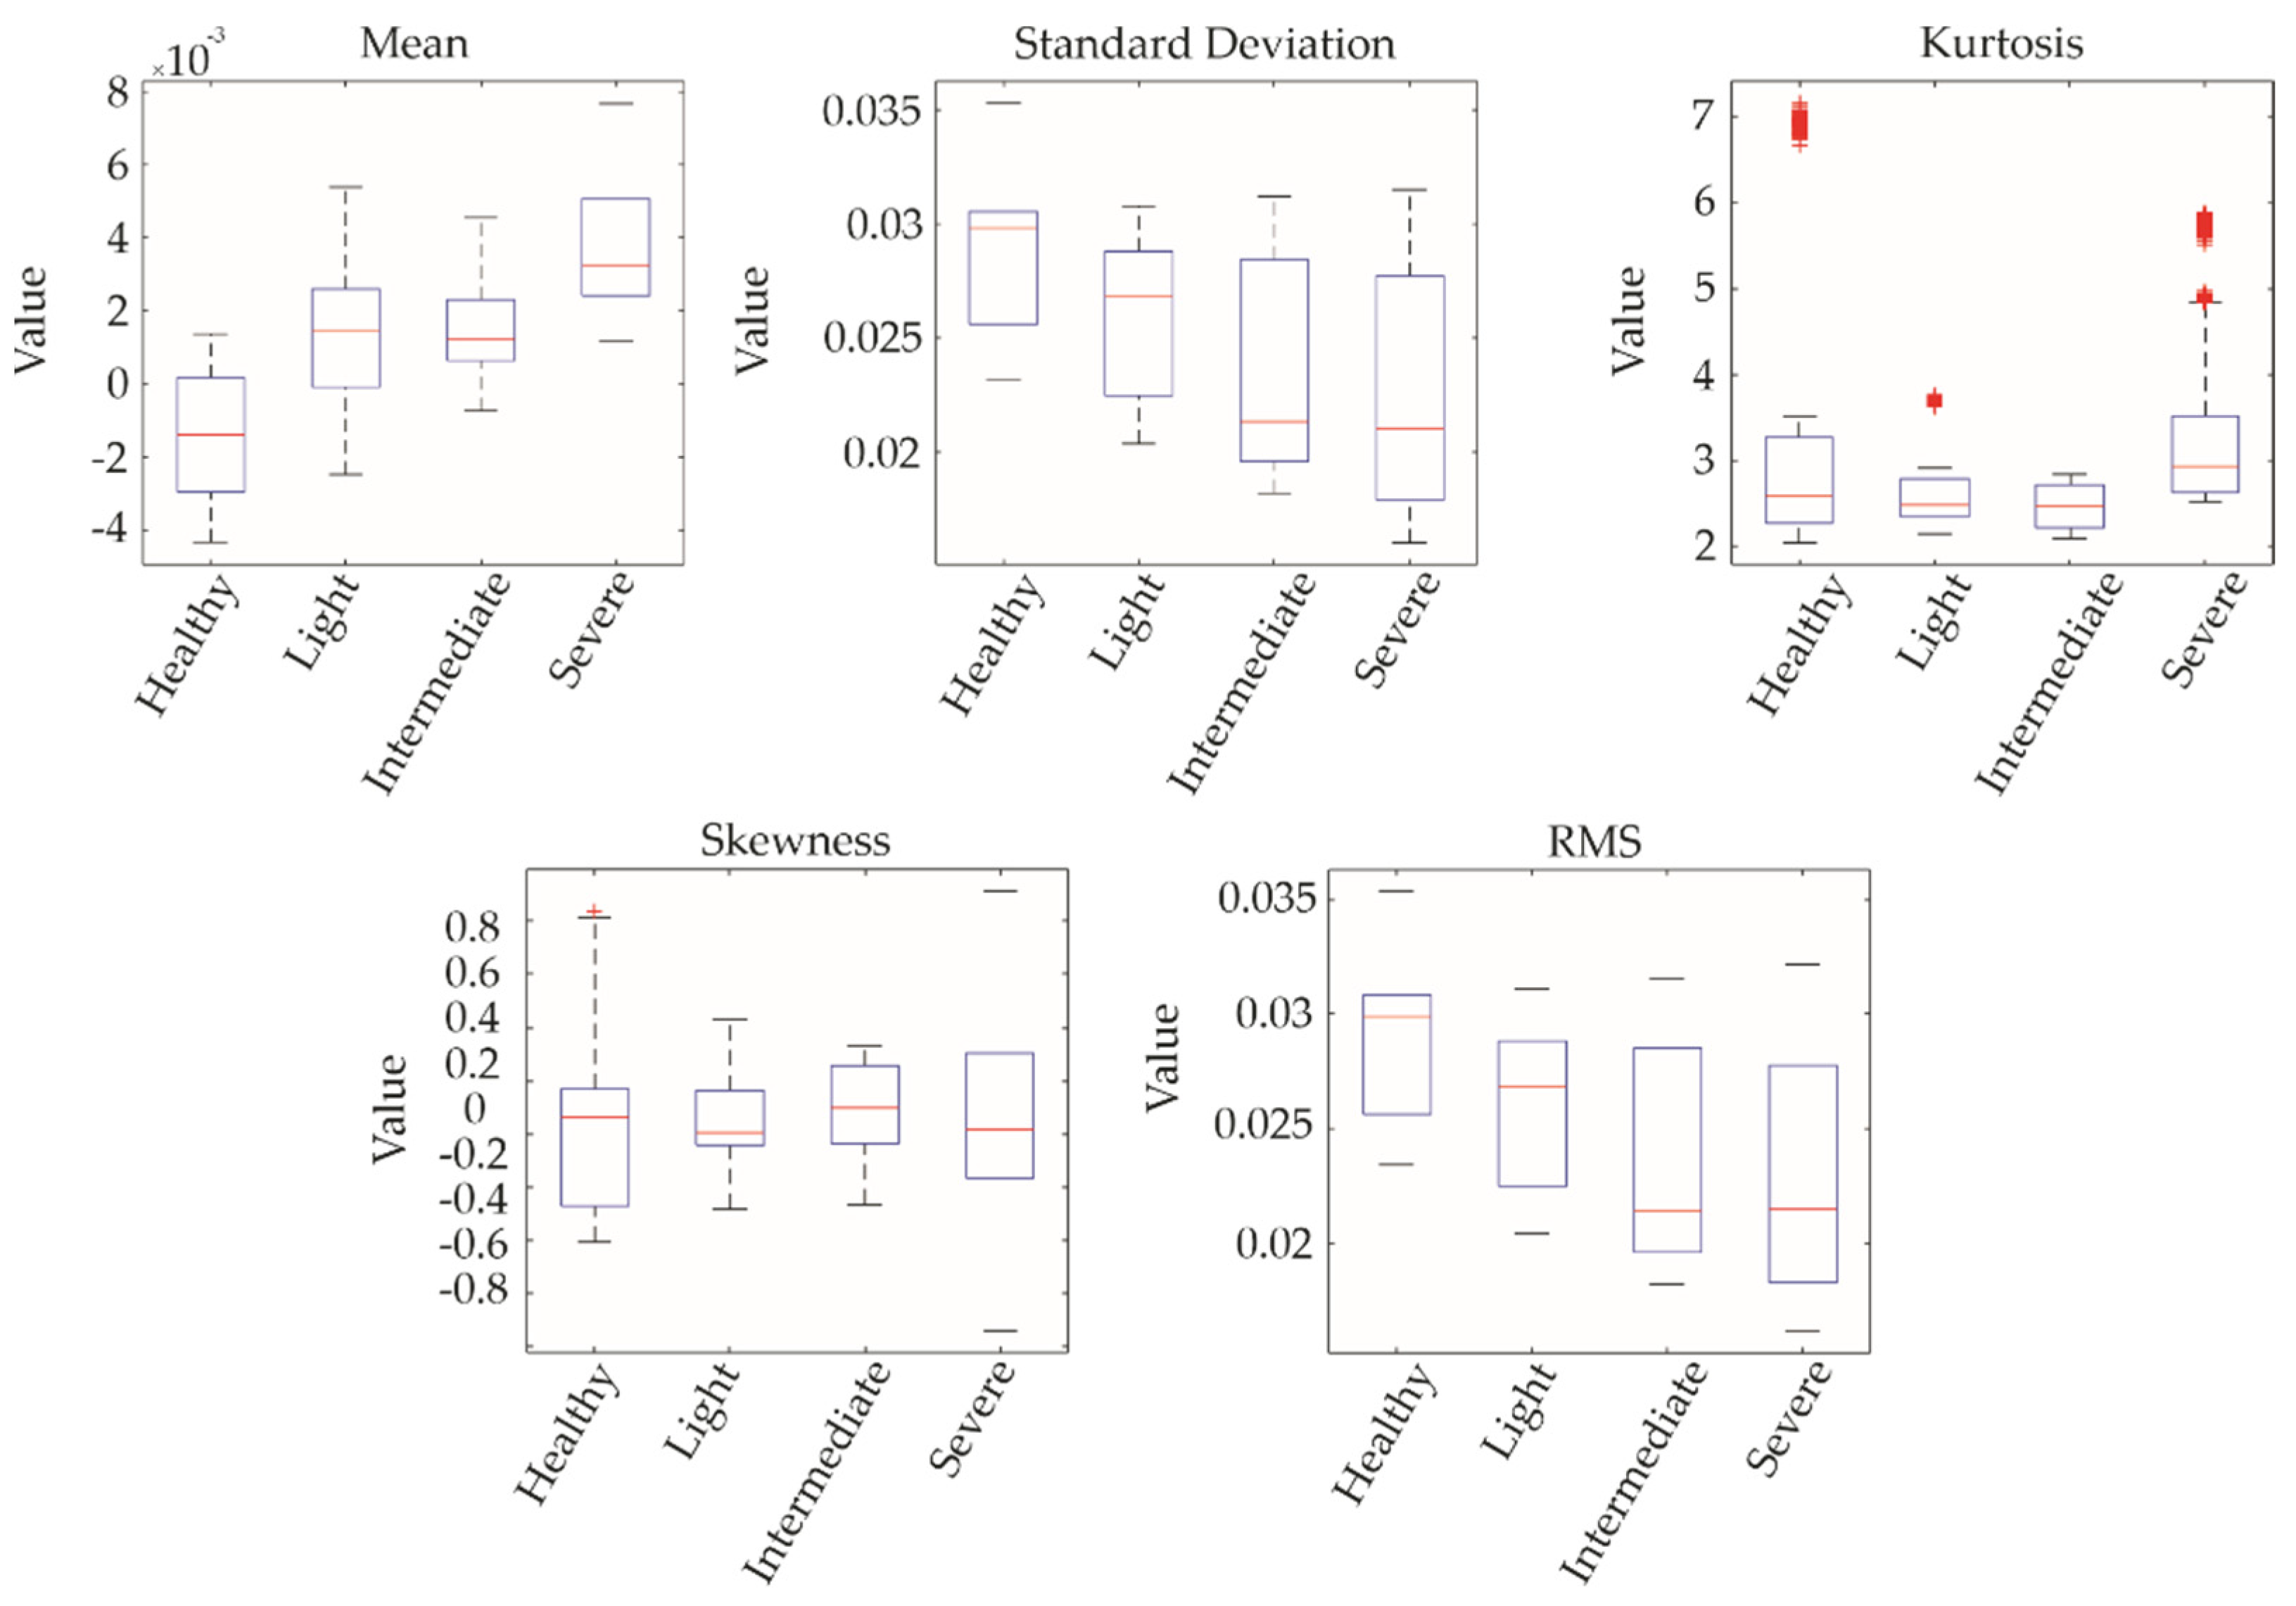
To illustrate the degree of separability between damage severity classes, a statistical analysis was performed using the Y-axis vibration signals at 3 rps as an example. Five common statistical indicators were considered, mean, standard deviation, kurtosis, skewness, and root mean square (RMS). These features were extracted from 1000 signals per condition (healthy, light, intermediate, severe) and visualized using boxplots, as shown in Figure 7. The results indicate considerable overlap in the distributions across the four conditions. This suggests that the signals are not statistically separable, implying the need for further processing.

4.3. The Gramian Angular Field Images for Vibrations

The process of generating GAF images begins by normalizing the vibration signal data to a range between −1 and 1. These normalized values are then mapped to angular coordinates, which are used to calculate the Gramian matrix. This matrix is subsequently transformed into an image through trigonometric functions. The resulting GAF images capture the temporal correlations of the vibration signals, providing a visual representation of the dynamic behavior of the system. These images are then ready for further analysis, including feature extraction or classification.
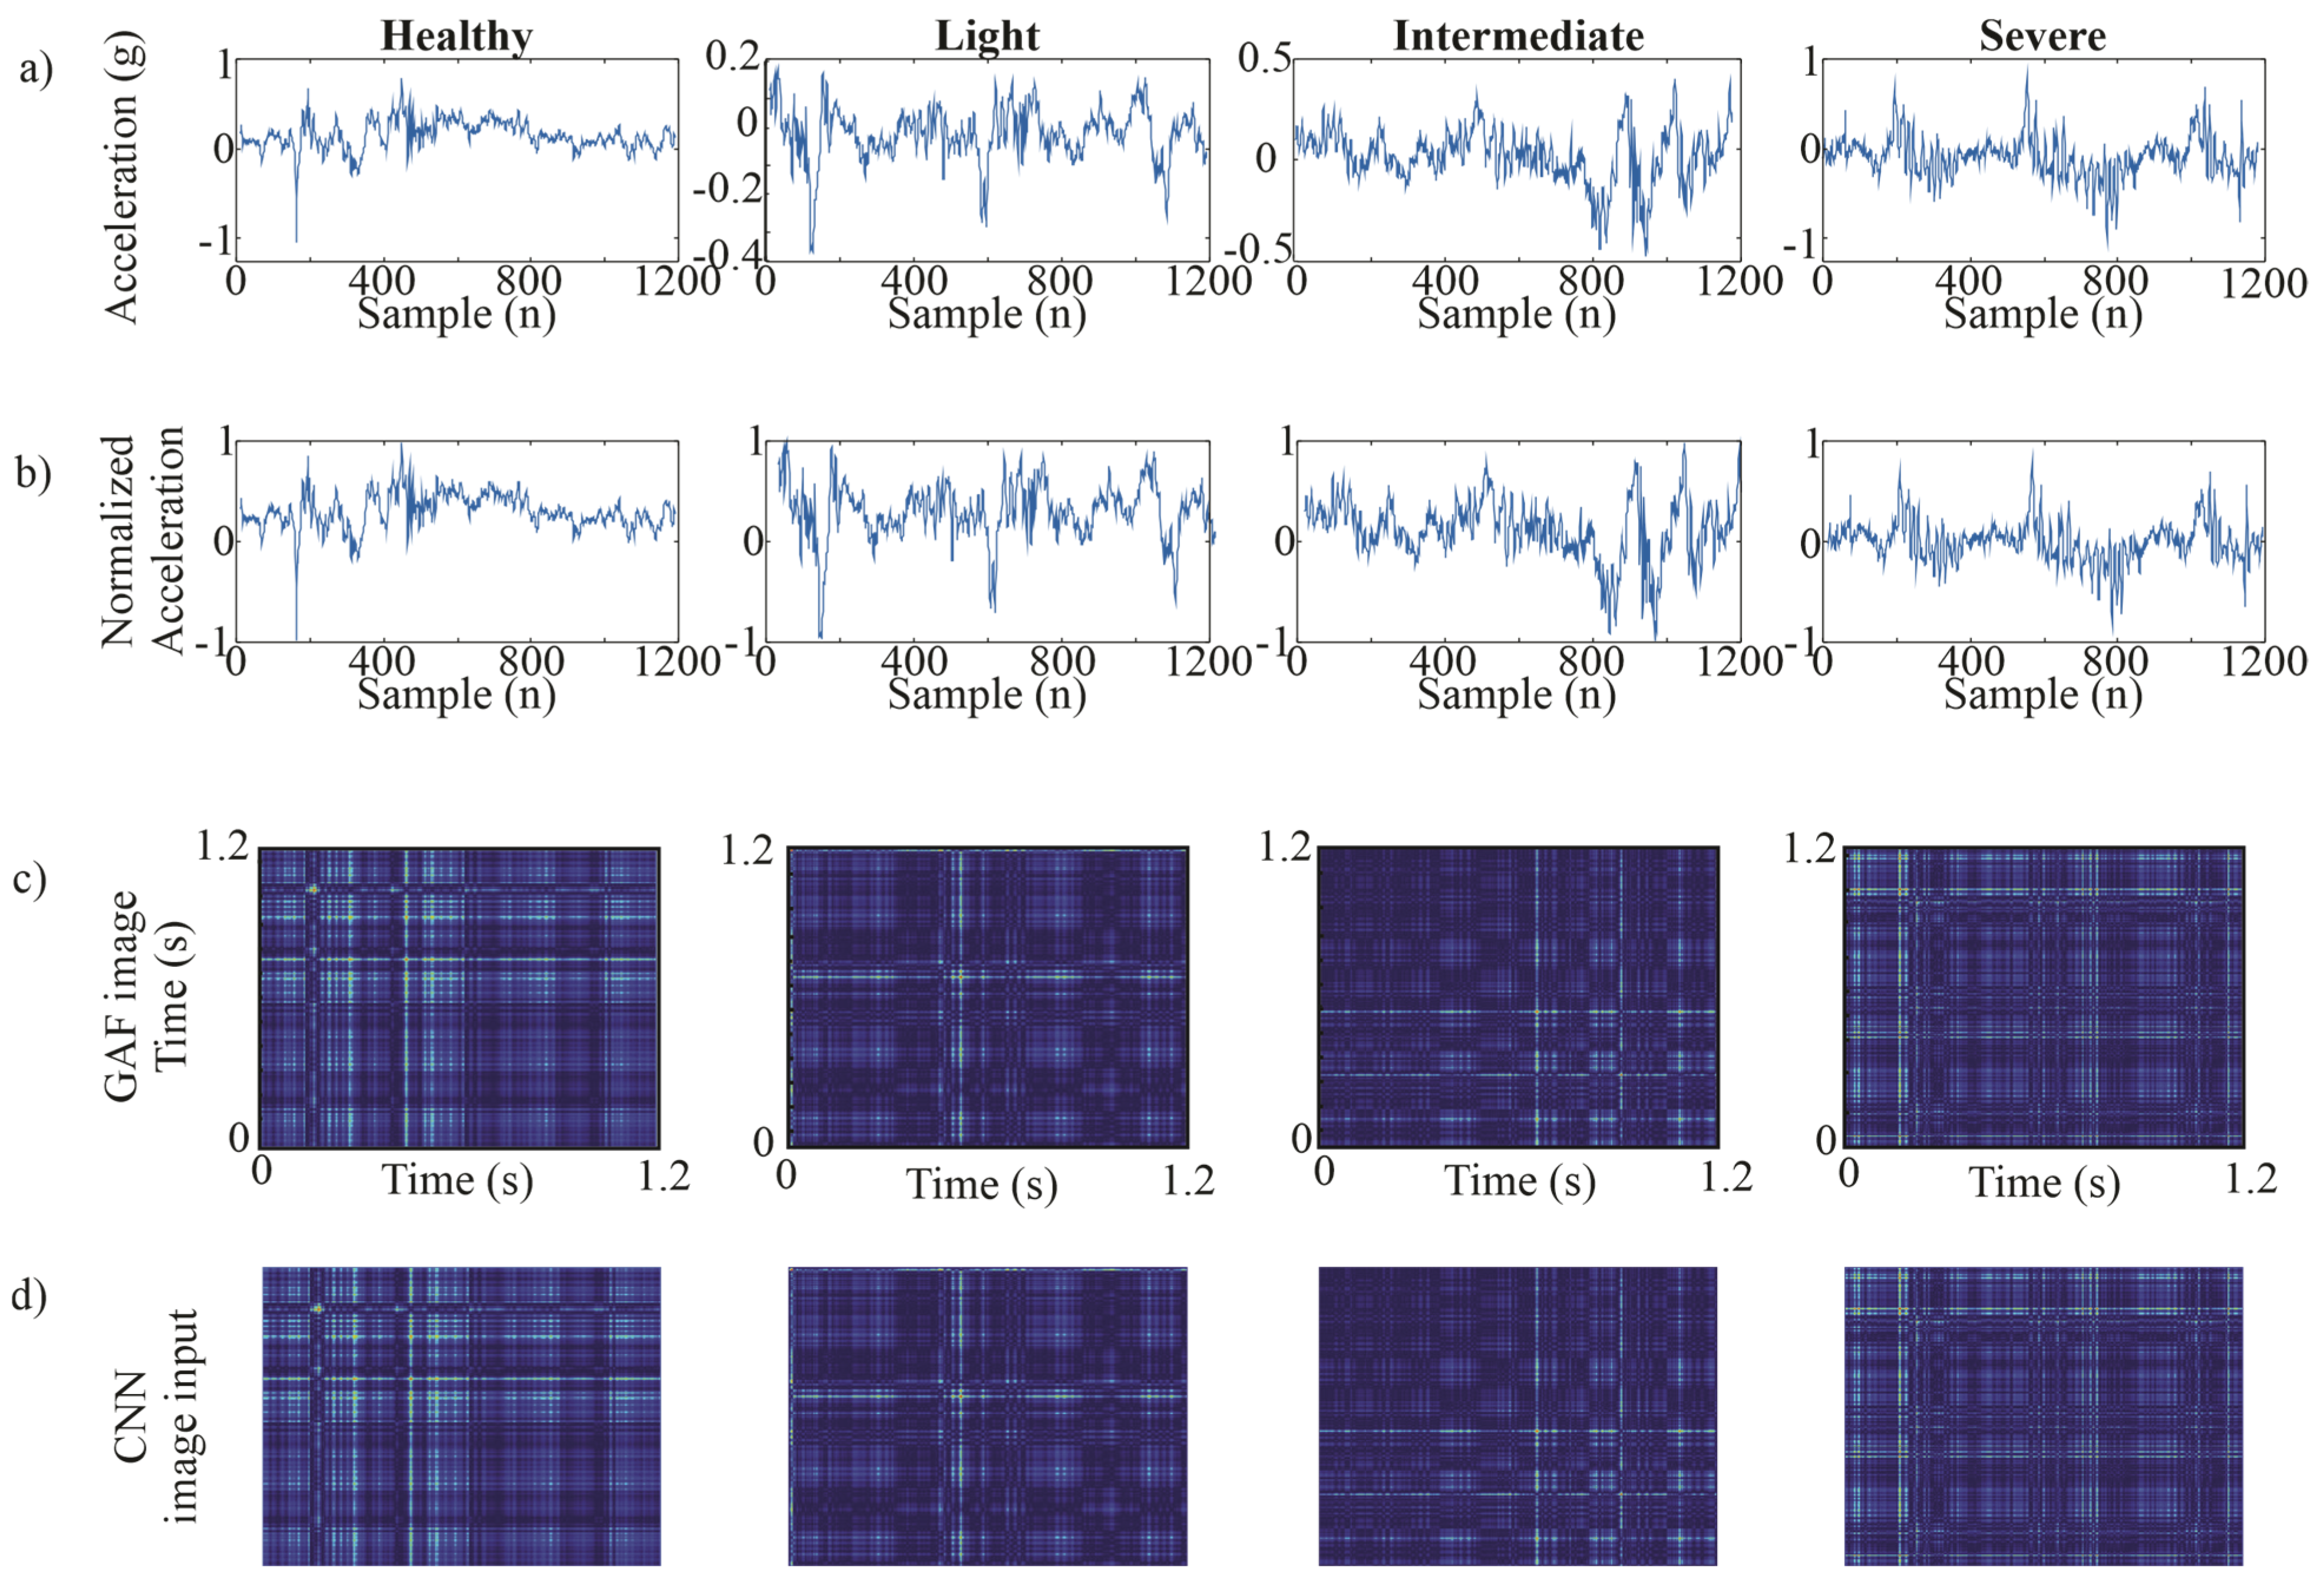
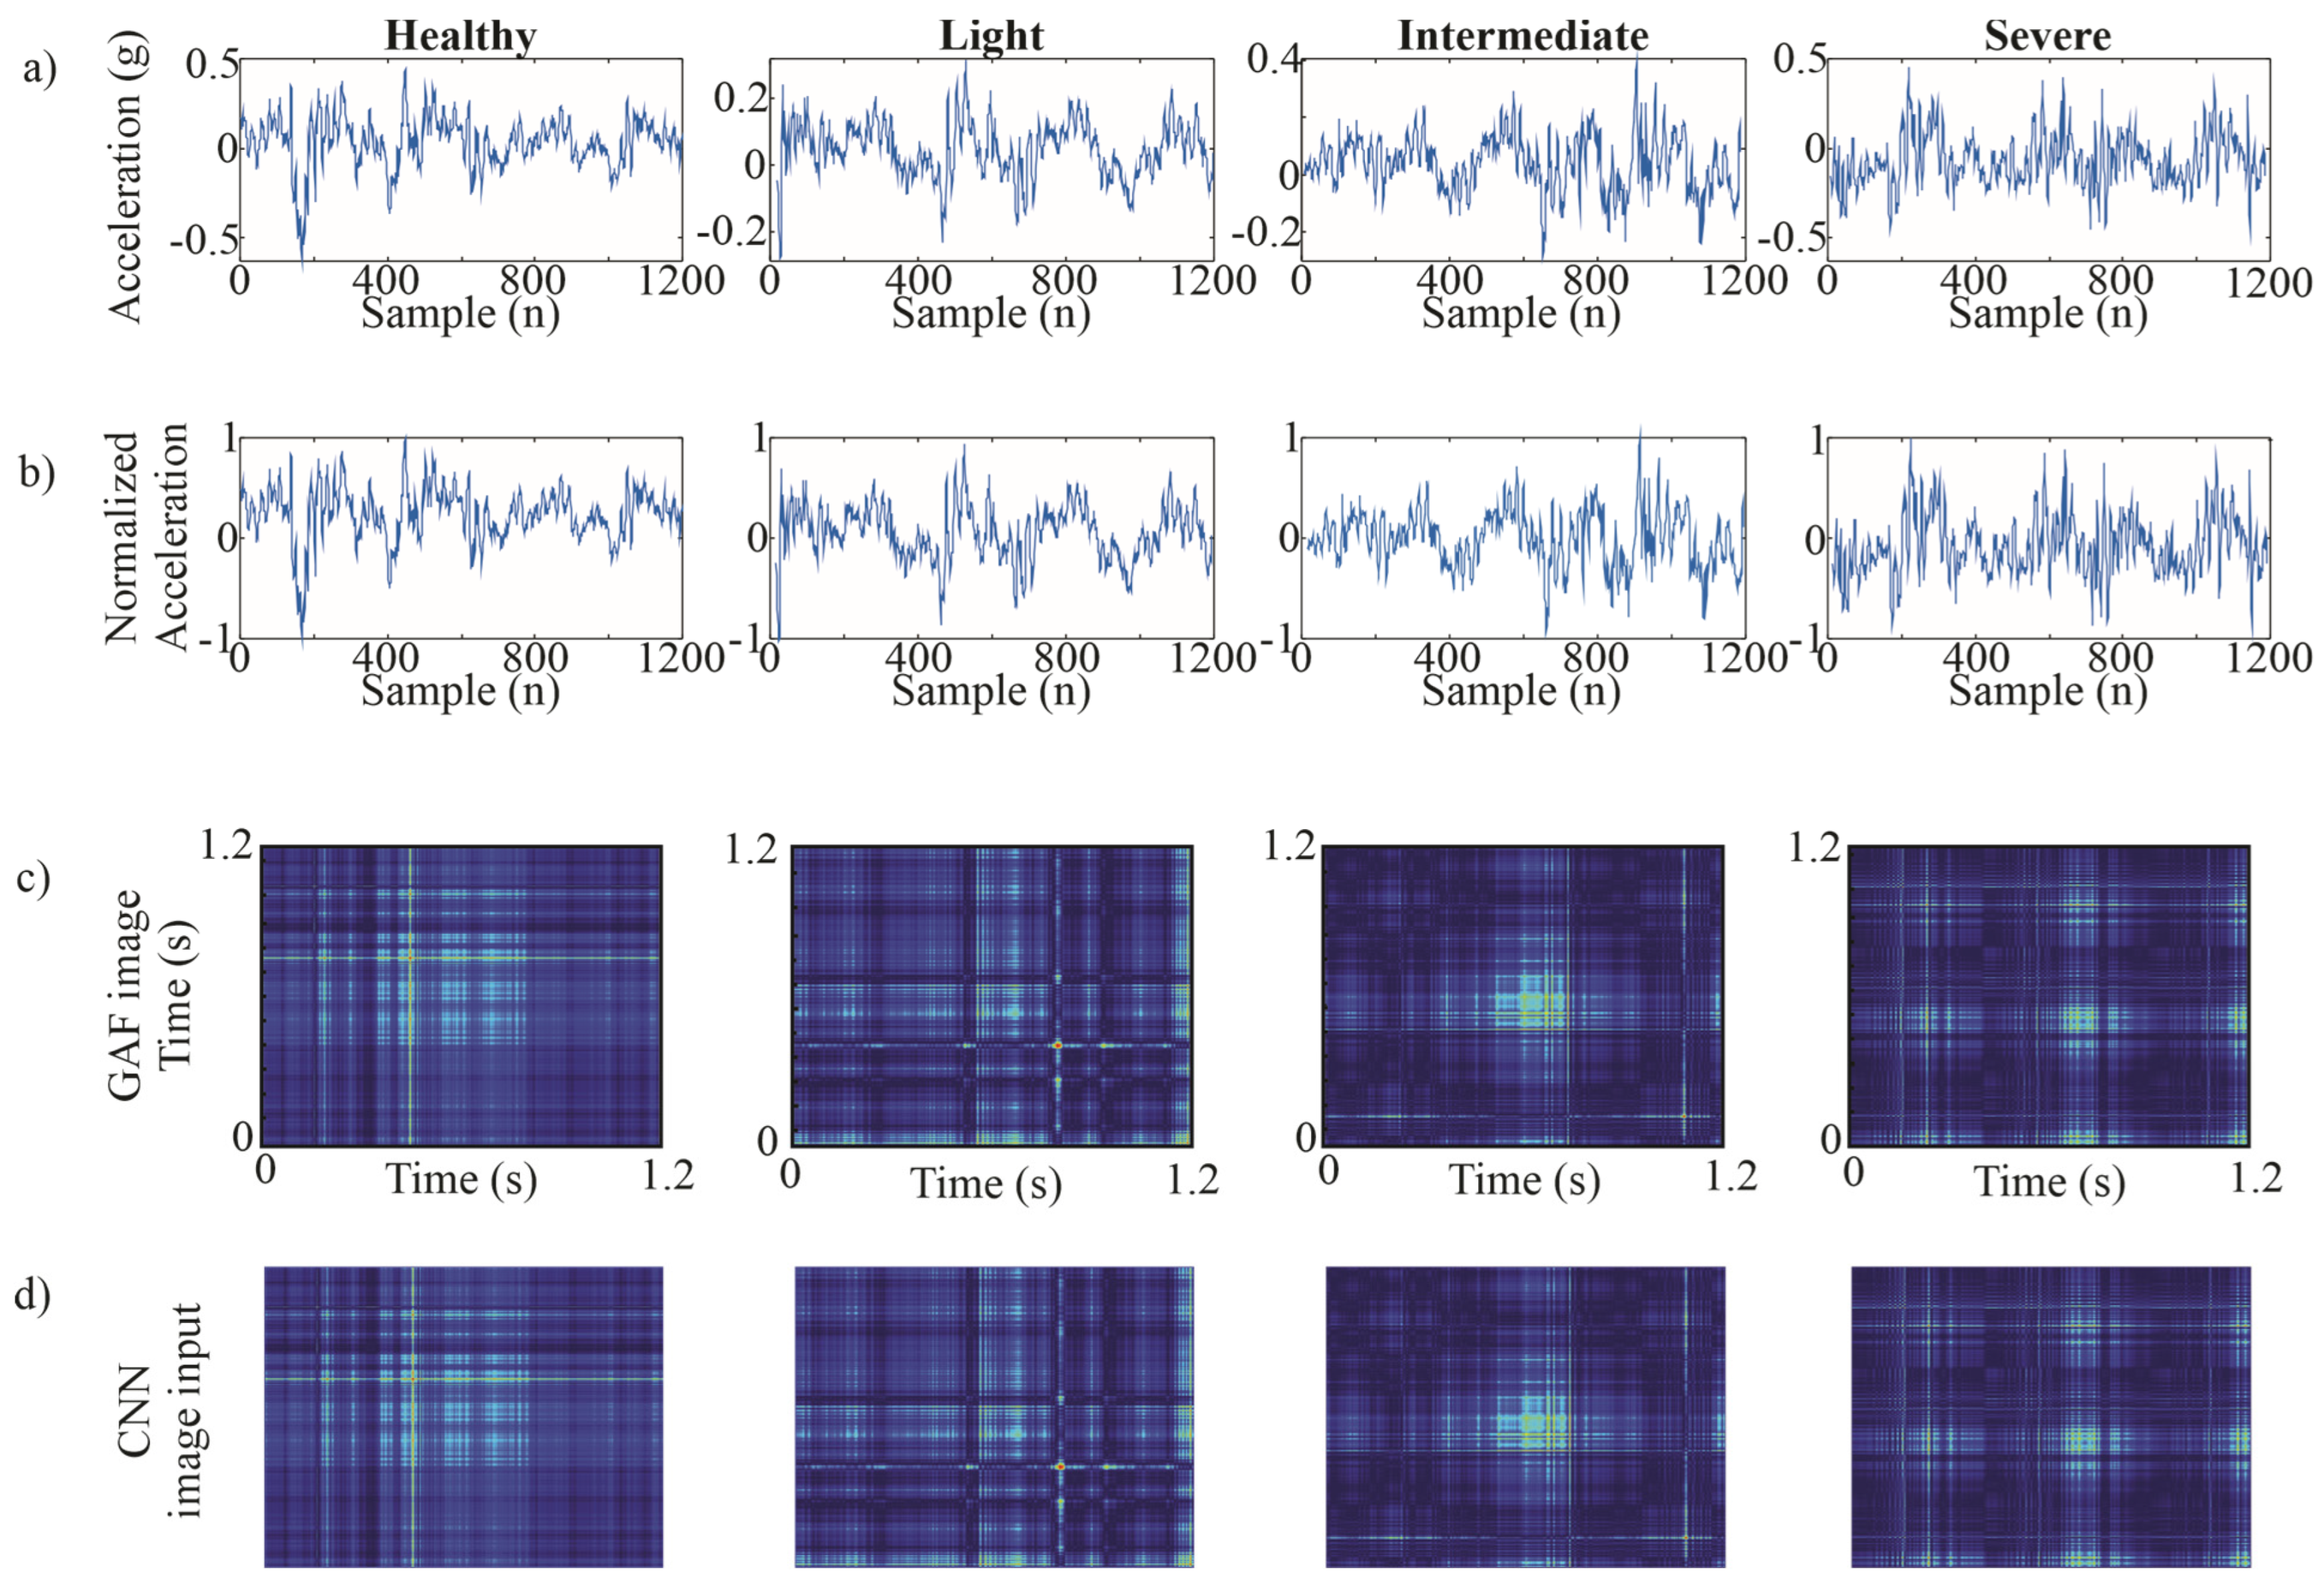
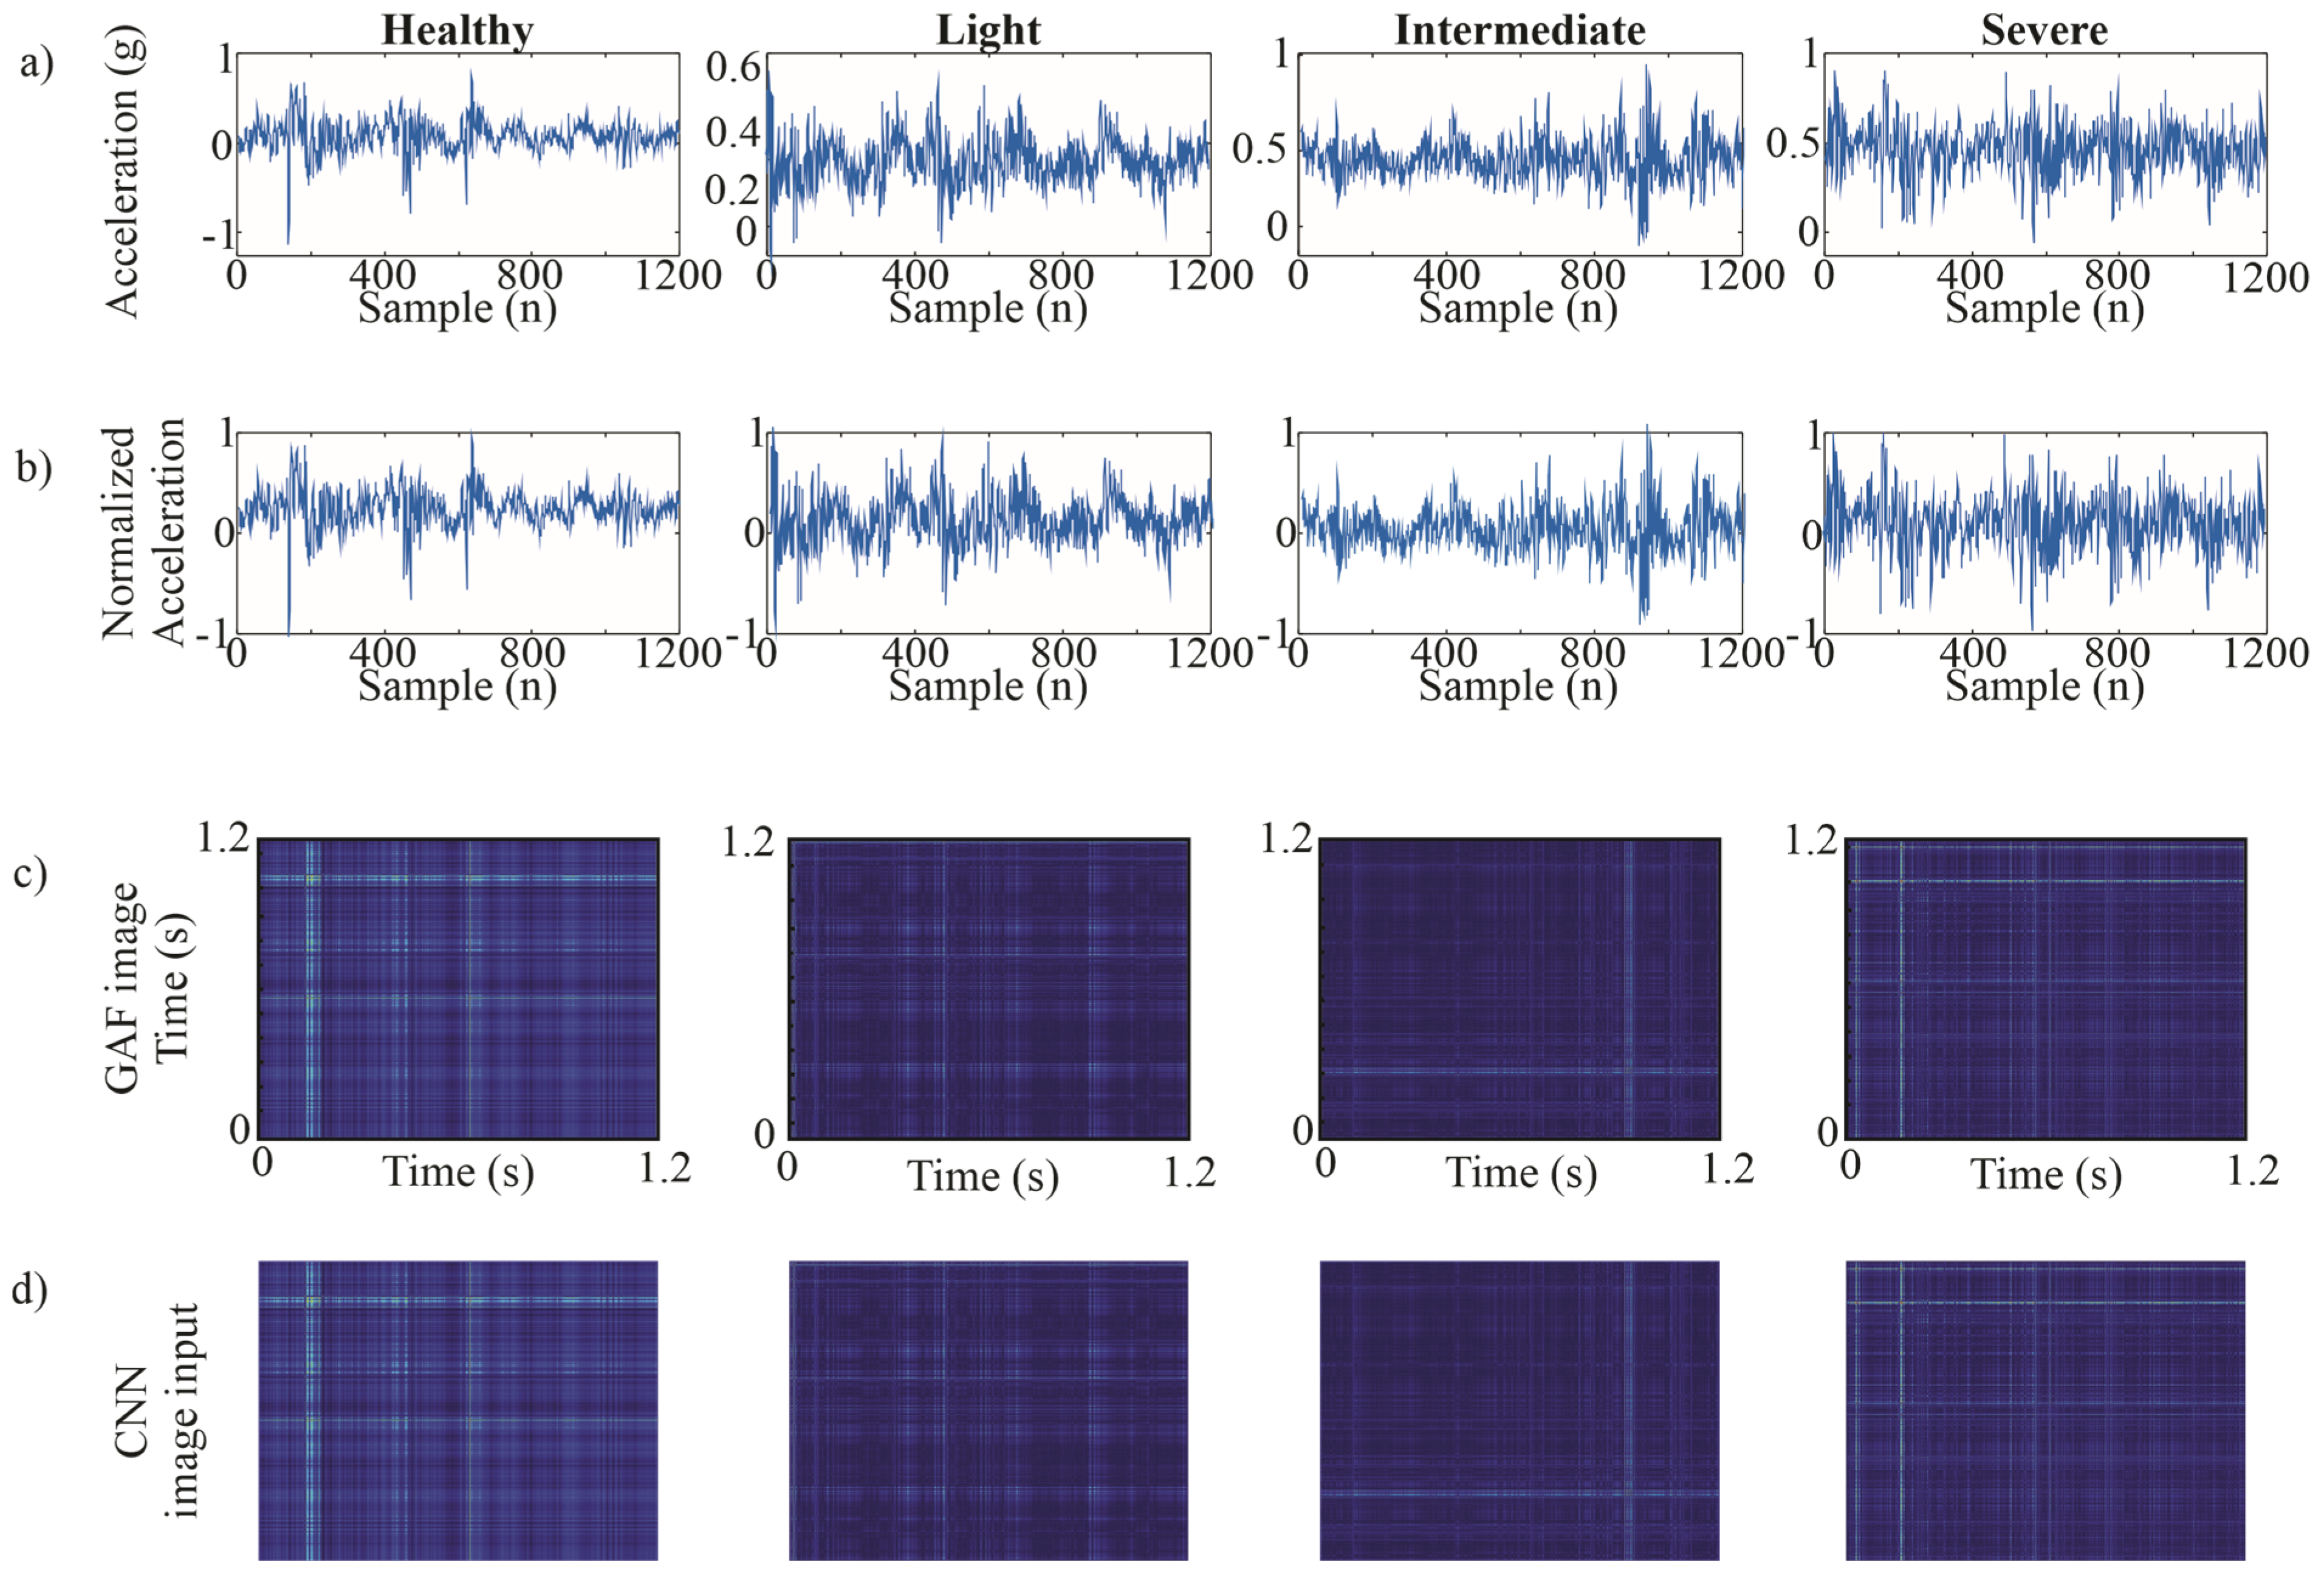
To explore the visual differences in the transformed signals, four representative GAF images corresponding to distinct damage severity levels, i.e., healthy, light, intermediate, and severe, are contrasted. Each image was generated from vibration signals acquired at an operating speed of 12 rps, with 1000 GAF images produced per condition. Although GAF images were generated for both considered speeds (3 rps and 12 rps), only those from 12 rps are shown below, as higher rotational speed tends to accentuate fault-related features, making the visual differences between severity levels more discernible. Figure 8, Figure 9 and Figure 10 display these representative GAF images, revealing patterns that suggest the potential for automated damage classification. Each figure includes four sections: (a) the original vibration signal, (b) the normalized signal, (c) the GAF-generated image, and (d) image input to the CNN.
The GAF representation of vibration signals offers significant advantages for machine learning applications, particularly in fault detection and diagnosis tasks. As illustrated in Figure 8, Figure 9 and Figure 10, the visual patterns embedded in the GAF images vary across damage severity levels, suggesting the presence of discriminative features. By converting time-series data into image form, GAF enables the use of CNNs, which are well-suited to capturing complex spatial patterns. This capability enhances the robustness of diagnostic models and supports the development of more accurate and automated predictive maintenance strategies for wind turbines.

4.4. Convolutional Neural Network

For the classification of the GAF images, a baseline CNN architecture was implemented, designed to balance model complexity and computational efficiency. The network included a single hidden convolutional layer with three filters of size 16×16, selected to effectively capture local texture variations present in the GAF representations without increasing computational cost. A batch normalization layer was added to improve training convergence and stability, followed by a ReLU activation function. A max-pooling layer with a 2×2 filter size was used to reduce dimensionality and emphasize dominant spatial features. This configuration was chosen after testing multiple single-layer variants, as it consistently provided high accuracy while keeping the number of parameters low, an essential aspect for real-time or embedded applications. The use of only one convolutional layer simplifies the training process and reduces inference time, achieving a good trade-off between accuracy and computational load. Although the architecture yielded excellent results, future work could explore optimization strategies, such as automated architecture search or pruning techniques, to further enhance performance without compromising efficiency.
To reduce overfitting and enhance generalization, the dataset was partitioned into 70% training, 15% validation, and 15% testing, following standard practice in image classification tasks. A dropout layer with a rate of 0.5 was incorporated to randomly deactivate neurons during training, thereby encouraging the network to develop redundant and more generalizable internal representations. The training process employed the Adam optimizer due to its adaptive learning rate capabilities and stability in sparse gradient scenarios. An initial learning rate of 0.0005 was chosen based on preliminary experiments for achieving stable convergence. Additionally, a learning rate decay strategy was applied using a drop factor of 0.5, allowing the model to refine its learning as it approached a local minimum.
The CNN achieved an accuracy of 100% on the test set when trained and evaluated with GAF images derived from the vibration signals at 12 rps, the turbine’s maximum operating speed. This result was consistent across all three accelerometer axes (X, Y, and Z), confirming the model’s strong ability to differentiate between the four damage severity levels under steady-state conditions.
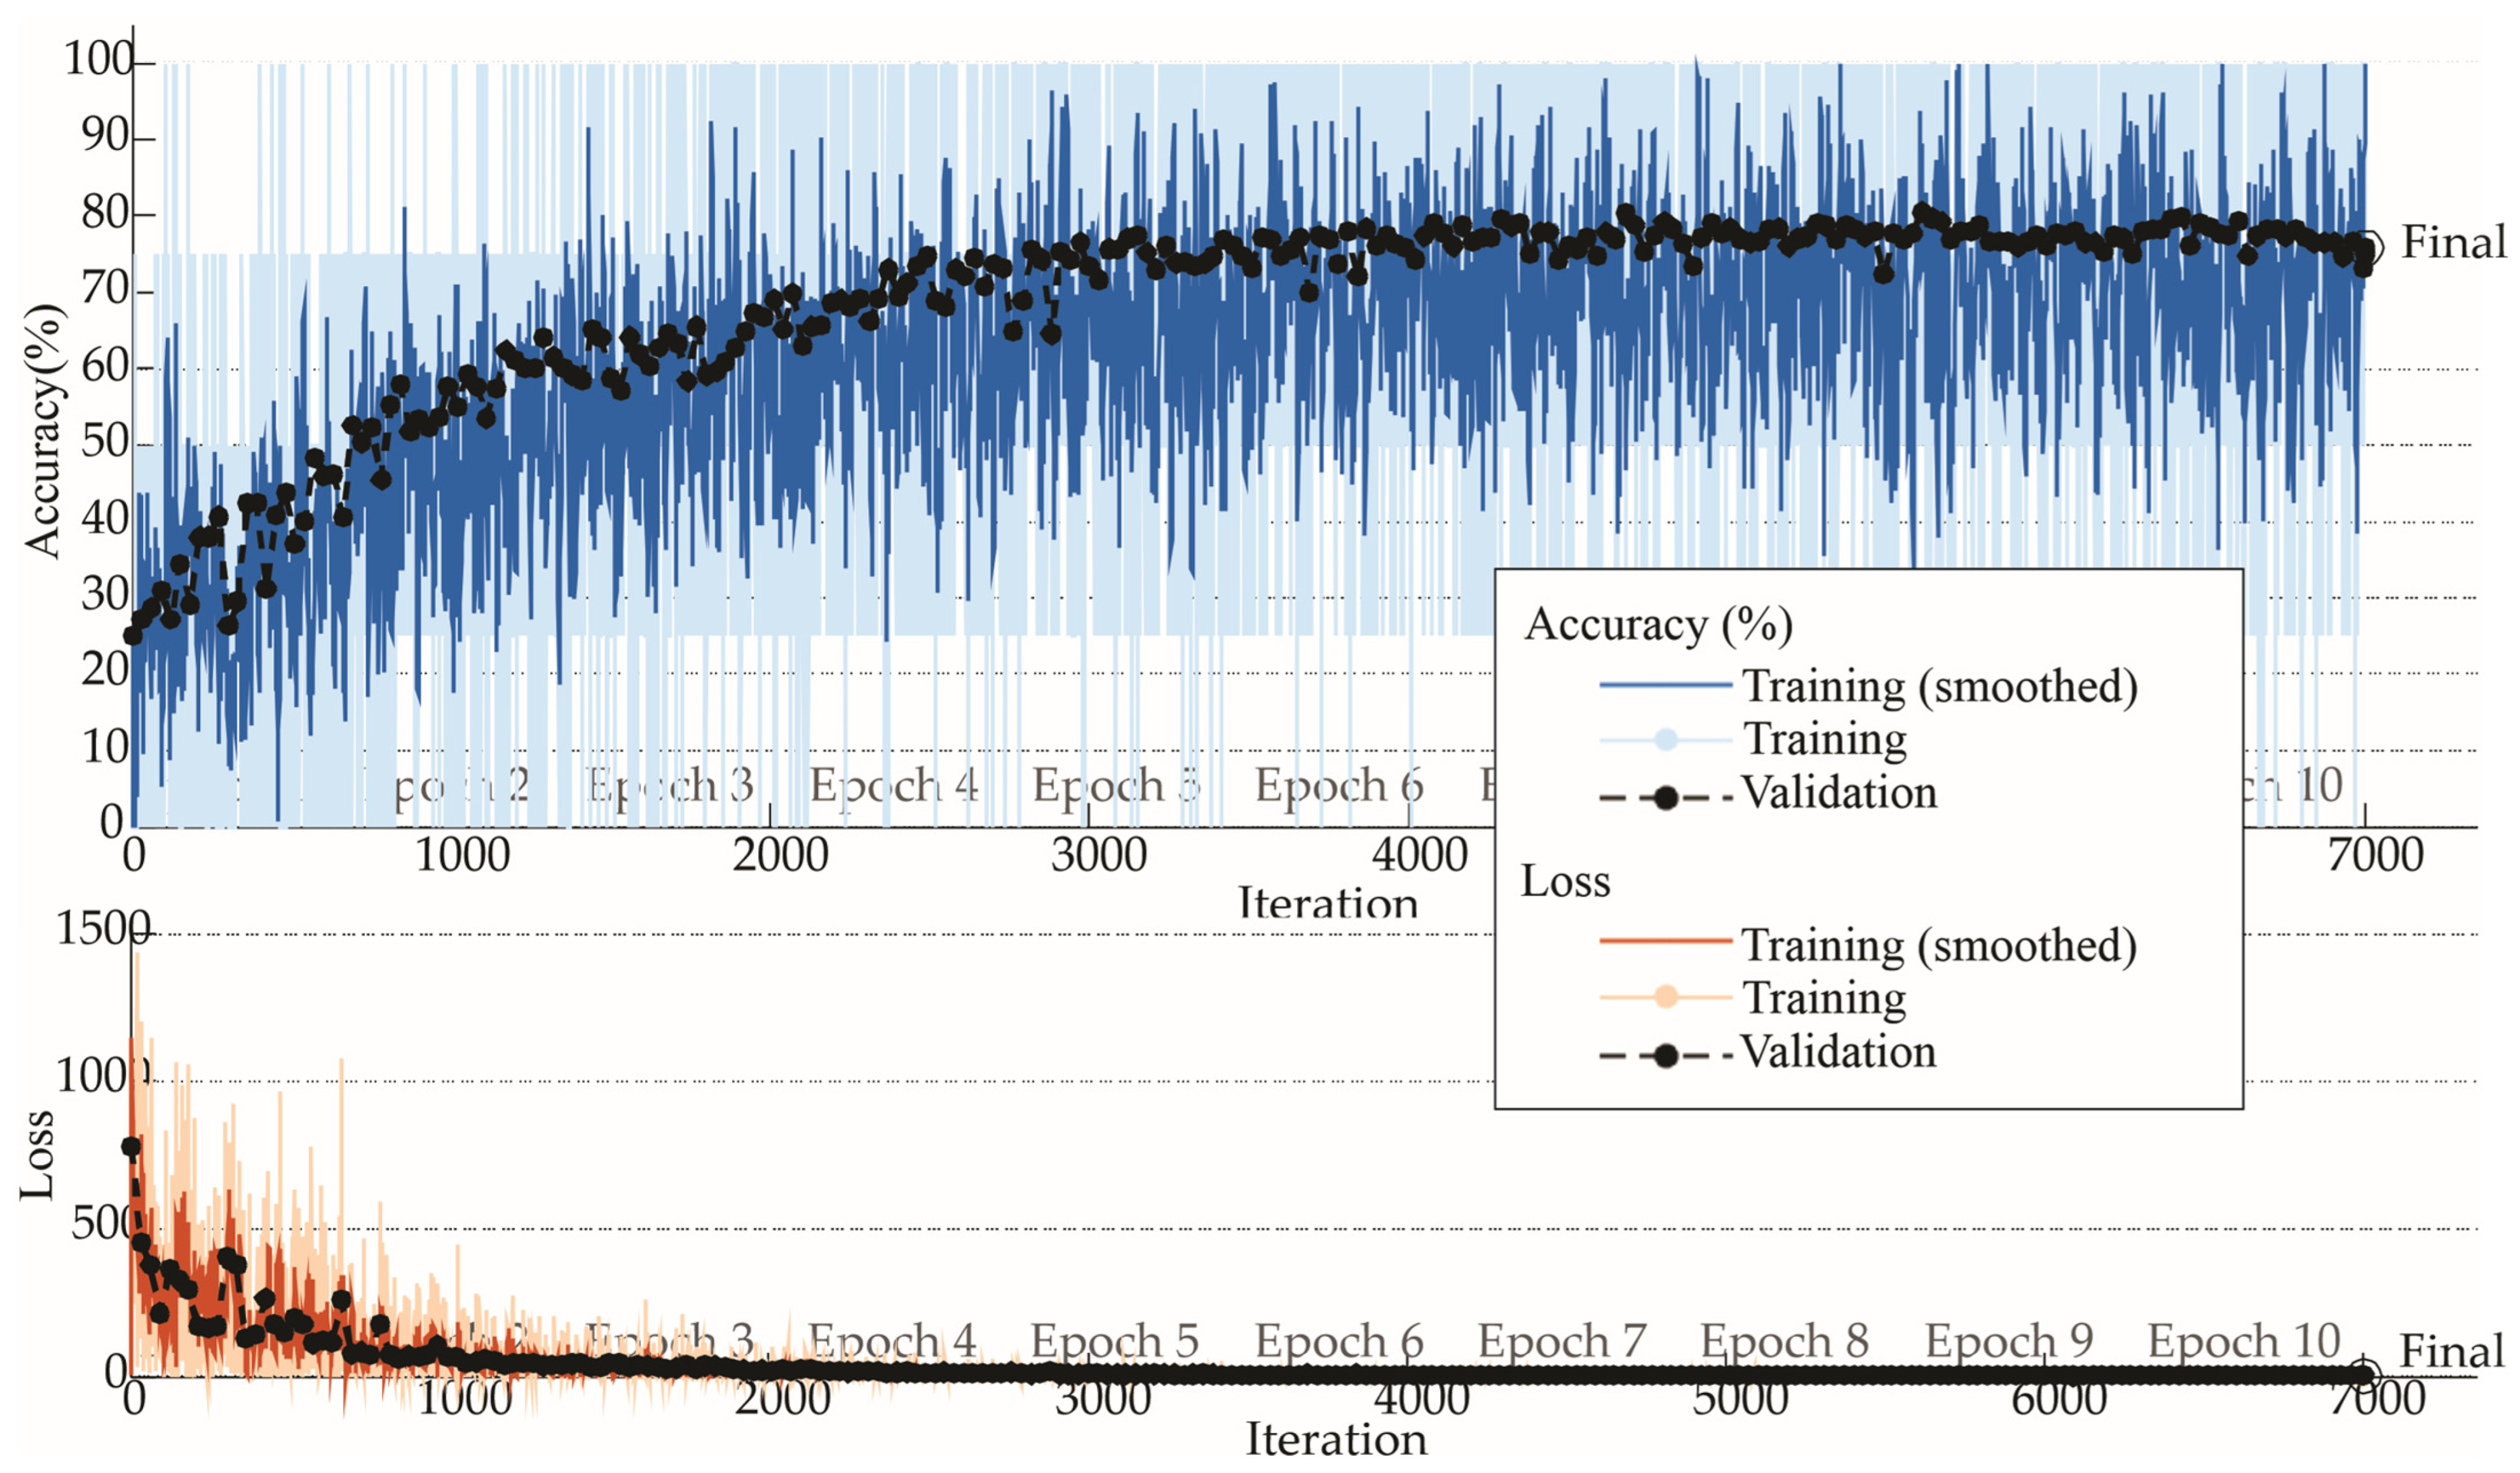
To assess model robustness across all axes and operating speeds, a comparative analysis was conducted using signals from the X, Y, and Z axes at both 12 rps (steady state) and 3 rps (start-up). At 12 rps, the classification accuracy remained consistently high, reaching 100% across all three axes. In contrast, during the start-up phase at 3 rps, a drop in performance was observed in the Z-axis, where accuracy decreased to approximately 78%. The X and Y axes, however, maintained high accuracy values close to 99.9%, indicating that these axes offer more reliable signal characteristics at lower speeds. Table 2 presents a detailed summary of the accurate results across all axes and both operating conditions.
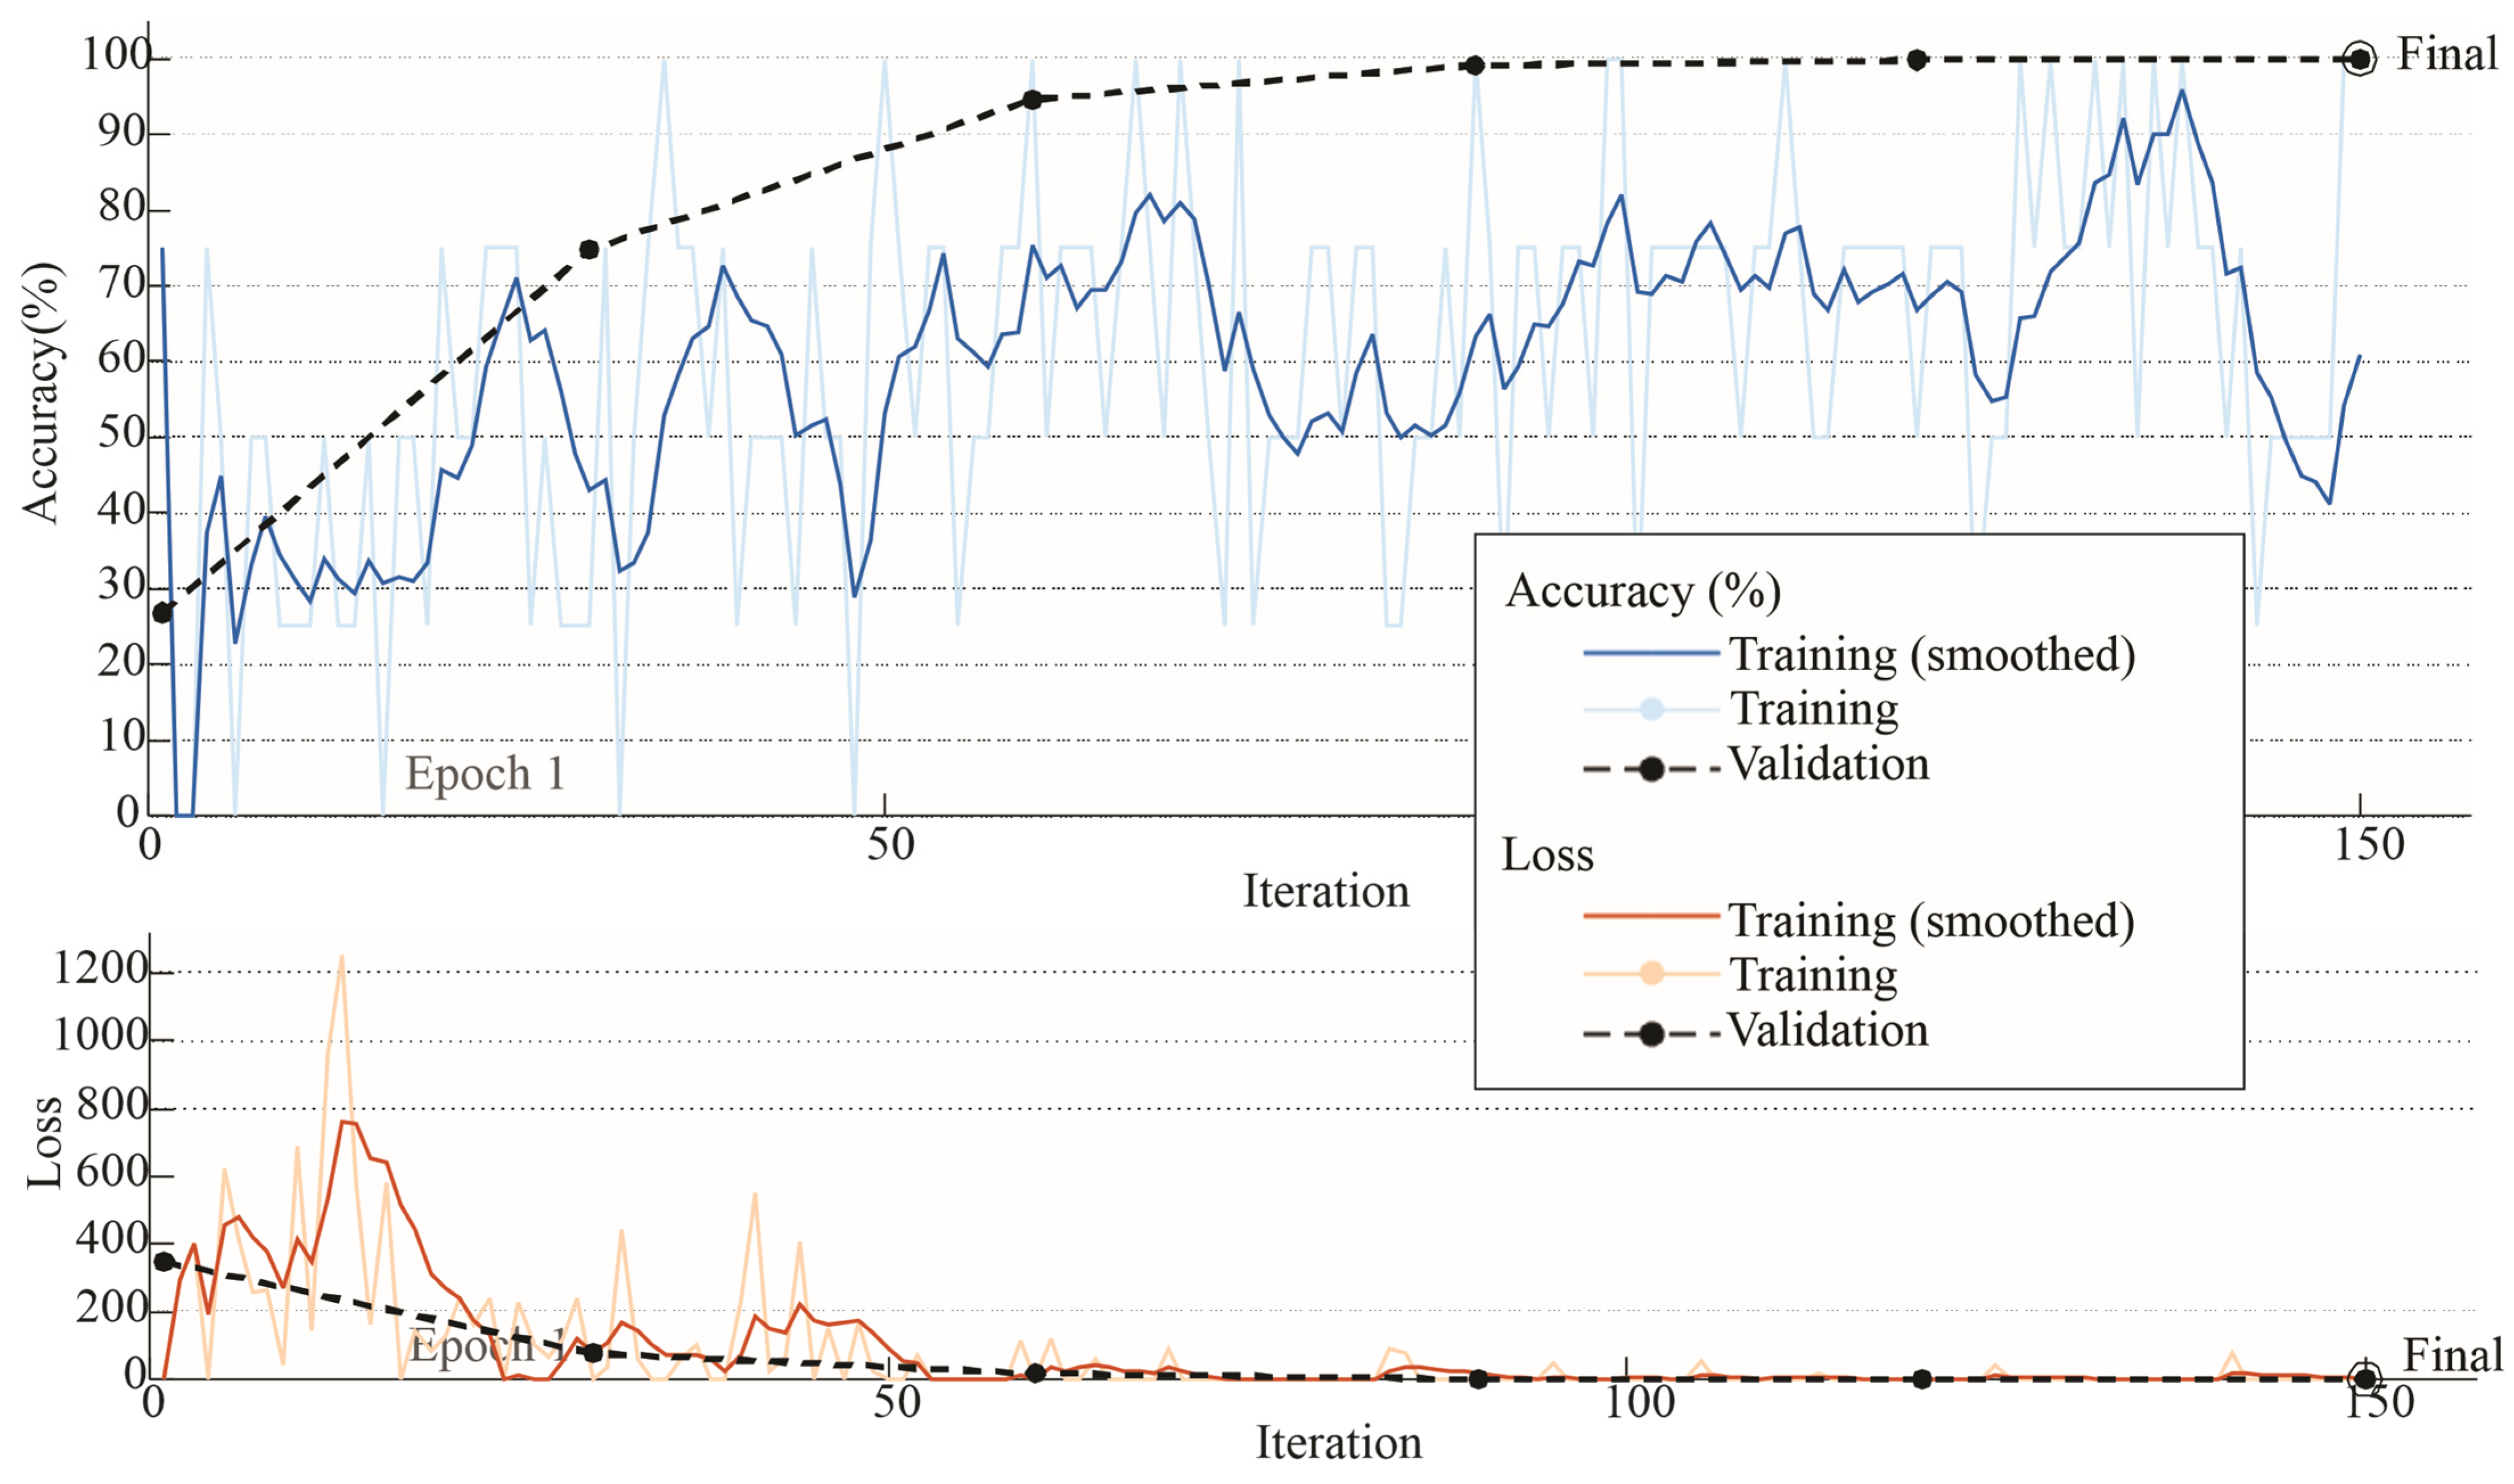
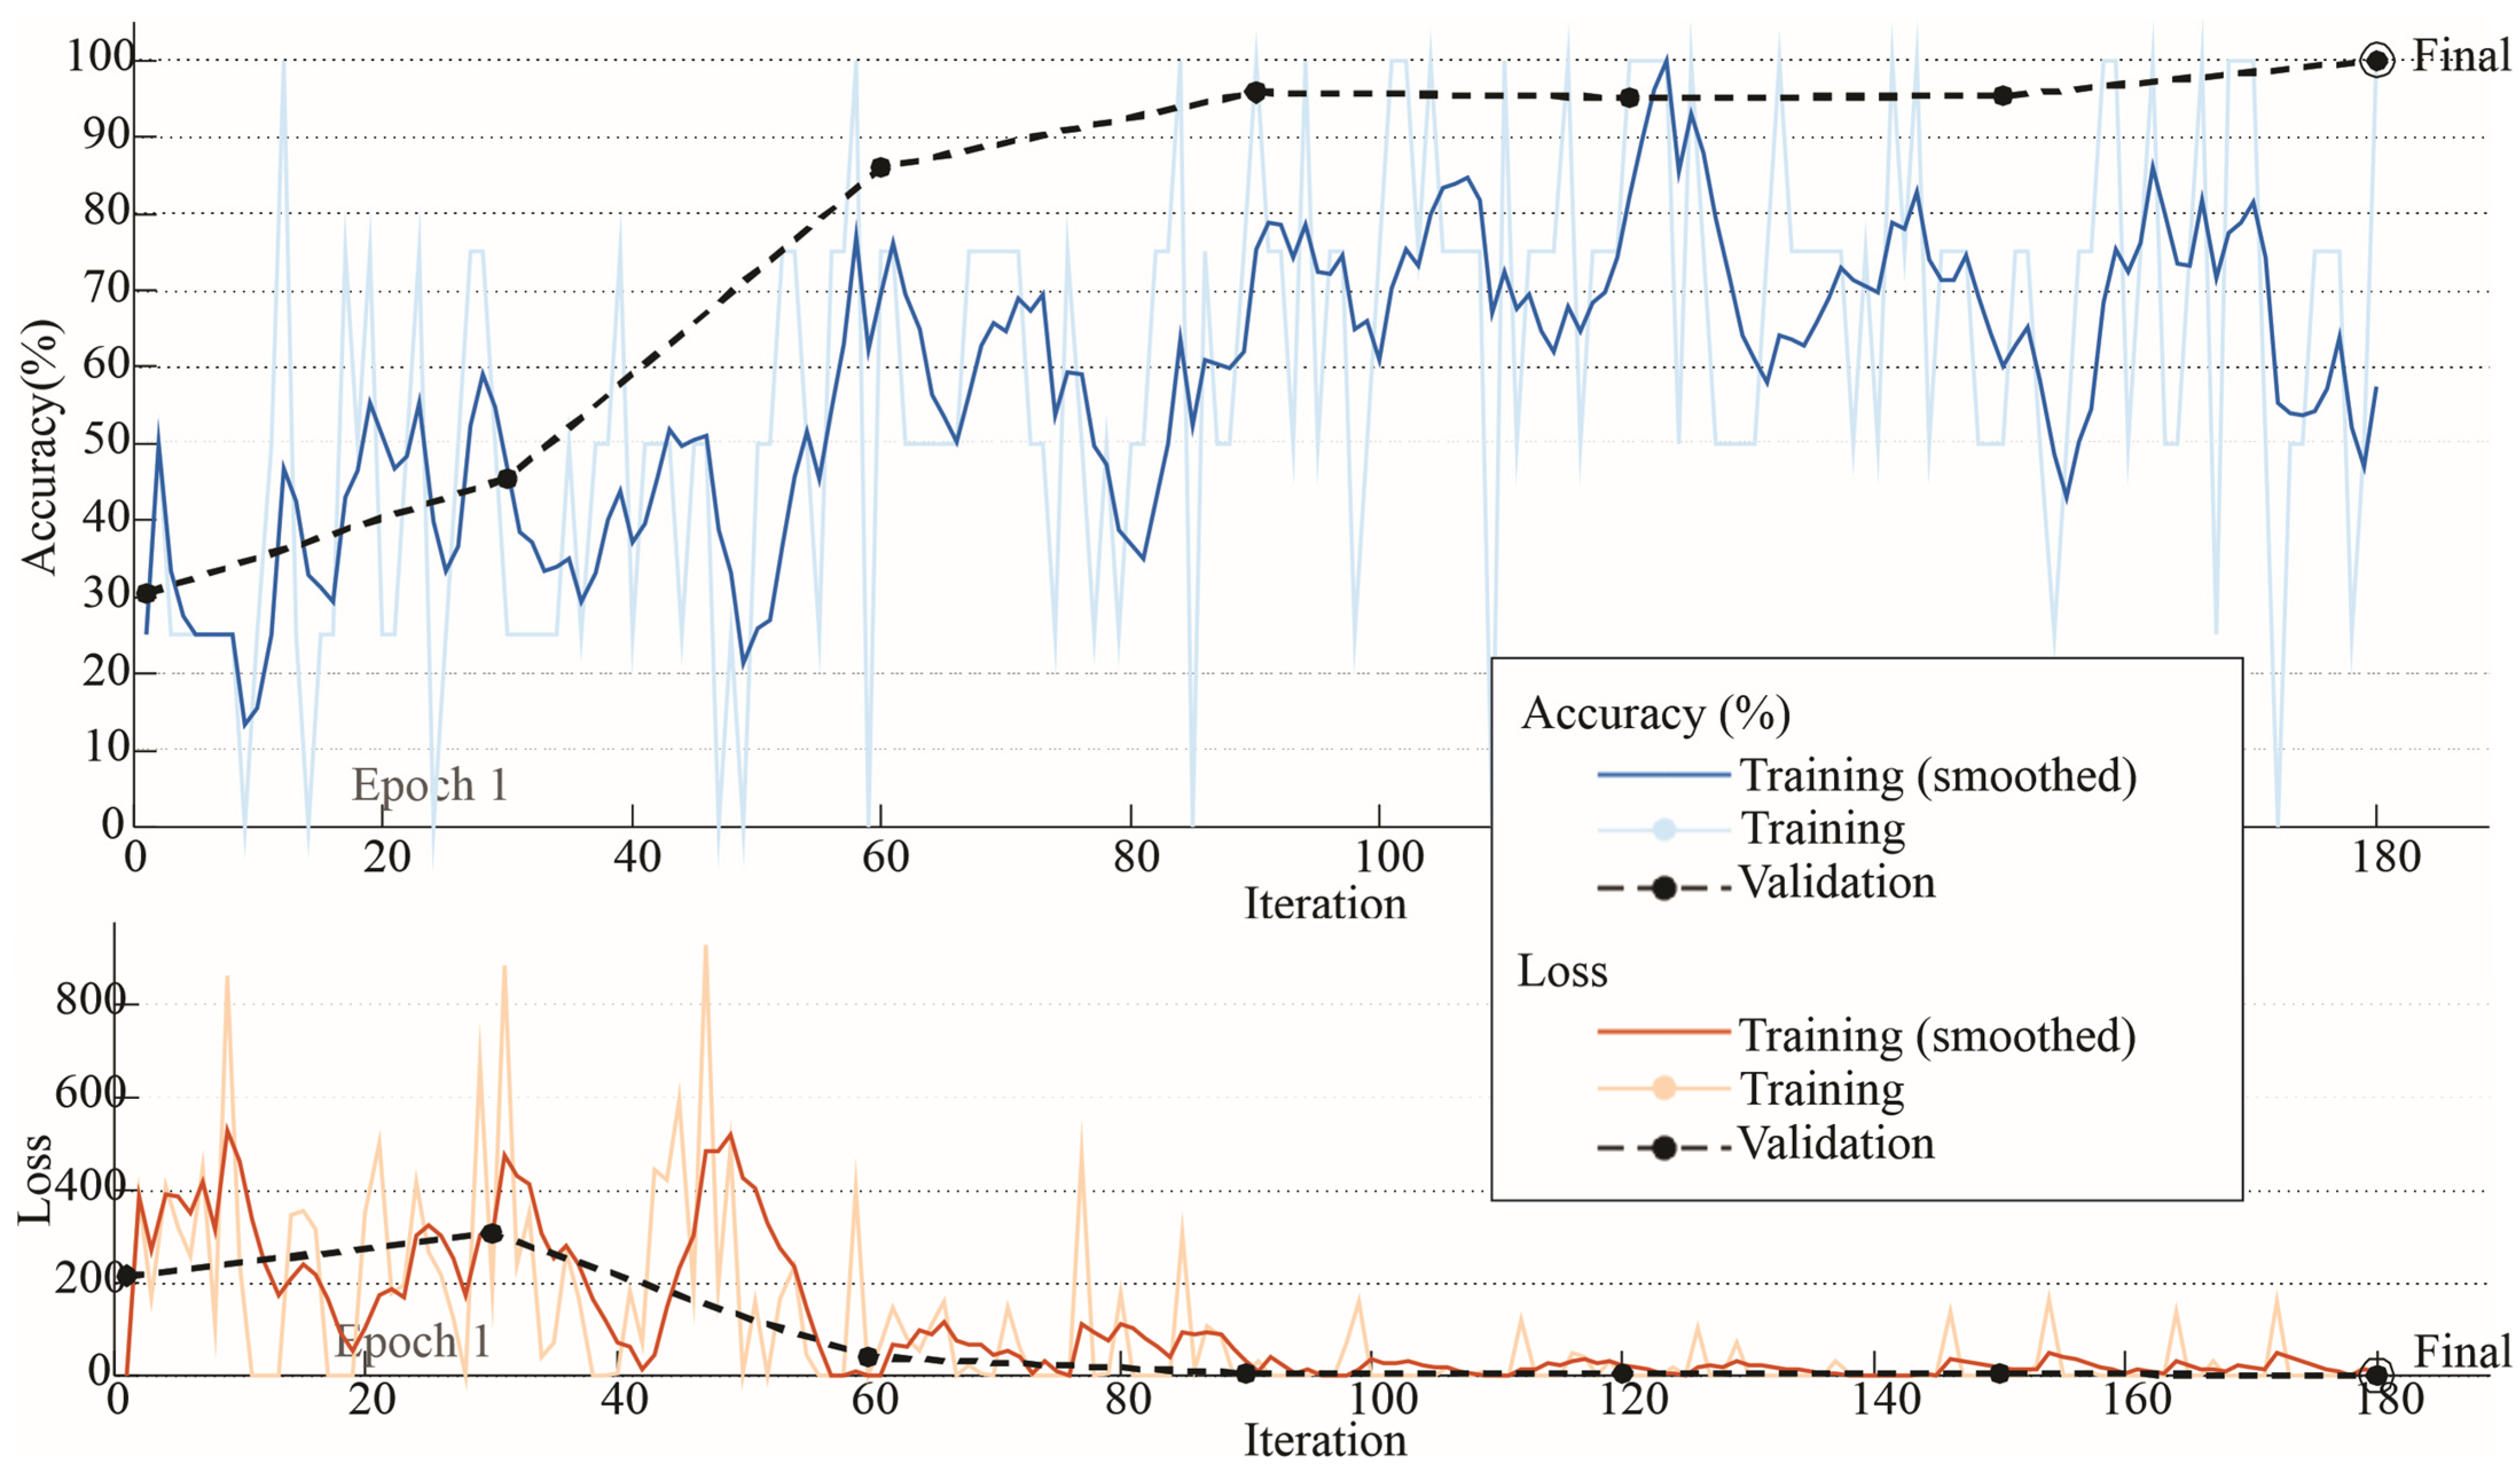
Additionally, to further illustrate the model’s learning dynamics for each axis at 3 rps, Figure 11, Figure 12 and Figure 13 display the corresponding training accuracy and loss curves for the X, Y, and Z axes, respectively. These visualizations help identify training stability and convergence behavior across axes under transient operating conditions. The plots for 12 rps were not included, as all configurations consistently achieved 100% accuracy, offering limited comparative insight.
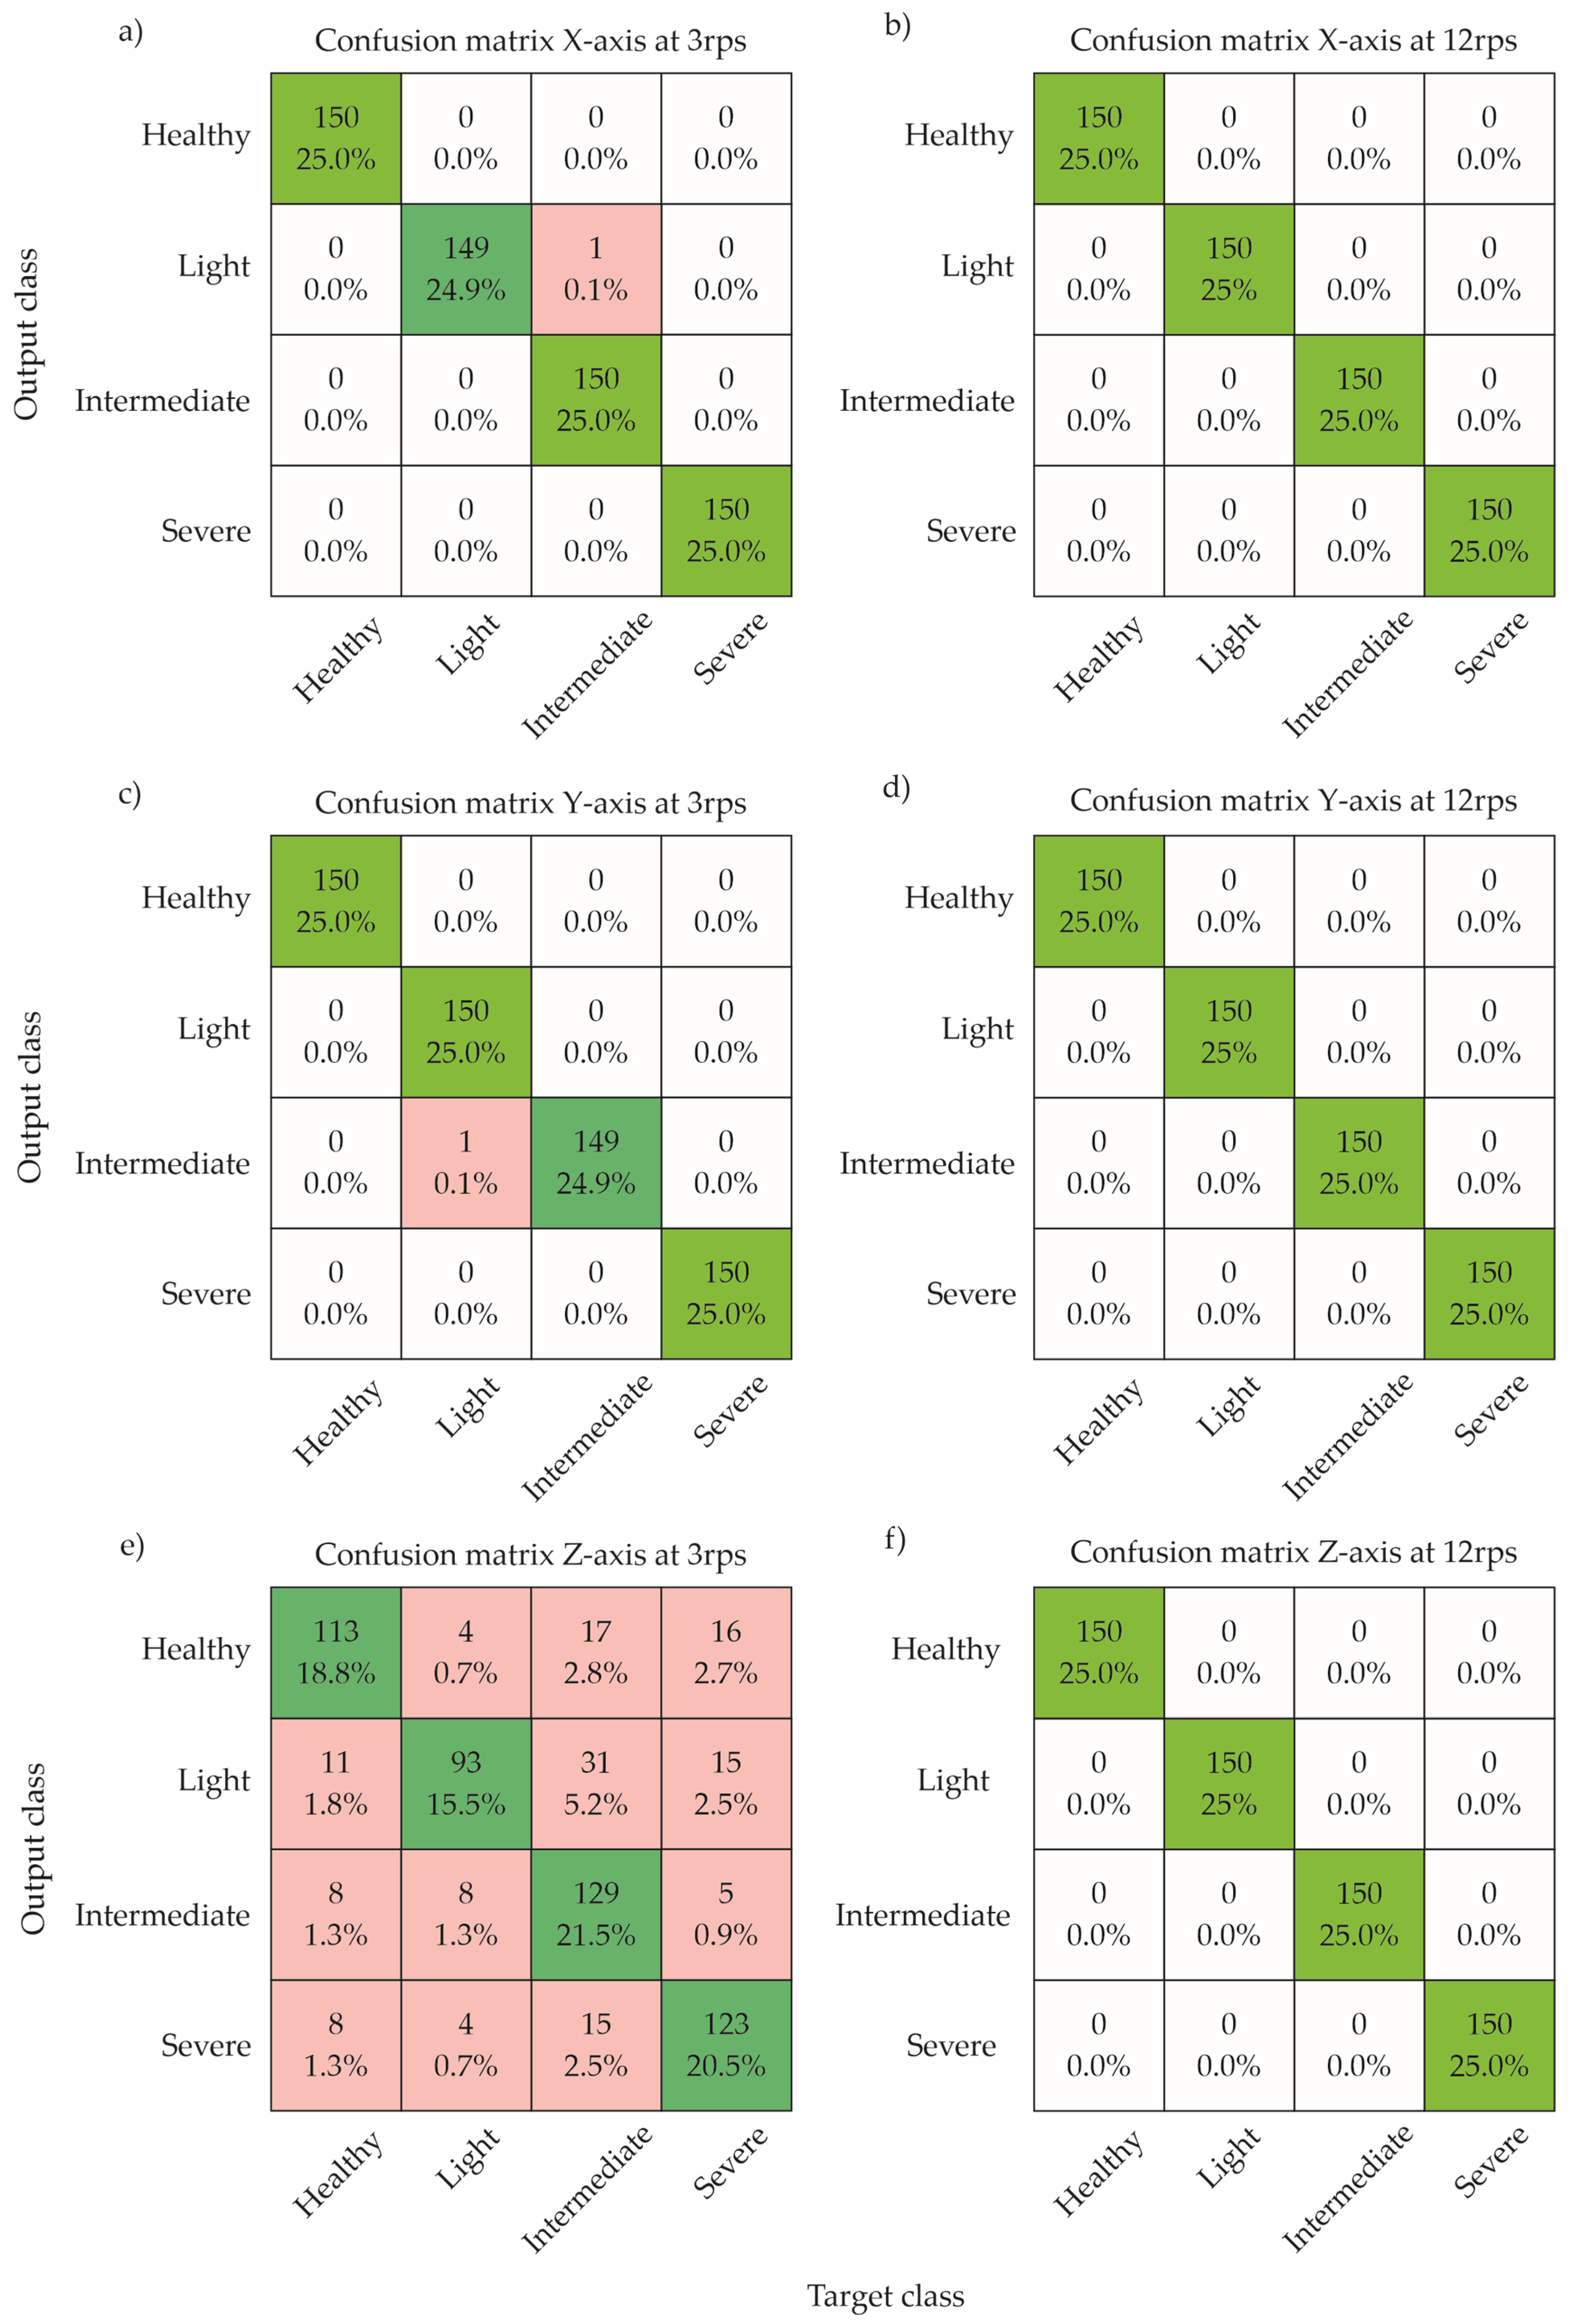
While the accuracy and loss graphs provide an overview of the model’s learning process, a deeper analysis of the classification performance is necessary to understand how well the CNN distinguishes between the different severity levels. To assess this, six confusion matrices are presented in Figure 14, corresponding to each axis (X, Y, and Z) under both operating speeds. Specifically: (a) X-axis at 3 rps, (b) X-axis at 12 rps, (c) Y-axis at 3 rps, (d) Y-axis at 12 rps, (e) Z-axis at 3 rps, and (f) Z-axis at 12 rps. These matrices provide a clearer view of the model’s classification performance across different axes and speeds.
The confusion matrices illustrate the number of correct and incorrect predictions for each class at both operating speeds, enabling the evaluation of the model’s performance in terms of false positives, false negatives, and classification accuracy per severity level. These visualizations offer insight into how consistently the model distinguishes between conditions, especially under varying operational scenarios, and help identify any areas where misclassification may occur, particularly between damage levels with similar characteristics. Preliminary tests with deeper CNN architecture were also conducted. However, they did not provide significant accurate improvements over the proposed single-layer model, which already achieved near-perfect results. This supports the choice of light yet effective architecture. Nevertheless, a detailed sensitivity analysis will be considered in future work to explore the scalability and optimization of the model as well as the use of more speeds applied to all three axes.
In general, the model demonstrated high precision across all axes. Notably, the confusion matrices revealed zero misclassifications for the X and Y axes. For the Z-axis at 3 rps, a few instances of confusion occurred between the intermediate and severe categories, reflecting the axis’s lower sensitivity at low speeds. These results confirm the effectiveness of the GAF-based CNN and suggest that axis selection is a key factor under transient conditions. Furthermore, these findings emphasize the robustness of the proposed method, while also highlighting areas where additional enhancement strategies such as preprocessing or axis fusion could further refine classification performance.
To further examine the contribution of the GAF transformation, an additional experiment was carried out in which CNNs were trained directly on the raw vibration signals, without the image conversion step. The classification accuracies obtained after 150 training iterations are presented in Table 3. As observed, the raw-signal approach yields consistently lower performance in all axes. For example, in the X axis the accuracy increases from 91.50% (raw) to 98.67% (with GAF), and in the Y axis from 85.33% to 100%. In the Z axis, which is less sensitive to this type of damage, the accuracy remains relatively low but still improves when using GAF (25.83% vs. 33.17%). These results confirm that the GAF representation provides discriminative features that enhance class separability, particularly in the most informative axes (X and Y).

5. Discussion

The results obtained in this study demonstrate the high potential of GAF-transformed vibration signals combined with CNNs for accurate damage detection in wind turbine blades. The model achieved a classification accuracy over 99.9% for two axes (X and Y), highlighting the effectiveness of this approach in identifying and distinguishing between different damage severity levels, including intermediate conditions that are often more challenging to characterize.
The success of the proposed model can be largely attributed to the GAF transformation, which converts raw vibration signals into structured 879×600-pixel images, enabling the CNN to automatically extract relevant features without manual feature engineering. By employing a compact and low-complexity CNN, consisting of a single hidden layer with only three filters, the approach achieves high classification accuracy while maintaining computational efficiency. This combination makes the model particularly suitable for online monitoring applications and deployment in systems with limited processing resources. Unlike conventional methods that depend heavily on expert interpretation and complex preprocessing, this methodology facilitates automated, robust, and efficient damage detection. The present study focused on controlled artificial damage to ensure repeatability; however, future research will include datasets involving naturally occurring cracks, which often exhibit more complex geometries, different locations, and propagation paths, allowing for the assessment of the model’s performance under more realistic and diverse operational conditions. Although a modal analysis of each damage scenario was not performed, the vibration measurements were obtained from the nacelle of the fully assembled wind turbine, enabling the capture of integrated structural responses. This configuration allowed for the detection of crack-related vibration signatures without requiring direct instrumentation of the blade surface; however, in future works, detailed modal analysis will be carried out.
Throughout the study, vibration signals from all three axes (X, Y, and Z) were analyzed to ensure a comprehensive assessment of the wind turbine’s dynamic behavior under different operational conditions. The results showed consistently high classification accuracies for the X and Y axes at both steady-state (12 rps) and startup (3 rps) speeds. However, the Z-axis exhibited a noticeable drop in performance during startup, likely due to lower amplitude responses at reduced speeds. These findings highlight the importance of multi-axis data acquisition and suggest that leveraging information from multiple directions can contribute to the development of more resilient and adaptable diagnostic models.
It is also noteworthy that no signal filtering techniques were applied prior to the GAF transformation. Future studies should investigate the potential benefits of advanced preprocessing methods, such as noise filtering and signal enhancement, to further improve classification performance, mainly for the Z-axis. Also, it is important to test a wider range of speed values. Future work will also explore the inclusion of intermediate rotational speeds to capture transitional dynamics, which may enhance fault detection, particularly for axes such as Z that exhibit reduced sensitivity at low speeds.
The high classification accuracy achieved in this research confirms that CNN-based models, such as the proposed GAF–CNN approach, can be highly effective for crack detection in wind turbines, including the classification of intermediate and severe damage levels. While this work did not include a direct experimental comparison with alternative methods on the same dataset, the results obtained provided a strong basis for future studies aimed at benchmarking the approach against other state-of-the-art techniques. This advancement represents a valuable contribution toward the development of fully automated and intelligent condition monitoring systems for wind turbines. Although the proposal is tested on small-scale wind turbines, the obtained results prove promising to scale its application to larger wind turbines. However, some limitations remain. The approach requires a large number of labeled images for effective training, which may not always be readily available in real-world scenarios. Additionally, while the model is computationally lightweight, the image generation process via GAF can be time-consuming when dealing with large-scale datasets or real-time processing. Future work could explore data augmentation strategies and optimization techniques to address these challenges, including both the GAF-based image size and the CNN-based classification model. These insights lay the groundwork for implementing low-cost, high-accuracy diagnostic systems in real-world wind energy applications. In addition to the current analysis, future research could benefit from statistical evaluations of vibration data, as well as exploration data analysis techniques such as cluster analysis and principal component analysis (PCA). These methods would allow for assessing the intrinsic structure and separability of the dataset prior to CNN training, providing complementary evidence of class distinctiveness.

6. Conclusions

This work presents a robust approach for the classification of structural damage in wind turbine blades by combining GAF representations of vibration signals with CNNs. The proposed method achieved a classification accuracy over 99.9% for two axes, effectively distinguishing between four severity levels: healthy, light, intermediate, and severe. These results confirm the model’s potential for deployment in automated structural health monitoring systems, particularly in small-scale wind turbines where manual inspections are often impractical or costly. Moreover, due to its scalability and low computational requirements, the methodology also shows promise for adaptation to larger wind turbine systems, expanding its applicability in real-world industrial settings.
In particular, the evaluation across different axes and operating speeds revealed important insights into the model’s robustness. Transforming raw vibration signals into image representations using GAF enhanced the CNN’s ability to automatically extract relevant features, eliminating the need for manual signal processing or complex descriptors. The proposed method demonstrated consistent performance across the three vibration axes (X, Y, and Z) at a steady-state operating speed of 12 rps, achieving an accuracy of 100% in all cases. However, at the startup speed of 3 rps, a drop in classification accuracy was observed for the Z-axis, decreasing to approximately 78%, while the X and Y axes maintained high performance. These results highlight the resilience of the method under varying operational conditions and the importance of axis selection in low-speed scenarios.
Future research should aim to expand the model’s generalization capabilities by incorporating vibration data from all three accelerometer axes. Although the Y-axis provided highly informative signals, a multi-axis fusion strategy may improve robustness, especially under varying operational conditions. Additionally, the exploration of advanced preprocessing methods, such as signal filtering and noise reduction, could further enhance the quality of the GAF images and the performance of the classification model, mainly for the Z-axis.
Finally, real-world validation in operational wind turbines is recommended to assess the model’s adaptability to real environmental conditions, including variable rotational speeds, blade aging effects, and different turbine configurations. Overall, the integration of GAF and CNNs offers a promising pathway toward intelligent, cost-effective, and reliable early fault detection in wind turbine systems.

Author Contributions

Conceptualization, A.H.R.-R. and M.V.-R.; methodology, A.H.R.-R., J.P.A.-S. and M.V.-R.; software, formal analysis, resources, and data curation, A.H.R.-R., D.G.-L., M.V.-R.; writing—review and editing, all authors; supervision, project administration, and funding acquisition, J.P.A.-S., D.C.-M., M.B.-L., and M.V.-R. All authors have read and agreed to the published version of the manuscript.

Funding

This work was supported by the “Fondo para el Fortalecimiento de la Investigación, Vinculación y Extensión (FONFIVE-UAQ 2025)” project.

Data Availability Statement

The data presented in this study are not publicly available.

Acknowledgments

We would like to thank the “Secretaria de Ciencia, Humanidades, Tecnología e Innovación (SECIHTI)—México” which partially financed this research under the scholarship 826907 given to A.H. Rangel-Rodriguez, and the scholarships 253732, 253652, 329800, and 296574, given to D. Granados-Lieberman, J. P. Amezquita-Sanchez, D. Camarena-Martinez, and M. Valtierra-Rodriguez, respectively, through the “Sistema Nacional de Investigadoras e Investigadores (SNII)–SECIHTI–México”.

Conflicts of Interest

The authors declare no conflicts of interest.

References

  1. Mishnaevsky, L., Jr. Root causes and mechanisms of failure of wind turbine blades: Overview. Materials 2022, 15, 2959. [Google Scholar] [CrossRef] [PubMed]
  2. Du, Y.; Zhou, S.; Jing, X.; Peng, Y.; Wu, H.; Kwok, N. Damage detection techniques for wind turbine blades: A review. Mech. Syst. Signal Process. 2020, 141, 106445. [Google Scholar] [CrossRef]
  3. Yang, W.; Peng, Z.; Wei, K.; Tian, W. Structural health monitoring of composite wind turbine blades: Challenges, issues and potential solutions. IET Renew. Power Gener. 2017, 11, 411–416. [Google Scholar] [CrossRef]
  4. Chandrasekhar, K.; Stevanovic, N.; Cross, E.J.; Dervilis, N.; Worden, K. Damage detection in operational wind turbine blades using a new approach based on machine learning. Renew. Energy 2021, 168, 1249–1264. [Google Scholar] [CrossRef]
  5. Ding, S.; Yang, C.; Zhang, S. Acoustic-signal-based damage detection of wind turbine blades—A review. Sensors 2023, 23, 4987. [Google Scholar] [CrossRef]
  6. Korolis, J.S.; Bourdalos, D.M.; Sakellariou, J.S. Machine Learning-Based Damage Diagnosis in Floating Wind Turbines Using Vibration Signals: A Lab-Scale Study Under Different Wind Speeds and Directions. Sensors 2025, 25, 1170. [Google Scholar] [CrossRef]
  7. Aranizadeh, A.; Shad, H.; Vahidi, B.; Khorsandi, A. A novel small-scale wind-turbine blade failure detection according to monitored-data. Results Eng. 2025, 25, 103809. [Google Scholar] [CrossRef]
  8. Raju, S.K.; Periyasamy, M.; Alhussan, A.A.; Kannan, S.; Raghavendran, S.; El-Kenawy, E.S.M. Machine learning boosts wind turbine efficiency with smart failure detection and strategic placement. Sci. Rep. 2025, 15, 1485. [Google Scholar] [CrossRef]
  9. Yang, C.; Ding, S.; Zhou, G. Wind turbine blade damage detection based on acoustic signals. Sci. Rep. 2025, 15, 3930. [Google Scholar] [CrossRef] [PubMed]
  10. Ogaili, A.A.F.; Jaber, A.A.; Hamzah, M.N. A methodological approach for detecting multiple faults in wind turbine blades based on vibration signals and machine learning. Curved Layer. Struct. 2023, 10, 20220214. [Google Scholar] [CrossRef]
  11. García Márquez, F.P.; Segovia Ramírez, I.; Mohammadi-Ivatloo, B.; Marugán, A.P. Reliability Dynamic Analysis by Fault Trees and Binary Decision Diagrams. Information 2020, 11, 324. [Google Scholar] [CrossRef]
  12. Xiaoxun, Z.; Xinyu, H.; Xiaoxia, G.; Xing, Y.; Zixu, X.; Yu, W.; Huaxin, L. Research on crack detection method of wind turbine blade based on a deep learning method. Appl. Energy 2022, 328, 120241. [Google Scholar] [CrossRef]
  13. Guo, J.; Liu, C.; Cao, J.; Jiang, D. Damage identification of wind turbine blades with deep convolutional neural networks. Renew. Energy 2021, 174, 122–133. [Google Scholar] [CrossRef]
  14. Memari, M.; Shakya, P.; Shekaramiz, M.; Seibi, A.C.; Masoum, M.A. Review on the advancements in wind turbine blade inspection: Integrating drone and deep learning technologies for enhanced defect detection. IEEE Access 2024, 12, 33236–33282. [Google Scholar] [CrossRef]
  15. Valtierra-Rodriguez, M.; Rivera-Guillen, J.R.; Basurto-Hurtado, J.A.; De-Santiago-Perez, J.J.; Granados-Lieberman, D.; Amezquita-Sanchez, J.P. Convolutional neural network and motor current signature analysis during the transient state for detection of broken rotor bars in induction motors. Sensors 2020, 20, 3721. [Google Scholar] [CrossRef]
  16. Zhang, Q.; Qi, Z.; Cui, P.; Xie, M.; Din, J. Detection of single-phase-to-ground faults in distribution networks based on Gramian Angular Field and Improved Convolutional Neural Networks. Electr. Power Syst. Res. 2023, 221, 109501. [Google Scholar] [CrossRef]
  17. Zhou, Y.; Long, X.; Sun, M.; Chen, Z. Bearing fault diagnosis based on Gramian angular field and DenseNet. Math. Biosci. Eng. 2022, 19, 14086–14101. [Google Scholar] [CrossRef] [PubMed]
  18. Spajić, M.; Talajić, M.; Pejić Bach, M. Harnessing Convolutional Neural Networks for Automated Wind Turbine Blade Defect Detection. Designs 2024, 9, 2. [Google Scholar] [CrossRef]
  19. Hau, E.; Von Renouard, H. Wind turbines: Fundamentals, technologies, application, economics. In Wind Turbines; Springer Science & Business Media: Berlin/Heidelberg, Germany, 2013. [Google Scholar]
  20. Rangel-Rodriguez, A.H.; Granados-Lieberman, D.; Amezquita-Sanchez, J.P.; Bueno-Lopez, M.; Valtierra-Rodriguez, M. Analysis of vibration signals based on machine learning for crack detection in a low-power wind turbine. Entropy 2023, 25, 1188. [Google Scholar] [CrossRef]
  21. Xu, J.; Ding, X.; Gong, Y.; Wu, N.; Yan, H. Rotor imbalance detection and quantification in wind turbines via vibration analysis. Wind. Eng. 2021, 46, 3–11. [Google Scholar] [CrossRef]
  22. Han, Y.; Li, B.; Huang, Y.; Li, L. Bearing fault diagnosis method based on Gramian angular field and ensemble deep learning. J. Vibroeng. 2023, 25, 42–52. [Google Scholar] [CrossRef]
  23. Li, Y.D.; Hao, Z.B.; Lei, H. Survey of convolutional neural network. J. Comput. Appl. 2016, 36, 2508–2515. [Google Scholar]
  24. Zhang, J.; Li, H.; Song, W.; Zhang, J.; Shi, M. STCYOLO: Subway Tunnel Crack Detection Model with Complex Scenarios. Information 2025, 16, 507. [Google Scholar] [CrossRef]
Figure 1. GAF image representation: (a) original vibration signal, (b) normalized signal, and (c) resulting GAF image.
Information 16 00775 g001
Figure 2. Convolutional Neural Network.
Information 16 00775 g002
Figure 3. Proposed methodology.
Information 16 00775 g003
Figure 4. Experimental setup.
Information 16 00775 g004
Figure 5. Dimensioned drawing of the blade showing (a) the blade plane and (b) the cross-section of the blade at the location of the damage.
Information 16 00775 g005
Figure 6. Vibrations of each condition from Y-axis: (a) healthy, (b) light, (c) Intermediate, and (d) severe.
Information 16 00775 g006
Figure 7. Comparative boxplot.
Information 16 00775 g007
Figure 8. X-axis GAF image process (a) vibration signal, (b) the normalized signal, (c) the GAF-generated image, and (d) image input to CNN.
Information 16 00775 g008
Figure 9. Y-axis GAF image process (a) vibration signal, (b) the normalized signal, (c) the GAF-generated image, and (d) image input to CNN.
Information 16 00775 g009
Figure 10. Z-axis GAF image process (a) vibration signal, (b) the normalized signal, (c) the GAF-generated image, and (d) image input to CNN.
Information 16 00775 g010
Figure 11. Accuracy and Loss Graph Y-axis.
Information 16 00775 g011
Figure 12. Accuracy and Loss Graph X-axis.
Information 16 00775 g012
Figure 13. Accuracy and Loss Graph Z-axis.
Information 16 00775 g013
Figure 14. Confusion matrices by axis and speed: (a) X-3 rps, (b) X-12 rps, (c) Y-3 rps, (d) Y-12 rps, (e) Z-3 rps, (f) Z-12 rps.
Information 16 00775 g014
Table 1. Number of vibration signal tests from each speed.
Damage ConditionNumber of Tests from X-AxisNumber of Tests from Y-AxisNumber of Tests from Z-Axis
Healthy100010001000
Light100010001000
Intermediate100010001000
Severe100010001000
Table 2. Accuracy per speed.
SpeedX-Axis AccuracyY-Axis AccuracyZ-Axis Accuracy
3 rps99.9%99.9%78%
12 rps100%100%100%
Table 3. Comparison between CNN trained with raw vibration signals and CNN with GAF transformation.
AxisRaw SignalWith GAF
X91.50%98.67%
Y85.33%100%
Z25.83%33.17%
Disclaimer/Publisher’s Note: The statements, opinions and data contained in all publications are solely those of the individual author(s) and contributor(s) and not of MDPI and/or the editor(s). MDPI and/or the editor(s) disclaim responsibility for any injury to people or property resulting from any ideas, methods, instructions or products referred to in the content.