Abstract
Glaucoma is an irreversible neurodegenerative disease that affects the optic nerve, leading to partial or complete vision loss. Early and accurate detection is crucial to prevent vision impairment, which necessitates the development of highly precise diagnostic tools. Deep learning (DL) has emerged as a promising approach for glaucoma diagnosis, where the model is trained on datasets of fundus images. To improve the detection accuracy, we propose a hybrid model for glaucoma detection that combines multiple DL models with two fine-tuning strategies and uses a majority voting scheme to determine the final prediction. In experiments, the hybrid model achieved a detection accuracy of 96.55%, a sensitivity of 98.84%, and a specificity of 94.32%. Integrating datasets was found to improve the performance compared to using them separately even with transfer learning. When compared to individual DL models, the hybrid model achieved a 20.69% improvement in accuracy compared to the best model when applied to a single dataset, a 13.22% improvement when applied with transfer learning across all datasets, and a 1.72% improvement when applied to all datasets. These results demonstrate the potential of hybrid DL models to detect glaucoma more accurately than individual models.
1. Introduction
Glaucoma is a chronic and progressive neuropathy that affects the optic nerve and leads to gradual and irreversible vision loss [1]. By 2040, more than 11 million cases of glaucoma are projected worldwide [2,3]. Interventions such as medication or surgery can significantly improve the quality of life and delay disease progression, but they rarely alter the long-term prognosis [4]. Because glaucoma can be treated in its early stages, timely diagnosis can help prevent blindness [3,5]. Traditionally, glaucoma is diagnosed through clinical tests, such as ophthalmoscopy, fundus photography, nerve fiber layer evaluation, pachymetry, and tonometry [6]. These procedures rely heavily on the expertise of ophthalmologists, are subject to inter-observer variability, and require expensive, non-portable equipment and specialized infrastructure, which limits their use in resource-constrained settings. Furthermore, their diagnostic performance remains moderate, with reported average sensitivity around 70% [7]. Therefore, alternative diagnostic methods are needed that are rapid, accessible, accurate, and low in cost. Automated systems for glaucoma diagnosis have been developed where machine learning (ML) [8,9] or deep learning (DL) [10,11] models are trained on fundus images and have achieved high levels of accuracy, often surpassing the performance of traditional clinical tests. However, such systems still require improvement because of the number of DL models and preprocessing techniques that have not yet been fully evaluated. The limitations of DL models have also been observed in other applications [12], such as bruising-date estimation [13], diabetic retinopathy [14,15], and lung cancer diagnosis [16]. A promising approach to improving the performance of ML and DL models is to use a hybrid model, which generally outperforms individual models [17].
We propose a hybrid model for glaucoma diagnosis that integrates multiple DL models with two fine-tuning strategies and implements a majority voting scheme to determine the final prediction. The fine-tuning strategies were designed to optimize the model performance across different datasets. The proposed hybrid model was implemented using Keras and TensorFlow and was validated against five public datasets with a total of 1707 fundus images.
This research builds upon the results presented in the bachelor’s theses of Nahum Flores and José La Rosa, defended at the National University of San Marcos (UNMSM) in 2022. The current study extends their preliminary work by integrating clinical validation, optimizing the model architecture, and deploying a cross-platform application for real-time glaucoma screening.
2. Related Work
Artificial intelligence (AI) is the field of computer science dedicated to creating systems that simulate human intelligence [18,19]. ML is a branch of AI in which a computer system learns to perform a task based on patterns obtained from input data without being explicitly programed [20,21]. In medical applications, these tasks can include diagnosing diseases such as glaucoma. Figure 1 shows the workflow used by most ML models for glaucoma diagnosis: preprocessing, feature extraction, feature selection, and classification [9,22,23,24,25,26,27,28,29,30,31,32].

Figure 1.
Workflow for glaucoma diagnosis by a ML model.
Preprocessing techniques include median filtering and histogram equalization [22], contrast-limited adaptive histogram equalization (CLAHE) [24], and region of interest (ROI) cropping [28]. Feature extraction methods include wavelet transform [29,30], GIST descriptors, which are global scene representations that capture the overall spatial layout and texture of an image by summarizing orientation and frequency information through Gabor filter responses [24], and local binary pattern (LBP) [27]. Feature selection methods include genetic algorithms [22], principal component analysis, and Student’s t-test. Classification methods include support vector machines (SVMs) [22,23,24,25,26,27], random forests [28], and decision trees [31].
DL is a branch of ML that incorporates computational models and algorithms to mimic the biological structure of the brain [33]. A specific type of DL is the convolutional neural network (CNN) [34], which comprises a series of processing layers resembling the electrophysiological processes of the visual cortex, where each cortical neuron responds to a specific part of the visual receptive field. Similarly, an artificial neuron or node responds to a specific element of the input data [35]. As shown in Figure 2, a multilayer perceptron (MLP), can be divided into an input layer, an output layer, and several hidden layers. The hidden layers typically comprise convolutional, pooling, and fully connected layers, which are more fully described in Figure 3 [17].
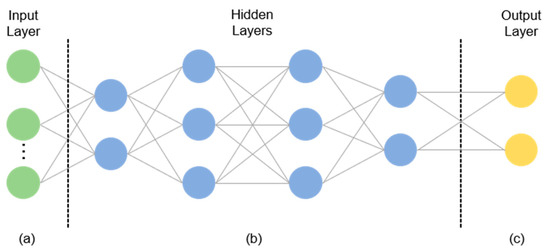
Figure 2.
General structure of an MLP: (a) the input layer specifies the width, height, and channels of the input image; (b) hidden layers extract features; (c) the output layer produces the classification result.
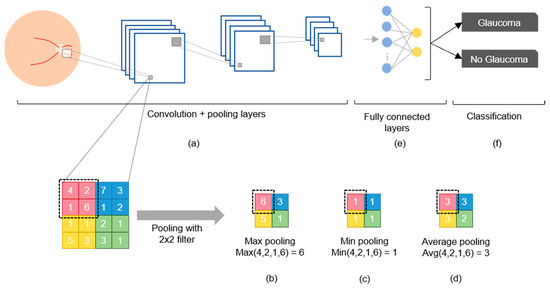
Figure 3.
Components of a CNN: (a) Convolution and pooling layers; (b) max pooling selects the highest value; (c) min pooling selects the lowest value; (d) average pooling selects the average value; (e) fully connected nodes after convolution; (f) classification.
The convolutional layer is the fundamental component of a CNN because it transforms the input data by applying a set of filters (also called kernels) that serve as feature detectors. This filter slides over the input image to produce a feature map as the output, which then undergoes an additional operation called an activation function (e.g., ReLU or softmax) after each convolution operation (Figure 3a) [17,34]. The pooling layer is used to reduce dimensionality and retain the most important high-level features via max pooling (Figure 3b), min pooling (Figure 3c), or average pooling (Figure 3d) [36]. Fully connected layers (Figure 3e) use the high-level features to classify the input image into several classes based on the training dataset (Figure 3f) [21]. After classification, backpropagation is performed to compute the network weights, and this process is repeated many times until the network eventually learns the optimal weights for each node to improve the classification performance [37]. However, the CNN may “memorize” the training data, which means that it cannot be generalized to unseen data. This issue can be addressed by using the early stopping algorithm [38] or dropout algorithms [39].
DL models include AlexNet with five convolutional layers [40]; VGGnet with 16–19 convolutional layers; Inception V1–V4 with 27 convolutional layers; ResNet with 18, 50, and 125 convolutional layers; and DenseNet with 40, 100, 121, and 169 convolutional layers [17]. The performance of a DL model is generally evaluated by using the ImageNet dataset, which comprises more than 1000 categories and 1.2 million images [41]. Compared to AlexNet, recent DL models have achieved better performances owing to unique features such as additional layers, smaller convolutional filters, skip connections, and more complex filters [17,42].
Table 1 summarizes various studies that have applied DL to glaucoma diagnosis and their results. Ahn et al. [43] evaluated a transfer-learned Inception v3 on 1542 fundus images from Kim Eye Hospital (South Korea), reporting 84.5% accuracy and an AUC of 0.93. Raghavendra et al. [44] used an 18-layer CNN trained on 1426 images from Kasturba Medical College (India), achieving 98.13% accuracy, 98.0% sensitivity, and 98.3% specificity. Chai et al. [45] implemented a multi-branch neural network on 2554 images from the same institution, obtaining 91.51% accuracy, 92.33% sensitivity, and 90.90% specificity. Díaz-Pinto et al. [46] fine-tuned VGG19 using 1707 images from ACRIMA, HRF, Drishti-GS1, RIM-ONE, and sjchoi86-HRF, reaching 90.69% accuracy, 92.40% sensitivity, and 88.46% specificity. Hemelings et al. [47] combined transfer and active learning with ResNet-50 on 8433 images from Belgian hospitals, obtaining 95.6% sensitivity, 92.0% specificity, and an AUC of 0.986. Xu et al. [48] proposed TIA-Net, an attention-based model trained on 10,463 images from Beijing Tongren Eye Center, and reported 85.70% accuracy, 84.90% sensitivity, and 86.9% specificity. Ubochi et al. [11] compared a vanilla CNN trained on 1310 images from ACRIMA and ORIGA, achieving 89.0% accuracy and 88.0% sensitivity. Finally, D’Souza et al. [49] introduced AlterNet-K, a compact ResNet + attention model trained on 113,893 EyePACS-AIROGS images, reporting 91.6 % accuracy, 90.7 % sensitivity, and an AUC of 0.968. These works demonstrate that transfer learning, attention mechanisms, and domain-knowledge fusion are key drivers in DL-based glaucoma screening.

Table 1.
DL models for glaucoma diagnosis.
3. Materials and Methods
Figure 4 shows the workflow used to develop and validate the proposed hybrid model, which had eight steps. We integrated several processes that have been used in various studies to diagnose glaucoma and other diseases [43,44,45,46,47].

Figure 4.
The workflow used to develop and validate the proposed hybrid model for glaucoma diagnosis.
3.1. Dataset Integration
DL models have been shown to perform better with larger datasets [17,33,34]. Therefore, we integrated multiple glaucoma datasets to enhance the diagnostic accuracy. In addition, the proportions of each dataset allocated to training and testing were set to ensure the robustness of the validation results. Table 2 lists the five public glaucoma datasets that were utilized in this study and are commonly referenced in the literature: HRF [50], Drishti-GS1 [51], sjchoi86-HRF [52], RIM-ONE [53], and ACRIMA [11,46]. Collectively, these datasets contain 1707 fundus images, of which 788 are normal and 919 are glaucomatous.

Table 2.
Datasets used for glaucoma diagnosis.
3.2. DL Model Identification and Fine Tuning
The proposed hybrid model was built by integrating multiple DL models and fine-tuning strategies that have demonstrated strong results in the literature and are widely available to streamline implementation. We considered 12 pretrained DL models: three in the literature (Table 1) and nine additional models available through the Keras API [42], all of which were originally trained on the ImageNet dataset. To optimize these models for the glaucoma diagnosis, we applied two fine-tuning strategies based on the work by Diaz and Pinto [46], resulting in 24 variations. Figure 5 shows the two strategies, which were selected because of their proven effectiveness at enhancing the medical image classification performance of DL models. Strategy 1 (Figure 5a) has a global average pooling layer (GlobalAveragePooling2D) followed by a fully connected layer with two output nodes (glaucoma and normal) using a softmax activation function (AF). Strategy 2 (Figure 5b) has a more complex structure: a flatten layer is followed by a dense layer with 256 nodes using a ReLU AF, a dropout layer, another dense layer with 128 nodes, an additional dropout layer, and a fully connected layer with two output nodes using a softmax AF. Table 3 lists the Keras layers of the selected models with each strategy.
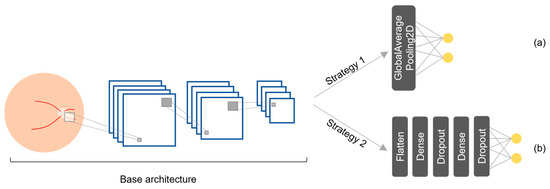
Figure 5.
Fine-tuning strategies for the DL models: (a) strategy 1 and (b) strategy 2.

Table 3.
Models and Keras layers with fine-tuning strategies.
3.3. Hybrid Model
The classification performance for medical images can be improved by combining multiple DL models [17]. In this study, we employed a majority voting strategy with equal weights rather than a weighted scheme, based on practical and clinical considerations (Figure 6). First, this approach is easier to deploy and maintain across healthcare institutions, as it avoids the need to recalibrate voting weights whenever the dataset is updated or expanded, simplifying the integration of new data [54]. Second, majority voting offers greater transparency: each final decision can be traced to a simple consensus among individual models, which aligns with common clinical decision-making practices and facilitates explainability through well-established methods, such as SHAPs (SHapley Additive exPlanations) and PDPs (Partial Dependence Plots), which help reveal how input features influence model predictions [55]. Furthermore, evidence from ophthalmic imaging supports the effectiveness of this strategy. In a study on scanning laser ophthalmoscopy images, majority voting achieved significantly better classification results than weighted voting, particularly in scenarios with limited training data [56]. Similarly, in a glaucoma screening task using retinal images, an ensemble model based on equal-probability soft voting improved sensitivity without sacrificing specificity [57]. Based on these findings, we selected majority voting for its balance between performance, simplicity, and interpretability in the context of automated glaucoma detection.
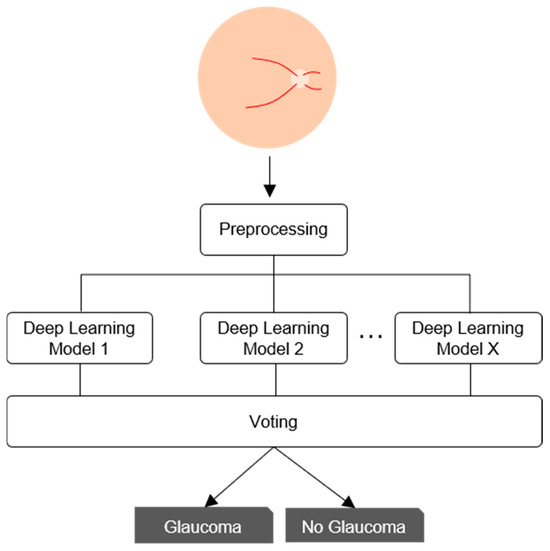
Figure 6.
Voting scheme of the proposed hybrid model.
3.4. Preprocessing
Preprocessing is important for improving the performance of DL models because a high image resolution directly affects the training time [58,59,60]. Preprocessing steps include cropping a fundus image centered on the optic disk, resizing the image, and data augmentation. As shown in Figure 7, the HRF [50], Drishti-GS1 [51], and sjchoi86-HRF [52] datasets, were manually cropped by ophthalmologists, using the optic disk radius to extract a square region with a side length three times that value. In contrast, the RIM-ONE [53] and ACRIMA [11,46] datasets already consisted of cropped optic disk images and were used as provided. All images were then resized to match the default input size of each model, as given in Table 4. Performance enhancement techniques such as CLAHE were not applied because they do not guarantee an improved classification performance [61]. As shown in Figure 8, we also used data augmentation to increase the number of images and reduce overfitting. The applied transformations included horizontal flip, vertical flip, combined horizontal and vertical flip, 30° rotation, and 1.2× magnification. These transformations were applied while maintaining their labels [62].
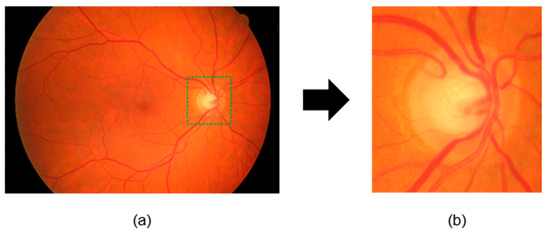
Figure 7.
Preprocessing of fundus images: (a) original image; (b) resized and cropped image to 1.5 times the radius of the optic disk.

Table 4.
Input image sizes for each model.
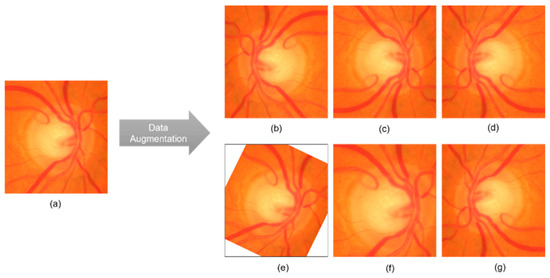
Figure 8.
Examples of data augmentation: (a) original cropped and rescaled image; (b) horizontal flip; (c) vertical flip; (d) horizontal and vertical flip; (e) 30° rotation; (f) 1.2× magnification; (g) vertical and horizontal flip.
3.5. Performance Metrics
Commonly used performance metrics in medical image analysis include the sensitivity (Sen), specificity (Esp), and accuracy (Acc) [63]. In this study, we defined a true positive (TP) as a glaucomatous image that is correctly classified, a true negative (TN) as a normal image that is correctly classified, a false negative (FN) as a glaucomatous image that is classified as normal, and a false positive (FP) as a normal image that is classified as glaucomatous. Thus, we defined the sensitivity as the percentage of images correctly classified as glaucomatous:
We defined the specificity as the percentage of images correctly classified as normal:
Finally, we defined the accuracy as the percentage of correctly classified images:
To ensure the reliability of the performance evaluation, we used the k-fold cross-validation technique (k = 10) [46].
3.6. Training and Testing
Figure 9 shows our evaluation scheme for training, validating, and testing each DL model. We followed a systematic approach to execute multiple experiments and achieve optimal results. Each experiment corresponded to a different configuration of model hyperparameters, which are given in Table 5. Different training scenarios were formulated to evaluate the impacts of using multiple datasets, transfer learning, and other factors. The evaluation scheme was applied to each selected model with both fine-tuning strategies (Table 3) using the model hyperparameters (Table 5) for three different scenarios, which resulted in 216 experiments in total.
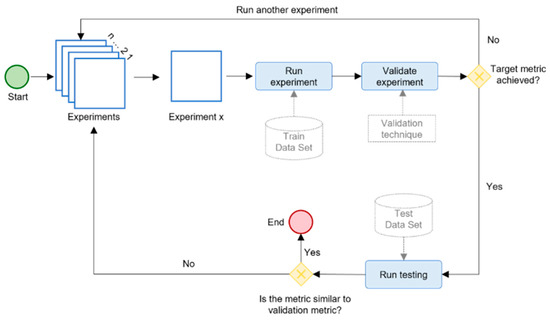
Figure 9.
The evaluation schema for the hybrid DL model.

Table 5.
Training parameters for each scenario.
Figure 10 shows the three training scenarios tested in this study to analyze the impact of different factors. Scenario 1 (Figure 10a) analyzed the impact of different and larger testing sets. Each model was trained with 90% of a dataset, after which two tests were performed. Test 1 measured the effectiveness of the trained models when applied to the unused data (i.e., remaining 10%) of the same dataset. Test 2 measured the effectiveness of the trained models when applied to the unused data (i.e., remaining 10%) of all five datasets. Scenario 2 (Figure 10b) analyzed the impact of transfer learning through a successive fine-tuning strategy. First, each model was trained on a combined set consisting of 90% of the HRF and sjchoi86-HRF datasets. Using the resulting weights, the model was then fine-tuned on a new combined set comprising 90% of the Drishti-GS1 and RIM-ONE datasets. Finally, transfer learning was applied once more by fine-tuning the model on 90% of the ACRIMA dataset. This progressive approach allowed the model to gradually adapt to increasingly heterogeneous data. After the final fine-tuning stage, all models were evaluated using the remaining 10% of all five datasets. Scenario 3 (Figure 10c) analyzed the impact of combining multiple datasets. Each model was trained on a combined set integrating 90% of all five datasets and was then tested on the remaining 10% of data.
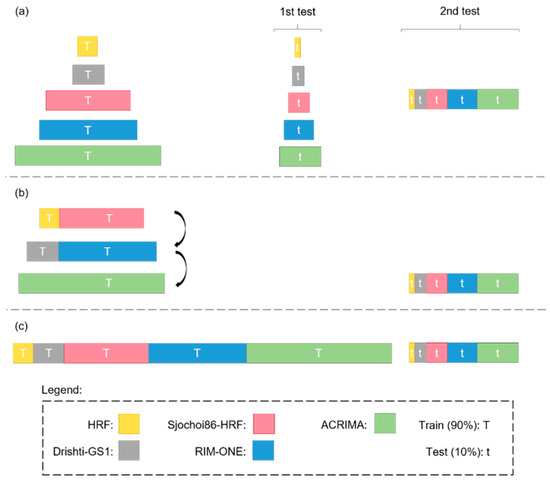
Figure 10.
Training scenarios for the DL models: (a) 1, (b) 2, and (c) 3.
3.7. Implementation
DL models are commonly built using modern frameworks such as TensorFlow, PyTorch, and Keras, which offer high-level APIs and GPU support for efficient training. The choice of platform often depends on deployment simplicity, community support, and integration with existing infrastructure. Additionally, it is important to consider whether the hardware is local or cloud-based. For example, a cloud-based implementation could allow for the inclusion of an intelligent system that can be accessed via the Web or a mobile device from anywhere with Internet access. In this study, we implemented the DL models by using Python 3.6, Keras 2.4.3, and TensorFlow 2.4.0 on Google Colab [64] with a 2.3 GHz Xeon CPU, 13 GB RAM, and 16 GB NVIDIA Tesla V100 GPU. The total execution time for all experiments was around 350 h. As shown in Figure 11, we also used IONIC 8 and Django 4.2 to develop a cross-platform application that allows users to obtain a diagnosis by uploading a fundus image. Our model, along with the source code of the cross-platform application and the links to download the five public datasets, are available in the following GitHub repository: https://github.com/NahumFGz/DLG-C22200401 (accessed on 1 July 2025). This repository includes Python scripts used for training and evaluation, configuration files, the IONIC front-end code, and the Django back-end implementation. Detailed instructions are provided to enable full reproducibility of the experiments.
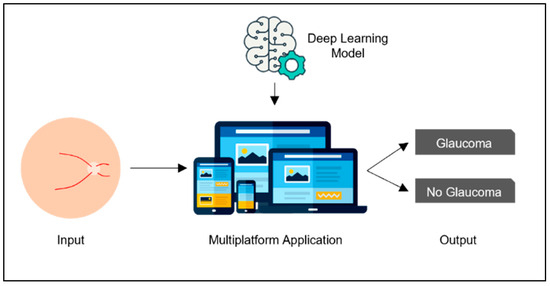
Figure 11.
General description of our application.
3.8. Results
The models were evaluated according to the performance metrics for each scenario. For clarity, we used the notation ModelName_m1 and ModelName_m2 to distinguish between the same model using fine-tuning strategies 1 and 2, respectively (Figure 5). The results of the individual models were then compared against the results of the hybrid model implementing the majority voting scheme. The notation voting N means that the hybrid model incorporated N models with the best accuracy among the 24 models considered.
4. Results and Discussion
4.1. Effects of Training Scenarios
Table 6 and Table 7 present the results for training with separate datasets (scenario 1). Across the three performance metrics, the performance of a DL model trained on a single dataset decreased by an average of 16.94% from test 1 (using the remaining data from the same dataset) to test 2 (using data from other datasets). Thus, DL models trained on a single dataset were less reliable than those trained on multiple datasets. The performance of the DL models improved with larger and more heterogeneous datasets.

Table 6.
Results for scenario 1 in test 1.

Table 7.
Results for scenario 1 in test 2.
Table 8 presents the results for scenarios 2 and 3. A comparison using the ACRIMA dataset showed that transfer learning (scenario 2) improved the results of each DL model by an average of 9.27% compared with scenario 1 (test 2 (Table 7)). This result is consistent with other studies [12,43,47]. Therefore, transfer learning is recommended to improve the training performance of DL models.

Table 8.
Results for scenarios 2 and 3.
Finally, training with an integrated dataset (scenario 3) yielded better results than training with separate datasets (scenario 1) or transfer learning (scenario 2) with improvements of 23.85% and 18.13%, respectively. This result aligns with several studies showing that larger datasets lead to better results [17,33,34,46]. Moreover, greater heterogeneity (i.e., multiple datasets) results in better generalization and thus better outcomes. Therefore, integrating multiple datasets is recommended for DL models.
4.2. Performance of the Hybrid Model
The results for the different training scenarios (Table 6, Table 7 and Table 8) showed that the best results were obtained by using an integrated dataset (i.e., scenario 3). In this scenario, the best DL model was ResNet50 with fine-tuning strategy 1, which achieved an accuracy of 94.83%, a sensitivity of 98.84%, and a specificity of 90.91%. Table 9 presents the results for the hybrid model. It yielded better results than individual DL models across all scenarios, and the best results were achieved with Voting 3 and Voting 5. Voting 3 (i.e., ResNet50 with fine-tuning strategies 1 and 2 and ResNet50V2 with fine-tuning strategy 2) achieved an accuracy of 96.55% in scenario 3, which outperformed the best DL model in scenario 1 (DenseNet169_m2) by 20.69%, the best DL model in scenario 2 (ResNet50V2_m1) by 13.22%, and best DL model in scenario 3 (ResNet50V2_m1) by 1.72%. The models performed best in scenario 3, and Voting 3 and Voting 5 outperformed the individual models.

Table 9.
Results of the hybrid model according to the number of voting models.
5. Conclusions
The results of this study demonstrate the feasibility of applying a hybrid DL model to developing an automated system for accurately diagnosing glaucoma from fundus images. The best-performing hybrid model (Voting 3) achieved an accuracy of 96.55%, a sensitivity of 98.84%, and a specificity of 94.32%, surpassing the performance of human specialists. Implementing this hybrid model in a cloud-based system will facilitate glaucoma diagnosis anywhere with Internet access at a low cost, which will be beneficial for areas with a shortage of specialists. We expect our methodology to also be applicable to diagnosing other ocular diseases based on fundus images.
Author Contributions
All authors (N.F., J.L.R., S.T., L.I., M.H., and D.M.) contributed to different aspects of this work. N.F. and J.L.R. were responsible for data collection, validation, and software implementation. N.F. also led the original draft writing and manuscript revision. S.T. contributed to the development and refinement of the software components. D.M. contributed to writing, data analysis, and methodology and provided ongoing guidance throughout the research process. M.H. and L.I. contributed to the methodological framework and offered clinical insights, as well as feedback during progress evaluations and manuscript review. All authors have read and agreed to the published version of the manuscript.
Funding
This research was supported by the Universidad Nacional Mayor de San Marcos—RR N° 005557-2022-R/UNMSM and project number C22200401.
Institutional Review Board Statement
Not applicable.
Informed Consent Statement
Not applicable.
Data Availability Statement
The original contributions presented in the study are included in the article; further inquiries can be directed to the corresponding author.
Acknowledgments
We would like to express our sincere gratitude to the AI LAB at the National University of San Marcos, particularly to the Faculty of System Engineering, for their invaluable support and resources provided to carry out this research. Our appreciation also goes to the ophthalmologists at the Oftalmosalud Institute of Eyes for their clinical advice and specialized knowledge, which significantly enriched this work by providing crucial perspectives from the medical field. We also thank our colleagues and friends for their valuable discussions and the reviewers of this paper, whose feedback contributed to enhancing the quality of our work.
Conflicts of Interest
The authors declare no conflicts of interest.
Abbreviations
The following abbreviations are used in this manuscript:
| DL | Deep Learning |
| ML | Machine Learning |
| CNN | Convolutional Neural Network |
| MLP | Multilayer Perceptron |
| ROI | Region of Interest |
| LBP | Local Binary Pattern |
| SVM | Support Vector Machine |
| CLAHE | Contrast-Limited Adaptive Histogram Equalization |
| ReLU | Rectified Linear Unit (activation function) |
| AF | Activation Function |
| TP | True Positive |
| TN | True Negative |
| FP | False Positive |
| FN | False Negative |
| Sen | Sensitivity |
| Esp | Specificity |
| Acc | Accuracy |
| ILSVRC | ImageNet Large Scale Visual Recognition Challenge |
| VGG | Visual Geometry Group (VGG16/VGG19 model) |
| HRF | High-Resolution Fundus (dataset) |
| ACRIMA | Name of a public glaucoma image dataset |
| IONIC | Cross-platform development framework |
| GPU | Graphics Processing Unit |
| CPU | Central Processing Unit |
| m1/m2 | Fine-tuning strategies 1 and 2 (model variation 1 or 2) |
References
- World Health Organization. Blindness. 2020. Available online: https://www.who.int/news-room/fact-sheets/detail/blindness-and-visual-impairment (accessed on 2 July 2025).
- Tham, Y.-C.; Li, X.; Wong, T.Y.; Quigley, H.A.; Aung, T.; Cheng, C.-Y. Global Prevalence of Glaucoma and Projections of Glaucoma Burden through 2040: A systematic review and meta-analysis. Ophthalmology 2014, 121, 2081–2090. [Google Scholar] [CrossRef]
- Wu, H.; Wang, Y.; Li, F.; Liu, Z.; Shi, F. The national, regional, and global impact of glaucoma as reported in the 2019 Global Burden of Disease Study. Arch. Med. Sci. 2023, 19, 1913–1919. [Google Scholar] [CrossRef]
- Díaz, P.J.M. Prevención y tratamiento actual del glaucoma. Rev. Medica Clin. Las Condes 2010, 21, 891–900. [Google Scholar] [CrossRef][Green Version]
- Bua, S.; Supuran, C.T. Diagnostic markers for glaucoma: A patent and literature review (2013–2019). Expert Opin. Ther. Patents 2019, 29, 829–839. [Google Scholar] [CrossRef]
- Glaucoma Research Fundation. Five Common Glaucoma Tests. 2020. Available online: https://www.glaucoma.org/glaucoma/diagnostic-tests.php (accessed on 17 October 2020).
- Michelessi, M.; Lucenteforte, E.; Oddone, F.; Brazzelli, M.; Parravano, M.; Franchi, S.; Ng, S.M.; Virgili, G.; Cochrane Eyes and Vision Group. Optic nerve head and fibre layer imaging for diagnosing glaucoma. Cochrane Database Syst. Rev. 2015, CD008803. [Google Scholar] [CrossRef]
- Soorya, M.; Issac, A.; Dutta, M.K. Automated Framework for Screening of Glaucoma Through Cloud Computing. J. Med. Syst. 2019, 43, 136. [Google Scholar] [CrossRef]
- Patel, R.K.; Kashyap, M. Automated screening of glaucoma stages from retinal fundus images using BPS and LBP based GLCM features. Int. J. Imaging Syst. Technol. 2022, 33, 246–261. [Google Scholar] [CrossRef]
- Guo, F.; Mai, Y.; Zhao, X.; Duan, X.; Fan, Z.; Zou, B.; Xie, B. Yanbao: A Mobile App Using the Measurement of Clinical Parameters for Glaucoma Screening. IEEE Access 2018, 6, 77414–77428. [Google Scholar] [CrossRef]
- Ubochi, B.; Olawumi, A.E.; Macaulay, J.; Ayomide, O.I.; Akingbade, K.F.; Al-Nima, R. Comparative Analysis of Vanilla CNN and Transfer Learning Models for Glaucoma Detection. J. Electr. Comput. Eng. 2024, 2024, 8053117. [Google Scholar] [CrossRef]
- Wang, F.; Casalino, L.P.; Khullar, D. Deep Learning in Medicine—Promise, Progress, and Challenges. JAMA Intern. Med. 2019, 179, 293–294. [Google Scholar] [CrossRef]
- Tirado, J.; Mauricio, D. Bruise dating using deep learning. J. Forensic Sci. 2020, 66, 336–346. [Google Scholar] [CrossRef]
- Alyoubi, W.L.; Shalash, W.M.; Abulkhair, M.F. Diabetic retinopathy detection through deep learning techniques: A review. Inf. Med. Unlocked 2020, 20, 100377. [Google Scholar] [CrossRef]
- Vij, R.; Arora, S. A Systematic Review on Deep Learning Techniques for Diabetic Retinopathy Segmentation and Detection Using Ocular Imaging Modalities. Wirel. Pers. Commun. 2024, 134, 1153–1229. [Google Scholar] [CrossRef]
- Sun, W.; Zheng, B.; Qian, W. Automatic feature learning using multichannel ROI based on deep structured algorithms for computerized lung cancer diagnosis. Comput. Biol. Med. 2017, 89, 530–539. [Google Scholar] [CrossRef]
- Ting, D.S.; Peng, L.; Varadarajan, A.V.; Keane, P.A.; Burlina, P.M.; Chiang, M.F.; Schmetterer, L.; Pasquale, L.R.; Bressler, N.M.; Webster, D.R.; et al. Deep learning in ophthalmology: The technical and clinical considerations. Prog. Retin. Eye Res. 2019, 72, 100759. [Google Scholar] [CrossRef]
- Lakhani, P.; Prater, A.B.; Hutson, R.K.; Andriole, K.P.; Dreyer, K.J.; Morey, J.; Prevedello, L.M.; Clark, T.J.; Geis, J.R.; Itri, J.N.; et al. Machine Learning in Radiology: Applications Beyond Image Interpretation. J. Am. Coll. Radiol. 2018, 15, 350–359. [Google Scholar] [CrossRef]
- Bohannon, J. Fears of an AI pioneer. Science 2015, 349, 252. [Google Scholar] [CrossRef]
- Samuel, A.L. Some Studies in Machine Learning Using the Game of Checkers. IBM J. Res. Dev. 1959, 3, 210–229. [Google Scholar] [CrossRef]
- Smits, D.J.; Elze, T.; Wang, H.; Pasquale, L.R. Machine Learning in the Detection of the Glaucomatous Disc and Visual Field. Semin. Ophthalmol. 2019, 34, 232–242. [Google Scholar] [CrossRef]
- Araújo, J.D.L.; Souza, J.C.; Neto, O.P.S.; de Sousa, J.A.; de Almeida, J.D.S.; de Paiva, A.C.; Silva, A.C.; Junior, G.B.; Gattass, M. Glaucoma diagnosis in fundus eye images using diversity indexes. Multimedia Tools Appl. 2018, 78, 12987–13004. [Google Scholar] [CrossRef]
- Maheshwari, S.; Pachori, R.B.; Kanhangad, V.; Bhandary, S.V.; Acharya, U.R. Iterative variational mode decomposition based automated detection of glaucoma using fundus images. Comput. Biol. Med. 2017, 88, 142–149. [Google Scholar] [CrossRef]
- Gour, N.; Khanna, P. Automated glaucoma detection using GIST and pyramid histogram of oriented gradients (PHOG) descriptors. Pattern Recognit. Lett. 2020, 137, 3–11. [Google Scholar] [CrossRef]
- Mohamed, N.A.; Zulkifley, M.A.; Zaki, W.M.D.W.; Hussain, A. An automated glaucoma screening system using cup-to-disc ratio via Simple Linear Iterative Clustering superpixel approach. Biomed. Signal Process. Control. 2019, 53, 101454. [Google Scholar] [CrossRef]
- de Sousa, J.A.; de Paiva, A.C.; de Almeida, J.D.S.; Silva, A.C.; Junior, G.B.; Gattass, M. Texture based on geostatistic for glaucoma diagnosis from fundus eye image. Multimedia Tools Appl. 2017, 76, 19173–19190. [Google Scholar] [CrossRef]
- Maheshwari, S.; Kanhangad, V.; Pachori, R.B.; Bhandary, S.V.; Acharya, U.R. Automated glaucoma diagnosis using bit-plane slicing and local binary pattern techniques. Comput. Biol. Med. 2019, 105, 72–80. [Google Scholar] [CrossRef]
- Junior, A.S.V.d.C.; Carvalho, E.D.; Filho, A.O.d.C.; de Sousa, A.D.; Silva, A.C.; Gattass, M. Automatic methods for diagnosis of glaucoma using texture descriptors based on phylogenetic diversity. Comput. Electr. Eng. 2018, 71, 102–114. [Google Scholar] [CrossRef]
- Koh, J.E.; Acharya, U.R.; Hagiwara, Y.; Raghavendra, U.; Tan, J.H.; Sree, S.V.; Bhandary, S.V.; Rao, A.K.; Sivaprasad, S.; Chua, K.C.; et al. Diagnosis of retinal health in digital fundus images using continuous wavelet transform (CWT) and entropies. Comput. Biol. Med. 2017, 84, 89–97. [Google Scholar] [CrossRef]
- Maheshwari, S.; Pachori, R.B.; Acharya, U.R. Automated Diagnosis of Glaucoma Using Empirical Wavelet Transform and Correntropy Features Extracted from Fundus Images. IEEE J. Biomed. Heal. Informatics 2016, 21, 803–813. [Google Scholar] [CrossRef]
- Koh, J.E.; Ng, E.Y.; Bhandary, S.V.; Hagiwara, Y.; Laude, A.; Acharya, U.R. Automated retinal health diagnosis using pyramid histogram of visual words and Fisher vector techniques. Comput. Biol. Med. 2018, 92, 204–209. [Google Scholar] [CrossRef]
- Sundaram, R.; Ravichandran, K.; Vijayakumar, V.; Subramaniyaswamy, V.; Abawajy, J.; Yang, L. An automated eye disease prediction system using bag of visual words and support vector machine. J. Intell. Fuzzy Syst. 2019, 36, 4025–4036. [Google Scholar] [CrossRef]
- LeCun, Y.; Bengio, Y.; Hinton, G. Deep learning. Nature 2015, 521, 436–444. [Google Scholar] [CrossRef]
- Zheng, C.; Johnson, T.V.; Garg, A.; Boland, M.V. Artificial intelligence in glaucoma. Curr. Opin. Ophthalmol. 2019, 30, 97–103. [Google Scholar] [CrossRef]
- Hinton, G. Deep Learning—A Technology with the Potential to Transform Health Care. JAMA 2018, 320, 1101–1102. [Google Scholar] [CrossRef]
- Scherer, D.; Müller, A.; Behnke, S. Evaluation of Pooling Operations in Convolutional Architectures for Object Recognition. In Proceedings of the International Conference on Artificial Neural Networks, Thessaloniki, Greece, 15–18 September 2010. [Google Scholar]
- Cerentini, A.; Welfer, D.; Cordeiro-d’Ornellas, M.; Pereira-Haygert, C.J.; Dotto, G.N. Automatic Identification of Glaucoma Using Deep Learning Methods. In MEDINFO 2017: Precision Healthcare Through Informatics; IOS Press: Amsterdam, The Netherlands, 2017; Volume 245, pp. 318–321. [Google Scholar] [CrossRef]
- Shao, W.; Luo, H.; Zhao, F.; Ma, Y.; Zhao, Z.; Crivello, A. Indoor Positioning Based on Fingerprint-Image and Deep Learning. IEEE Access 2018, 6, 74699–74712. [Google Scholar] [CrossRef]
- Devalla, S.K.; Chin, K.S.; Mari, J.-M.; Tun, T.A.; Strouthidis, N.G.; Aung, T.; Thiéry, A.H.; Girard, M.J.A. A Deep Learning Approach to Digitally Stain Optical Coherence Tomography Images of the Optic Nerve Head. Investig. Opthalmology Vis. Sci. 2018, 59, 63–74. [Google Scholar] [CrossRef]
- Krizhevsky, A.; Sutskever, I.; Hinton, G.E. ImageNet Classification with Deep Convolutional Neural Networks. Available online: http://code.google.com/p/cuda-convnet/ (accessed on 4 June 2025).
- Park, E.; Liu, W.; Russakovsky, O.; Deng, J.; Li, F.-F.; Berg, A. ImageNet Large Scale Visual Recognition Challenge 2017 (ILSVRC2017). 2017. Available online: https://image-net.org/challenges/LSVRC/2017/#loc (accessed on 4 June 2025).
- Keras Team. Keras Applications. 2020. Available online: https://keras.io/api/applications/ (accessed on 29 December 2020).
- Ahn, J.M.; Kim, S.; Ahn, K.-S.; Cho, S.-H.; Lee, K.B.; Kim, U.S.; Bhattacharya, S. A deep learning model for the detection of both advanced and early glaucoma using fundus photography. PLoS ONE 2018, 13, e0207982. [Google Scholar] [CrossRef]
- Raghavendra, U.; Fujita, H.; Bhandary, S.V.; Gudigar, A.; Tan, J.H.; Acharya, U.R. Deep convolution neural network for accurate diagnosis of glaucoma using digital fundus images. Inf. Sci. 2018, 441, 41–49. [Google Scholar] [CrossRef]
- Chai, Y.; Liu, H.; Xu, J. Glaucoma diagnosis based on both hidden features and domain knowledge through deep learning models. Knowledge-Based Syst. 2018, 161, 147–156. [Google Scholar] [CrossRef]
- Diaz-Pinto, A.; Morales, S.; Naranjo, V.; Köhler, T.; Mossi, J.M.; Navea, A. CNNs for automatic glaucoma assessment using fundus images: An extensive validation. Biomed. Eng. Online 2019, 18, 29. [Google Scholar] [CrossRef]
- Hemelings, R.; Elen, B.; Barbosa-Breda, J.; Lemmens, S.; Meire, M.; Pourjavan, S.; Vandewalle, E.; Van de Veire, S.; Blaschko, M.B.; De Boever, P.; et al. Accurate prediction of glaucoma from colour fundus images with a convolutional neural network that relies on active and transfer learning. Acta Ophthalmol. 2019, 98, E94–E100. [Google Scholar] [CrossRef]
- Xu, X.; Guan, Y.; Li, J.; Ma, Z.; Zhang, L.; Li, L. Automatic glaucoma detection based on transfer induced attention network. Biomed. Eng. Online 2021, 20, 39. [Google Scholar] [CrossRef]
- D’sOuza, G.; Siddalingaswamy, P.C.; Pandya, M.A. AlterNet-K: A small and compact model for the detection of glaucoma. Biomed. Eng. Lett. 2023, 14, 23–33. [Google Scholar] [CrossRef]
- Kohler, T.; Budai, A.; Kraus, M.F.; Odstrcilik, J.; Michelson, G.; Hornegger, J. Automatic no-reference quality assessment for retinal fundus images using vessel segmentation. In Proceedings of the 26th IEEE International Symposium on Computer-Based Medical Systems, Porto, Portugal, 20–22 June 2013; pp. 95–100. [Google Scholar] [CrossRef]
- Chakravarty, A.; Sivaswamy, J. Glaucoma classification with a fusion of segmentation and image-based features. In Proceedings of the 2016 IEEE 13th International Symposium on Biomedical Imaging (ISBI 2016), Prague, Czech Republic, 13–16 April 2016; pp. 689–692. [Google Scholar] [CrossRef]
- Abbas, Q. Glaucoma-Deep: Detection of Glaucoma Eye Disease on Retinal Fundus Images using Deep Learning. Int. J. Adv. Comput. Sci. Appl. 2017, 8. [Google Scholar] [CrossRef]
- Medina-Mesa, E.; Gonzalez-Hernandez, M.; Sigut, J.; Fumero-Batista, F.; Pena-Betancor, C.; Alayon, S.; de la Rosa, M.G. Estimating the Amount of Hemoglobin in the Neuroretinal Rim Using Color Images and OCT. Curr. Eye Res. 2015, 41, 798–805. [Google Scholar] [CrossRef]
- Supriyadi, M.R.; Samah, A.B.A.; Muliadi, J.; Awang, R.A.R.; Ismail, N.H.; Majid, H.A.; Bin Othman, M.S.; Hashim, S.Z.B.M. A systematic literature review: Exploring the challenges of ensemble model for medical imaging. BMC Med. Imaging 2025, 25, 128. [Google Scholar] [CrossRef]
- Wang, Z.; Chen, X.; Wu, Y.; Jiang, L.; Lin, S.; Qiu, G. A robust and interpretable ensemble machine learning model for predicting healthcare insurance fraud. Sci. Rep. 2025, 15, 218. [Google Scholar] [CrossRef]
- Sułot, D.; Alonso-Caneiro, D.; Ksieniewicz, P.; Krzyzanowska-Berkowska, P.; Iskander, D.R.; Vavvas, D.G. Glaucoma classification based on scanning laser ophthalmoscopic images using a deep learning ensemble method. PLoS ONE 2021, 16, e0252339. [Google Scholar] [CrossRef]
- Sánchez-Morales, A.; Morales-Sánchez, J.; Kovalyk, O.; Verdú-Monedero, R.; Sancho-Gómez, J.-L. Improving Glaucoma Diagnosis Assembling Deep Networks and Voting Schemes. Diagnostics 2022, 12, 1382. [Google Scholar] [CrossRef]
- Wang, L.; Liu, H.; Lu, Y.; Chen, H.; Zhang, J.; Pu, J. A coarse-to-fine deep learning framework for optic disc segmentation in fundus images. Biomed. Signal Process. Control. 2019, 51, 82–89. [Google Scholar] [CrossRef]
- Juneja, M.; Singh, S.; Agarwal, N.; Bali, S.; Gupta, S.; Thakur, N.; Jindal, P. Automated detection of Glaucoma using deep learning convolution network (G-net). Multimedia Tools Appl. 2019, 79, 15531–15553. [Google Scholar] [CrossRef]
- Guo, J.; Azzopardi, G.; Shi, C.; Jansonius, N.M.; Petkov, N. Automatic Determination of Vertical Cup-to-Disc Ratio in Retinal Fundus Images for Glaucoma Screening. IEEE Access 2019, 7, 8527–8541. [Google Scholar] [CrossRef]
- Orlando, J.I.; Prokofyeva, E.; del Fresno, M.; Blaschko, M.B.; Romero, E.; Lepore, N.; Brieva, J.; Larrabide, I. Convolutional neural network transfer for automated glaucoma identification. In Proceedings of the 12th International Symposium on Medical Information Processing and Analysis, Tandil, Argentina, 5–7 December 2016; p. 101600U. [Google Scholar] [CrossRef]
- Xu, Q.; Zhang, M.; Gu, Z.; Pan, G. Overfitting remedy by sparsifying regularization on fully-connected layers of CNNs. Neurocomputing 2019, 328, 69–74. [Google Scholar] [CrossRef]
- Bland, M. An Introduction to Medical Statistics. Oxford Medical Publications, 2015. Available online: https://catalogue.nla.gov.au/Record/1450312 (accessed on 4 June 2025).
- Carneiro, T.; Da Nobrega, R.V.M.; Nepomuceno, T.; Bian, G.-B.; De Albuquerque, V.H.C.; Filho, P.P.R. Performance Analysis of Google Colaboratory as a Tool for Accelerating Deep Learning Applications. IEEE Access 2018, 6, 61677–61685. [Google Scholar] [CrossRef]
Disclaimer/Publisher’s Note: The statements, opinions and data contained in all publications are solely those of the individual author(s) and contributor(s) and not of MDPI and/or the editor(s). MDPI and/or the editor(s) disclaim responsibility for any injury to people or property resulting from any ideas, methods, instructions or products referred to in the content. |
© 2025 by the authors. Licensee MDPI, Basel, Switzerland. This article is an open access article distributed under the terms and conditions of the Creative Commons Attribution (CC BY) license (https://creativecommons.org/licenses/by/4.0/).
