Article

Digital Empowerment, Novel Productive Forces, and Regional Green Innovation Efficiency: Causal Inference Based on Spatial Difference-in-Differences and Double Machine Learning Approaches

1
Business School, Ningbo University, Ningbo 315211, China
2
Faculty of Architecture and Art, Ningbo Polytechnic University, Ningbo 315800, China
3
Graduate Institute for Taiwan Studies, Xiamen University, Xiamen 361005, China
4
School of Cultural Heritage and Information Management, Shanghai University, Shanghai 200444, China
*
Author to whom correspondence should be addressed.
Information 2025, 16(7), 578; https://doi.org/10.3390/info16070578
Submission received: 9 June 2025 / Revised: 28 June 2025 / Accepted: 4 July 2025 / Published: 6 July 2025
(This article belongs to the Special Issue Carbon Emissions Analysis by AI Techniques)

Abstract

Amidst the dual challenges of escalating ecological environmental pressures and economic transformation globally, green innovation emerges as a pivotal pathway toward achieving high-quality sustainable development. To elucidate how digitalization and novel productive forces synergistically drive the green transition, the research utilizes panel data from 30 provincial-level administrative regions in China spanning 2009 to 2022, constructing a green innovation efficiency measurement frame-work grounded in the Super Slack-Based Measure (Super-SBM)model, alongside a novel productive forces evaluation system based on the triad of laborers, labor objects, and means of production. Employing spatial difference-in-differences and double machine learning methodologies within a quasi-natural experimental design, the research investigates the causal mechanisms through which digital empowerment and novel productive forces influence regional green innovation efficiency. The findings reveal that both digital empowerment and novel productive forces significantly enhance regional green innovation efficiency, exhibiting pronounced positive spatial spillover effects on neighboring regions. Heterogeneity analyses demonstrate that the promotive impacts are more pronounced in eastern provinces compared to central and western counterparts, in provinces participating in carbon trading relative to those that do not, and in innovation-driven provinces versus non-innovative ones. Mediation analysis indicates that digital empowerment operates by fostering the aggregation of innovative talent and elevating governmental ecological attentiveness, whereas new-type productivity exerts its influence primarily through intellectual property protection and the clustering of high-technology industries. The results offer empirical foundations for policymakers to devise coordinated regional green development strategies, refine digital transformation policies, and promote industrial structural optimization. Furthermore, this research provides valuable data-driven insights and theoretical guidance for local governments and enterprises in cultivating green innovation and new-type productivity.

1. Introduction

China’s economy is presently undergoing a critical phase of transforming its development paradigm, optimizing economic structure, and shifting growth drivers. Confronted with the accelerated depletion of resources, deteriorating ecological environments, sluggish economic expansion, and suboptimal development quality, there is an urgent imperative to invigorate growth through innovation and enhance public welfare via “green” initiatives [1]. The concept of green innovation efficiency, anchored in principles of green growth, low-carbon development, and circular sustainability, aims to maximize innovative output given predetermined inputs. This framework addresses a significant gap in mainstream economic theories that overlook natural ecological constraints by integrating green development into the study of economic growth [2]. It offers a dual-perspective approach—focusing on both developmental momentum and sustainability—that furnishes novel insights for China to expedite the transition between old and new growth drivers, achieve high-quality development, and realize modernization with Chinese characteristics.
In recent years, with the profound advancement of digital technologies and their intricate integration into various facets of social life, the digital economy has emerged as a pivotal engine of economic growth [3]. In response, China has committed to refining and expanding the data factor market, seeking to bridge the “digital divide” engendered by disparities in digital endowments and skills across regions, demographics, and industries [4]. In August 2015, the State Council promulgated the “Action Plan for Promoting Big Data Development”, positioning big data innovation and development trials as a national strategic priority. Subsequently, in February 2016, Guizhou was designated as the nation’s inaugural comprehensive big data pilot zone, followed by the approval in October of the same year to advance the establishment of national comprehensive big data pilot zones across seven regions, including Beijing–Tianjin–Hebei. These initiatives enable China to capitalize on invaluable opportunities afforded by digital empowerment, thereby enhancing economic efficiency and total factor productivity through research and innovation [5]. Nonetheless, the prospect of harmonizing green development objectives with economic growth, thereby achieving a synergistic advancement of digitalization and environmental sustainability, remains a critical area warranting continued attention.
In September 2023, General Secretary Xi Jinping, during his inspection tour in Heilongjiang, introduced for the first time the concept of new-quality productive forces, thereby inheriting, enriching, and advancing the Marxist theory of productive forces. This new-quality productive force is innovation-driven, relying on disruptive and cutting-edge technological innovations to transcend traditional modes of economic growth and conventional trajectories of productivity development. Concurrently, it necessitates alignment with the new development paradigm, wherein a pivotal aspect involves fostering technological innovation through institutional and systemic reforms, which in turn catalyze industrial innovation via the application of scientific and technological achievements, ultimately facilitating a green economic transformation [6]. Given that new-quality productive forces embody novel theoretical connotations and bear substantial practical significance, closely intertwined with green innovation efficiency, this study accordingly incorporates them within its analytical framework.
Digital empowerment exhibits an intrinsic congruence with the formation and development of new-quality productive forces. The digital economy, through its profound integration with the real economy, furnishes an authentic digital substrate for new-quality productive forces, constructs novel organizational modalities for production factors, and endows data resources alongside an innovative environment [7]. Given the close interconnection between green innovation efficiency and the domain of productive forces, this study investigates, at the provincial level within mainland China, the mechanisms through which digital empowerment and new-quality productive forces influence green innovation efficiency. The principal contributions of this work are threefold: first, it situates digital empowerment, new-quality productive forces, and green innovation efficiency within a unified analytical framework grounded in the contemporary context of digital economic development and productivity transformation; second, it examines the intrinsic interplay among innovation talent, industrial transformation, knowledge and technology, and ecological preservation—all intimately linked to digital empowerment, new-quality productive forces, and regional green innovation efficiency; third, it employs spatial difference-in-differences models alongside double machine learning methodologies, thereby reinforcing the robustness and persuasiveness of the empirical findings through methodological triangulation.

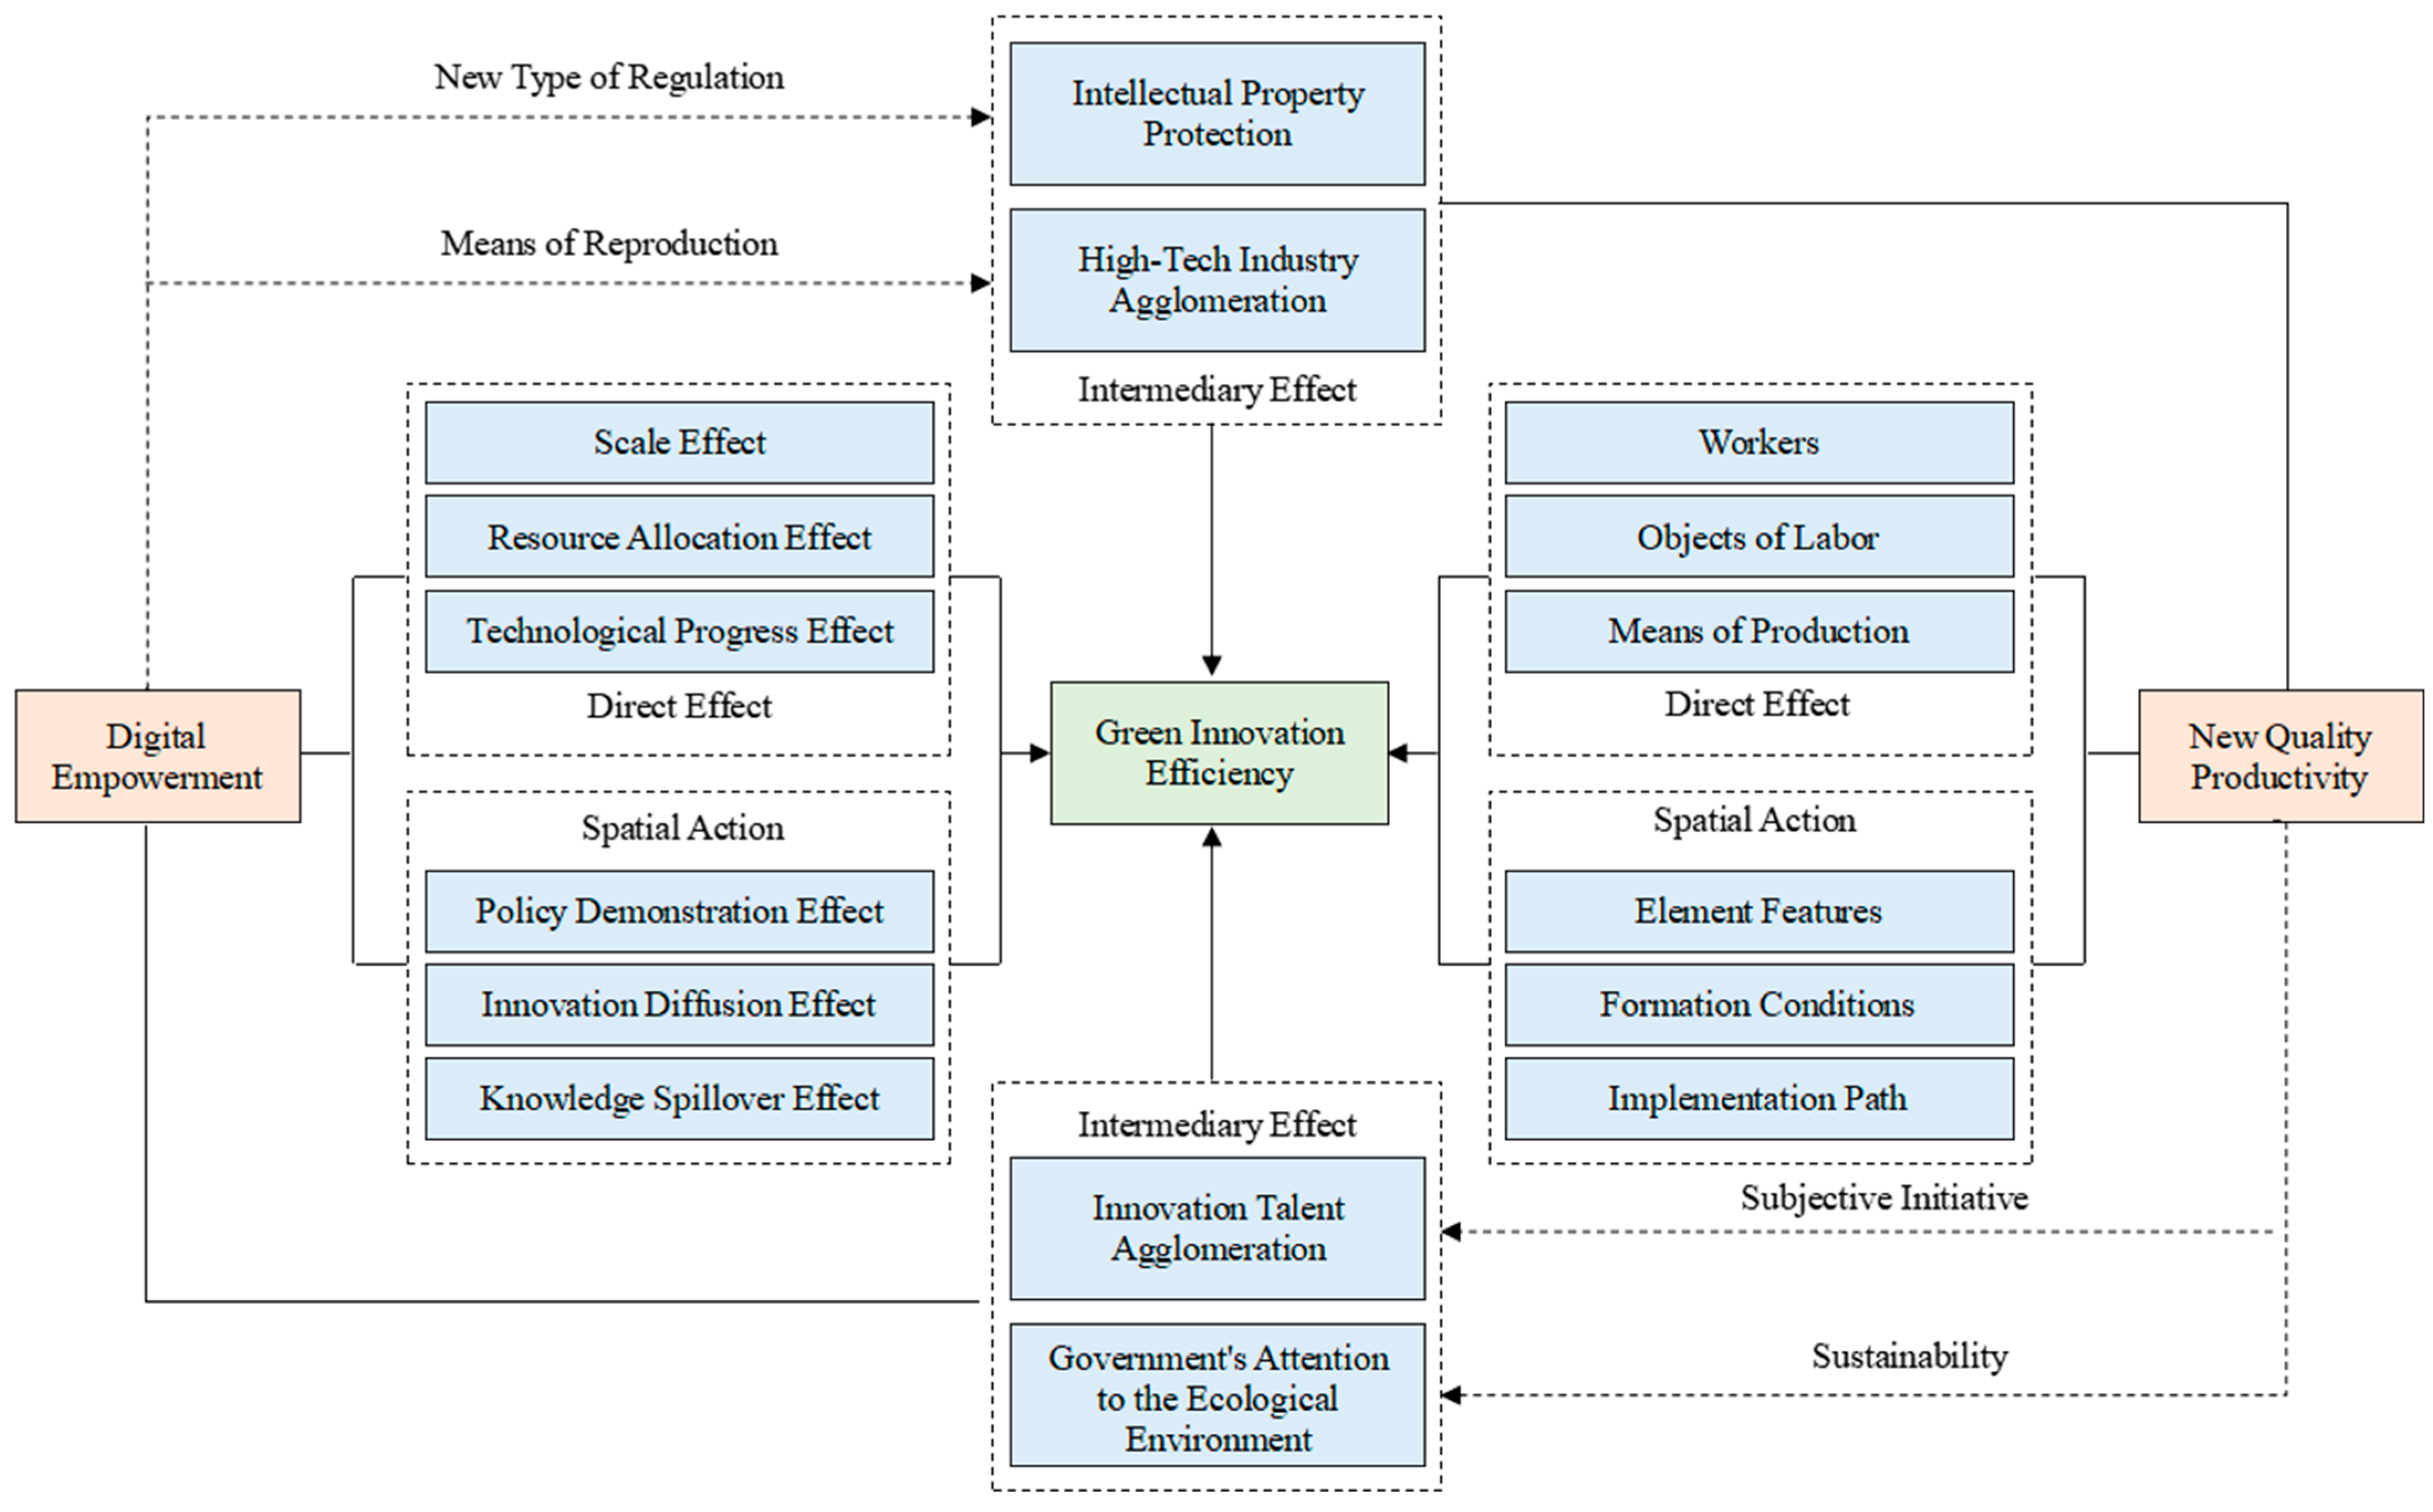
2. Analysis of Influence Mechanisms and Theoretical Hypotheses

2.1. Digital Empowerment and Green Innovation Efficiency

The National Comprehensive Big Data Pilot Zone policy not only conforms to and propels the trend of digital economic development, reinforcing the status of data as a new type of productive factor, but also, through policy demonstration and resource allocation, sends positive signals to the market, providing more scientific and systematic guidance for activities of digital empowerment. A review of the existing literature reveals that the data factor primarily empowers the enhancement of green innovation efficiency through the following mechanisms: In terms of scale effects, first, the expansion of enterprise production scales is accompanied by an increase in data volume, which helps to reduce the costs of data analysis and processing, while large datasets further enhance the precision of model estimation and prediction. Second, big data and cloud computing service providers, through centralized management and resource sharing, lower the demand for enterprise hardware infrastructure investments and the cost per user. Finally, under the backdrop of digital empowerment, information exchange platforms and relational networks have attracted diverse entities to participate in production activities, blurring the boundaries between traditional government, enterprise, individual, and social organization, facilitating the convenient circulation of innovation resources [8]. Regarding the resource allocation effect, the widespread application of digital technologies and their deep integration with the real economy enable enterprises to promptly grasp vast amounts of data, precisely match market supply and demand information, and reduce resource wastage resulting from inefficient production and overcapacity. Simultaneously, digital technologies enhance enterprises’ capacity for resource collection and efficiency in factor integration, facilitating the acceleration of the flow of green innovation resources and fostering collaborative efforts with elements such as knowledge, technology, talent, and capital [9]—thus increasing the success rate of green research and development activities [10]. In terms of the technological progress effect, on one hand, data factors and digital technologies, through their close interaction with disruptive technologies such as artificial intelligence, the Internet of Things, and virtual reality, provide significant reference for green innovation activities [11]. On the other hand, the relatively relaxed environment of the digital economy reduces the cost of green innovation, enhances the value placed on knowledge and talent, and strengthens the protection of innovation outcomes, thereby boosting the willingness for green innovation and the efficiency of the transformation of green innovation achievements.
In terms of spatial effects, the digital empowerment under the implementation of the National Comprehensive Big Data Pilot Zone policy may exert an impact on surrounding regions through policy demonstration effects, innovation diffusion effects, and knowledge spillover effects. Firstly, as a national-level policy, it offers special policy incentives to the pilot provinces, attracting a large number of digital talents and digitalized enterprises to converge in the pilot zones. The zones, as platforms for pioneering and experimenting, also impose fewer restrictions on green innovation activities, facilitating the generation of a series of innovative outcomes and reforming ideas that can be referenced and disseminated, thereby incentivizing surrounding regions to emulate and learn [12]. Secondly, green innovation activities under the backdrop of digital empowerment are conducted through diverse and open network channels, accelerating the acceptance and application of green technologies in surrounding regions [13]; the application of digital technologies also allows green innovation enterprises to form close cooperative relationships with upstream and downstream enterprises in surrounding regions through industrial chain collaboration, or to expand markets by attracting investments and promoting products, thereby driving green innovation activities across industries and regions.
Pursuant to the analysis presented above, the following hypotheses are formulated in this study:
Hypothesis 1. 
Digital empowerment significantly enhances regional green innovation efficiency.
Hypothesis 2. 
Digital empowerment exhibits a significant positive spatial spillover effect on the enhancement of regional green innovation efficiency.
Hypotheses 1 and 2 explicitly posit that, under the auspices of policy support within the national comprehensive big data pilot zones, digital empowerment not only enhances green innovation efficiency within the region but may also exert a positive spillover effect on adjacent areas through mechanisms of policy demonstration and information diffusion. This causal pathway will be empirically examined in subsequent sections by constructing a spatial difference-in-differences model to ascertain whether digital empowerment functions as a transregional catalyst for green development.

2.2. New-Quality Productive Forces and Green Innovation Efficiency

In terms of the constituent elements of productivity, new-quality productive forces also encompass the three essential components of laborers, labor objects, and means of production. Firstly, new-quality productive forces have increased the demand for highly educated laborers. By fostering a societal culture that encourages innovation and respects knowledge and talent, they contribute to enhancing the quality of laborers, forming clusters of innovative talents, and accelerating the speed of knowledge dissemination [14], thereby improving green innovation efficiency. Additionally, in an open environment, the cross-regional mobility of innovative talents and knowledge spillover facilitates the formation of innovative spaces with surrounding regions [15], providing a favorable ecological environment for innovation activities. Secondly, new-quality productive forces necessitate coordination between traditional industries and emerging industries such as new energy, new materials, and new energy vehicles. Inter-regional industrial transfers should rely on technological innovation and progress to reduce resource costs, promoting the green transformation and upgrading of industries while also addressing ecological and environmental improvement. Finally, new-quality productive forces have profoundly affected the level of means of production. Breakthroughs and applications of key core technologies have, on one hand, strengthened the quality of existing material means of production, and on the other hand, elevated the status of intangible means of production in the development of productive forces. Technologies such as the Internet of Things, blockchain, and artificial intelligence, which are based on digitalization, informatization, and intelligence, enable the collection, integration, storage, processing, and application of digital elements to empower production and management processes, opening up a broader path for the enhancement of green innovation efficiency.
Existing research has seldom discussed the spatial spillover effects of new-quality productive forces, primarily focusing on aspects such as element characteristics, formation conditions, and realization pathways. Firstly, new-quality productive forces are characterized by innovation and data elements, which, in the process of their operation, often transcend traditional geographical boundaries. For instance, they may facilitate the deep integration of green innovation activities and related industries through the “Science–Technology–Industry–Finance” cycle [16]. Secondly, some scholars [17] point out that under the strategic goal of promoting regional coordinated development in China, provinces are often closely connected in terms of innovation diffusion, knowledge spillover, infrastructure connectivity, and policy coordination related to green innovation. Provinces with a higher level of new-quality productive forces can act as growth poles to exert economic radiation effects on surrounding regions. Lastly, the realization pathways of new-quality productive forces include the development of industrial clusters, cross-regional cooperation, and the integration of innovation chains and industrial chains, all of which require cross-subject, cross-industry, and cross-regional collaboration on a larger scale. This facilitates the overall improvement of green innovation efficiency within the region and in surrounding areas [18,19].
In light of the preceding analysis, the following hypotheses are posited in this study:
Hypothesis 3. 
New-quality productive forces can significantly enhance regional green innovation efficiency.
Hypothesis 4. 
New-quality productive forces exert a significant positive spatial spillover effect on the enhancement of regional green innovation efficiency.
Grounded in an analysis of labor quality, the iteration of means of production, and the optimization of industrial structure, Hypotheses 3 and 4 contend that the novel productive forces can not only directly elevate local green innovation efficiency through factor upgrading but may also generate positive spillover effects on neighboring regions via synergistic interactions within innovation and industrial chains. This framework offers a theoretical foundation for investigating the spatial repercussions of structural transformations in productivity on green transition, which will be empirically substantiated through model estimation in the following discourse.

2.3. Digital Empowerment, New-Quality Productive Forces, and Green Innovation Efficiency

From the perspective of digital empowerment, the era of the digital economy has given rise to a series of new business models, new technologies, and new patterns characterized by digitalization and intelligence, necessitating that laborers continuously upgrade their skills and qualifications to meet the requirements of mastering new-quality productive tools [20]. As the most dynamic and creative entity within the productive forces, laborers play a decisive role in the formation and development of new-quality productive forces. Currently, laborers are transitioning to more technologically advanced and flexible employment positions through learning and mastering digital skills, thereby enhancing the efficiency of labor resource allocation [21]. The emergence of new occupational modes such as online collaboration platforms and short-term project collaborations also increases the mobility of highly skilled laborers, contributing to the concentration of innovative talent and, subsequently, to the improvement of green innovation efficiency. Simultaneously, China is experiencing the pain of economic structural adjustment, and the demand for innovative and green development is equally urgent. The government’s emphasis on the ecological environment is in harmony with the sustainability characteristics of new-quality productive forces. Digital empowerment aids in strengthening the government’s monitoring capabilities over resource wastage, environmental pollution, and ecological destruction [22], assists enterprises in identifying market demands, shifting business objectives, and practicing green transformation. Government subsidies and incentives for enterprise green innovation activities can also reduce the costs of enterprise green research and development and attract green innovation capital inflows [23].
From the perspective of new-quality productive forces, their mechanism of action is centered on technological innovation, which is transmitted through the “elements–technology–industry” system, ultimately reshaping the three core components of productive forces and transforming the world [24]. Therefore, the realization path of new-quality productive forces necessitates enhancing innovation capabilities, improving the innovation institutional mechanisms, and fostering a modern industrial system. On one hand, intellectual property protection, by providing legal safeguards for innovation entities, aids in creating a fair innovation environment and can effectively safeguard the economic rights of innovation subjects and help enterprises establish competitive advantages, further stimulating innovation activities. The widespread application of digital technology has simplified the process of applying for and managing intellectual property rights, but it also comes with a series of new challenges related to data leaks and technological security issues. There is a need to establish a comprehensive intellectual property protection system to better protect and encourage green innovation activities. On the other hand, digital empowerment has given rise to the transformation of traditional industries, the development of emerging industries, and the cultivation of future industries. In this process, new-quality productive forces leverage disruptive technologies and emerging technologies based on digital technology to continuously transform the forms of production organization, deeply integrate with the real economy, and directly drive research and innovation, as well as technological progress, in highly relevant fields such as new energy, new materials, and green environmental protection.
Drawing upon the aforementioned analysis, this study proposes the following hypotheses:
Hypothesis 5. 
The concentration of innovative talents plays a mediating role in the relationship between digital empowerment and regional green innovation efficiency.
Hypothesis 6. 
The government’s attention to the ecological environment plays a mediating role in the relationship between digital empowerment and regional green innovation efficiency.
Hypothesis 7. 
Intellectual property protection plays a mediating role in the relationship between new-quality productive forces and regional green innovation efficiency.
Hypothesis 8. 
The concentration of high-tech industries plays a mediating role in the relationship between new-quality productive forces and regional green innovation efficiency.
Hypotheses 5 and 6 approach the question from the perspective of digital empowerment, examining its indirect effects by fostering the agglomeration of innovative talent and augmenting governmental focus on ecological and environmental concerns; meanwhile, H7 and H8 elucidate how novel productive forces enhance green innovation efficiency by strengthening intellectual property protection and promoting the concentration of high-technology industries. These mechanistic propositions offer empirical avenues to unravel the underlying pathways through which the core variables operate, with subsequent analyses incorporating mediating variables to rigorously test their validity through path analysis.
In summary, the mechanism of action for digital empowerment and new-quality productive forces on regional green innovation efficiency is illustrated in Figure 1:
Figure 1 encapsulates the theoretical framework and hypothesis system of this study, illustrating how digital empowerment and novel productive forces jointly influence regional green innovation efficiency through both direct pathways and four intermediary mechanisms. Building upon this framework, the present research undertakes model formulation and variable construction to facilitate empirical validation.

3. Quasi-Natural Experiment Design

3.1. Model Construction

3.1.1. Construction of the Spatial Difference-in-Differences Model

This study investigates the impact of the implementation of the National Comprehensive Big Data Pilot Zone policy in 30 provinces, municipalities, and autonomous regions of mainland China (excluding Tibet) from 2009 to 2022 on regional green innovation efficiency, with a focus on the influence of new-quality productive forces. Owing to Tibet’s remote location and relative lag in economic and technological development, along with significant data gaps in some years, it does not meet the criteria for continuous observation and is therefore excluded. Additionally, under the “One Country, Two Systems” policy, Hong Kong, Macau, and Taiwan have distinct institutional environments and statistical methodologies, with critical indicators missing and structural outliers present, making them unsuitable for comparison with the mainland. Consequently, the selection of 30 mainland provincial-level regions as the research subject allows for a comprehensive coverage of the structural heterogeneity and spatial interaction characteristics of major regions in China’s process of green development and digitalization, demonstrating strong representativeness and generalizability. The study period is set from 2009 to 2022. On one hand, the historical statistics related to green innovation have mostly been established progressively since 2009, ensuring continuity. On the other hand, some core variables, such as digital infrastructure construction and governmental ecological attention, are sourced from national and local statistical yearbooks or official platform data, which have a 1- to 2-year disclosure lag. As of the time of this paper’s writing, the data for 2023 have not been fully released, and some variables are still being updated. To ensure consistency in the indicator system and the completeness of the data, this paper temporarily terminates the sample period at 2022. In the future, if complete data for 2023 and subsequent years are obtained, the research perspective will be further expanded, and an extension analysis will be conducted on the extrapolative capability and dynamic evolution of the research conclusions. To better account for spatial endogeneity and correlation issues, following the methodologies of Chagas et al. [25] and Ma Liya and Dai Hongwei [26], the traditional difference-in-differences approach is integrated with spatial econometric models to construct a spatial difference-in-differences model.
Model 1:
G I E i t = ρ W · G I E i t + α 1 D I D i t + α 2 N Q P i t + Σ β X i t + γ i + μ i + ε i t
Model 2:
G I E i t = α 1 D I D i t + α 2 N Q P i t + Σ β X i t + γ i + λ W · v i t + μ i + ε i t
Model 3:
G I E i t = ρ W · G I E i t + α 1 D I D i t + α 2 N Q P i t + Σ β X i t + θ W · ( D I D i t + N Q P i t + Σ X i t ) + γ i + μ i + ε i t
Models 1–3 combine the difference-in-differences method with the spatial autoregression model, the spatial error model, and the spatial Durbin model, respectively. The green innovation efficiency (GIE) serves as the dependent variable, X represents a collection of control variables, γ i denotes time fixed effects, μ i indicates spatial fixed effects, and ε i t denotes the error term. α 1 , α 2 are the regression coefficients for the national comprehensive big data pilot zone policy dummy variable ( D I D i t ) and the new-quality productive forces ( N Q P i t ), respectively, while β denotes the collection of regression coefficients for the control variables. i denotes different provincial administrative regions, and t represents the number of periods.

3.1.2. Construction of the Double Machine Learning Model

The Double Machine Learning (DML) model was proposed by Chernozhukov et al. [27]. Based on sample partitioning, regularized regression, and bias correction, it can effectively estimate causal effects in a high-dimensional environment with a large number of control variables. The DML model is focused on the causal relationship between the dependent variable and the core explanatory variables, and it mitigates confounding bias by separately processing the core explanatory variables and control variables. This model combines machine learning with economic research methods, effectively addressing the issues of needing to pre-specify the functional form of covariates in traditional difference-in-differences methods and the “curse of dimensionality”, while also overcoming the limitations of traditional machine learning, such as estimation bias, inability to provide confidence intervals, and slow convergence. It possesses significant advantages in handling the nonlinear relationships between economic variables and offers a more robust method for causal inference in economics. At the same time, this study adopts a two-sample cross-fitting strategy, using the lasso method to fit the residual terms of the dependent variable and the core explanatory variable, respectively, and then using the residuals to replace the original variables in the main regression to reduce the interference of control variables on causal identification. This method has good robustness and generalization ability, and is particularly suitable for real-world regional data with strong heterogeneity and high multicollinearity between variables. Drawing on the research of Chernozhukov et al. [27,28,29], the double machine learning model is constructed as follows.
Model 4:
G I E i t = α 1 D I D i t + g ( X i t ) + U i t , E ( U i t | D I D i t , X i t ) = 0
Model 5:
G I E i t = α 2 N Q P i t + g ( X i t ) + U i t , E ( U i t | D I i t , X i t ) = 0
To correct the regular bias in parameter estimates, an auxiliary equation is employed as follows.
D I D i t = m X i t + V i t , E V i t D I D i t , X i t = 0
Within this framework, the specific forms of g ( X i t ) and m X i t are unknown; however, their estimates, denoted as g ^ ( X i t ) and m ^ ( X i t ) , can be obtained through machine learning. U i t and V i t represent the error terms. By using the estimated value of the residual V i t , denoted as V ^ i t , as an instrument for D I D i t , an estimate   α ^ 1 is obtained, where n is the sample size.
α ^ 1 = ( 1 n i ϵ I , t ϵ T V ^ i t D I D i t ) 1 1 n i ϵ I , t ϵ T V ^ i t ( G I E i ( t + 1 ) g ^ ( X i t ) )

3.2. Variable Selection and Data Sources

3.2.1. Dependent Variable: Green Innovation Efficiency (GIE)

Green innovation efficiency reflects the input–output ratio of technological innovation activities under the constraints of resources and the environment. Drawing upon the research of Xu Shouran et al. [30], this study establishes an indicator system based on input elements, output elements, and undesirable outputs (as presented in Table 1) and employs the Super-SBM model to measure regional green innovation efficiency. The Super-SBM model diminishes errors by incorporating slack variables into the objective function, thereby providing the advantage of being able to compare the efficiency levels of effective samples [31]. To better capture the “green” aspect of green innovation efficiency, the number of authorized patent applications is refined to include the number of authorized green patent applications. The undesirable output of environmental pollution is generally represented by “three industrial wastes” (wastewater, waste gas, and solid waste), yet in recent years, the majority of general industrial solid waste has been comprehensively utilized or disposed of. The existing industrial waste gas indicators do not encompass carbon dioxide emissions, a metric closely associated with green innovation efficiency. Therefore, the indicator for industrial solid waste emissions is excluded, and industrial wastewater, industrial waste gas, and carbon dioxide emissions are selected as indicators of environmental pollution undesirable outputs. The data in the table are sourced from the “China Statistical Yearbook”, the “China Science and Technology Statistical Yearbook”, the “China Finance Yearbook”, the “China Environmental Statistical Yearbook”, and the China Carbon Accounting Database (CEADs).
Table 1 presents a measurement index system for green innovation efficiency constructed upon the Super-SBM model, comprehensively capturing the integrated performance of green innovation across the dimensions of input, output, and environmental performance. This measurement approach overcomes the limitations of conventional Data Envelopment Analysis (DEA)models in handling undesirable outputs, while simultaneously underscoring the central role of technological efficiency within the paradigm of green development.

3.2.2. Explanatory Variable

(1)
National Comprehensive Big Data Pilot Zone Policy Event (DID)
To promote the innovative development of big data, following letters of approval from the National Development and Reform Commission, the Ministry of Industry and Information Technology, and the Central Internet Affairs Office, Guizhou Province became the first to be approved for the construction of a national comprehensive big data pilot zone in February 2016. In October of the same year, the National Development and Reform Commission, the Ministry of Industry and Information Technology, and other departments again allocated national comprehensive big data pilot zones in seven regions, including the Beijing–Tianjin–Hebei region. Therefore, this study identifies the treatment group based on the location of the big data comprehensive reform pilot zones, which include Guizhou, Beijing, Tianjin, Hebei, Guangdong, Shanghai, Henan, Chongqing, Shenyang, and Nei Mongol. To align with the research theme and ensure uniform measurement standards, this study selects provincial-level data from mainland China (excluding Tibet) for analysis, covering 30 provinces. Although Shenyang is itself a sub-provincial administrative region, as the capital city of a province with multiple strong cores, it can drive the high-level development of surrounding regions in the form of a metropolis [32]. Therefore, Shenyang in the treatment group is adjusted to Liaoning, and the data from Liaoning Province are removed in subsequent robustness checks to verify the robustness of the results. In accordance with the requirements of the quasi-natural experiment design, this study assigns a value of 1 to the provincial variables that belong to the big data comprehensive pilot zones during the experimental period, and 0 to all others.
(2)
New-Quality Productive Forces (NQP)
New-quality productive forces have proposed new requirements for the three essential elements of productive forces, in line with the new pattern of high-quality economic development in China, i.e., to inject new momentum and vitality into the Chinese economy from the three aspects of laborers, labor objects, and means of production [33]. Therefore, this study refers to the research of Feng Nan [16] and employs a comprehensive evaluation index system for new-quality productive forces that includes three dimensions: laborers, labor objects, and means of production, as shown in Table 2. The total index and sub-indexes are measured using the entropy method, with primary data sourced from the statistical yearbooks of various provinces and cities in China. The structure of labor force human capital follows Lin Shanlang [34]’s definition method for the advancement of industrial structure, dividing the level of education of the labor force into five levels based on primary school, junior high school, high school, college, and above, and measured using the vector angle method; the entrepreneurship activity index adopts the China Regional Innovation and Entrepreneurship Index (IRIEC) provided by the Beijing University Enterprise Big Data Center; the proportion of emerging strategic industries is measured by the ratio of the value added of emerging strategic industries to GDP, referring to the research of Tao Miaomiao [35]; in future industries, the number of robots is adjusted to the installation density of industrial robots, first obtaining the installation volume of industrial robots in various industries published by the IFR (International Federation of Robotics), then multiplying it by the percentage of the employment population in each province corresponding to the national economic industry classification from the “China Labor Statistics Yearbook”; the content of industrial solid waste in the industrial waste treatment indicator is explicitly defined as the comprehensive utilization volume of general industrial solid waste; the digital economy index adopts the Beijing University Digital Financial Inclusion Index; and the level of corporate digitalization refers to the research of Wu Fei et al. [36], using Python 3.12.0 to crawl the frequency of keywords such as artificial intelligence, blockchain, cloud computing, and big data from the annual reports of listed companies in various provinces and cities, categorize and aggregate them to form a total frequency, and then conduct a comprehensive measurement.
Within this framework, the labor dimension is represented by indicators such as the number of university students and the proportion of R&D personnel, serving to quantify the upgrading of human capital. The labor object dimension incorporates variables like the added value of the digital economy and the output of high-technology industries, reflecting transformations in the factor structure. Meanwhile, the labor materials dimension is embodied by the level of information infrastructure and the density of green technological capital, encapsulating the essence of novel productive forces centered on technological advancement and knowledge-intensive inputs. Together, these metrics furnish both the empirical foundation and theoretical underpinning for the construction of the core explanatory variables in subsequent analyses.

3.2.3. Control Variables

To better study the impact of big data innovation and development trials and new-quality productive forces on green innovation efficiency, and to enhance the accuracy of variable estimation, this study sets control variables as follows, drawing upon the research of Wei Shiwei et al. [37].
Openness (OP) is measured by the proportion of foreign capital actually utilized in GDP; the Industrial Structure (IS) is calculated following the formula provided by Xu Min and Jiang Yong [38], which first determines the value-added proportions of the primary, secondary, and tertiary industries, and then these proportions are weighted using coefficients of 1, 2, and 3, respectively; Fiscal Decentralization (FD) is measured by the ratio of fiscal budget revenue to fiscal budget expenditure; Urban Size (US) is measured by taking the natural logarithm of the permanent resident population; Infrastructure (IN) is measured by the per capita area of urban roads; Residential Consumption (RC) is measured by the proportion of the total retail sales of consumer goods to GDP.

3.2.4. Mediating Variables

This study aims to elucidate the mediating role of digital empowerment in regional green innovation efficiency from two aspects: the concentration of innovative talents and the government’s attention to ecological environment. In this regard, the concentration of innovative talents (ITG) is measured using the location quotient method, comparing the ratio of full-time equivalent R&D personnel to the total number of employed people within the region with the national ratio of full-time equivalent R&D personnel to the total national employment. The government’s attention to ecological environment (GEA) is measured by referencing the research of Tu Chaoyang et al. [39], which calculates the proportion of keywords such as “ecological environment”, “sustainable development”, and “environmental protection” in government work reports relative to the total word frequency. Intellectual Property Protection (IPP) is measured by the proportion of the turnover of technology markets to the regional GDP. The concentration of high-tech industries (HIG) is also measured using the location quotient method, comparing the ratio of the number of high-tech industry enterprises to the total number of employed people within the region with the national ratio of high-tech industry enterprises to the total national employment.

3.2.5. Spatial Weighting Matrix

Given the presence of demonstration effects, radiation effects, and suction effects, the variables under study in this research may exhibit spatial spillover effects between neighboring or closely related regions. Therefore, a spatial weighting matrix is introduced. In terms of the relationship between the explanatory variables and the dependent variable, the National Comprehensive Big Data Pilot Zone policy, new-quality productive forces, and green innovation efficiency mainly manifest economic interlinkages. Consequently, an economic spatial weighting matrix is chosen, with the weight determined by the reciprocal of the absolute difference in per capita GDP between two locations. This setting is based on the differences among economic variables to establish weights, where greater economic differences between two locations imply a weaker relationship, corresponding to a smaller weight.
w i j = 1 | d i d j |         1                         i = j i j
The element w i j represents the weight in the economic spatial weighting matrix, with d i and d j denoting the per capita actual GDP of regions i and j, respectively. A region’s weight for itself is set to 1.

4. Empirical Results and Analysis

4.1. Analysis of the Spatial Difference-in-Differences Model

4.1.1. Spatial Autocorrelation Analysis

This study initially employs the Global Moran’s Index to test for spatial autocorrelation in the distribution of the dependent variable, ensuring that it meets the requirements for the application of spatial econometric models. Table 3 reveals that the Global Moran’s Index for green innovation efficiency from 2009 to 2022 has consistently passed the 1% significance test, and most observations exhibit “high–high” or “low–low” clustering within and between regions (as illustrated in Figure 2), indicating that the spatial green innovation efficiency as the dependent variable in this study is significantly positively correlated across space.
Figure 2 reveals a pronounced clustering within the first and third quadrants across both periods, indicating a strong spatial homogeneity in green innovation efficiency. Specifically, regions exhibiting high efficiency tend to be contiguous with similarly high-efficiency areas, while low-efficiency regions cluster likewise. This spatial pattern further substantiates the imperative of incorporating spatial econometric models in the analysis.

4.1.2. Identification, Selection, and Testing of Spatial Econometric Models

To ascertain the appropriate spatial econometric model to be combined with the difference-in-differences method, this study conducts a pre-test and a post-test for identification, selection, and testing of the spatial econometric models. The pre-test employs the Lagrange Multiplier (LM) test to determine whether spatial lag or spatial error terms should be included in the model. The post-test is conducted to select the most suitable model, utilizing the Likelihood Ratio (LR) test, Wald test, and Hausman test as specific methods.
The results of the statistical tests corresponding to the various measures are presented in Table 4. Under the economic spatial weighting matrix, both the spatial lag model and the spatial error model pass the LM and Robust LM test statistics at the 1% significance level, thus leading to the preliminary conclusion that the spatial Durbin model is the most appropriate choice. The Wald test and LR test both reject the null hypothesis at the 1% level, indicating that the spatial Durbin model does not degenerate into the spatial lag or spatial error models. Additionally, the Hausman test is significant at the 1% level, supporting the application of fixed effects in the spatial Durbin model within this study. In summary, this study confirms the use of the difference-in-differences method combined with the Spatial Durbin Model (SDM-DID) as the spatial difference-in-differences model for this research.

4.1.3. Regression Analysis of the Spatial Difference-in-Differences Model

This study employs the Difference-in-Differences-Spatial Durbin Model (SDM-DID) with fixed effects as the spatial econometric model to investigate the influence relationships among digital empowerment, new-quality productive forces, and green innovation efficiency. In the SDM-DID model, the core explanatory variables and their interaction terms appear in both the explained variables and their spatial lag terms, so the estimation results can be divided into two effects: local effects and adjacent effects. Among them, the local effects refer to the impact of policies or variables on green innovation efficiency in the region itself; while the adjacent effects reflect the indirect impact of the policy or variable on the adjacent region through the spatial spillover mechanism. This paper mainly extracts these two types of effects based on the SDM structure to identify the direct role and diffusion path of digital empowerment and new quality productivity in the interaction between regions, and provide empirical evidence in the spatial dimension for green policy design. To further analyze how the variables affect the regionally, the study reports on local effects, adjacent effects, and total effects in the regression results. The parameter estimates of the SDM-DID model are presented in Table 5 as follows.
In Model 3, the total effect coefficient of the national big data comprehensive pilot zone policy variable passes the significance test at the 1% level, with local and neighbor effect coefficients of 0.031 and 0.046, respectively, which are significant at the 1% and 5% levels. This indicates that the implementation of the pilot policy not only enhances local green innovation efficiency but also drives an increase in the green innovation efficiency of surrounding regions through spillover effects, thus supporting H1 and H2. The total effect coefficient of new-quality productive forces is significant at the 1% level, with local and neighbor effect coefficients of 0.040 and 0.186, respectively, passing the 5% and 1% significance tests. This reflects that the development and improvement of new-quality productive forces also significantly enhance the green innovation efficiency of both the local region and surrounding regions, thereby supporting H3 and H4.

4.1.4. Endogeneity Test of Spatial Dubin Model

To appropriately address the potential endogeneity issue arising from bidirectional causality, this paper employs instrumental variables (IVs) for re-estimation. Drawing upon existing research [40], the degree of terrain undulation within provinces is selected as the instrumental variable, as this indicator is an inherent natural characteristic and is inherently exogenous, thus satisfying the selection criteria for instrumental variables. Furthermore, to match the panel data, the average level of novel productive forces across other provinces, excluding the sample province, is used to reflect the time-varying characteristic of the instrumental variable.
Specifically, the interaction between the degree of terrain undulation and the average level of novel productive forces across other provinces is chosen as the instrumental variable for the two-stage least squares (2SLS) estimation. The parameter estimation results are presented in Table 6. The estimated coefficient of the IV is significantly positive at the 1% level, indicating that the instrumental variable satisfies the positive correlation assumption. Additionally, the Cragg–Donald Wald F statistic and the Kleibergen–Paap Wald rk F statistic pass the weak instrument test, while the Anderson–Rubin Wald test rejects the null hypothesis that the sum of the endogenous regression coefficients is equal to zero, proving the validity of the instrumental variable. The second-stage regression results are consistent with the benchmark regression results, demonstrating that the driving effect of novel productive forces still exists after considering the endogeneity issue.

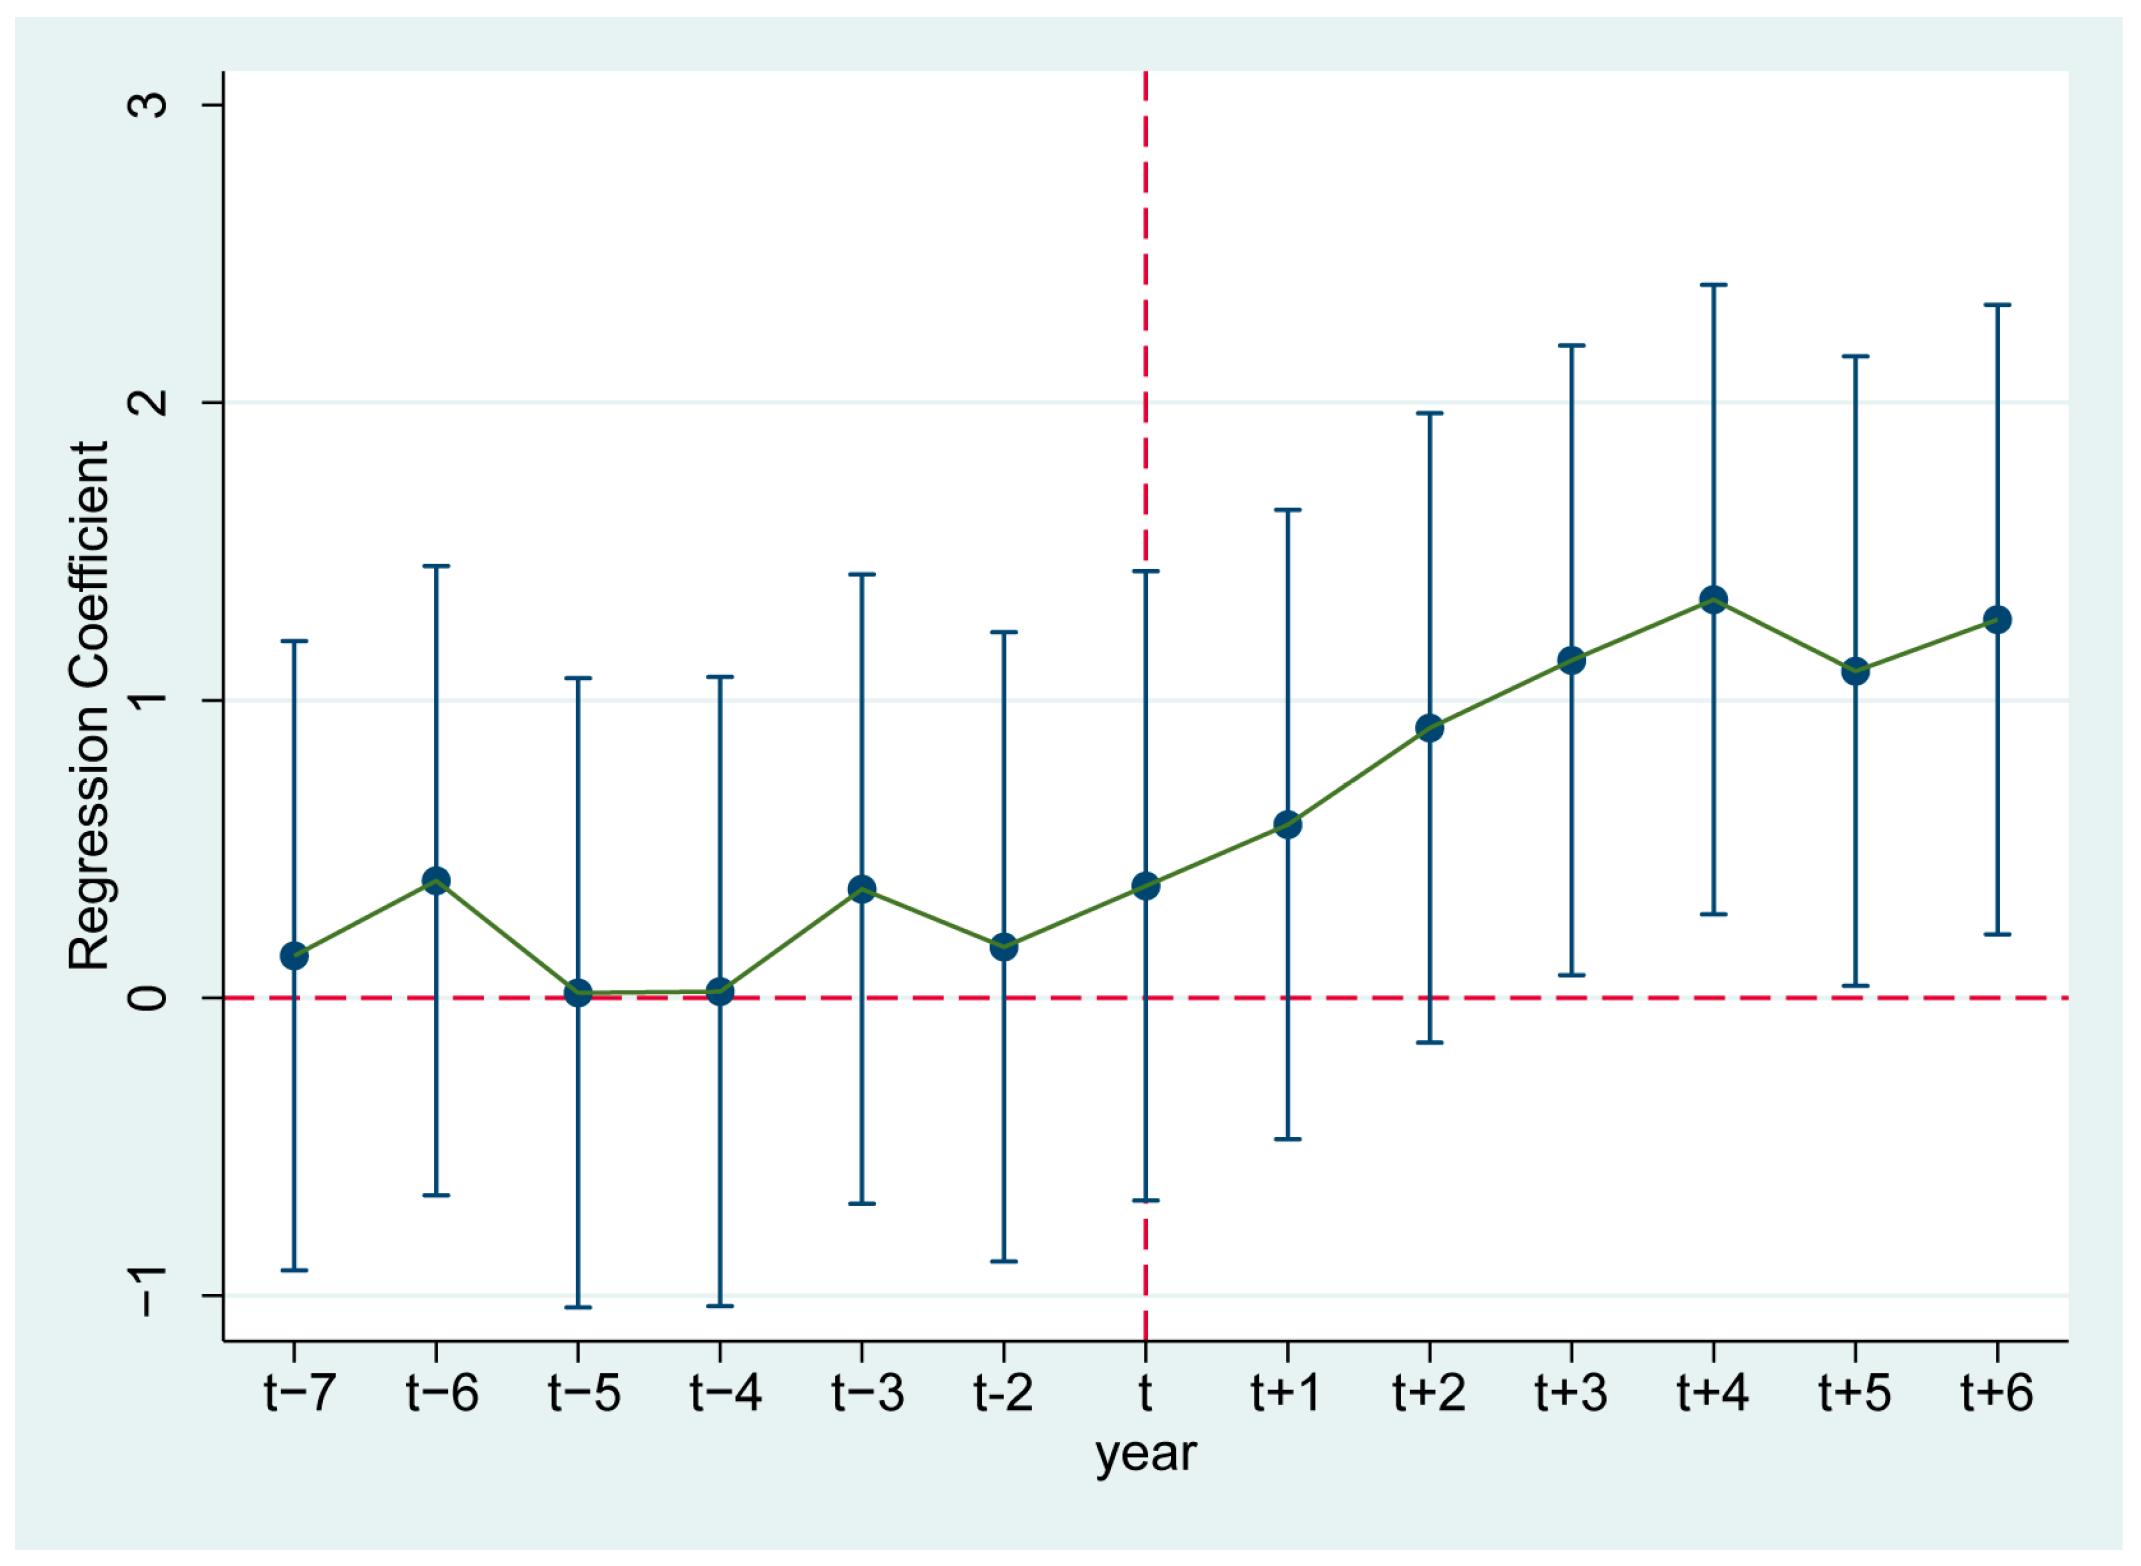
4.1.5. Parallel Trends Test

In accordance with the requirements of the quasi-natural experiment, it is necessary to verify whether the treatment group and control group have similar trends prior to the implementation of policy intervention, in order to meet the requirements for constructing the spatial difference-in-differences empirical model. This study follows the research of Qu Fang and Xu Lei [41] and sets up the parallel trends test model as follows:
G I E i t = α + θ 1 p o l i c y i ( t 7 ) + θ 2 p o l i c y i ( t 6 ) + + θ 8 p o l i c y i t + + θ 12 p o l i c y i ( t + 5 ) + θ 13 p o l i c y i ( t + 6 ) + γ x i + μ i + ε i t  
Among them, p o l i c y i ( t ± n ) represents the dummy variable for n years before and after the implementation of the policy. If the regression coefficient of p o l i c y i ( t n ) is not significant, it indicates that the treatment group and the control group have parallel trends. If the regression coefficient of p o l i c y i ( t + n ) is significant, it suggests that the policy effect of the National Big Data Comprehensive Pilot Zone is evident. The parallel trends test graph shown in Figure 3 demonstrates that after the policy intervention in the second period, the regression coefficient is significantly positive, passes the parallel trends test, and aligns with the research design.

4.2. Analysis of the Dual Machine Learning Model

4.2.1. Dual Machine Learning Baseline

This study employs a dual machine learning model based on the random forest algorithm for parameter estimation in Models 4 and 5, with a sample split ratio of 1:4. Table 7 reveals that the regression coefficients of digital empowerment and new-quality productive forces are significantly positive at the 1% level, with respective coefficients of 0.058 and 0.151. This result further validates the parameter estimates from the spatial difference-in-differences model.
The regression outcomes from Models 4 and 5 demonstrate that the positive effects of digital empowerment and novel productive forces remain significant within the double machine learning framework, thereby further reinforcing the robustness of the study’s conclusions.

4.2.2. Robustness Analysis

(1)
Adjustment of the Research Sample Scope
At the stage of quasi-natural experiment design, this study revised the city of Shenyang as Liaoning Province within the big data comprehensive pilot zone treatment group. To exclude the interference of actual administrative district factors, the Liaoning Province data were excised, and the test was re-performed. The parameter estimation results in Table 8 are essentially congruent with those in Table 7, thereby affirming the robustness of the research model and its conclusions.
(2)
Adjustment of the Sample Ratio in Dual Machine Learning
The allocation of training and testing sets in machine learning is typically determined arbitrarily, and to mitigate potential biases arising from this determination, this study adjusted the sample split ratio to 1:2 and re-performed the test. The parameter estimation results in Table 8 are essentially consistent with those in Table 7, thereby confirming the robustness of the research model and its conclusions.
(3)
Replacement of Machine Learning Algorithms
In light of the diverse scenarios that can be encountered, machine learning offers a range of selectable algorithms. Beyond the random forest algorithm used in the benchmark regression, this study considered substituting it with lasso regression and neural network algorithms to re-estimate the parameters. The results in Table 8 are essentially consistent with those in Table 7, thereby confirming the robustness of the research model and its conclusions.
The results under various sample specifications and algorithmic substitutions are broadly consistent, indicating the robustness of the empirical analysis presented in this paper. The study’s conclusions hold across multiple model configurations.

4.2.3. Heterogeneity Analysis

(1)
“Geography–Resource–Environment” Differences
China’s vast territory and significant regional disparities in development are evident. The eastern regions generally possess superior innovation institutional environments, more comprehensive infrastructure, stronger green development awareness, higher levels of marketization, and greater concentrations of talent [42], which are conducive to enhancing green innovation efficiency. In contrast, the central and western regions lag behind in terms of economic and technological development, transportation, capital, and talent, leading to lower levels of green innovation. As can be seen from Table 8, the regression coefficients for digital empowerment and new-quality productive forces in the eastern provinces are higher than those in the central and western provinces, demonstrating that the “geography–resource–environment” advantages of the eastern region have significantly boosted regional green innovation efficiency.
(2)
Carbon Emission Trading Market
The carbon emission trading market, through its market-based mechanism, controls greenhouse gas emissions and exerts influence on aspects such as green investment, green innovation, and energy structure transformation. This study, based on China’s carbon emission trading pilot policy, classifies Beijing, Tianjin, Shanghai, Chongqing, Hubei, and Guangdong as carbon trading provinces, which commenced trading in the carbon market in 2013, and the rest as non-carbon trading provinces for the purpose of heterogeneity analysis. Table 8 reveals that, compared to provinces without carbon emission trading, the regression coefficients of the carbon trading pilot province variables are larger and the levels of significance are higher, indicating that digital empowerment and new-quality productive forces have a more pronounced promotional effect on green innovation efficiency. In conjunction with the research of Song Deyong et al. [43], on one hand, carbon emission trading can increase the expected returns of green innovation, and on the other hand, as a factor of production, the rising price of carbon emissions can drive the development of green technology research. Digital empowerment and new-quality productive forces help to break through key core technologies, improve the efficiency of industry resource allocation, and correct market failures, thereby enhancing green innovation efficiency.
(3)
Comprehensive Innovation and Reform Experiment
The policy of the comprehensive innovation and reform experiment is an important measure for the in-depth implementation of the innovation-driven development strategy, and it is closely related to the subject of this study. Given that the policy was introduced around the same time as the big data comprehensive pilot zone policy, this study proposes to conduct a heterogeneity analysis based on this, exploring whether different innovation and reform environments might affect the research conclusions. Similarly, the eight regions where the comprehensive innovation and reform experiment is to be deployed are categorized as innovative provinces, and a comparative analysis is conducted with the other provinces. The regression results in Table 9 indicate that the regression coefficients for digital empowerment and new-quality productive forces in the innovative provinces are slightly greater than those in other provinces, suggesting that under the policy environment that incentivizes scientific and technological innovation, eliminates institutional and systemic shortcomings, and comprehensively deepens reforms, digital empowerment and new-quality productive forces can better promote the enhancement of green innovation efficiency.
The results of the heterogeneity analysis indicate that digital empowerment and novel productive forces exert more pronounced effects in regions with policy or environmental advantages such as the eastern region, carbon trading pilot areas, and provincial innovation reform zones, suggesting that relevant policies should be implemented in a contextually appropriate and regionally targeted manner.

4.2.4. Mediation Effect Testing

To examine whether digital empowerment and new-quality productive forces have a mediating effect on regional green innovation efficiency, this study conducted a test based on the dual machine learning model, drawing upon the research of He Jin’an et al. [44] and Zhao Ao et al. [45]. The parameter estimates, statistics, and mediation ratios are presented in Table 10 and Table 11. The Sobel, Aroian, and Goodman statistics are employed to test the significance of the mediating effect, with the mediation ratio indicating the proportion of the mediating effect relative to the total effect.
The regression results show that the regression coefficients for the mediating effects of innovation talent aggregation and government attention to ecological environment, respectively, are 0.081 and 0.096, with mediation ratios of 50.05% and 47.42%. This indicates that digital empowerment can enhance regional green innovation efficiency by promoting the aggregation of innovative talent and strengthening government attention to ecological environment, thereby validating Hypotheses H5 and H6. For new-quality productive forces, the regression coefficients for the mediating effects of strengthening intellectual property protection and promoting the aggregation of high-tech industries are 0.091 and 0.039, with mediation ratios of 30.78% and 13.10%, respectively. This suggests that new-quality productive forces can boost regional green innovation efficiency by reinforcing intellectual property protection and advancing the concentration of high-tech industries, thereby confirming Hypotheses H7 and H8.
The bootstrap test further confirms the significance of the various mediating pathways, validating the critical roles of talent aggregation, governmental attention, intellectual property protection, and high-technology industry clustering in the mechanism of transmission, thereby supporting Hypotheses H5 through H8.

5. Conclusions, Policy Recommendations, and Limitations

5.1. Summary of Findings

This study employed both the spatial difference-in-differences model and the dual machine learning approach, utilizing panel data from 30 Chinese mainland provinces (excluding Tibet) from 2009 to 2022. By employing a quasi-natural experiment design to investigate the interplay among digital empowerment, new-quality productive forces, and green innovation efficiency, the following conclusions were drawn:
(1)
Within the policy context of the National Big Data Comprehensive Pilot Zone, digital empowerment significantly enhanced regional green innovation efficiency through scale effects, resource allocation effects, and technological progress effects. Additionally, leveraging the policy demonstration effect of the National Big Data Comprehensive Pilot Zone and the innovative diffusion and knowledge spillover effects of the digital economy, digital empowerment exerted a significant positive spatial spillover effect on the green innovation efficiency of neighboring regions;
(2)
New-quality productive forces significantly enhanced regional green innovation efficiency by improving the quality of laborers, fostering the aggregation of innovative talent, diversifying the forms of labor objects, and promoting the iterative upgrading of means of production. Under the goal of regional coordinated development in China, new-quality productive forces can effectively exert an economic radiation effect, facilitating the interaction of factors such as the movement of innovative talent, technology diffusion, knowledge spillover, and industrial synergy over a broader scope. This has a significant positive spatial spillover effect on the green innovation efficiency of neighboring regions;
(3)
In terms of mediation effects, digital empowerment can enhance regional green innovation efficiency by promoting the aggregation of innovative talent and strengthening government attention to ecological environment. Conversely, new-quality productive forces can increase regional green innovation efficiency by reinforcing intellectual property protection and promoting the concentration of high-tech industries.
It is worth emphasizing that, although this study focuses on China as the subject of analysis, its findings possess a certain degree of extrapolative value for other nations. On one hand, China is navigating a critical juncture in its transition from factor-driven to innovation-driven growth, confronting the dual imperatives of resource and environmental constraints alongside the pursuit of high-quality development; its strategies for green transformation and digital empowerment thus hold emblematic significance among emerging economies. On the other hand, China’s vast territorial expanse, pronounced regional developmental disparities, and marked heterogeneity in digital infrastructure provide a natural experimental setting to examine the adaptability of diverse policies and mechanisms across varied regional contexts. Consequently, the conclusions drawn herein offer instructive insights for other developing countries exhibiting similar characteristics—such as India, Brazil, and South Africa—which likewise grapple with ecological pressures, are accelerating digital transformation, and endeavor to promote green development through technological innovation. Naturally, the precise applicability of these findings necessitates careful calibration in accordance with each country’s institutional frameworks, governance capacities, and technological foundations.

5.2. Policy Recommendations

(1)
Continue to adhere to the policy objectives of the National Big Data Comprehensive Pilot Zone. Firstly, leverage the scale effects of digital empowerment by expanding digital infrastructure construction, increasing investments in next-generation digital communication technologies such as 5G, data centers, and cloud computing centers, and promoting the centralized management and shared utilization of data resources. Encourage and support enterprises in utilizing big data sets for market research and decision analysis, adjusting their production and operation content in line with market guidance to seize market opportunities promptly and reduce resource waste. Establish cross-industry information sharing platforms to facilitate government–enterprise information interaction and support the development of green new products and services using public data. Secondly, utilize the resource allocation effects of digital empowerment to enhance supply chain management efficiency through digital technology, optimize the allocation of innovation resources with intelligent algorithms, and guide government subsidies and social funds towards supporting the research and development institutions and incubators for green technologies, providing them with financial support. Lastly, emphasize the technological progress effects of digital empowerment, supporting enterprises in increasing their research and development investments in the green innovation field, and encouraging the acceleration of the transformation of technological achievements through industry-academia-research collaboration. By improving innovation incentive mechanisms, provide venture capital and startup loans for green innovation projects, and reduce the costs for green innovation enterprises;
(2)
Accelerate the formation and development of new-quality productive forces. Regarding laborers, efforts should be made to enhance the quality of the workforce, focusing on improving the digital skills and innovation capabilities of workers with higher education. Encourage higher education institutions to offer more courses on green technology and sustainable development to cultivate future green innovation talent. Provide lifelong learning opportunities through online learning platforms and remote education projects to continuously update knowledge and skills for workers. In terms of the objects of labor, on one hand, promote the integration of traditional and emerging industries, support traditional industries in reducing energy consumption through green innovation, and concentrate on the development of emerging industries such as new energy and new materials, providing policy support such as tax reductions. Encourage traditional and emerging industries to share technical achievements and market resources by establishing cooperative networks. On the other hand, drive the green transformation and upgrading of industries, encourage enterprises to adopt clean production technologies and energy-saving and emission-reduction measures, and promote circular economic models. Regarding means of production, strengthen the research and application of key core technologies such as the Internet of Things, blockchain, and artificial intelligence, promote the adoption of intelligent management systems, upgrade production processes towards digitalization, intelligence, and automation, encourage the use of renewable and clean energy, and support the construction of green buildings and green transportation infrastructure to promote the sustainable development of means of production;
(3)
Focus on the linkage between “digital empowerment–new-quality productive forces–green innovation.” First, leverage the policy advantages of the pilot zones to provide a favorable working and living environment for green innovation talent, establish a flexible talent mobility mechanism, and strengthen the dissemination of knowledge in digital technology and green innovation fields. Second, enhance the government’s focus on ecological and environmental concerns, utilize digital technology to establish an environmental monitoring system for real-time monitoring of pollutant emissions; promptly identify and address issues; continue to introduce and promote green innovation policies, such as establishing a rapid review channel for green patent technologies; and use digital media and platforms to strengthen environmental protection awareness and public participation. Third, promptly follow up with the improvement of relevant laws and regulations on intellectual property protection in new technology fields, establish a rapid response mechanism, simplify the handling process of intellectual property infringement cases, and shorten the period of rights protection. Fourth, build high-tech industrial parks within the pilot zones or other key regions to attract green high-tech enterprises and projects, and collaborate with digital enterprises and technology companies within the region;
(4)
Identify the interactivity and heterogeneity of regional development. In terms of interactivity, fully leverage the policy demonstration effect by encouraging the selection of demonstration projects that promote green innovation through digital empowerment within the pilot zones. These should be developed into case studies and promoted through conferences and exchange meetings. Establish cross-regional cooperation mechanisms, encouraging enterprises, research institutions, and government departments from different regions to collaborate. Simultaneously, create an interconnective communication platform for multiple stakeholders, encouraging green innovation enterprises to form cooperative relationships with surrounding regional enterprises through industrial chain integration, facilitating the free flow of knowledge, technology, and talent, and accelerating the popularization and application of green technologies. Regarding heterogeneity, fully consider the conditions of different regions in terms of economic development levels and resource endowments. Encourage regions with higher levels of digital empowerment and new-quality productive forces to boldly try and explore new paths for green innovation. Less developed regions should gradually accumulate innovative elements and, at the appropriate time, receive the transfer of advantageous green industries. Support carbon trading provinces in using market mechanisms to promote green innovation, encourage enterprises to participate in carbon trading to achieve emission reduction goals; and at the same time, increase support for innovative provinces to fully leverage their leading role in green innovation.

5.3. Limitations and Future Plans

While this study provides a systematic analysis of how digital empowerment and new quality productivity influence green innovation efficiency, several limitations remain. First, our analysis is based on provincial panel data from China, which—although representative within the national context—may face constraints when extrapolated to other countries due to differences in institutional settings, technological capabilities, and governance structures. Second, although we employed spatial DID and Double Machine Learning models to enhance causal inference, potential model specification errors and omitted variables cannot be entirely ruled out. Future studies may incorporate more granular micro-level data to validate these mechanisms. Third, due to the reporting lag in official statistics, our study period ends in 2022 and does not yet capture the potential effects of new policies or structural adjustments that emerged after 2023. Further research can update the dataset and adopt dynamic modeling strategies to improve timeliness and robustness.

Author Contributions

Conceptualization, Q.L. and K.L.; methodology, software, validation, formal analysis, and writing—original draft preparation, Q.L., S.L. and L.Y.; investigation, resources, and data curation, Z.B. and Y.W.; writing—review and editing, supervision, and project administration, T.G. and K.L. All authors have read and agreed to the published version of the manuscript.

Funding

This research was supported by the Key Project under the Zhejiang Provincial Educational Science Planning: Empowering Higher Engineering Education and the Cultivation of “Outstanding Engineers” in Zhejiang Province through AIGC: An Analysis of the Current Status, Identification of Application Scenarios, and Exploration of Development Pathways (2025SB083).

Institutional Review Board Statement

Not applicable.

Informed Consent Statement

Not applicable.

Data Availability Statement

The original contributions presented in the study are included in the article, further inquiries can be directed to the corresponding author.

Acknowledgments

The authors would like to thank the editors and anonymous reviewers for their thoughtful and constructive comments.

Conflicts of Interest

The authors declare no conflicts of interest.

References

  1. Xiao, L.-m.; Zhang, X.-p. Spatio-temporal characteristics of coupling coordination between green innovation efficiency and ecological welfare performance under the concept of strong sustainability. J. Nat. Resour. 2019, 34, 312–324. [Google Scholar] [CrossRef]
  2. Wang, H.; Lian, X.; Lin, D. Empirical analysis on the impact of green technological innovation efficiency on regional green growth performance. Sci. Sci. Manag. ST 2016, 6, 80–87. [Google Scholar]
  3. Chong, T.T.L.; Wang, S.; Zhang, C. Understanding the digital economy in China: Characteristics, challenges, and prospects. Econ. Political Stud. 2023, 11, 419–440. [Google Scholar] [CrossRef]
  4. Gao, P. Promoting High-Quality Economic Development. In A Shift Toward High-Quality Development of China; Springer: Berlin/Heidelberg, Germany, 2024; pp. 165–189. [Google Scholar]
  5. Wu, J.; Chen, T. Impact of digital economy on dual circulation: An empirical analysis in China. Sustainability 2022, 14, 14466. [Google Scholar] [CrossRef]
  6. Lu, J.; Guo, Z.; Wang, Y. Development Level, Regional Differences, and Improvement Path of New Quality Productive Forces. J. Chongqing Univ. Soc. Sci. Ed. 2024, 30, 1–17. [Google Scholar]
  7. Zhang, J.; Xu, Z.; Ding, S. The Logical Mechanism, Strategic Value, and Practical Path of the Interaction Between New Qualitative Productivity and Deep Integration of Data and Reality. J. Beijing Univ. Technol. (Soc. Sci. Ed.) 2024, 24, 114–124. [Google Scholar]
  8. Yongfei, J.; Zhenyu, W. How Does the Digital Economy Affect Urban Integration Innovation with the Combination of Multiple Effects? The Case of the Yangtze River Delta Urban Agglomeration. Sci. Technol. Prog. Policy 2023, 40, 21–30. [Google Scholar]
  9. Gao, Q.; Cheng, C.; Sun, G. Big data application, factor allocation, and green innovation in Chinese manufacturing enterprises. Technol. Forecast. Soc. Change 2023, 192, 122567. [Google Scholar] [CrossRef]
  10. Song, R.; Hu, H. Impact of green technology innovation based on IoT and industrial supply chain on the promotion of enterprise digital economy. PeerJ Comput. Sci. 2023, 9, e1416. [Google Scholar] [CrossRef]
  11. Wan, Q.; Tang, S.; Jiang, Z. Does the development of digital technology contribute to the innovation performance of China’s high-tech industry? Technovation 2023, 124, 102738. [Google Scholar] [CrossRef]
  12. Zixun, Q.; Yahong, Z. Development of digital economy and regional total factor productivity: An analysis based on national big data comprehensive pilot zone. J. Financ. Econ. 2021, 47, 4–17. [Google Scholar]
  13. Liu, J.; Zhao, Q. Mechanism testing of the empowerment of green transformation and upgrading of industry by the digital economy in China. Front. Environ. Sci. 2024, 11, 1292795. [Google Scholar] [CrossRef]
  14. Jin, Z.; Huixin, Y.; Ruizhan, L. Empirical research on private entrepreneur human capital in China and enterprises’ growth performance: A comparative analysis between high-tech enterprises and traditional enterprises. J. Chin. Entrep. 2010, 2, 175–195. [Google Scholar]
  15. Wang, C.; Wang, L.; Xue, Y.; Li, R. Revealing spatial spillover effect in high-tech industry agglomeration from a high-skilled labor flow network perspective. J. Syst. Sci. Complex. 2022, 35, 839–859. [Google Scholar] [CrossRef]
  16. Feng, N.; Yan, M.; Yan, M. Spatiotemporal Evolution and Influencing Factors of New-Quality Productivity. Sustainability 2024, 16, 10852. [Google Scholar] [CrossRef]
  17. Pan, W.; Xie, T.; Wang, Z.; Ma, L. Digital economy: An innovation driver for total factor productivity. J. Bus. Res. 2022, 139, 303–311. [Google Scholar] [CrossRef]
  18. Fan, F.; Yang, B.; Wang, S. The convergence mechanism and spatial spillover effects of urban industry-university-research collaborative innovation performance in China. Technol. Anal. Strateg. Manag. 2025, 37, 551–567. [Google Scholar] [CrossRef]
  19. Yu, H.; Ke, H.; Ye, Y.; Fan, F. Agglomeration and flow of innovation elements and the impact on regional innovation efficiency. Int. J. Technol. Manag. 2023, 92, 229–254. [Google Scholar] [CrossRef]
  20. Chen, B.; Mu, X.; Liu, C. Research on the Inner Mechanism and Practical Path of the Transformation of Scientific and Technological Achievements to Accelerate the Development of New Quality Productivity. J. Beijing Inst. Technol. (Soc. Sci. Ed.) 2025, 27, 57–68. [Google Scholar]
  21. Junfeng, L. Research on the impact of digital economy on labor resource allocation: Evidence from China. PLoS ONE 2024, 19, e0297449. [Google Scholar] [CrossRef]
  22. Bai, D.; Li, M.; Wang, Y.; Mallek, S.; Shahzad, U. Impact mechanisms and spatial and temporal evolution of digital economy and green innovation: A perspective based on regional collaboration within urban agglomerations. Technol. Forecast. Soc. Change 2024, 207, 123613. [Google Scholar] [CrossRef]
  23. Huang, H.; Huang, H.; Xiao, Y.; Xiang, X. Industrial structure upgrading, government’s attention to ecological environment and the efficiency of green innovation: Evidence from 115 resource-based cities in China. J. Nat. Resour. 2024, 39, 104–124. [Google Scholar] [CrossRef]
  24. Xu, S.; Wang, J.; Peng, Z. Study on the Promotional Effect and Mechanism of New Quality Productive Forces on Green Development. Sustainability 2024, 16, 8818. [Google Scholar] [CrossRef]
  25. Chagas, A.L.S.; Azzoni, C.R.; Almeida, A.N. A spatial difference-in-differences analysis of the impact of sugarcane production on respiratory diseases. Reg. Sci. Urban Econ. 2016, 59, 24–36. [Google Scholar] [CrossRef]
  26. Ma, L.; Dai, H. National High-Tech Zones, Scientific-Technological Innovation and Industrial Agglomeration: Empirical Analysis Based on the Spatial Difference-in-Differences Model. J. Shanxi Univ. Financ. Econ. 2023, 45, 28–38. [Google Scholar]
  27. Chernozhukov, V.; Chetverikov, D.; Demirer, M.; Duflo, E.; Hansen, C.; Newey, W.; Robins, J. Double/debiased machine learning for treatment and structural parameters. CeMMAP Work. Pap. 2017, 21, 88–98. [Google Scholar]
  28. Knaus, M.C.; Lechner, M.; Strittmatter, A. Machine learning estimation of heterogeneous causal effects: Empirical Monte Carlo evidence. Econom. J. 2021, 24, 134–161. [Google Scholar] [CrossRef]
  29. Zheng, X.; Yu, L.; Liu, Q.; Xu, R.; Tang, J.; Yu, X.; Lv, K. Digital Government Construction, Bidirectional Interaction Between Technological and Spiritual Civilization, and Achieving Dual Control of Sustainable Energy: Causal Inference Using Spatial DID and Dual Machine Learning. Sustainability 2025, 17, 4975. [Google Scholar] [CrossRef]
  30. Xu, S.; Wu, T.; Zhang, Y. The spatial-temporal variation and convergence of green innovation efficiency in the Yangtze River Economic Belt in China. Environ. Sci. Pollut. Res. 2020, 27, 26868–26881. [Google Scholar] [CrossRef]
  31. Zhang, J.; Zeng, W.; Wang, J.; Yang, F.; Jiang, H. Regional low-carbon economy efficiency in China: Analysis based on the Super-SBM model with CO2 emissions. J. Clean. Prod. 2017, 163, 202–211. [Google Scholar] [CrossRef]
  32. Zhang, W.; Wang, B.; Wang, J.; Wu, Q.; Wei, Y.D. How does industrial agglomeration affect urban land use efficiency? A spatial analysis of Chinese cities. Land Use Policy 2022, 119, 106178. [Google Scholar] [CrossRef]
  33. Lin, L.; Gu, T.; Shi, Y. The influence of new quality productive forces on high-quality agricultural development in China: Mechanisms and empirical testing. Agriculture 2024, 14, 1022. [Google Scholar] [CrossRef]
  34. Lin, S.; Zhou, Z.; Hu, X.; Chen, S.; Huang, J. How can urban economic complexity promote green economic growth in China? The perspective of green technology innovation and industrial structure upgrading. J. Clean. Prod. 2024, 450, 141807. [Google Scholar] [CrossRef]
  35. Tao, M.; Poletti, S.; Wen, L.; Sheng, M.S. Modelling the role of industrial structure adjustment on China’s energy efficiency: Insights from technology innovation. J. Clean. Prod. 2024, 441, 140861. [Google Scholar] [CrossRef]
  36. Wu, F.; Hu, H.; Lin, H.; Ren, X. Digital transformation of enterprises and capital market performance: Empirical evidence from stock liquidity. Manag. World 2021, 37, 130–144. [Google Scholar]
  37. Wei, S.; Du, J.; Pan, S. How does digital economy promote green innovation? Empirical evidence from Chinese cities. China Econ. Transit. (CET) 2022, 5, 408–427. [Google Scholar]
  38. Min, X.; Yong, J. Can the upgrading of China’s industrial structure narrow the gap between urban and rural consumption? Research on quantitative economy. Tech. Econ. Res. 2015, 13, 34–45. [Google Scholar]
  39. Tu, C.; Liang, Y.; Fu, Y. How does the environmental attention of local governments affect regional green development? Empirical evidence from local governments in China. Humanit. Soc. Sci. Commun. 2024, 11, 371. [Google Scholar] [CrossRef]
  40. Fang, Q.; Jiancheng, W.; Qin, X. How does the digital economy affect farmers’ income?—Evidence from the development of rural E-commerce in China. China Econ. Q. 2022, 22, 591–612. [Google Scholar]
  41. Qu, F.; Xu, L.; He, C. Leverage effect or crowding out effect? Evidence from low-carbon city pilot and energy technology innovation in China. Sustain. Cities Soc. 2023, 91, 104423. [Google Scholar] [CrossRef]
  42. Hu, B.; Yuan, K.; Niu, T.; Zhang, L.; Guan, Y. Study on the spatial and temporal evolution patterns of green innovation efficiency and driving factors in three major urban agglomerations in China—Based on the perspective of economic geography. Sustainability 2022, 14, 9239. [Google Scholar] [CrossRef]
  43. Liu, B.; Sun, Z.; Li, H. Can carbon trading policies promote regional green innovation efficiency? Empirical data from pilot regions in China. Sustainability 2021, 13, 2891. [Google Scholar] [CrossRef]
  44. He, J.; Peng, F.; Xie, X. Mixed-ownership reform, political connection and enterprise innovation: Based on the double/unbiased machine learning method. Sci. Technol. Manag. Res 2022, 42, 116–126. [Google Scholar]
  45. Zhang, A.; Qi, N. Civil-to-dual-use enterprise transition in civil-military integration: A complex network game approach. Technol. Anal. Strateg. Manag. 2025, 1–18. [Google Scholar] [CrossRef]
Figure 1. Mechanism of action of digital empowerment and new-quality productive forces on regional green innovation efficiency.
Information 16 00578 g001
Figure 2. Scatter plot of the Moran’s Index of green innovation efficiency in 2009 and 2022.
Information 16 00578 g002
Figure 3. Results of the parallel trends test.
Information 16 00578 g003
Table 1. Green innovation efficiency measurement indicator system.
Factor ItemsIndicatorsCharacterization Variables
Input FactorsR&D Personnel InputFull-time Equivalent R&D Personnel (ten thousand person-years)
Capital InvestmentR&D Capital Stock
(hundred million yuan)
Output FactorKnowledge and Technology OutputNumber of Granted Green Invention Patent Applications
(ten thousand)
Product OutputNew Product Sales Revenue
(hundred million yuan)
Undesirable OutputInnovation FailuresYear-on-Year Ratio of Non-performing Loans in Commercial Banks
Environmental PollutionIndustrial Wastewater Discharge Volume (hundred million tons)
Industrial Waste Gas Emission Volume (hundred million standard cubic meters)
Carbon Dioxide Emissions
(hundred million tons)
Table 2. Measurement index system for novel productive forces.
DimensionLevel I
Evaluation Projects
Level II
Evaluation Projects
Level III
Evaluation Projects
Proxy DataIndicator Attributes
Labor ForceWorker Skill LevelEducational AttainmentAverage Attainment of Education per CapitaAverage Years of Education per Capitapositive
Human Capital StructureLabor Force Human Capital CompositionEducation levels are segmented into five tiers, measured via vector angle analysispositive
University Student CompositionProportion of University Students in the Total Populationpositive
Labor ProductivityPer Capita OutputPer Capita GDPGDP/Total Populationpositive
Per Capita IncomeAverage WageAverage Wage of Employed Staffpositive
Laborer MindsetEmployment PhilosophyProportion of Tertiary Sector EmploymentTertiary Sector Employment/Total Employmentpositive
Entrepreneurial SpiritEntrepreneurial ActivityChina Regional Innovation and Entrepreneurship Index by PekingUniversitypositive
Labor
Object
New Quality IndustriesStrategic Emerging IndustriesShare of Emerging Strategic IndustriesValue Added of Emerging Strategic Industries/GDPpositive
Future IndustriesIndustrial Robot Installation DensityNumber of Installed Industrial Robots × (Regional Employment/Total National Employment)positive
Ecological EnvironmentGreen Environmental ProtectionForest Coverage RateForest Coverage Ratepositive
Environmental Protection EffortsEnvironmental Protection Expenditure/Government Public Fiscal Expenditurepositive
Pollution ReductionPollutant EmissionsSulfur Dioxide Emissions/GDPnegative
Wastewater Discharge/GDPnegative
General Industrial Solid Waste Generation/GDPnegative
Industrial Waste ManagementNumber of Industrial Wastewater Treatment Facilitiespositive
Number of Industrial Waste Gas Treatment Facilitiespositive
Comprehensive Utilization of General Industrial Solid Wastepositive
Means of ProductionMaterial Means of ProductionInfrastructureTraditional InfrastructureRoad Mileagepositive
Railway Mileagepositive
Digital InfrastructureFiber Optic Lengthpositive
Per Capita Internet Broadband Access Portspositive
Energy ConsumptionOverall Energy ConsumptionEnergy Consumption/GDPnegative
Renewable Energy ConsumptionRenewable Energy Electricity Consumption/Total Social Electricity Consumptionpositive
Intangible Means of ProductionScientific and Technological InnovationPer Capita Patent CountPatents Granted/Total Populationpositive
R&D InvestmentR&D Expenditure/GDPpositive
Digitalization LevelDigital EconomyPeking University Digital Inclusive Finance Indexpositive
Enterprise DigitalizationLevel of Enterprise Digitalizationpositive
Table 3. Global Moran’s Index, p-values, and Z-values for green innovation efficiency from 2009 to 2022.
YearMoran’s Ip-ValueZYearMoran’s Ip-ValueZ
20090.327 ***0.00017.09720160.330 ***0.00016.944
20100.328 ***0.00016.96220170.333 ***0.00017.103
20110.327 ***0.00016.84120180.332 ***0.00017.127
20120.322 ***0.00016.57320190.331 ***0.00017.181
20130.319 ***0.00016.41920200.330 ***0.00017.023
20140.323 ***0.00016.56020210.328 ***0.00016.831
20150.323 ***0.00016.55120220.329 ***0.00016.953
*** p < 0.01.
Table 4. Identification, selection, and testing of spatial econometric models.
Test ItemStatisticp-Value
LM test (SAR)26.575 ***0.000
Robust LM test (SAR)71.041 ***0.000
LM test (SEM)167.570 ***0.000
Robust LM test (SEM)212.036 ***0.000
LR test (SAR)185.61 ***0.0000
LR test (SEM)222.45 ***0.0000
Wald test (SAR)174.24 ***0.0000
Wald test (SEM)187.69 ***0.0000
Hausman test 182.59 ***0.0000
*** p < 0.01.
Table 5. Parameter estimation results for Model 3.
VariablesLocal EffectsAdjacent EffectsTotal Effects
DID0.031 ***0.046 **0.077 ***
(0.005)(0.022)(0.025)
NQP0.040 **0.186 ***0.226 ***
(0.016)(0.072)(0.080)
OP0.941 ***0.0170.958 ***
(0.024)(0.092)(0.099)
IS−0.0220.646 ***0.623 **
(0.044)(0.224)(0.248)
FD−0.086 ***0.1080.022
(0.033)(0.137)(0.148)
US−0.102 ***−0.0400.062
(0.033)(0.137)(0.148)
IN−0.011 ***−0.034 ***−0.045 ***
(0.002)(0.010)(0.011)
RC−0.006 ***−0.002−0.008
(0.002)(0.009)(0.010)
rho0.319 ***
(0.088)
sigma2_e0.000 ***
(0.000)
N420
R 2 0.885
t statistics in parentheses, ** p < 0.05, *** p < 0.01.
Table 6. Endogeneity test of the model.
Variables2SLS
1st-stage2nd-stage
NQPGIE
IV0.279 ***
(0.034)
NQP 0.784 ***
(0.278)
Control variablesYesYes
Time fixed effectYesYes
Region fixed effectYesYes
Cragg–Donald Wald F statistic 424.63
Kleibergen–Paap Wald rk F statistic 69.07
Anderson–Rubin Wald test F statistic 7.19 **
Hansen J statistic 0.000
N420420
t statistics in parentheses, ** p < 0.05, *** p < 0.01.
Table 7. Parameter estimation results for Model 4 and Model 5.
VariablesModel 4Model 5
DID0.058 ***
(0.009)
NQP 0.151 ***
(0.019)
_cons0.0010.000
(0.003)(0.002)
Control VariablesYesYes
Time Fixed EffectsYesYes
Regional Fixed EffectsYesYes
N420420
t statistics in parentheses, *** p < 0.01.
Table 8. Robustness tests.
VariablesAdjusted Research Sample Scope
(Excluding Liaoning Province)
Adjusted Sample Splitting Ratio
(1:2)
Replacement of Machine
Learning Algorithm
(Least Absolute Shrinkage and Selection Operator Regression)
Replacement of Machine Learning Algorithm
(Neural Network
Algorithm)
DID0.052 *** 0.040 *** 0.043 *** 0.062 ***
(0.020) (0.015) (0.009) (0.009)
NQP 0.175 *** 0.161 *** 0.205 *** 0.169 *
(0.018) (0.022) (0.029) (0.021)
_cons−0.001−0.0050.0000.0000.000−0.000−0.004−0.003 *
(0.001)(0.004)(0.003)(0.003)(0.003)(0.004)(0.003)(0.004)
Control
Variables
YesYesYesYes
Time Fixed EffectsYesYesYesYes
Regional Fixed EffectsYesYesYesYes
N420420420420
t statistics in parentheses, * p < 0.10, *** p < 0.01.
Table 9. Heterogeneity analysis.
VariablesEastern ProvincesMiddle and
Western Provinces
Carbon Trading ProvincesNon-Carbon Trading
Provinces
Innovative ProvincesNon-Innovative Provinces
DID0.084 ***0.019 ***0.132 **0.023 ***0.024 ***0.023 ***
(0.024)(0.006)(0.058)(0.005)(0.006)(0.005)
NQP0.234 ***0.103 ***0.259 ***0.097 ***0.114 ***0.088 ***
(0.053)(0.010)(0.070)(0.010)(0.013)(0.030)
Control
Variables
YesYesYesYesYesYes
Time Fixed EffectsYesYesYesYesYesYes
Regional Fixed EffectsYesYesYesYesYesYes
N14028084336140280
t statistics in parentheses, ** p < 0.05, *** p < 0.01, For brevity, due to the limitation of table space, the parameter estimation results for the constant terms are omitted here.
Table 10. Parameter estimation results for mediating effects.
Mediating Effect PathTotal Effect EstimateDirect Effect EstimateIndirect Effect
Estimates
Sobel
(Z-Value)
Aroian
(Z-Value)
Goodman (Z-Value)Proportion of
Mediation
DID→ITG→GIE0.201 **0.121 *0.081 **2.090 *2.079 *2.103 *40.05%
DID→GEA→GIE0.201 **0.106 *0.096 *1.843 *1.839 *1.848 *47.42%
NQP→IPP→GIE0.294 ***0.204 ***0.091 ***6.040 ***6.022 ***6.057 ***30.78%
NQP→HIG→GIE0.294 ***0.256 ***0.039 ***4.049 ***4.019 ***4.080 ***13.10%
* p < 0.10, ** p < 0.05, *** p < 0.01.
Table 11. Bootstrap test results for mediating path.
Mediating Effect PathIndirect Effect
Estimates
Bootstrap Standard Error95% Percentile Conf. Interval95% Bias-Corrected Confidence IntervalZp
DID→ITG→GIE0.081 ***0.024[0.0366, 0.1339][0.0358, 0.1321]3.320.001
DID→GEA→GIE0.096 ***0.036[0.0190, 0.1685][0.0274, 0.1736]2.640.008
NQP→IPP→GIE0.091 ***0.017[0.0608, 0.1245][0.0614, 0.1266]5.330.000
NQP→HIG→GIE0.039 ***0.009[0.0216, 0.0559][0.0238, 0.0595]4.450.000
*** p < 0.01.
Disclaimer/Publisher’s Note: The statements, opinions and data contained in all publications are solely those of the individual author(s) and contributor(s) and not of MDPI and/or the editor(s). MDPI and/or the editor(s) disclaim responsibility for any injury to people or property resulting from any ideas, methods, instructions or products referred to in the content.

