Article

A YOLO11-Based Method for Segmenting Secondary Phases in Cu-Fe Alloy Microstructures

1
School of Metallurgical Engineering, Jiangxi University of Science and Technology, Ganzhou 341000, China
2
School of Materials Science and Engineering, Jiangxi University of Science and Technology, Ganzhou 341000, China
3
School of Economics and Management, Jiangxi University of Science and Technology, Ganzhou 341000, China
*
Author to whom correspondence should be addressed.
Information 2025, 16(7), 570; https://doi.org/10.3390/info16070570
Submission received: 22 May 2025 / Revised: 26 June 2025 / Accepted: 1 July 2025 / Published: 3 July 2025
(This article belongs to the Topic Intelligent Image Processing Technology)

Abstract

With the development of industrialization, the demand for high-performance metal materials has increased, and copper and its alloys have been widely used. The microstructure of these materials significantly affects their performance. To address the issues of subjectivity, low efficiency, and limited quantitative capability in traditional metallographic analysis methods, this paper proposes a deep learning-based approach for segmenting the second phase in Cu-Fe alloys. The method is built upon the YOLO11 framework and incorporates a series of structural enhancements tailored to the characteristics of the secondary-phase microstructure, aiming to improve the model’s detection accuracy and segmentation performance. Specifically, the EIEM module enhances the C3K2 structure to improve edge perception; the CSPSA module is optimized into C2CGA to strengthen multi-scale feature representation; and the RepGFPN and DySample techniques are integrated to construct the GDFPN neck network. Experimental results on the Cu-Fe alloy metallographic image dataset demonstrate that YOLO11 outperforms mainstream semantic segmentation models such as U-Net and DeepLabV3+ in terms of mAP (85.5%), inference speed (208 FPS), and model complexity (10.2 GFLOPs). The improved YOLO11 model achieves an mAP of 89.0%, a precision of 84.6%, and a recall of 81.0% on this dataset, showing significant performance improvements while effectively balancing inference speed and model complexity. Additionally, a quantitative analysis software system for secondary phase uniformity based on this model provides strong technical support for automated metallographic image analysis and demonstrates broad application prospects in materials science research and industrial quality control.

Graphical Abstract

1. Introduction

As industrialization accelerates, metal materials have become increasingly vital in sectors, including energy, electronics, transportation, and construction. Copper and its alloys are widely employed due to their excellent electrical and thermal conductivity, as well as favorable mechanical properties [1,2,3]. However, with ongoing technological advancements and expanding application fields, optimizing the performance of copper alloys has become a critical challenge.
The performance of copper alloys is significantly influenced by their microstructure, particularly the morphology, size, and distribution of the secondary phase. For instance, in Cu-Fe alloys, the microscopic characteristics of the Fe phase are directly related to the material’s strengthening effect and electrical conductivity. Excessively large or aggregated Fe phases can degrade the alloy’s toughness and service life. Therefore, accurate analysis and control of the microstructure are crucial for enhancing performance.
Microstructural analysis is a crucial method for understanding and optimizing material performance [4]. Its main characteristics include the morphology and distribution of the matrix phase, the precipitation state of precipitation of the second phase, grain size and grain boundary characteristics, which directly affect the mechanical properties, electrical conductivity and corrosion resistance of the material [5,6,7]. Currently, commonly used techniques include optical microscopy (OM), scanning electron microscopy (SEM), transmission electron microscopy (TEM), and electron backscatter diffraction (EBSD) [8]. Although SEM, TEM, and EBSD offer high resolution and precise quantification, their sample preparation is complex, costly, and requires stringent environmental conditions, limiting their widespread application in industrial production. In contrast, optical microscopy is widely used in the preparation and processing of metal materials due to its simplicity, efficiency, and low equipment requirements. OM can characterize grain size, phase distribution, and structural defects, and is extensively applied in the research and evaluation of copper alloys, steels, and aluminum alloys [9].
Despite the operational ease of OM, it still faces challenges such as strong subjectivity, low processing efficiency, and limited quantitative accuracy. Traditional analysis heavily relies heavily on manual labeling and measurement, making it difficult to meet the high-efficiency detection requirements for large-scale samples. Additionally, when the structure is complex or the sample size is large, errors tend to increase, affecting the reliability of the analysis results.
To overcome these limitations, computer vision, deep learning, and intelligent image processing technologies have been introduced into metallographic analysis [10,11]. Due to the complexity of the metal microstructure and the reliance on expert annotations resulting in scarce labeled data, Sun et al. [12] proposed CMAA-Net, which employs multi-scale adaptive attention and LSTM-based channel modeling to effectively improve segmentation accuracy on the MetalDAM and UHCS datasets, achieving mIoU scores of 76.30% and 84.50%, respectively. Shi et al. [13] pointed out that traditional fire investigations for identifying metal wire melting traces rely on manual or physicochemical methods, which are inefficient and labor-intensive. To address this issue, they proposed a TransUnet-based semantic segmentation algorithm for metallographic images, achieving high-precision segmentation of the melted regions with an mIoU of 92.2%, thereby assisting fire cause analysis. Compared to traditional methods, intelligent analysis technologies exhibit superior automation, processing capacity, and quantitative accuracy, significantly improving the recognition efficiency and consistency of metallographic images. By employing deep models trained on large datasets, image recognition, classification, and feature extraction can be automatically performed, reducing human intervention and enhancing analysis efficiency.
In summary, intelligent image analysis technology has enhanced the automation and accuracy of metallographic analysis, advancing its development toward intelligent, data-driven, and high-throughput approaches, thereby expanding its applications in scientific research and industrial quality control. It provides robust technical support for the continuous advancement of materials science.

2. Related Work

In recent years, deep learning techniques have garnered widespread attention in the field of metallographic analysis and have achieved significant progress in microstructural identification, grain segmentation, and phase structure analysis [14,15,16,17,18]. Compared to traditional rule-based methods, deep learning adopts a data-driven approach, enabling automatic feature extraction from images, offering advantages in enhancing recognition accuracy and generalization capabilities. This advancement provides a more precise and intelligent pathway for the automated analysis of metallographic structures.
Dong et al. [19] addressed the reliance on manual observation dependency in the microstructural evaluation of carburized gears by proposing the STN-Mask-RCNN model. This model integrates the Swin Transformer backbone network, NAS-FPN module, and convolutional block attention mechanism, enabling precise segmentation of retained austenite and martensite, and achieving a mean pixel accuracy (mPA) of 90.64%.
Bu et al. [20] addressed the challenge of grain boundary extraction in polycrystalline pure iron metallography by introducing the GAU-Net model, which combines U-Net and ConvGRU architectures. By leveraging dual-modal mapping inputs and a feedback mechanism, the model achieves effective feature fusion and a lightweight design. Experimental results indicate that, compared to traditional methods, the proposed model can segment grain boundaries more accurately under complex noise conditions, thereby enhancing detection accuracy.
AJioka et al. [21] applied SegNet and U-Net architecturesfor the segmentation of ferrite and martensite, and conducted a comparative analysis against conventional techniques. The experimental results demonstrated that deep learning models significantly outperformed traditional methods in terms of both segmentation accuracy and processing efficiency. Jang et al. [22] employed a ResNet-based approach to segment microstructures in carbon steel weldments, achieving a mean intersection over union (mIoU) exceeding 85%, further confirming the advantages and practical potential of deep learning in microstructural recognition and analysis.
To address the challenges posed by scratch interference and blurred grain boundaries in the metallographic analysis of ultra-low carbon steel, Wang et al. [23] proposed a grain boundary enhancement algorithm based on CycleGAN + SA, combined with watershed segmentation for refined analysis. Experimental results indicate that after introducing the introduction of the attention mechanism increased the precision (P) from 97.43% to 98.75% and the F-score from 97.49% to 98.73%, effectively eliminating scratches and enhancing the clarity of blurred regions. Moreover, compared with measurements from ImageJ and Image-Pro Plus, the proposed method demonstrated smaller errors and greater practical utility.
In the study of microstructural segmentation for high-temperature alloy materials, Zhang et al. [24] proposed a microstructural segmentation method based on Res-UNet. This approach combines residual connections with the encoder-decoder structure of U-Net to enhance feature extraction and improve segmentation accuracy. Experimental results indicate that this method excels in γ-phase extraction tasks, effectively addressing noise contamination and improving segmentation precision.
He et al. [25] proposed a semi-supervised semantic segmentation approach for steel microstructures, employing ResNet50 for feature extraction and a pyramid pooling module for multi-scale feature fusion. The framework combines self-supervised and supervised learning to refine network parameters, utilizing stochastic gradient descent (SGD) for optimization. Experimental results showed that the model achieved a pixel accuracy of 86.66% and an mIoU of 55.01%.
Ma et al. [26] focused on microstructural images of polycrystalline pure iron grains and proposed a region-aware loss function weighting approach. In this method, different weights are assigned to the grain boundary and interior regions, guiding the network to focus more on grain morphology and thereby enhancing segmentation accuracy and generalizability. Experimental results demonstrated that this method outperformed classical loss functions, exhibiting superior accuracy and broader applicability.
Ye et al. [27] addressed the challenge of identifying and segmenting heat-resistant steel microstructures by developing an intelligent deep learning-based model. The model introduced Dense modules into the U-Net structure to enhance feature extraction and optimize the segmentation performance of ferrite and pearlite. Experimental results show that the enhanced model achieved pixel accuracies of 96.7% and 93.6%, intersection-over-union (IoU) scores of 92.6% and 89.3%, and overall average segmentation accuracies of 95.15% and 90.95%, respectively.
Building on the previously reviewed literature, existing studies have widely employed deep learning models such as STN-Mask-RCNN, GAU-Net, SegNet, U-Net, ResNet, and Res-UNet, integrating attention mechanisms, residual connections, and multi-scale feature fusion techniques. These methods have achieved high pixel accuracy and mIoU scores in metallographic image segmentation across various materials including metal gears, pure iron, ultra-low carbon steel, and heat-resistant steel, while also improving model robustness to noise. However, these approaches still face notable limitations: models like U-Net and Res-UNet have complex architectures and large parameter counts, resulting in slow inference speeds that hinder real-time analysis and efficient industrial application; some semi-supervised or CycleGAN-based enhancement methods rely heavily on large annotated datasets and domain-specific tuning, limiting generalization capabilities; moreover, most approaches emphasize segmentation accuracy without adequately balancing computational efficiency and resource consumption, which affects ease of deployment and widespread use.
To address these challenges, this study proposes an efficient segmentation method based on the YOLO architecture. YOLO11, a model built upon deep convolutional neural networks, serves as the core technical foundation of this research. By leveraging this deep learning framework and taking into account the specific characteristics of secondary phases in Cu-Fe alloy metallographic images, the method systematically optimizes key modules, including feature extraction, edge perception and cross-scale fusion. These improvements result in significant enhancements in segmentation accuracy and automation. The main contributions of this study are as follows:
  • Efficient Segmentation Framework: Based on the YOLO11 backbone network, a segmentation architecture tailored for metallographic images is designed, balancing segmentation accuracy and computational efficiency to meet industrial automation detection requirements.
  • Introduction of the EIEM Edge Enhancement Module, which strengthens the boundary perception of the secondary phase and improves the completeness and robustness of segmentation results by integrating explicit edge information with spatial features.
  • The C2CGA module is proposed, introducing the Cascaded Group Attention (CGA) mechanism to enhance the model’s ability to recognize small-sized secondary phases and improve the accuracy of perceiving blurred boundaries.
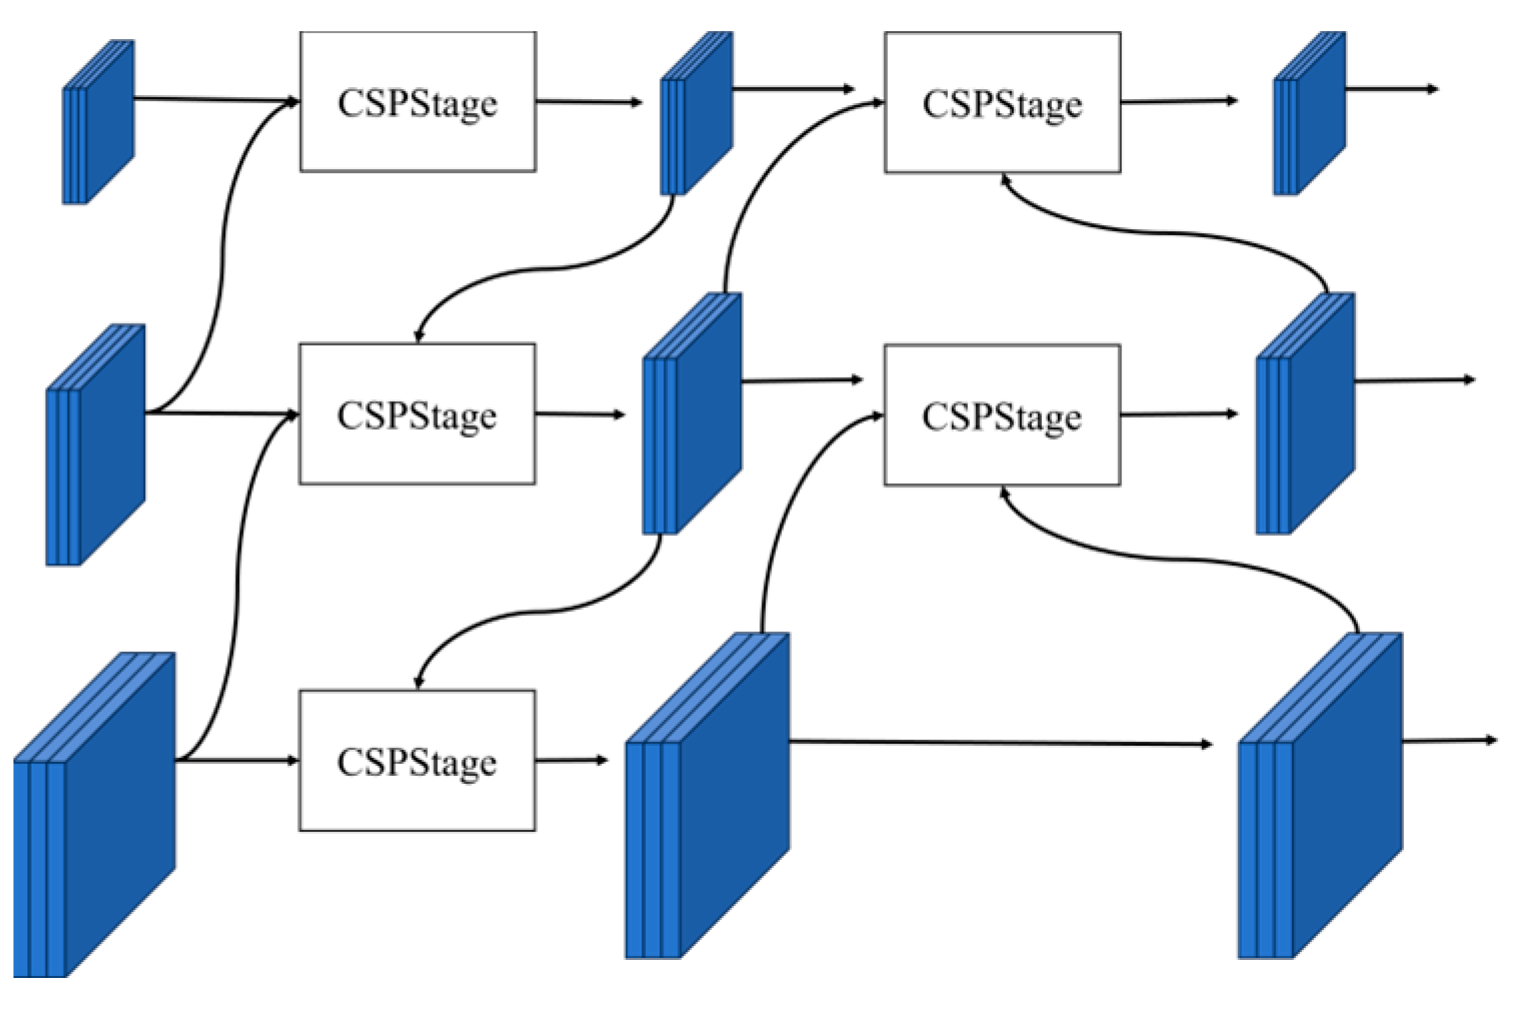
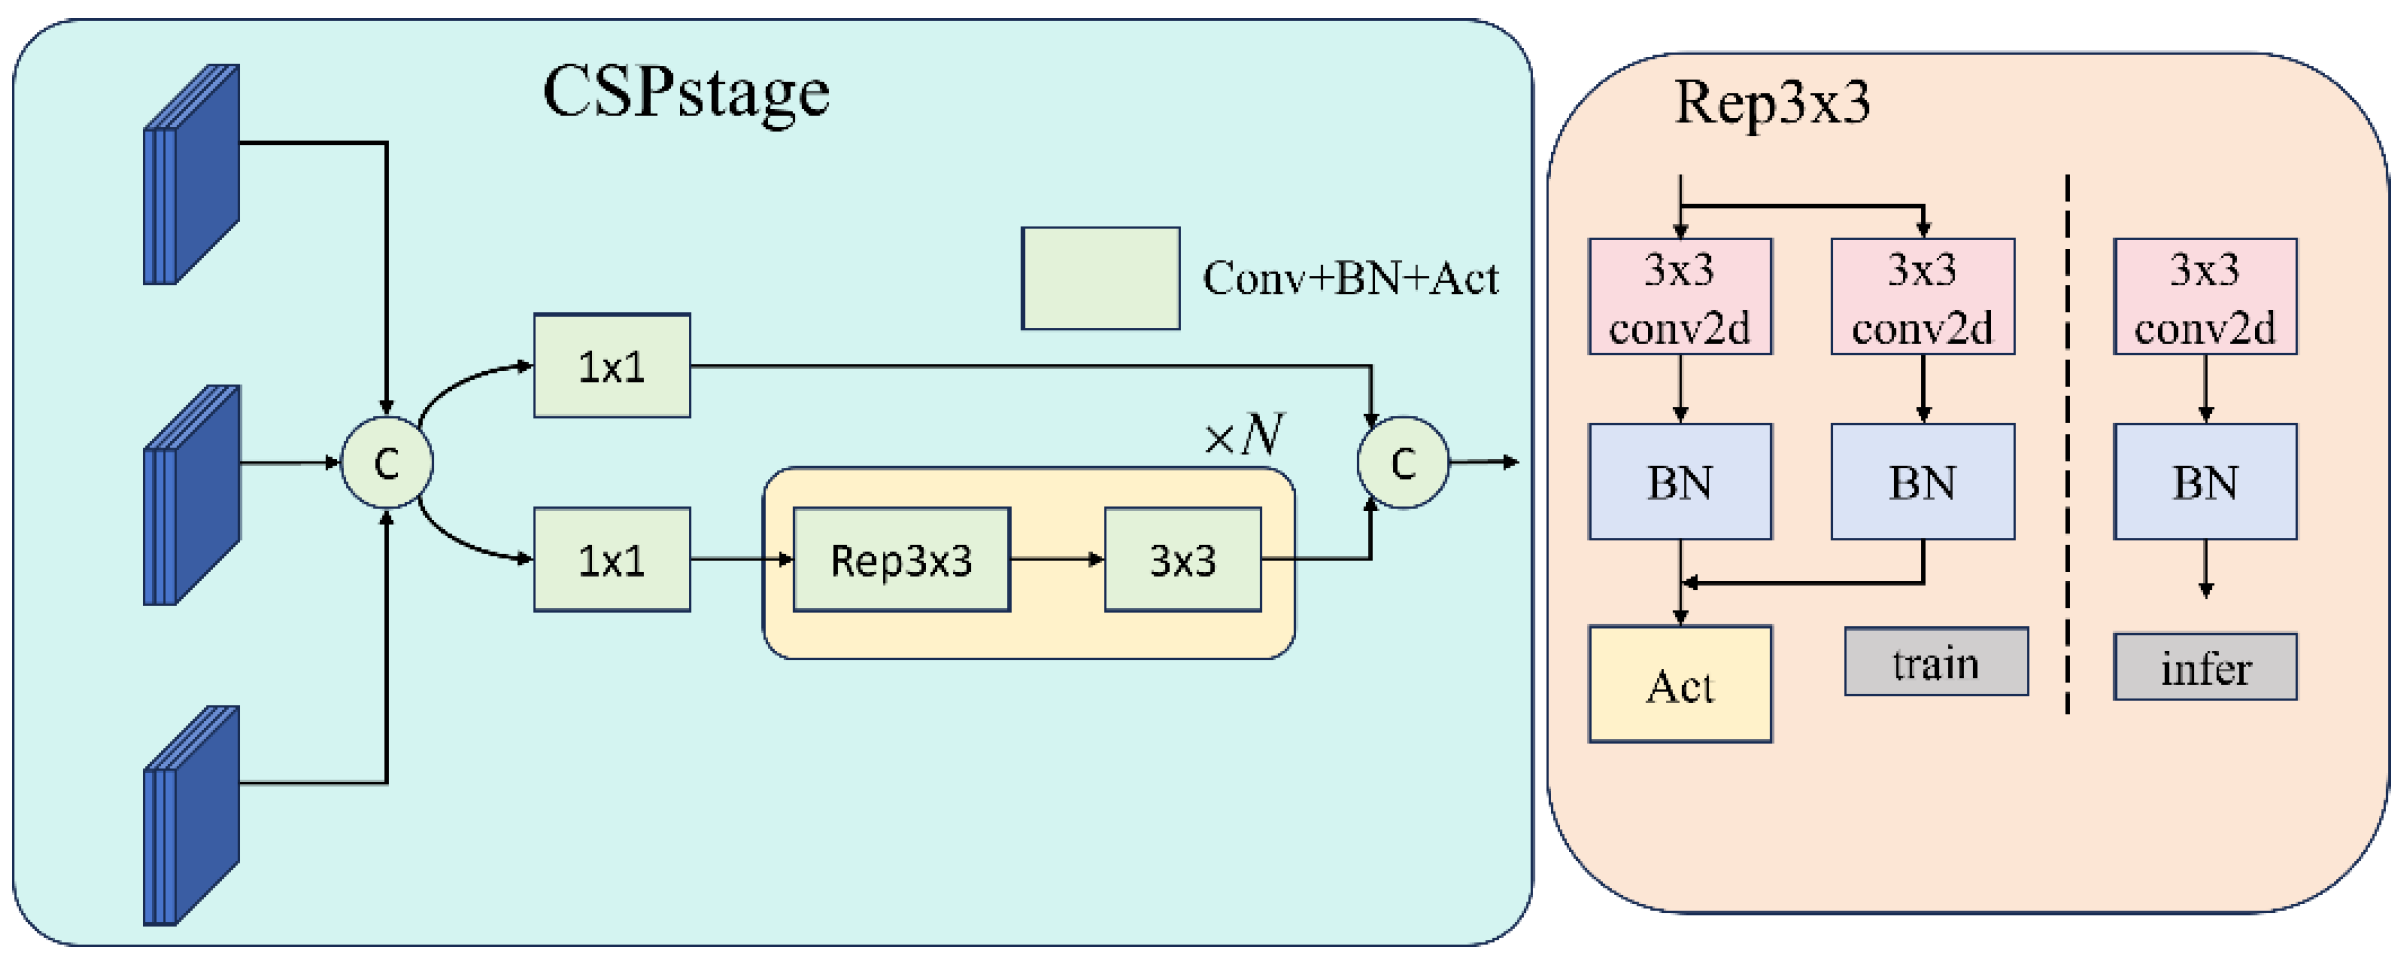
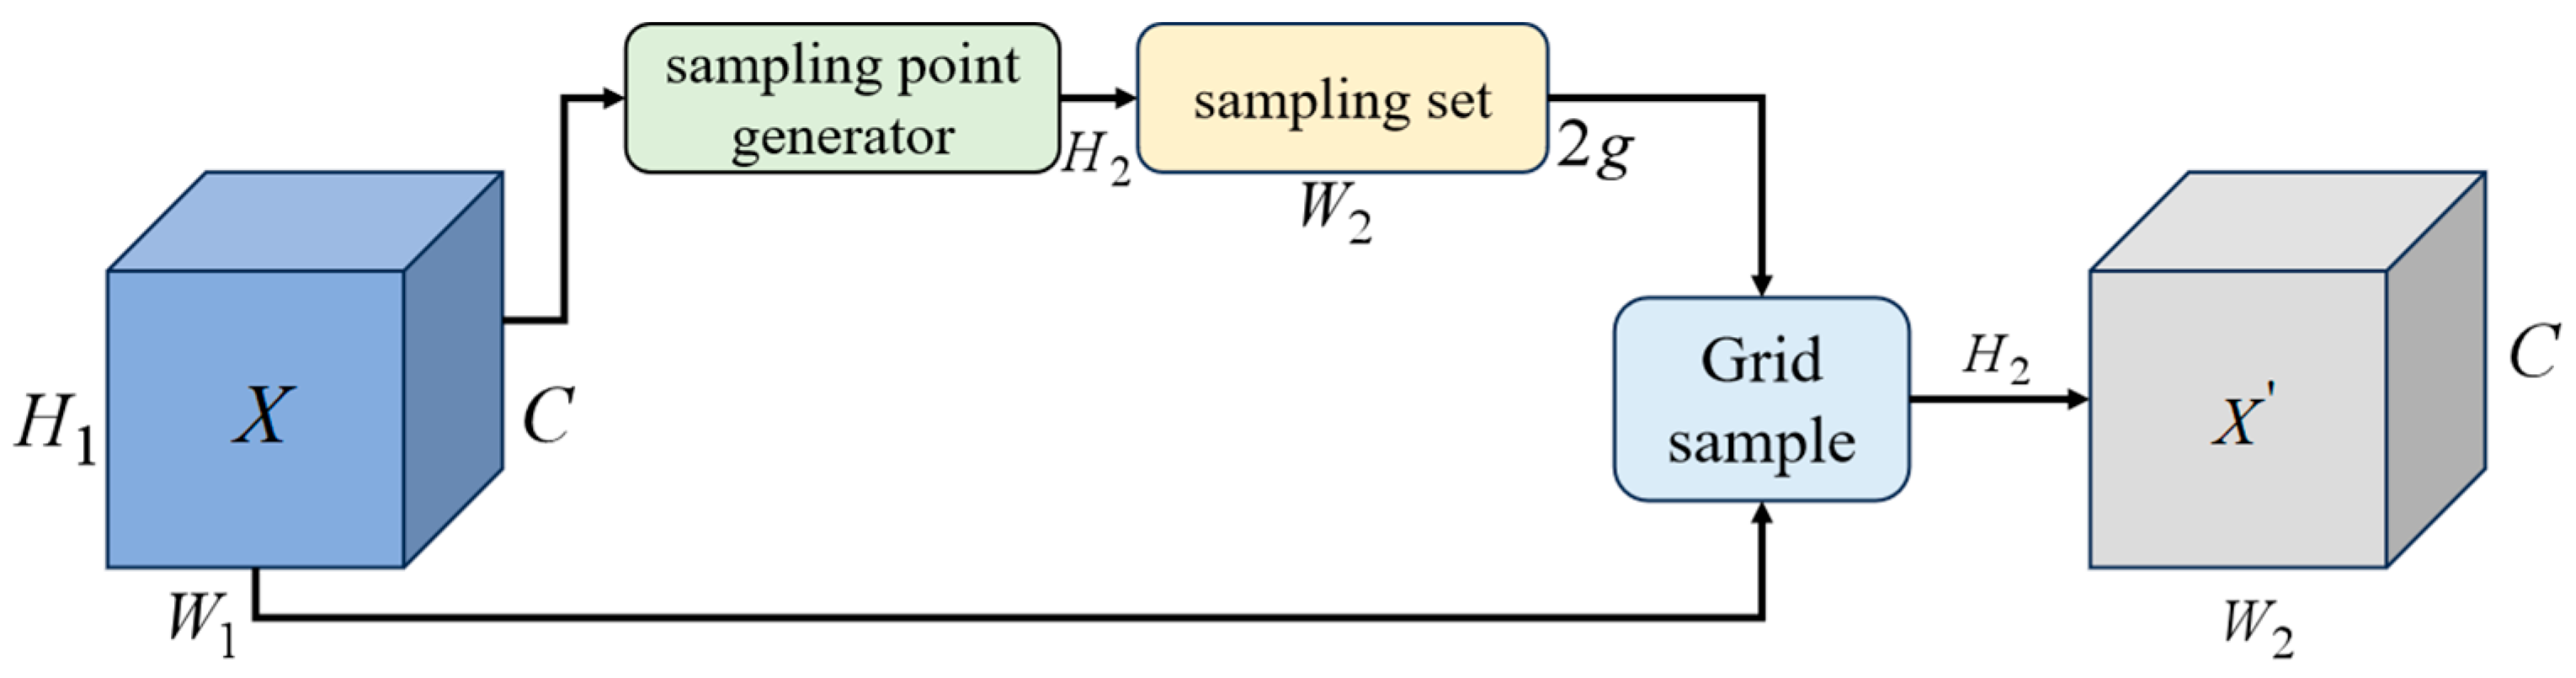
  • Design of the GDFPN feature fusion structure: By combining RepGFPN and DySample, the extraction of multi-scale features and the adaptive upsampling process are optimized to enhance the feature restoration capability for small targets.
  • Development of a full-process metallographic image analysis system: An automated workflow from target detection to segmentation output is established, effectively enhancing the efficiency and consistency of traditional metallographic analysis.
The remainder of this paper is organized as follows: Section 2 reviews related work. Section 3 details the YOLO11 framework and its improvements. Section 4 introduces the datasets used and analyzes the experimental environment and results. Section 5 presents the Cu-Fe alloy second-phase segmentation system. Finally, Section 6 provides a conclusion of this study.

3. Method

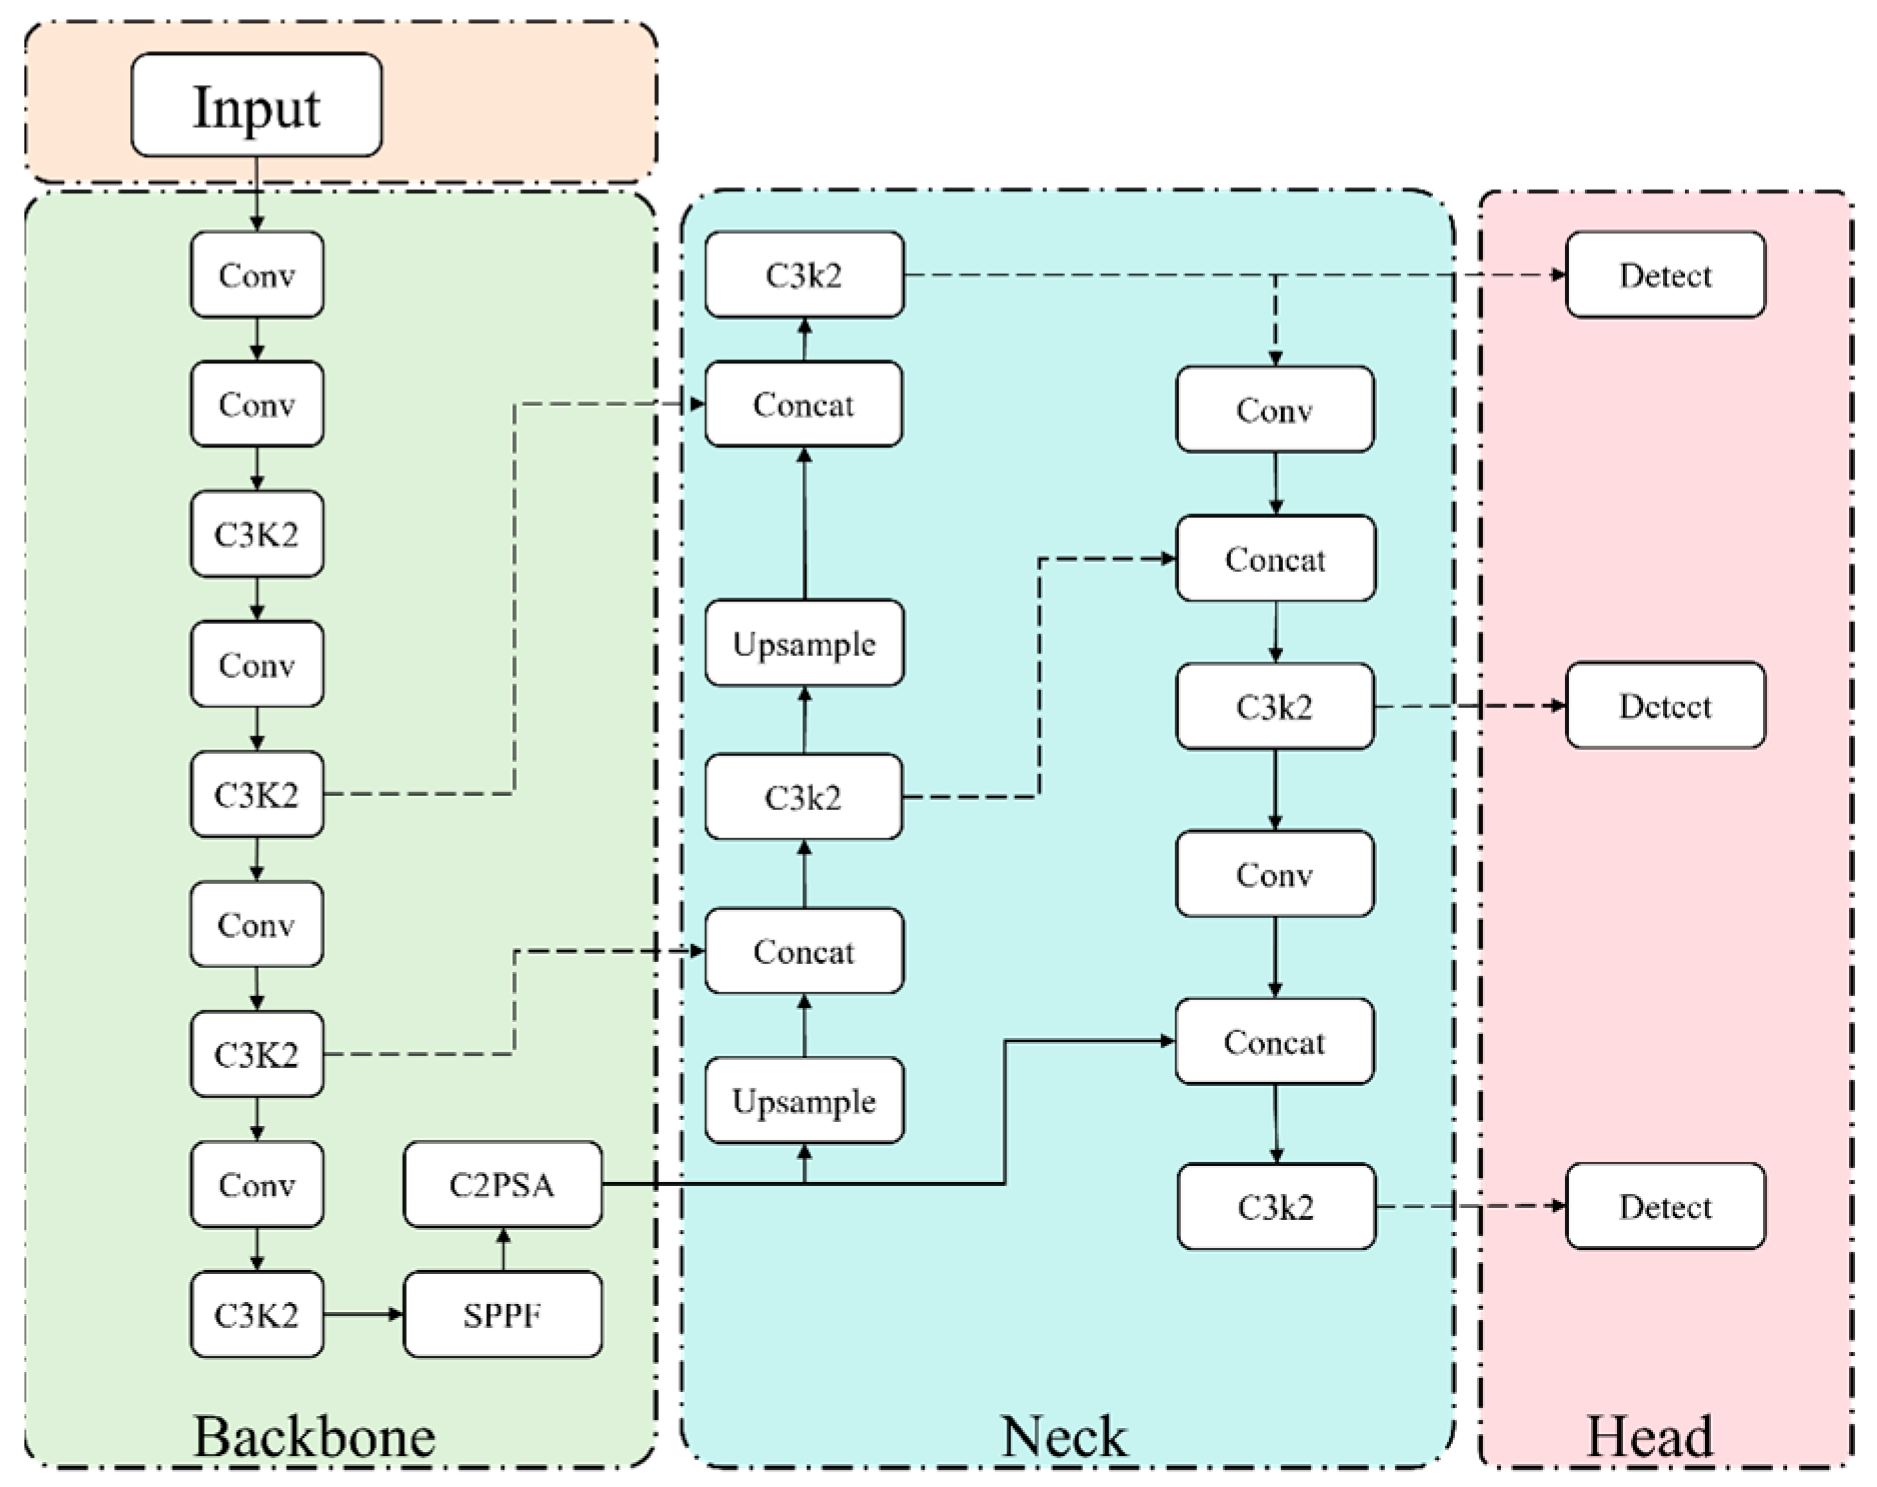
3.1. YOLO11 Network Structure

YOLO (You Only Look Once) [28] is an end-to-end algorithm for object detection and instance segmentation. Its core idea is to perform a single forward pass through the network to simultaneously predict object classes and their bounding box coordinates. YOLO divides the entire image into a fixed number of grids, and each grid is responsible for predicting the class and location parameters of objects within its area. By eliminating the need for region proposals and subsequent processing steps, YOLO significantly improves detection efficiency. Its output typically includes object classes, bounding boxes, and even pixel-level masks for instance segmentation tasks.
Since the release of the YOLO series, several versions have been launched, each improving its performance and efficiency. YOLOv5, proposed by the Ultralytics team, optimizes CSPDarknet53 as the backbone network, introduces the FPN and PAN structures, enhances multi-scale object detection, and improves bounding box prediction accuracy through the GIoU loss function. YOLOv7 [29] introduced the EfficientRep network structure and the “Bag of Freebies” training strategy, improving model precision and robustness, and simplifying the training and deployment process by adopting an anchor-free method. YOLOv8 replaced the traditional Anchor-Based method with an Anchor-Free approach and introduced the SimOTA-v2 training strategy for optimizing sample selection. YOLOv9 [30] optimized the gradient propagation process in training by introducing programmable gradient information (PGI) and the General Efficient Layer Aggregation Network (GELAN), enhancing feature extraction ability. YOLOv10 [31] introduced a consistent dual assignment strategy to solve the problem of non-maximal suppression (NMS) in end-to-end deployment, and enhanced model performance based on the Consistent Matching Metric (CMM).
This study is based on the YOLO11 [32] network framework, the overall structure of which is shown in Figure 1. YOLO11 builds upon YOLOv8 by introducing several structural optimization modules to better adapt to the complex morphology of secondary phases in Cu-Fe alloy metallographic images. The network mainly consists of three components:
Backbone: Responsible for extracting fundamental features from the input image. This part employs the C3k2 module to optimize the CSP bottleneck structure, thereby improving the network’s processing efficiency. Additionally, the C2PSA module (Cross Stage Partial with Pyramid Squeeze Attention) is integrated to enhance spatial attention mechanisms, enabling the network to focus more precisely on key regions in the image and thereby improving detection accuracy for secondary phases of varying sizes and locations.
Neck: Responsible for fusing features from different scales to enrich feature representation and diversity.
Head: Responsible for producing the final predictions, including object classes, bounding box locations, and segmentation masks.

3.1.1. C3k2 Module

The C3k2 module constitutes a pivotal component within the YOLO11 backbone, architected upon the Cross-Stage Partial Network (CSPNet) framework to substantially enhance the efficiency and representational capacity of feature extraction. It facilitates the extraction of robust multi-scale features, which are essential for the precise detection and segmentation of complex metallographic structures. As depicted in Figure 2, the input feature map is bifurcated into two parallel pathways: one path transmits shallow features directly, thereby preserving fine-grained spatial details inherent in the image; the other path undergoes deep convolutional transformations via a series of Bottleneck or C3k submodules to extract high-level semantic information. The outputs from these two branches are subsequently concatenated and fused, yielding a comprehensive feature representation that effectively integrates both detailed local information and broader contextual cues. This dual-path architecture significantly improves the module’s adaptability to targets exhibiting diverse scales and structural complexities.
A notable advantage of the C3k2 module lies in its convolutional flexibility. Depending on task complexity, the module dynamically selects between standard Bottleneck units and C3k units featuring variable convolutional kernels. This design facilitates an optimal trade-off between feature extraction robustness and computational efficiency, thereby supporting real-time processing demands. Figure 2 further elucidates the structural distinctions between Bottleneck and C3k submodules, where the former employs a conventional stacked convolutional architecture, and the latter augments multi-scale feature extraction by integrating convolutional kernels of varying sizes, significantly enhancing the model’s representational expressiveness for complex image patterns.

3.1.2. C2PSA Module

The Cross Stage Partial with Pyramid Squeeze Attention (C2PSA) module serves as a critical enhancement within the YOLO11 backbone, grounded in the Cross-Stage Partial (CSP) design and augmented with the Pyramid Squeeze Attention (PSA) mechanism, as illustrated in Figure 3. This module effectively alleviates feature degradation inherent in deep network architectures through a dual-path processing strategy, thereby elevating the model’s capacity for feature extraction and detection accuracy.
The PSA mechanism constitutes an advancement over the classical Squeeze-and-Excitation (SE) attention paradigm by incorporating multi-head attention and a Feed-Forward Network (FFN). This enables the module to dynamically and adaptively recalibrate multi-scale feature weights, thereby enhancing its sensitivity to fine-grained details and critical target regions. Figure 3 details the internal configurations of the PSA and FFN modules, highlighting the multi-head attention computations and nonlinear feature mapping processes.
Furthermore, the C2PSA module optionally incorporates residual connections (shortcuts) to facilitate gradient flow, thus improving training stability and overall model robustness. Collectively, these design choices endow the C2PSA module with enhanced recognition capabilities across targets of varying scale and structural complexity, resulting in improved detection and segmentation performance.

3.2. YOLO11 Algorithm Improvements

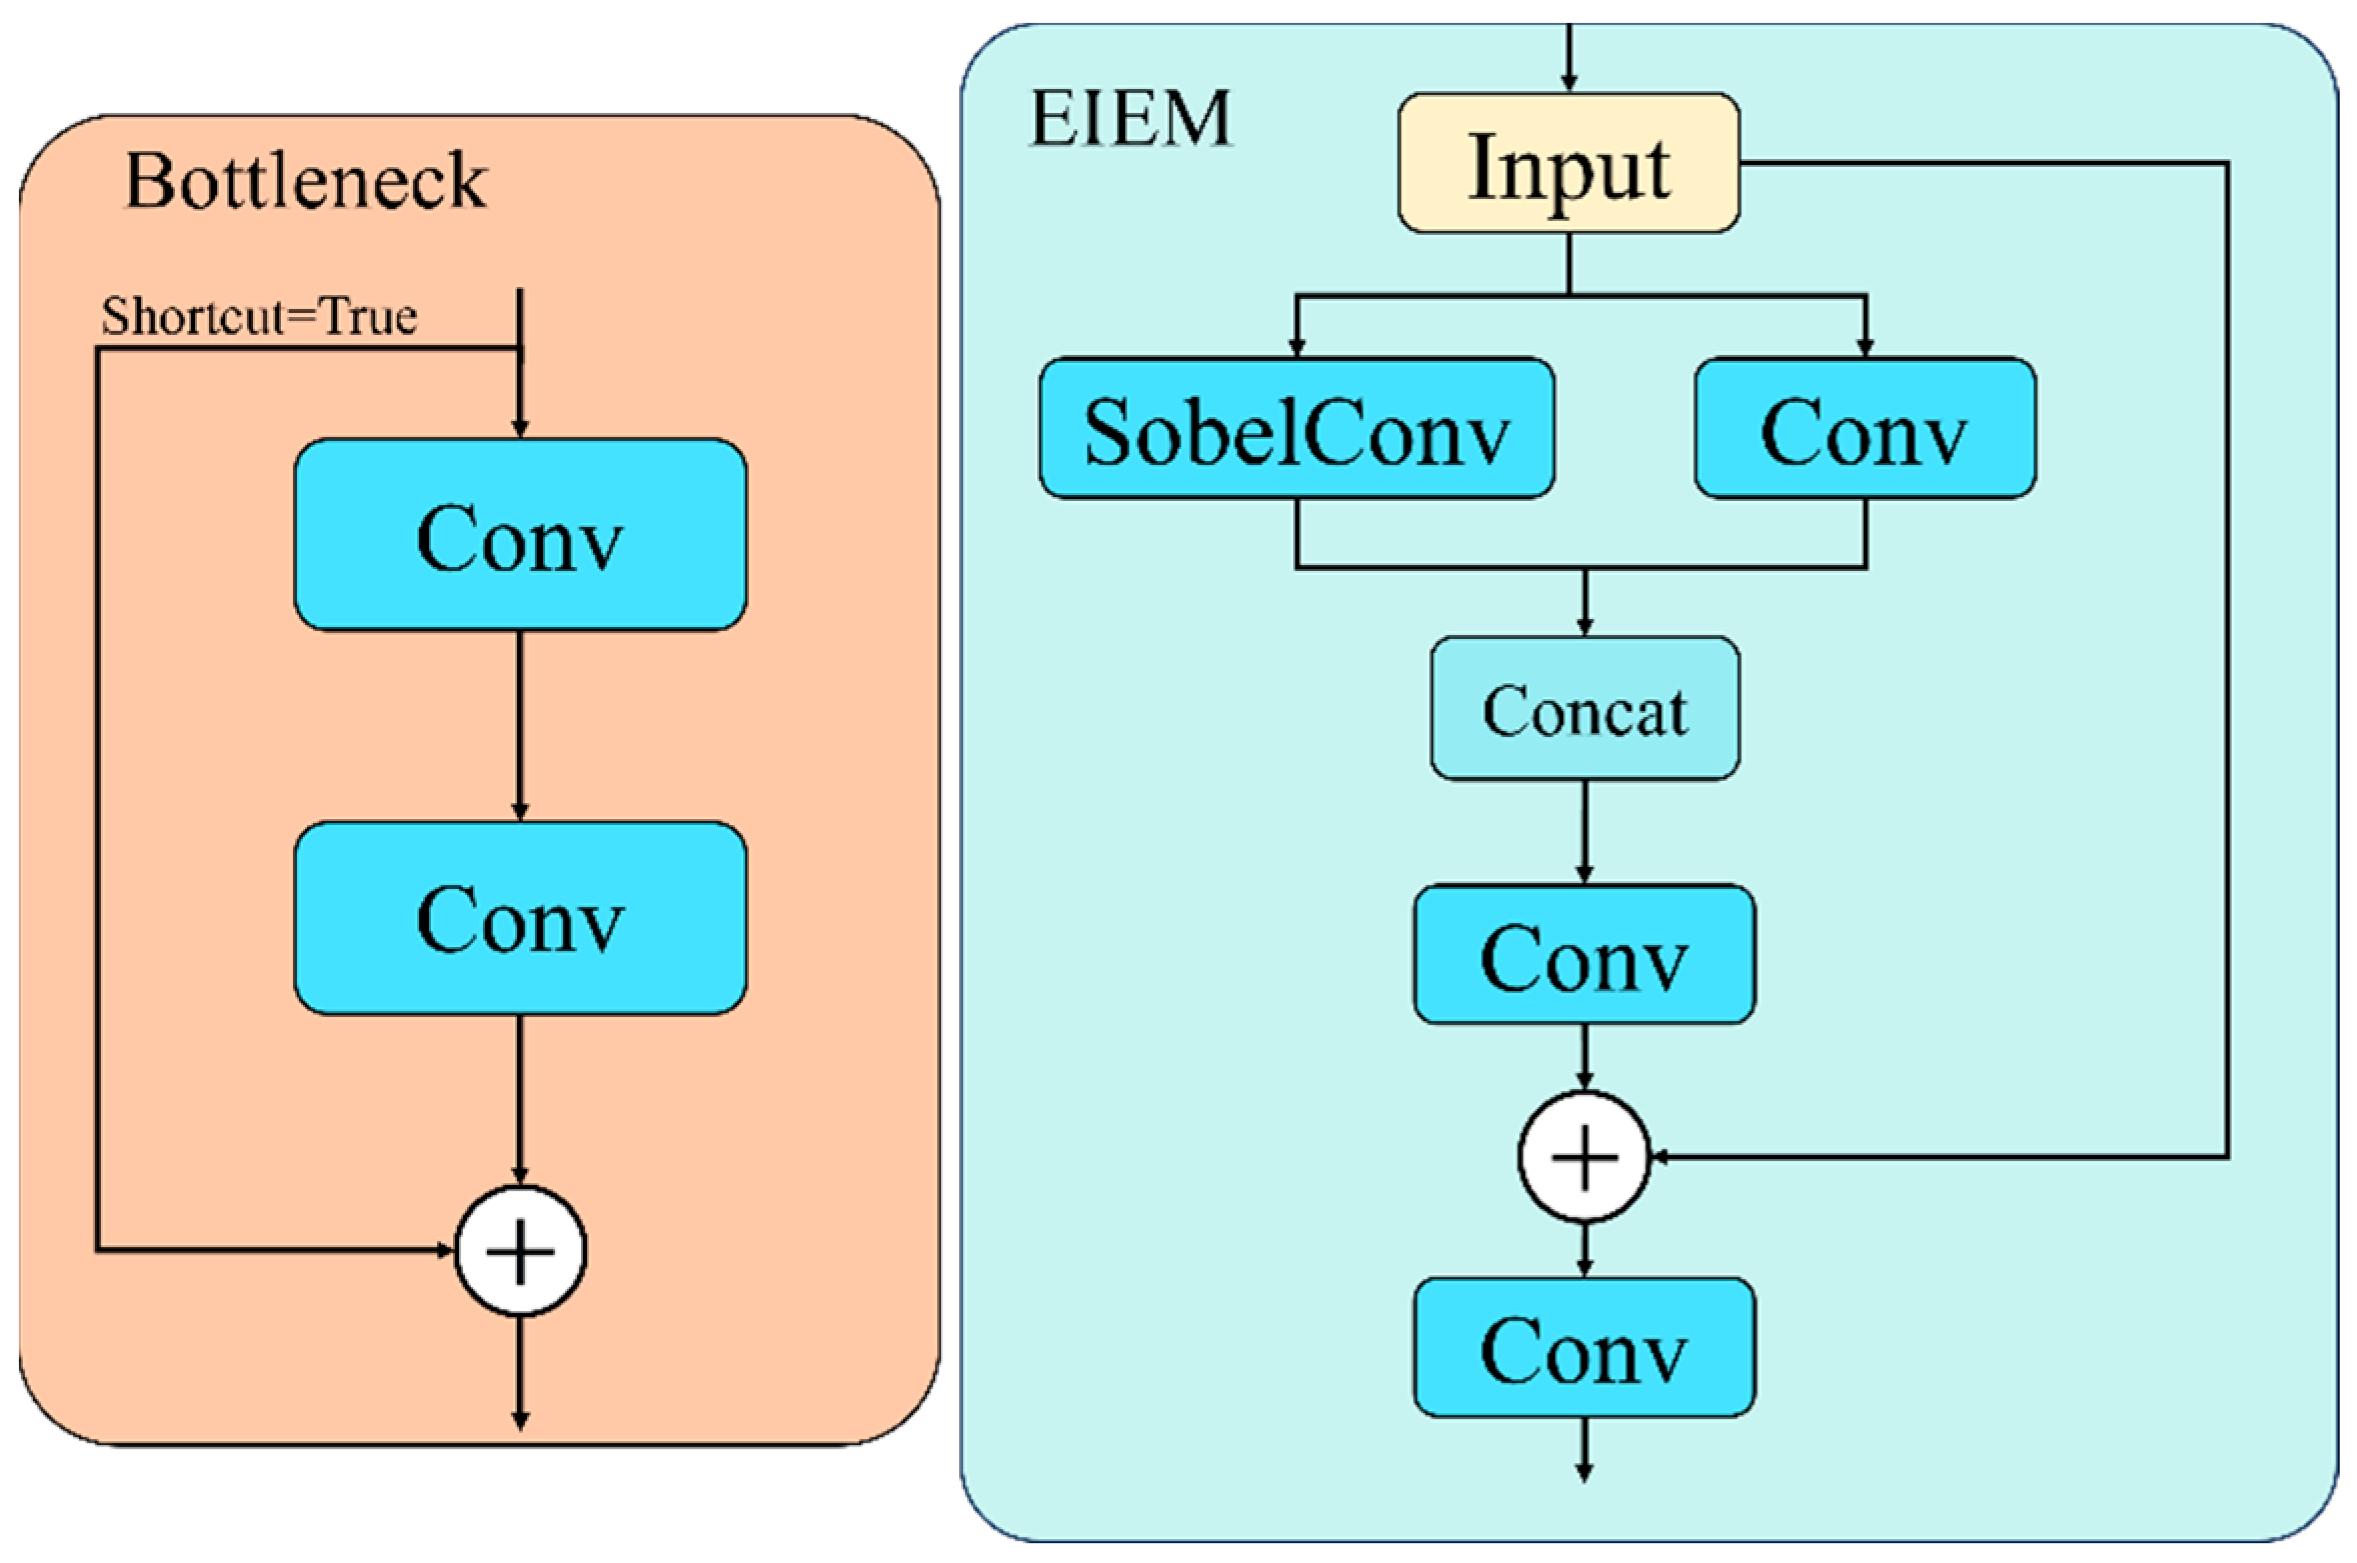
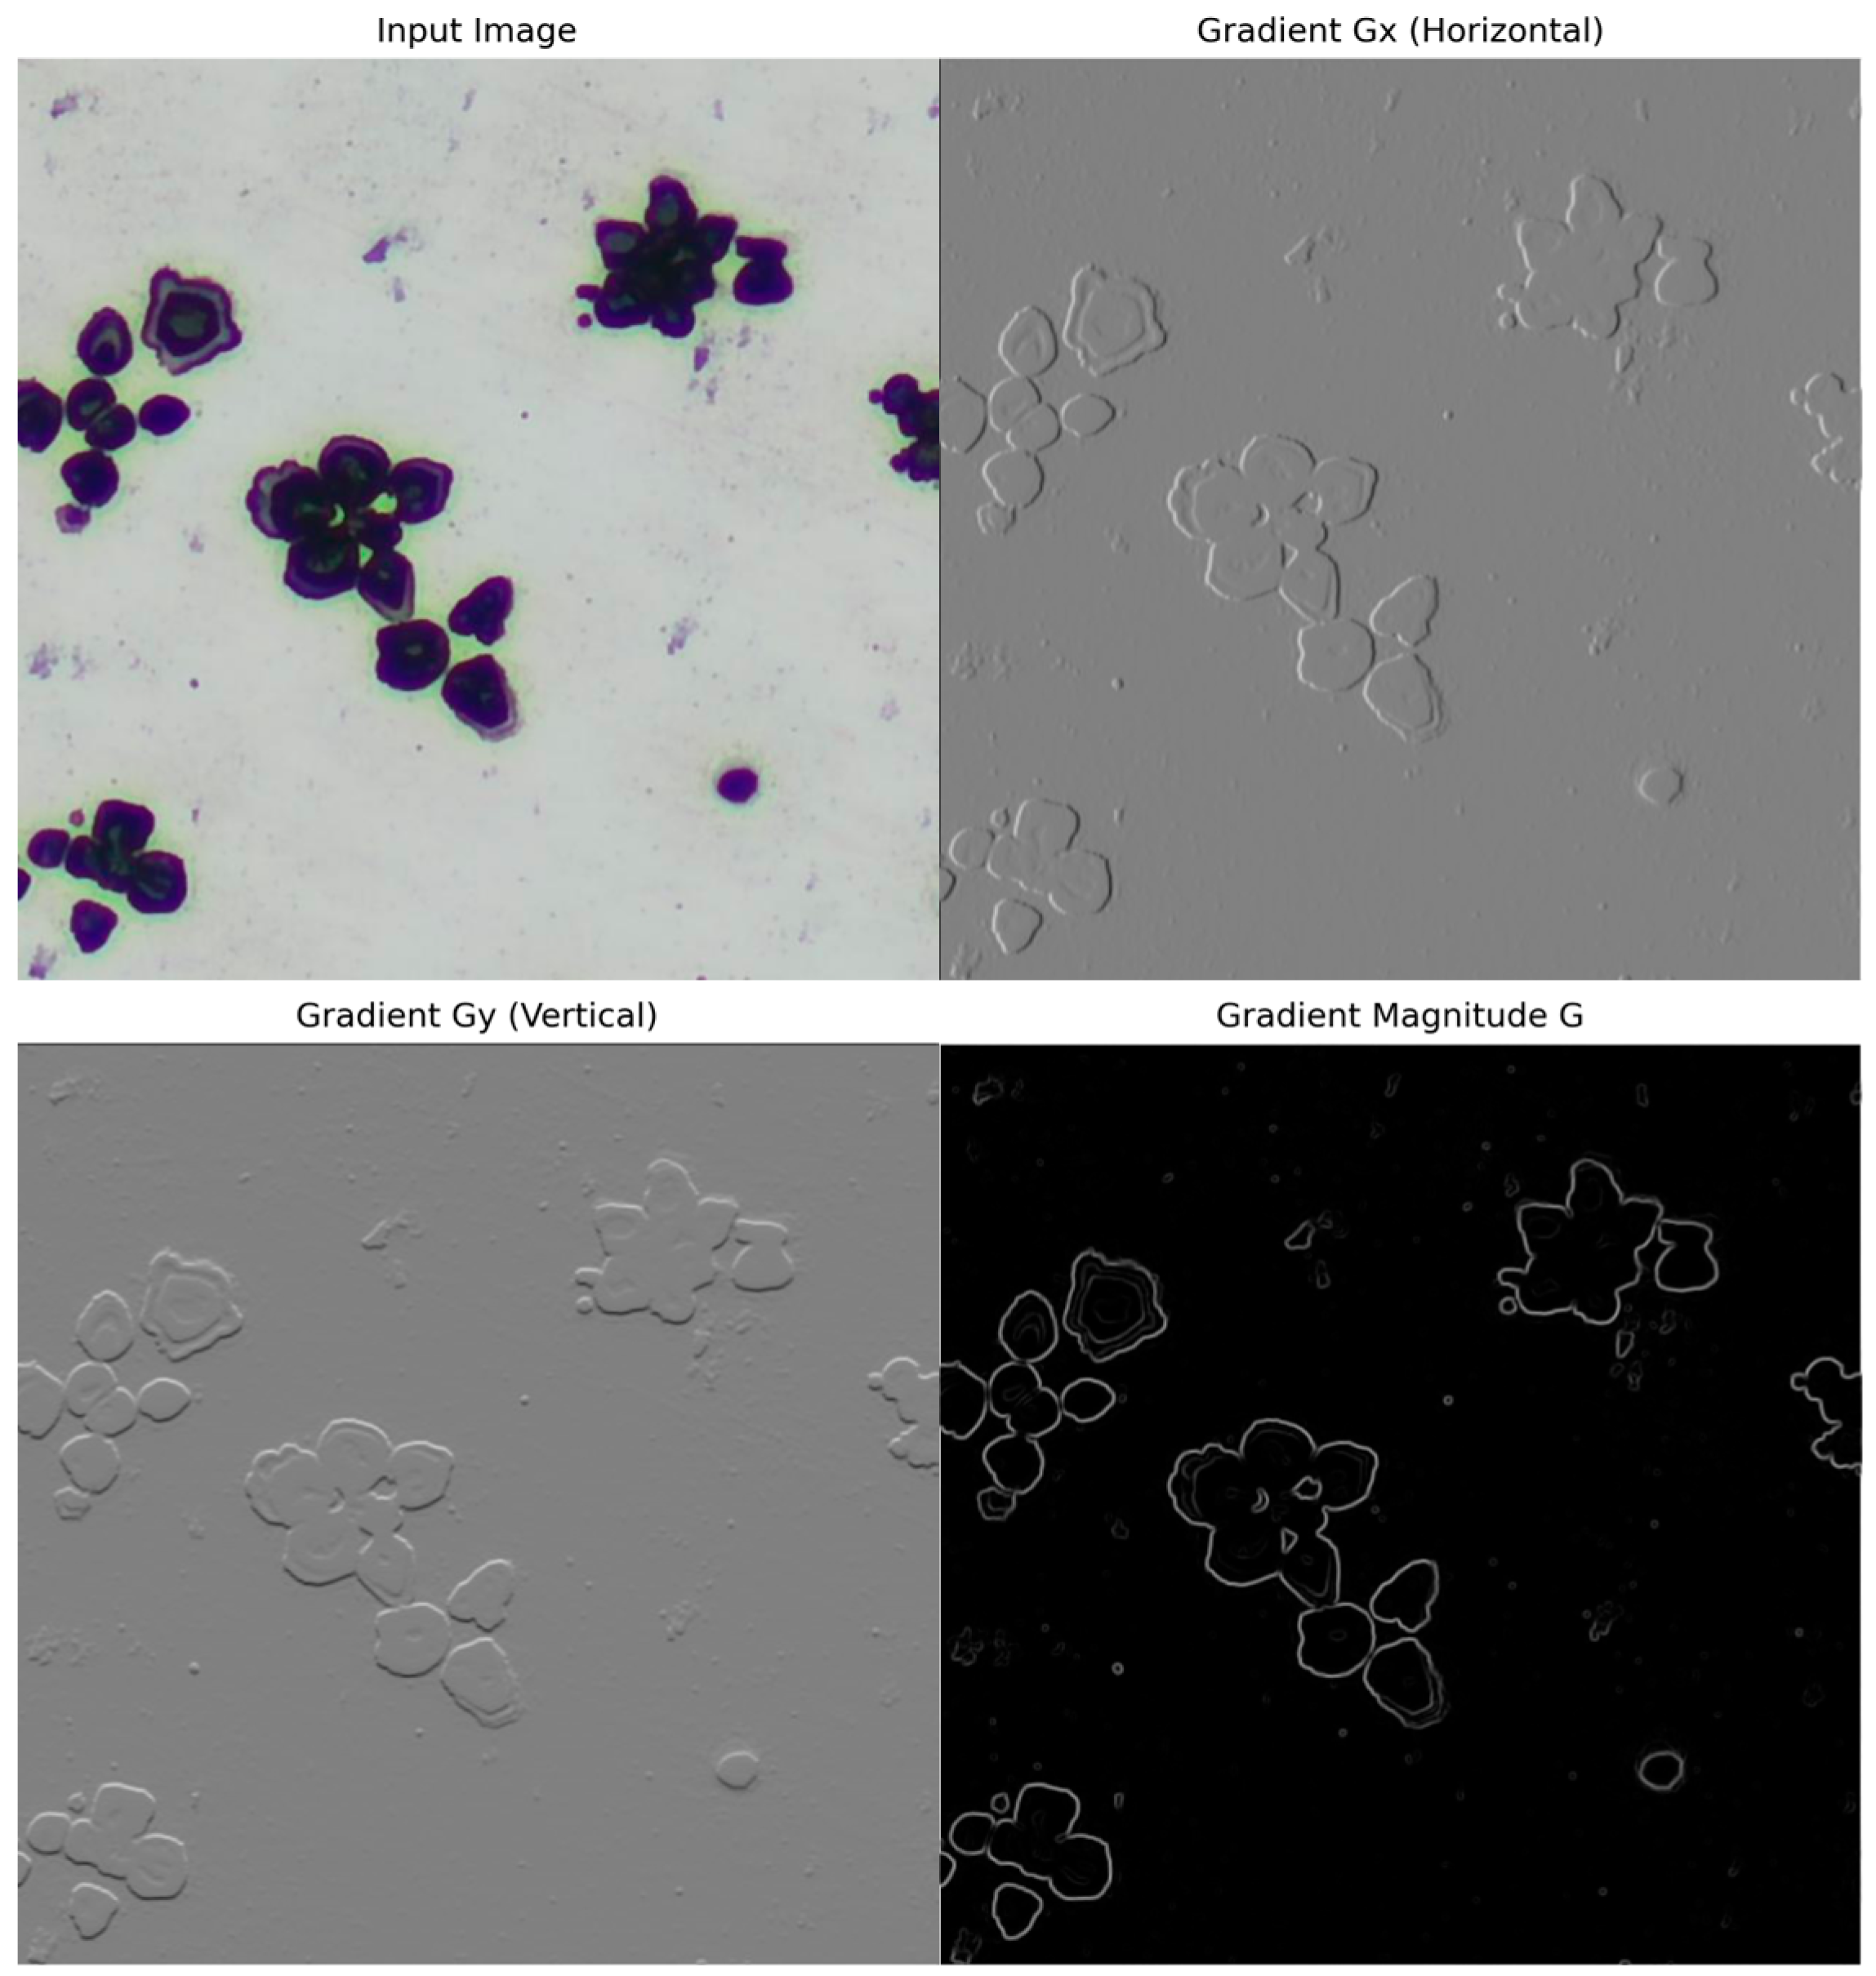
3.2.1. Edge Information Enhancement Module

In the YOLO11 network architecture, the C3k2 module serves as the primary feature extraction unit and consists of multiple Bottleneck modules. As shown in Figure 4, each Bottleneck module contains two consecutive convolutional layers: the first layer reduces the channel dimension according to an expansion ratio, while the second layer restores it to the original channel count. When the input and output channels are equal, a residual connection is employed to facilitate feature reuse and improve gradient propagation. Although this structure is computationally efficient and incorporates residual design, it lacks explicit modeling of edge information, limiting its effectiveness in segmenting fine-grained boundaries in metallographic images.
To address this limitation, this study proposes a novel Edge Information Enhancement Module (EIEM) to replace the Bottleneck within the C3k2 module. The EIEM adopts a dual-branch architecture, comprising a SobelConv branch that enhances edge sensitivity through gradient-based operations, and a Conv_Branch that extracts local texture and global spatial features. Features from both branches are fused to form a richer representation. By explicitly integrating edge information at the early feature extraction stage, EIEM significantly improves segmentation accuracy and completeness, while effectively suppressing background interference.
The SobelConv branch employs the Sobel operator to detect edges in the input image by calculating the local pixel gradients. Specifically, the Sobel operator uses two fixed 3 × 3 convolution kernels, G x and G y , to compute the gradient changes in the horizontal and vertical directions, respectively. These kernels are defined in Equation (1).
G x = 1 0 1 2 0 2 1 0 1 , G y = 1 2 1 0 0 0 1 2 1
Here, G x and G y represent the gradient filters applied to the input feature map, rather than trainable parameters. After convolving with these kernels, the gradient magnitude G at each pixel is calculated as shown in Equation (2).
G = ( G x I ) 2 + ( G y I ) 2
where I is the input image feature map and denotes the convolution operation. A larger G value corresponds to stronger edge information and can effectively highlight the contour boundaries of objects within the image.
Figure 5 intuitively demonstrates the actual effect of the gradient magnitude G . The figure shows the input image (input feature map), the corresponding horizontal gradient map G x , the vertical gradient map G y , and the final gradient magnitude map G . It can be observed that the brighter regions in the gradient magnitude map correspond to edges and contours in the image, where gradient values are larger, reflecting stronger edge features. Conversely, the darker regions indicate relatively flat areas with minor texture variations, where gradient values are smaller. In this way, the gradient magnitude map effectively highlights structural information in the image, aiding the model in more accurately identifying and segmenting target regions.
In the EIEM module, the edge strength map is utilized as an edge feature map, enabling the model to more accurately capture the morphological characteristics of targets. This assists subsequent convolutional layers in distinguishing the boundaries and structures of different objects. This gradient-based edge detection mechanism enhances the model’s sensitivity to fine details, particularly in metallographic images with complex backgrounds or strong texture interference, thereby improving the accuracy of object detection and segmentation.
Considering the importance of global structural information, Conv_Branch is incorporated to extract high-dimensional local features from the original image, thereby improving the model’s perception of texture and semantic categories. Finally, the outputs of the two branches are concatenated to form a more comprehensive image feature representation, which significantly enhances the model’s feature expressiveness and discriminative capability.
Assuming the input image size is X R H × W × C , after passing through the SobelConv branch and the convolutional branch, edge feature maps F e d g e and spatial feature maps F s p a c e are obtained respectively. The computational procedure is presented in Equation (3).
F e d g e = S o b e l C o n v ( x ) R H × W × C 1 , F s p a c e = C o n v ( x ) R H × W × C 2
Among them, C 1 and C 2 represent the output channel numbers of the SobelConv branch and the convolutional branch, respectively. Ultimately, EIEM employs a concatenation operation for fusion, as shown in Equation (4).
F f u s i o n = C o n c a t ( F e d g e , F s p a c e ) R H × W × ( C 1 + C 2 )
To further optimize information fusion, the EIEM employs 1 × 1 convolutional dimensionality reduction and incorporates residual connections to enhance gradient transmission effects and improve training robustness, as illustrated in Equation (5).
F o u t p u t = F f u s i o n W 1 × 1 + X
Among them, W 1 × 1 is the convolutional kernel of 1 × 1 ensures the matching of feature channels and enhances feature expression capability.
The EIEM module can effectively improve the model’s edge perception ability, maximally preserving the integrity of edge information and spatial information, avoiding information loss, and enhancing the performance of object detection and segmentation tasks.

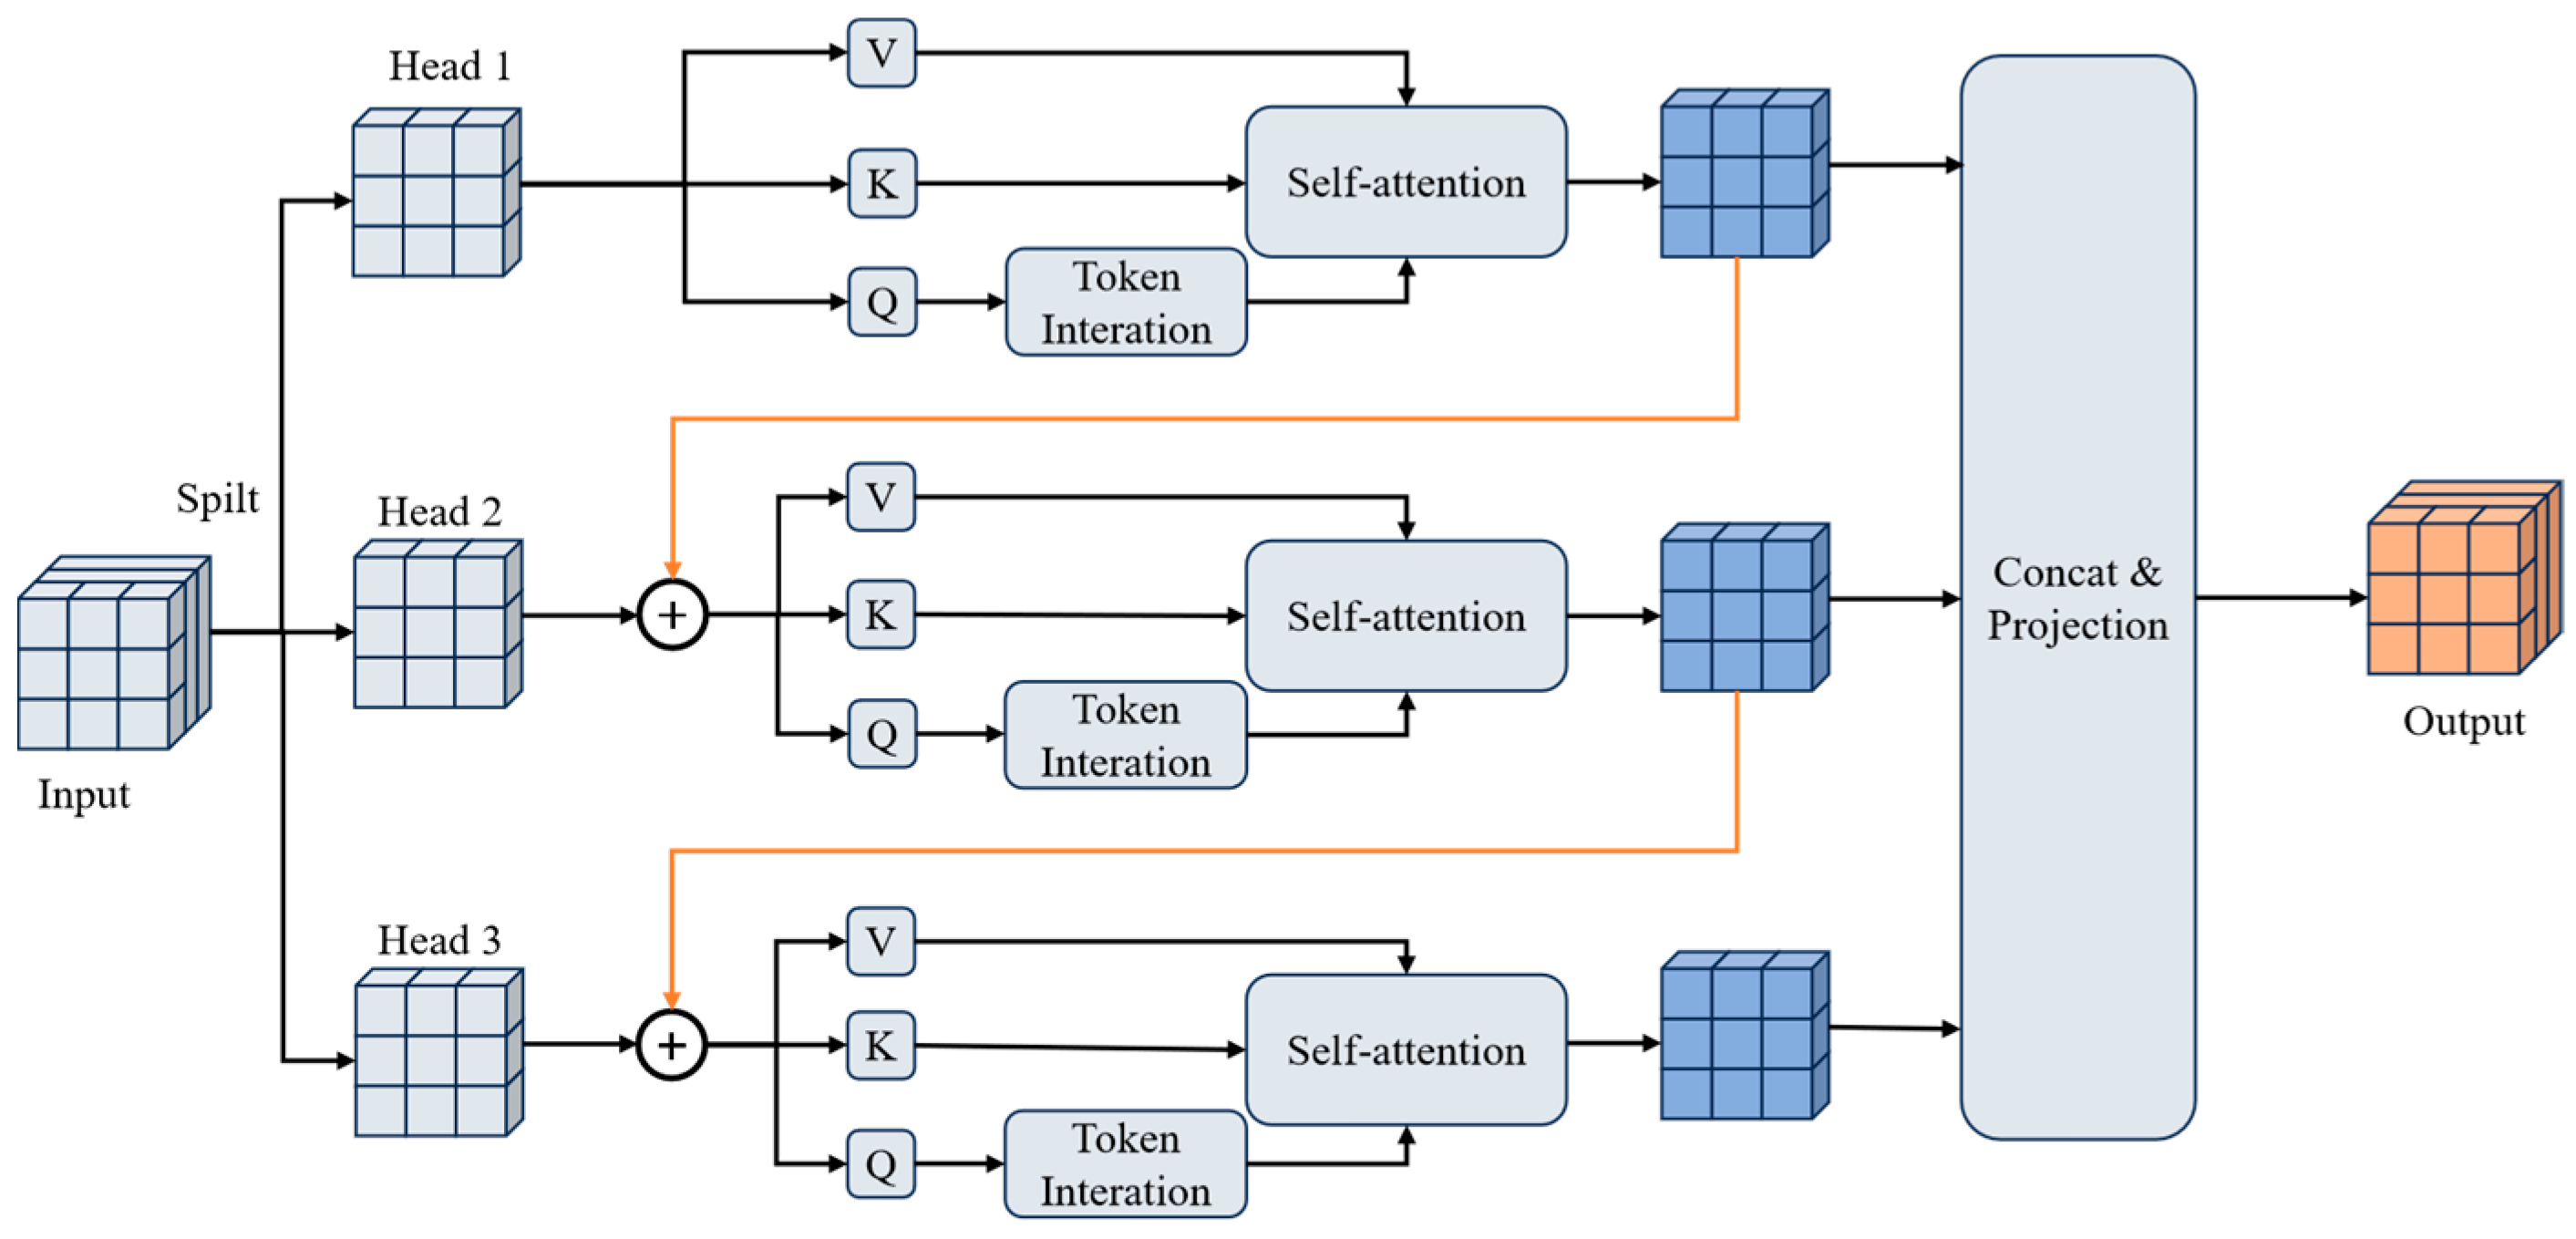
3.2.2. Cross Stage Partial with Cascaded Group Attention

Due to the complex morphology, uneven sizes, and blurred boundaries of the secondary phase structures, traditional segmentation methods struggle with fine-grained structure recognition and effective feature fusion. In the original YOLO11 architecture, the Cross Stage Partial with Pyramid Squeeze Attention (C2PSA) module employs a conventional self-attention mechanism that relies on either global or local computations. This approach leads to high computational overhead and limited capability in capturing fine local details. Although multi-head self-attention (MHSA) enables parallel processing of multiple attention weights, it tends to overlook small-scale targets, thereby compromising segmentation accuracy. To address these challenges, this study adopts the Cascaded Group Attention (CGA) [33] mechanism to construct the Cross Stage Partial with Cascaded Group Attention (C2CGA) module, which enhances the detection of small secondary phase particles and improves the segmentation of ambiguous boundaries.
CGA optimizes feature fusion through a cascading attenuation mechanism, enhancing the interaction of features across different scales. The self-attention mechanism within each group improves local information extraction, while cross-group information transmission strengthens the capacity for global feature modeling. Compared to traditional multi-head self-attention, the C2CGA mechanism delivers more fine-grained information via attention-based feature interactions, enabling more precise boundary identification and reducing background noise. As a result, it significantly improves detection accuracy and robustness. The structure of the CGA is illustrated in Figure 6.
Assuming the input data is a multi-dimensional tensor, its representation is:
X R N × d
Among them, N represents the sequence length, and d represents the feature dimension. The input data is divided into h groups, with each group having a dimension of d / h . For the i group, its input is represented as:
X i R N × ( d / h )
Within each group, compute the Query, Key, and Value:
Q i = X i W Q i , K i = X i W K i , V i = X i W V i
Among them, W Q i , W K i , W V i R d / h × d k represents the learnable weight matrix, and d k denotes the attention mapping dimension.
Next, the self-attention scores are calculated as:
H i = A t t e n t i o n ( Q i , K i , V i ) = s o f t m a x ( Q i K i T d k ) V i
Through a cascading approach, the output of the previous layer is combined with the input of the current layer to enable information interaction between different groups:
H i = C o n c a t ( H i 1 , H i ) , i = 2 , , h
Finally, all group outputs are linearly transformed back to the original input dimension:
Y = H W O
where W O R d × d is the projection matrix used to adjust the dimensions of the output to match the input size.

3.2.3. Efficient Feature Fusion and Dynamic Upsampling

In the segmentation task of secondary phase metallographic structures, the uneven distribution of secondary phase particle sizes and their blurred boundaries present challenges for traditional feature extraction and fusion methods, particularly in handling cross-scale information. In the original YOLO11 network, the neck utilizes a standard feature pyramid network (FPN) structure that fuses multi-scale features but relies on conventional upsampling methods such as nearest-neighbor or bilinear interpolation. These methods may cause feature loss, especially for small particles, adversely affecting segmentation accuracy. To address this problem, we integrate RepGFPN (Reparameterized GFPN) [34] with DySample (Dynamic Sampling) [35] to construct the GDFPN neck network. This design optimizes cross-scale feature fusion and enhances the model’s capability to recognize secondary phase particles of varying sizes.
Compared to traditional FPN-PAN structures, RepGFPN employs reparameterization techniques and lightweight computational units to enhance feature fusion capability while optimizing computational efficiency. Figure 7 shows the structure of RepGFPN. It achieves multi-level feature fusion by incorporating features from earlier layers and merging them with those of the current layer, thereby enabling efficient cross-scale feature interaction.
Moreover, RepGFPN employs CSPStage [36] as a lightweight computational unit to improve efficiency and enhance feature representation. As shown in Figure 8, CSPStage consists of two parallel branches: one branch directly passes the input features through a residual path, while the other processes them using a stack of Rep 3 × 3 modules. The outputs of both branches are then concatenated and fused via a final convolutional layer.
The Rep 3 × 3 module, highlighted on the right side of Figure 8, serves as the core component for local feature extraction and is an integral part of the CSPStage architecture. It comprises multiple convolution layers with a re-parameterized 3 × 3 Convolution structure, enabling richer spatial feature representation while maintaining computational efficiency. Through this split-transform-merge design, CSPStage effectively reduces redundant computations by partially reusing features from previous stages, while the integration of Rep 3 × 3 modules strengthens the network’s non-linear representation capability.
In terms of multi-scale feature fusion, RepGFPN enhances the feature transfer process by integrating high-level semantic information with low-level detailed features. Unlike traditional FPNs that rely on simple upsampling, RepGFPN adopts a weighted fusion strategy to more accurately capture the boundary information of small secondary phase particles and suppress background interference. This approach significantly improves the model’s robustness and performance, particularly in metallographic image analysis tasks.
To address up sampling details, we introduce DySample, an adaptive upsampling technique that adjusts according to input features. This method prevents the blurring and loss of detail typically associated with traditional upsampling techniques, particularly enhancing the segmentation accuracy of small-sized particles.
DySample achieves adaptive up sampling by dynamically predicting interpolation weights. As shown in Figure 9, given a feature map X of size C × H 1 × W 1 and a point sampling set δ of size 2 g × H 2 × W 2 , where the first dimension of 2 g represents the x and y coordinates. The feature map X is resampled to a size of C × H 2 × W 2 for X by employing the spatial positions from the point sampling set δ via the grid_sample function, as expressed in Equation (12).
X = g r i d _ s a m p l e ( X , δ )
Additionally, DySample employs dynamic range factors to determine sampling positions, adjusting the resolution during upsampling. As shown in Figure 10, given an upsampling scale factor s and an input feature map X (with a size of C × H × W ), a linear layer is used to generate an offset of O , where the numbers of input and output channels are C and 2 g s 2 , respectively, as defined in Equation (13).
O = l i n e a r ( X )
Then, the offset is reshaped via a pixel shuffle operation into a high-resolution base sampling grid G of size 2 g × s H × s W . The final point sampling set δ is obtained by adding the offset O to the base grid G , as defined in Equation (14).
δ = G + O
In summary, RepGFPN optimizes multi-scale feature fusion through residual connections and weighted fusion, enabling full integration of high-level semantics and low-level details, thereby enhancing the segmentation accuracy of secondary phase structures in complex scenarios. DySample employs dynamic interpolation weights to achieve adaptive upsampling, preserving more detailed information and particularly improving the detection of small-sized secondary phase particles. The GDFPN neck network constructed by combining these two methods not only strengthens feature extraction capabilities but also improves segmentation accuracy across particles of varying scales, optimizing overall segmentation performance.

4. Experimental

4.1. Experimental Environment and Dataset

The experiments in this study were implemented using the Python (version 3.10) programming language and the PyTorch deep learning framework. During training, all images were resized to 640 × 640 pixels, and all models were evaluated after 300 epochs of training. The batch_size was set to 16, with 300 training epochs. Stochastic Gradient Descent (SGD) was employed as the optimization algorithm, and the learning rate was dynamically adjusted using a cosine annealing schedule. The initial learning rate (lr0) was set to 0.01, momentum was 0.937, and the weight_decay coefficient was 0.0005. Detailed hardware and software configurations used in the experiments are provided in Table 1.
The experimental datasets were collected from a laboratory at a university in Jiangxi, China. Cu-Fe alloy metallographic images were captured using a Carl Zeiss desktop video metallographic microscope (Model: Axioskop2). Representative metallographic images are presented in Figure 11.
A total of 225 raw Cu-Fe alloy metallographic images were collected as the base data. To improve the robustness and generalization ability of the model, data augmentation techniques—including overlapping cropping, rotation, and flipping—were employed to increase the diversity of the dataset. Following augmentation, an expanded dataset comprising 6240 images was established. Prior to training, the dataset was subjected to random shuffling and subsequently partitioned into training (4992 images) and validation (1248 images) subsets in an 80:20 ratio.

4.2. Evaluation Metrics

The evaluation metrics employed in this study include Precision, Recall, Mean Average Precision (mAP), model parameters (Params), computation cost (GFLOPS), detection speed (FPS), and model size. Precision is defined as the ratio of correctly predicted positive samples to the total number of samples identified as positive by the model. Recall signifies the fraction of accurately detected targets relative to all existing targets, indicating the model’s capacity to minimize false negatives. mAP represents the mean of the Average Precision (AP) scores calculated for multiple categories. FPS measures the number of images processed by the model per second. Model size pertains to the size of the model’s weight file post-training. The specific calculation formulas are as follows:
P r e c i s i o n = T P T P + F P
R e c a l l = T P T P + F N
A P = 0 1 P ( R ) d R
m A P = 1 N i = 1 N A P i
F P S = 1 I n f e r e n c e T i m e p e r I m a g e ( s )
where T P refers to the true positive count, F P is the false positive count, and F N is the false negative count. I n f e r e n c e T i m e p e r I m a g e ( s ) Represents the processing time per frame.

4.3. Experimental Results and Analysis

4.3.1. Comparison of YOLO Series Algorithms

Considering the varying performance of different YOLO algorithm versions across diverse application scenarios and target recognition tasks, this study conducted a comparative experimental analysis of several versions, as summarized in Table 2.
In terms of performance, YOLO11 achieved the highest mAP at 85.5%. Although YOLOv5 and YOLOv8 exhibited slightly higher Recall values (78.7% and 78.8%, respectively), YOLO11 maintained a comparable Recall of 78.6%. Additionally, it attained a Precision of 79.3%, second only to YOLOv7 (80.1%), demonstrating reliable detection performance while maintaining high precision.
Regarding computational efficiency, YOLO11 reached a high inference speed of 208 FPS, with a computational cost of only 10.4 GFLOPs and a model size of just 6.1 MB, significantly outperforming the other models. Overall, YOLO11 strikes an excellent balance between accuracy, efficiency, and lightweight design, making it particularly well-suited for resource-constrained scenarios and offering substantial practical value.
Figure 12 presents the segmentation results of different YOLO algorithms, with red rectangular boxes indicating regions where recognition and segmentation defects occurred. In the task of segmenting large secondary-phase structures, YOLOv5 exhibits limited sensitivity to edge features, resulting in blurred boundaries and missed detections of smaller or finer secondary-phase areas, which adversely affects the accuracy and completeness of segmentation results. Although YOLOv7 improves overall detection accuracy, it still suffers from edge misalignment and redundant segmentation, potentially causing distortion of the secondary-phase morphology and thereby impacting the accurate interpretation of the material’s microstructure. Compared to its predecessors, YOLOv8 achieves some progress in reducing segmentation gaps; however, its performance remains unstable when handling complex boundary regions, particularly under conditions of high noise or overlapping phases, where its recognition capability declines. YOLOv9 demonstrates pronounced repeated segmentation in larger secondary-phase regions, generating multiple overlapping predictions that severely interfere with the accuracy and reliability of subsequent quantitative analyses.
In contrast, YOLO11 shows significant superiority in capturing large secondary-phase structures. It more effectively preserves boundary details, substantially reducing mis-segmentation and redundant detections, which enhances the integrity and precision of target regions. This superior performance contributes to improved accuracy in quantitative analysis of secondary-phase structures in metallographic images and strengthens the understanding and prediction of material properties. Although some recognition challenges persist in extremely complex scenarios, YOLO11 has demonstrated good adaptability and robustness, laying a solid foundation for future model improvements and practical applications.

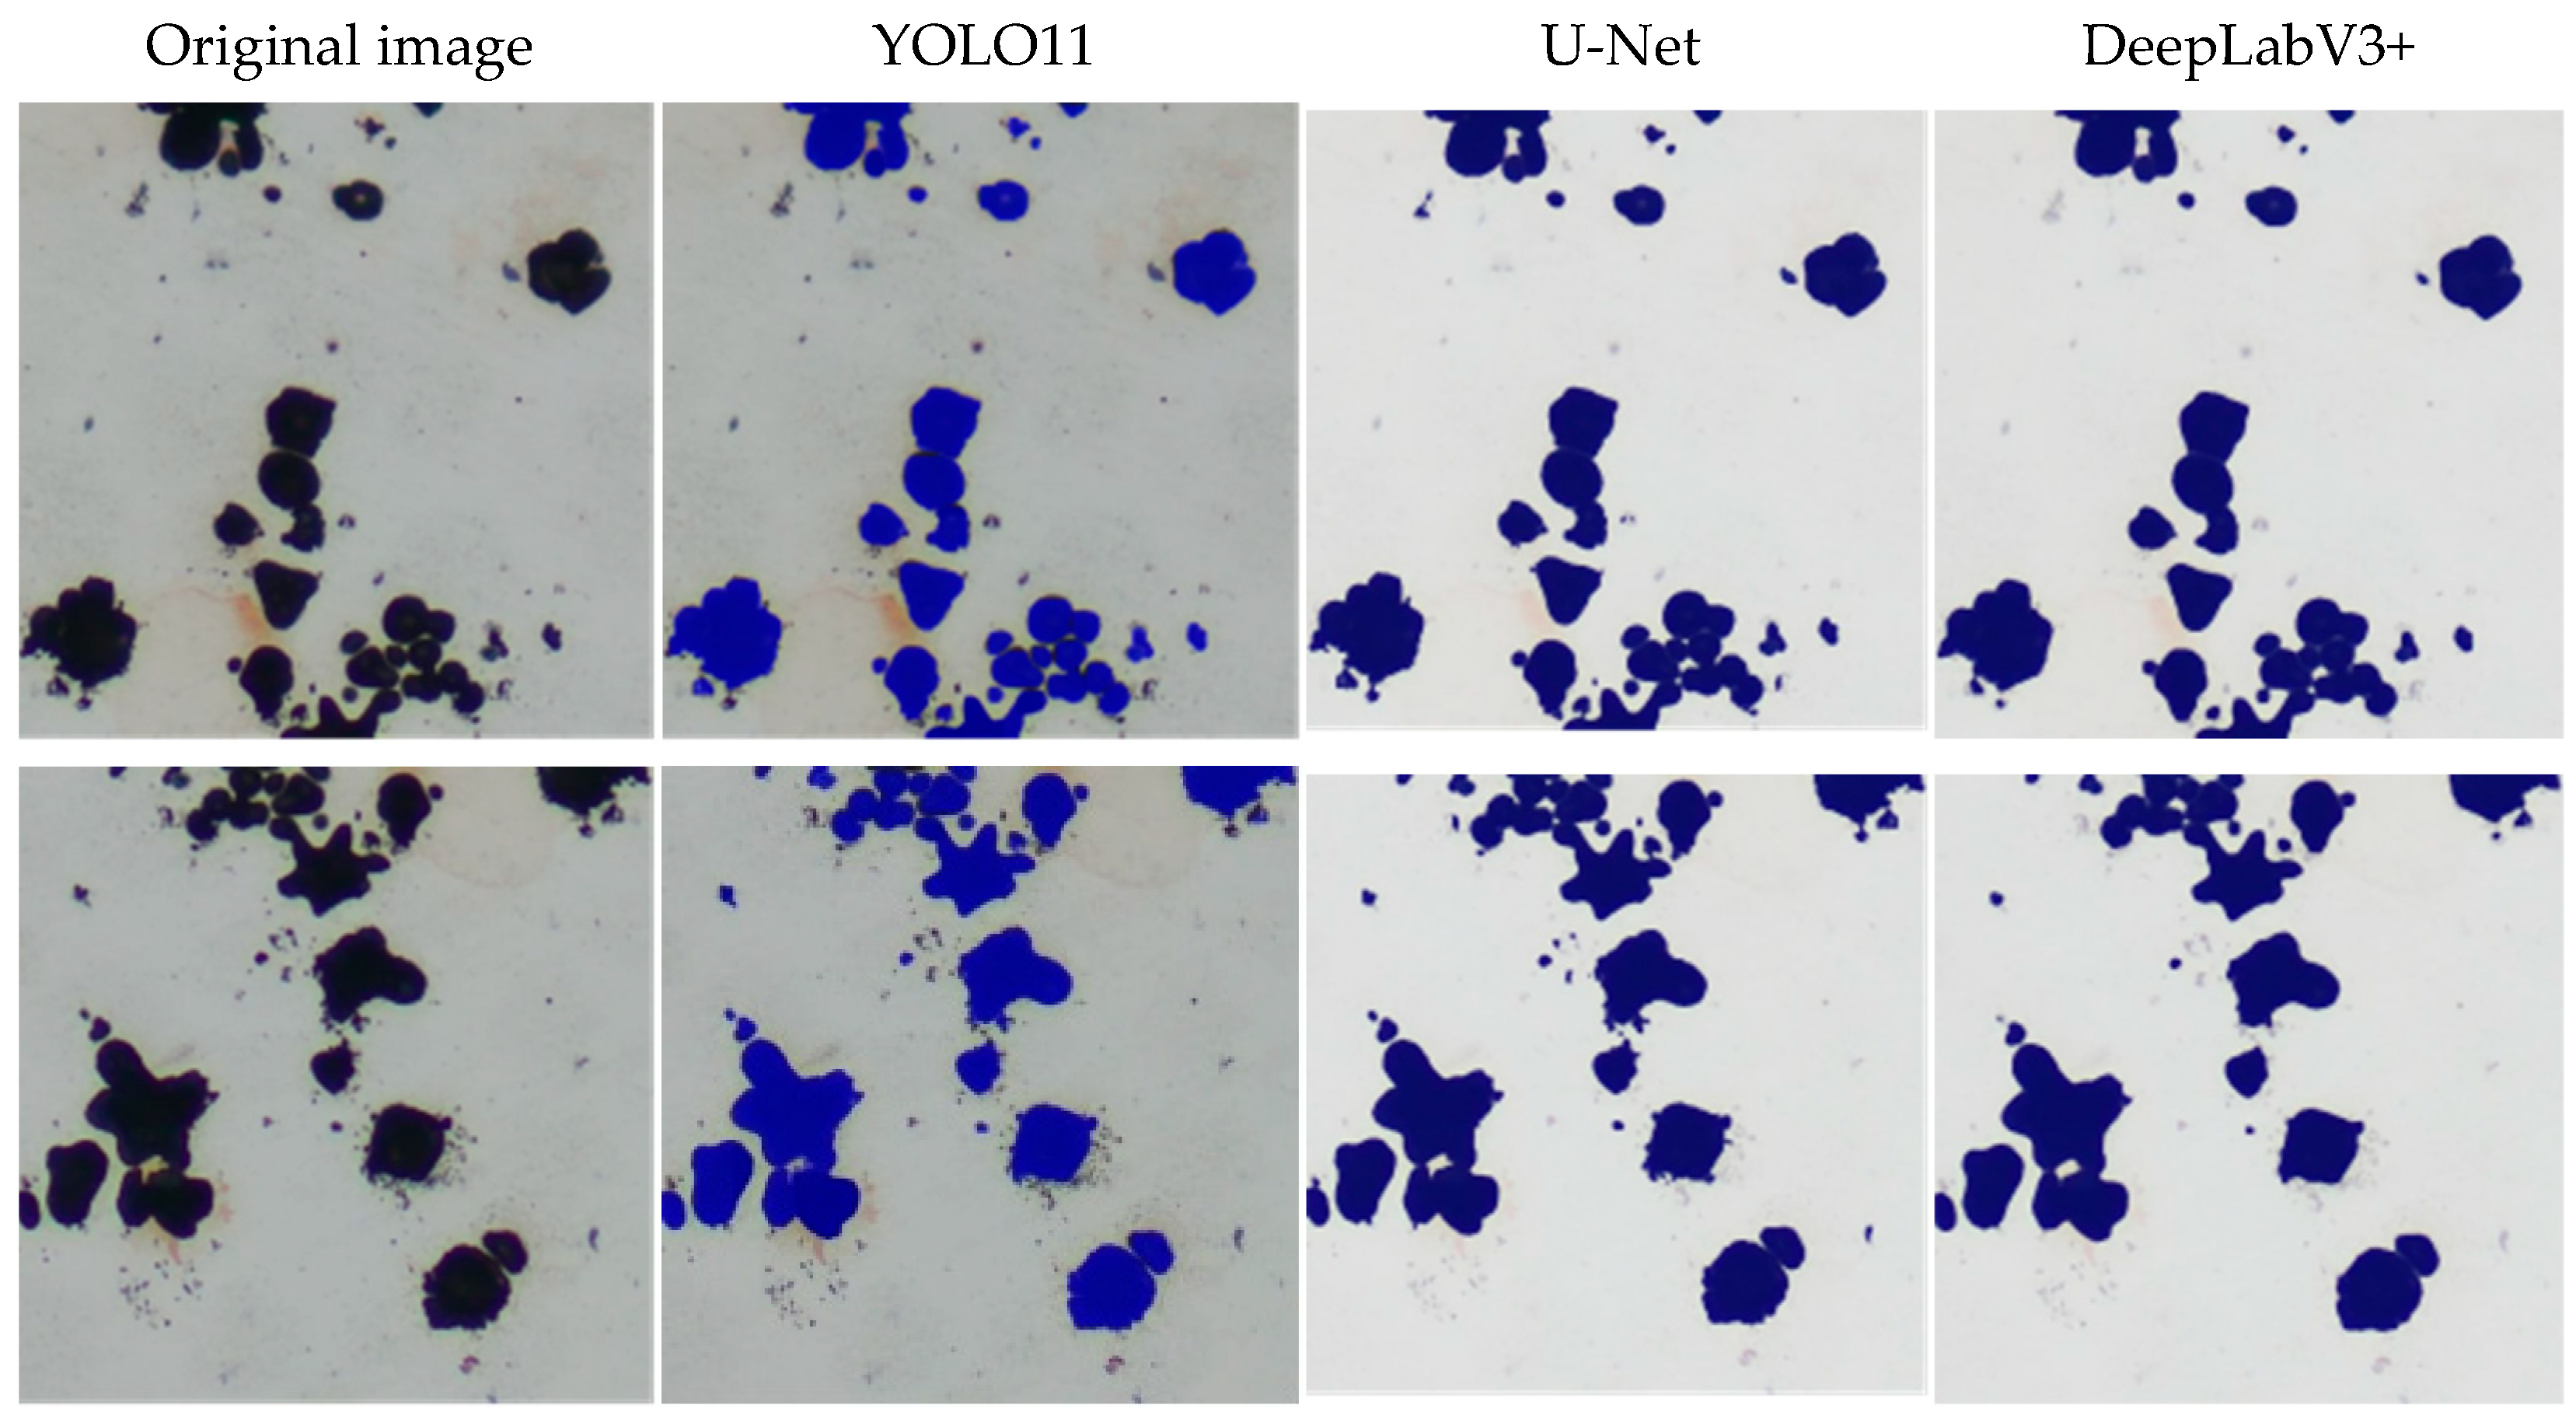
4.3.2. Comparison with Different Types of Segmentation Algorithms

To comprehensively evaluate the performance of the YOLO algorithm in segmenting the secondary phase of Cu-Fe alloys, this study conducted a comparative experiment using semantic segmentation methods U-Net and DeepLabV3+, as well as the instance segmentation method YOLO11, to analyze the applicability of these two segmentation approaches for secondary phase recognition in metallographic images. All methods were trained on the same dataset and evaluated using metrics including MIOU, mAP, FPS, GFLOPS, and parameter size. The experimental results are shown in Table 3.
As shown in the table, YOLO11 achieves an mAP/MIOU of 85.5%, slightly lower than U-Net (86.2%) but higher than DeepLabV3+ (84.7%), demonstrating good accuracy and generalization capability. However, semantic segmentation models like U-Net and DeepLabV3+ have complex network architectures and require substantial computational resources, resulting in relatively slow inference speeds that limit their applicability in real-time or industrial scenarios demanding high efficiency. In contrast, YOLO11’s FPS reaches 208, significantly outperforming U-Net (21.5) and DeepLabV3+ (59.6), highlighting its advantage in inference speed. With a computational cost of only 10.2 GFLOPs, YOLO11 reduces complexity by approximately 96.5% and 87.7% compared to U-Net and DeepLabV3+, respectively. The parameter size is only 2.7 million, substantially shrinking the model size. These results clearly demonstrate YOLO11’s superior speed and lightweight architecture, making it highly suitable for real-time industrial applications where efficiency and low computational overhead are essential.
Figure 13 presents a comparison of segmentation results from different models. It can be observed that YOLO11 effectively segments adjacent small secondary phase particles, achieving precise target differentiation. In contrast, U-Net and DeepLabV3+ often treat these targets as a whole during segmentation, resulting in target adhesion and blurred boundaries, which negatively impact segmentation accuracy. YOLO11 demonstrates superior target discrimination capability when handling small object segmentation tasks, making it more suitable than U-Net and DeepLabV3+ for fine structural recognition and high-precision segmentation applications.

4.3.3. Ablation Experiment and Performance Analysis

To systematically verify the contribution of each module improvement to the overall model performance, an ablation study was conducted. The effects of the EIEM, C2CGA, and GDFPN modules on model performance were analyzed, and the synergistic optimization effects when all three modules were integrated were further explored. The experimental results are presented in Table 4.
(1)
EIEM Module: After its introduction, Precision increased to 81.2% (+1.9%), Recall rose to 80.5% (+1.9%), and mAP reached 86.9% (+1.4%). Meanwhile, the parameter count decreased to 2.79 M, FPS improved to 270 (+62), model size slightly reduced to 6.0 MB, and computational cost slightly increased to 10.4 GFLOPs, achieving simultaneous improvements in accuracy and efficiency. The EIEM module enhances edge information perception, significantly improving the clarity and integrity of segmentation boundaries. This leads to a 1.9% increase in both precision and recall, effectively reducing mis-segmentation and ensuring detection accuracy and efficiency.
(2)
C2CGA Module: Recall showed a slight increase (+0.2%), mAP remained stable, and Precision slightly decreased (−0.7%). However, the parameter count reduced, FPS rose to 303, while computational cost and model size remained unchanged, enhancing efficiency and model lightweightness. This module employs a cascaded group attention mechanism to strengthen focus on small targets and detailed regions. Although precision slightly decreased, the improved recall indicates better detection of tiny targets alongside increased inference speed.
(3)
GDFPN Module: This module significantly improved Precision (+2.5%), Recall (+1.6%), and mAP (+1.2%). The trade-off was an increase in parameters to 3.99 M, GFLOPs to 12.4, and model size to 8.4 MB. Nevertheless, FPS stayed at 303, reflecting a good balance between performance and computational cost. GDFPN optimizes multi-scale feature fusion and adaptive upsampling, enhancing recognition of targets at varying scales and resulting in notable accuracy improvements without sacrificing inference speed.
(4)
All three modules combined: Precision increased to 84.6%, Recall to 81.0%, and mAP reached 89.0%, achieving the best overall performance. Although parameters increased to 3.91 M, GFLOPs to 12.2, and model size to 8.3 MB, FPS remained at 256. This combination balances accuracy, speed, and resource consumption, demonstrating the significant advantage of module synergy. Figure 14 presents a comparison of different model performances. The collaborative effect of these modules comprehensively enhances edge perception, small target attention, and multi-scale fusion, thereby significantly improving segmentation performance and model robustness while maintaining an optimal trade-off among accuracy, speed, and computational efficiency.
Figure 15 presents a comparative analysis of detection and segmentation performance between the original and the enhanced networks on the same test images. The results indicate that the original YOLO11 suffers from certain instances of target omission, particularly in scenarios involving complex backgrounds or densely packed target regions, where some objects remain undetected (highlighted by red boxes in the figure). In contrast, the optimized YOLO11 model exhibits significantly improved target detection and segmentation accuracy, effectively mitigating the missed detection issues observed in the original network and enhancing overall recognition performance in challenging target regions.
These observations highlight a critical limitation of the original YOLO11: its limited sensitivity to subtle textures and small-sized targets, particularly when these are partially occluded or embedded in high-noise backgrounds. This often results in blurred boundaries or the complete omission of fine features. These limitations underscore the necessity of the proposed enhancements, including EIEM for enhanced edge perception, C2CGA for fine-grained attention, and GDFPN for improved multi-scale feature fusion, which together enable the improved model to more effectively capture intricate details, maintain structural integrity, and remain robust in visually complex scenarios.
In this study, the Grad-CAM [37] method was used to generate the thermal map of target detection, and the response of the target region in the metallographic image of the improved YOLO11 model was further revealed. The heat map in Figure 16 demonstrates that the improved YOLO11 can precisely focus on the second-phase regions, with high-response areas showing excellent alignment with the actual distribution, indicating the model’s superior feature extraction and target localization capabilities. Although the heat zones exhibit slight diffusion, covering surrounding target areas, this expansion contributes to enhancing the overall segmentation coherence and robustness.

4.3.4. Experimental Summary

This study comprehensively validates the effectiveness of the proposed model through extensive experiments. Compared to mainstream YOLO series models, the optimized YOLO11 significantly improves segmentation accuracy and completeness of secondary phase structures while maintaining fast inference speed and lightweight design, effectively reducing mis-segmentation and missed detections.
In contrast to traditional semantic segmentation models such as U-Net and DeepLabV3+, the improved model achieves a better balance among accuracy, speed, and computational resource consumption, making it suitable for real-time industrial inspection scenarios. Ablation studies demonstrate that the EIEM module enhances edge perception, the C2CGA module strengthens attention to small targets, and the GDFPN module optimizes multi-scale feature fusion. The synergy of these modules substantially boosts overall segmentation performance and model robustness.
Qualitative results further confirm the superior performance of the improved model in complex backgrounds and densely packed target areas. Overall, the proposed approach exhibits high accuracy and practical value for secondary phase analysis in Cu-Fe alloys, showing promising application prospects.

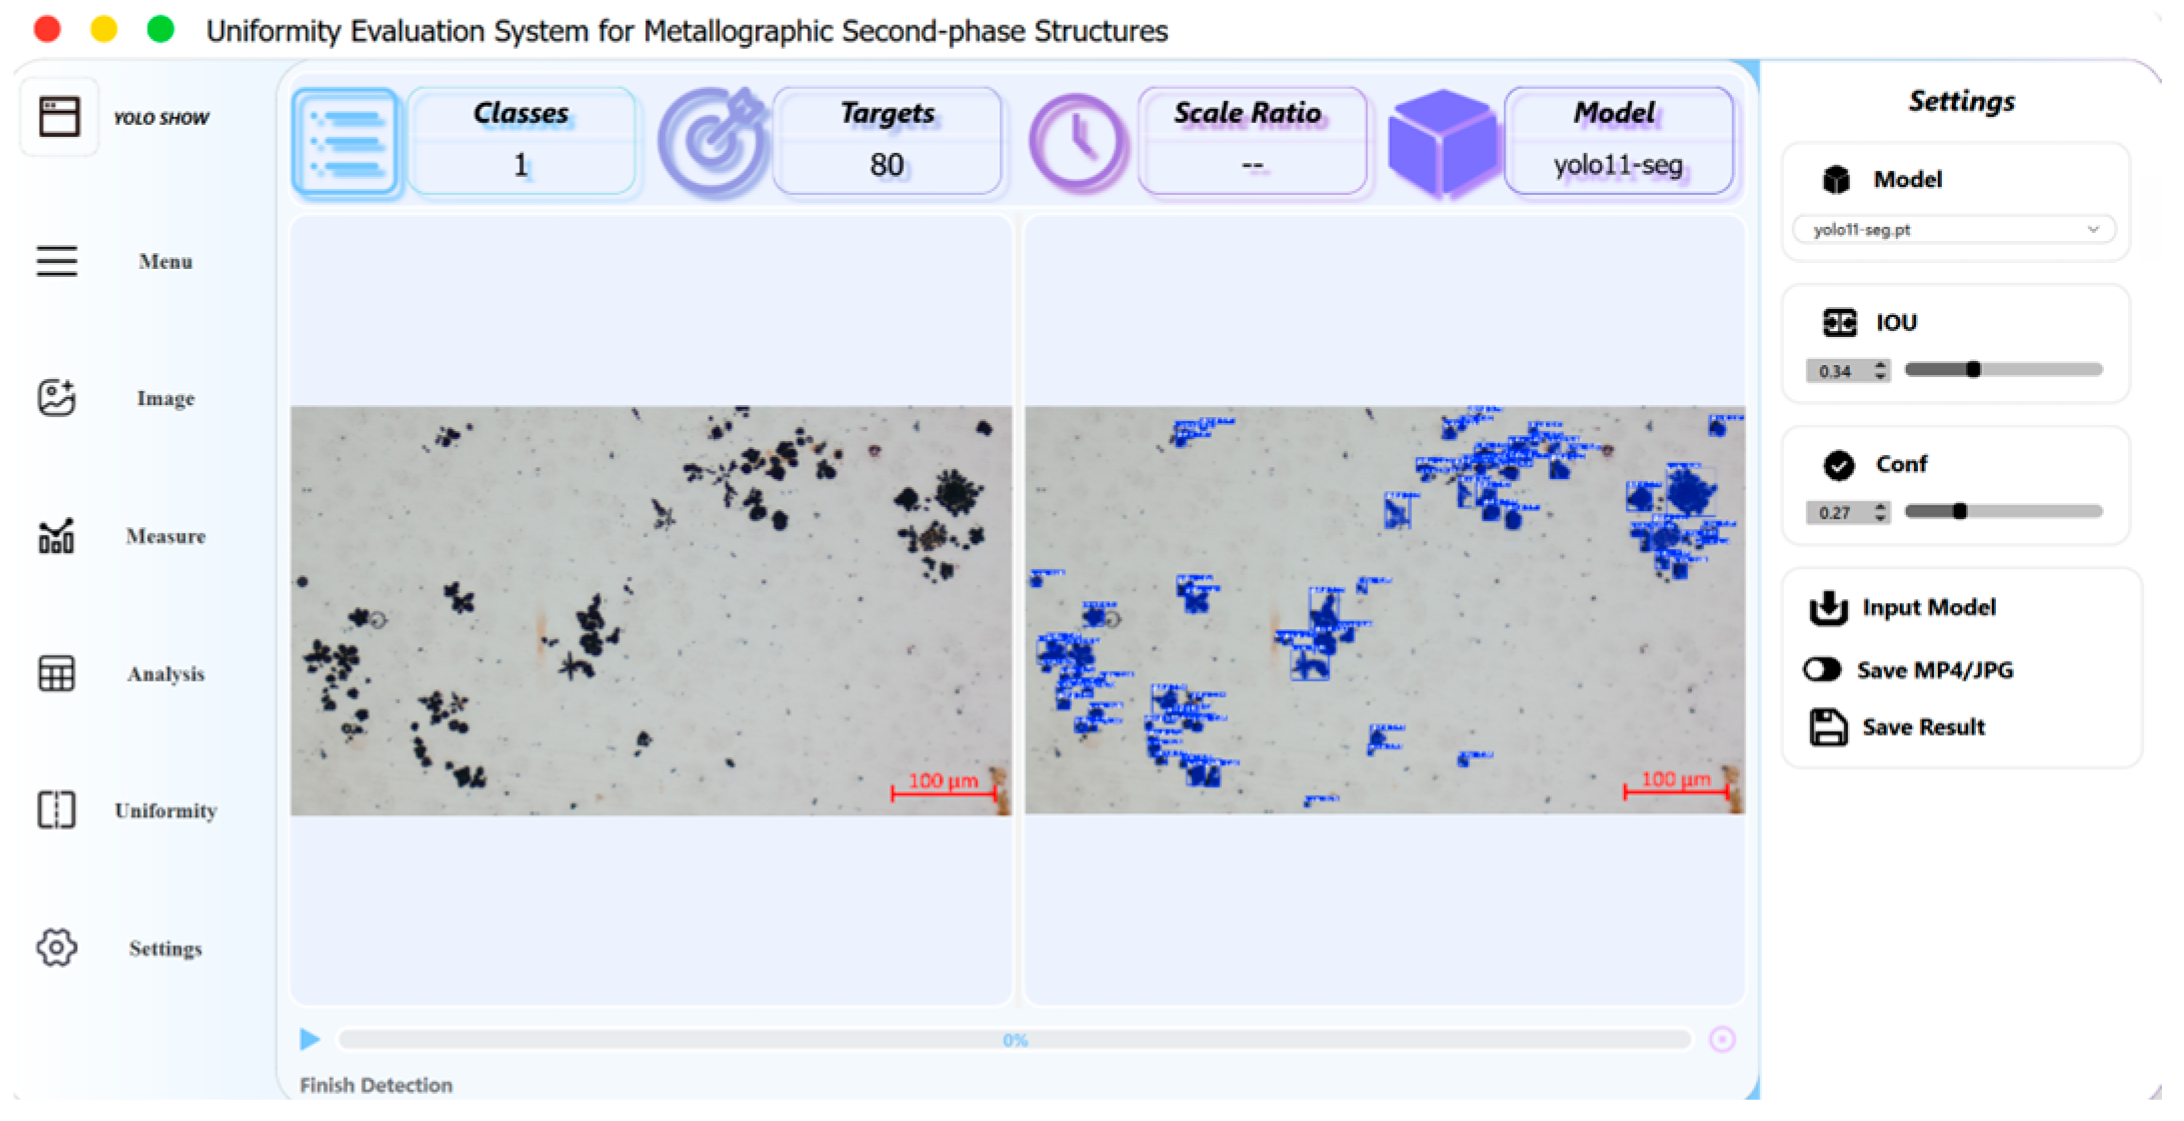
5. Application System

In this study, the YOLO11 instance segmentation algorithm was implemented using Python and developed into a software system based on the PySide6 [38] framework for quantitative analysis of secondary phase uniformity. Leveraging the deep learning model’s feature extraction capabilities, the system accurately identifies and segments secondary phase structures in Cu-Fe alloys and visually presents the results, thereby simplifying traditional analysis procedures while reducing time and manual effort. Figure 17 shows the user interface of the system.
The system automatically segments the secondary-phase structures, calculates particle size data, and supports multi-dimensional statistical and distribution analyses. To assess the spatial uniformity of the secondary phase, the system employs a random sampling approach to generate 15 rectangular sub-regions of equal size across the entire metallographic image. These sub-regions are randomly distributed and collectively cover approximately 70% of the image area, ensuring representativeness while minimizing edge noise interference. Within each sub-region, the system counts the number of pixels occupied by the secondary phase and calculates the area ratio of secondary-phase pixels to the total pixels in that region, reflecting the local distribution density. Based on the variance of the area ratios across all sub-regions, a uniformity index M is defined to quantify the consistency of secondary-phase distribution across different spatial regions. The calculation formula is as follows:
M = i = 0 n X i A 100 2
where X i represents the area ratio of the secondary phase in each region, A denotes the total area ratio of the secondary phase in the metallographic image, and n is the number of regions.
The uniformity index ( M ) can serve as a preliminary indicator of material performance. Specifically, a higher M value typically reflects a non-uniform distribution of the secondary phase, which may lead to stress concentration, thereby negatively affecting the mechanical properties and service life of the material. Conversely, a lower M value indicates a more uniform microstructural distribution, which is generally beneficial for electrical conductivity, mechanical stability, and process consistency. Therefore, the M value not only provides a quantitative metric for structural evaluation but also offers valuable insights for performance prediction and process optimization.
For objective evaluation of secondary phase uniformity, the system applies the following criteria:
When M 50 , the distribution is considered uniform, indicating that secondary phase particles are evenly dispersed within the field of view, without obvious aggregation or segregation.
When M > 50 , the distribution is considered non-uniform, indicating notable discrepancies in particle distribution, potentially manifesting as aggregation, streaking, or other abnormal morphologies.
It should be noted that these threshold values were initially determined based on calculations from a limited set of representative Cu-Fe alloy metallographic images, combined with expert judgment from experienced researchers. Despite their practical effectiveness in distinguishing uniform and non-uniform distributions, these thresholds require further validation and refinement through expanded datasets and systematic experimentation to enhance their robustness and general applicability.
The system offers a detailed analysis of secondary phase uniformity, enabling researchers to identify potential microstructural anomalies and process defects. Its application significantly improves the efficiency of microscopic structural analysis, reduces manual inspection workloads, and enhances the objectivity and reproducibility of results.
Figure 18 illustrates the application scenario of the proposed framework for evaluating the uniformity of secondary phase distributions in Cu-Fe alloys. The metallographic image is systematically divided into several discrete regions, and detailed quantitative information is extracted from each region. Based on the information from all regions, an overall uniformity index ( M value) is calculated and compared against a predefined threshold (T) to derive a comprehensive assessment of the uniformity of the secondary phase distribution.
This figure effectively demonstrates the system’s capability and practical utility in metallurgical analysis by facilitating precise, spatially resolved quantification of microstructural homogeneity, thereby supporting enhanced accuracy in the evaluation of material microstructures.

6. Conclusions

To address the limitations of traditional metallographic analysis methods, such as strong subjectivity, low efficiency, and inadequate quantitative capability, this study proposes a deep learning-based automatic segmentation method for the secondary phase in Cu-Fe alloys. The method is built upon the YOLO11 model and incorporates an Edge Information Enhancement Module (EIEM) to improve boundary detection, Cross Stage Partial with Cascaded Group Attention (C2CGA) module replacing the CSPSA module to enhance the recognition accuracy of small secondary phase particles, and integrates RepGFPN with DySample to form the GDFPN neck structure for optimized feature extraction.
Initially, the performance of various YOLO algorithms was compared, with YOLO11 demonstrating superior results. Further comparative experiments with mainstream semantic segmentation methods U-Net and DeepLabV3+ indicate that YOLO11 exhibits strong competitiveness in mAP (85.5%), while significantly outperforming both in inference speed (208 FPS), computational complexity (10.2 GFLOPs), and model parameter size (2.7 million), showcasing its advantages in lightweight design and efficiency.
Experimental results on the Cu-Fe alloy metallographic image dataset demonstrate that the improved YOLO11 model achieves precision, recall, and mAP scores of 84.6%, 81.0%, and 89.0%, respectively, showing significant improvements over baseline and other advanced methods. Specifically, the EIEM module effectively enhances boundary detail capture, the C2CGA module improves detection accuracy of small particles, and the combination of RepGFPN and DySample optimizes multi-scale feature fusion, collectively reducing false positives and missed detections, and strengthening model robustness in complex backgrounds. These results fully validate the effectiveness of each module design and the practical value of the overall approach.
This work not only enhances the accuracy of secondary phase analysis while reducing reliance on manual intervention but also provides a reliable automated tool for image segmentation and quantitative analysis in materials science. It lays a foundation for more precise structural evaluation and process optimization.
Although the improved model achieves a good balance between accuracy and speed, it may still produce recognition errors when faced with extreme interference or noisy backgrounds. Future work will focus on enhancing the model’s adaptability to complex samples. Specifically, research directions include: (1) further optimizing the model to improve segmentation performance on more complex microstructures; (2) extending the method to analyze other metal alloys or multi-phase materials; and (3) exploring the integration of additional domain knowledge to enhance the algorithm’s intelligence and adaptability, enabling more comprehensive and efficient material analysis. Through continuous technological improvements and experimental validation, it is expected that this method will play a greater role in industrial applications, driving further advancement in material analysis technologies.

Author Contributions

Conceptualization, R.W. and Q.J.; resources, Y.L., Z.Z., Q.C. and X.H.; data curation, Z.Z., Q.C. and W.L.; writing—original draft preparation, R.W.; writing—review and editing, Z.Z., R.W. and Q.J.; supervision, Q.J. All authors have read and agreed to the published version of the manuscript.

Funding

This research received no external funding.

Institutional Review Board Statement

Not applicable for studies not involving humans or animals.

Informed Consent Statement

Not applicable.

Data Availability Statement

Due to the nature of this research, participants did not agree for their data to be shared publicly. However, the data are available from the corresponding author upon reasonable request.

Acknowledgments

Thank you to our researchers for their collaboration and technical assistance.

Conflicts of Interest

The authors declare no conflicts of interest.

References

  1. Jiang, Y.X.; Lou, H.F.; Xie, H.F. Development Status and Prospects of Advanced Copper Alloy. Strateg. Study Chin. Acad. Eng. 2020, 22, 84–92. [Google Scholar] [CrossRef]
  2. Alireza, V.N.; Mahya, G.; Kazem, S.B. Advancements in Additive Manufacturing for Copper-Based Alloys and Composites: A Comprehensive Review. J. Manuf. Mater. Process. 2024, 8, 54. [Google Scholar] [CrossRef]
  3. Mi, X.J.; Lou, H.F.; Xie, H.F. Development strategy for advanced copper-based materials in China. Eng. Sci. China 2023, 25, 96–103. [Google Scholar] [CrossRef]
  4. Xu, Y.T.; Pei, L.; Dai, J.M. Comparison of Microstructure and Mechanical Properties of Several Cathode Copper Materials. Rare Met. Mater. Eng. 2023, 52, 4171–4183. [Google Scholar]
  5. Han, Z.E.; Wang, X.F.; Li, Y.G. Preparation and performance of Cu-Fe alloy. Foundry Eng. 2023, 44, 849–854. [Google Scholar] [CrossRef]
  6. Wang, K.H.; Xu, Y.Y. The effect of aging temperature on the precipitation of Cu-rich phase in Fe-Cu-Mn-Ni alloy was studied by field method. Met. Meat Treat. 2023, 48, 265–270. [Google Scholar]
  7. Sun, W.B.; Wu, S.R.; Wu, T.M. High performance Cu-Fe alloy strip and its short process preparation technology. J. Shenyang Univ. Technol. 2024, 46, 403–408. [Google Scholar]
  8. Wang, X.C.; Zhang, X.Y. Modern Analytical and Testing Techniques for Materials, 2nd ed.; National Defense Industry Press: Beijing, China, 2010. [Google Scholar]
  9. Yao, Y.C.; Du, Q.; Cai, H.; Jin, J.M. (Eds.) Metallographic Inspection and Analysis; China Machine Press: Beijing, China, 2021. [Google Scholar]
  10. Zhu, X.Y.; Zhang, Z.H.; Mao, Y. Applying deep learning in automatic and rapid measurement of lattice spacings in HRTEM images. Sci. China Mater. 2020, 63, 2365–2370. [Google Scholar] [CrossRef]
  11. Ban, X.J.; Su, Y.J.; Xie, J.X. Application and Challenges of Deep Learning in Microstructure Image Analysis of Materials. Mater. Sci. Technol. 2020, 28, 68–75. [Google Scholar]
  12. Sun, Y.L.; Huang, X.Y. CMAA: Channel-wise multi-scale adaptive attention network for metallographic image semantic segmentation. Expert Syst. Appl. 2025, 276, 126925. [Google Scholar] [CrossRef]
  13. Shi, W.; Zhao, H.; Zhang, H.R. Wire melted mark metallographic image recognition and classification based on semantic segmentation. Expert Syst. Appl. 2024, 238, 122146. [Google Scholar] [CrossRef]
  14. Zhang, Y.F.; Zhang, Y.Z.; Bai, G.T. Study on the evaluation method of steel microstructure for thermal power units based on deep learning. Inn. Mong. Electr. Power Technol. 2024, 42, 78–83. [Google Scholar] [CrossRef]
  15. Azimi, S.M.; Britz, D.; Engstler, M. Advanced Steel Microstructural Classification by Deep Learning Methods. Sci. Rep. 2018, 8, 2128. [Google Scholar] [CrossRef] [PubMed]
  16. Tao, Y.T.; Li, P.P.; Xu, Y.T. Grain boundary segmentation and restoration based on deep learning and digital image processing. Rail Transit Mater. 2024, 3, 6–11. [Google Scholar]
  17. Yang, X.D. Study on classification and identification of metallographic structure based on ViT. Electron. Technol. Softw. Eng. 2022, 3, 154–158. [Google Scholar] [CrossRef]
  18. Xu, Y.F.; Zhang, Y.W.; Zhang, M.Z. Quantitative Analysis of Metallographic Image Using Attention-Aware Deep Neural Networks. Sensors 2021, 21, 43. [Google Scholar] [CrossRef]
  19. Dong, J.J.; Ren, Z.J.; Su, C. Carburized Gear Metallographic Image Segmentation Algorithm Based on Deep-Learning. Light Ind. Mach. 2024, 42, 66–73. [Google Scholar]
  20. Bu, S.C.; Cheng, K. Deep learning-based segmentation method for pure iron grain microstructure images. Comput. Digit. Eng. 2024, 52, 3697–3702. [Google Scholar]
  21. Ajioka, F.; Wang, Z.L.; Ogawa, T. Development of high accuracy segmentation model for microstructure of steel by deep learning. ISIJ Int. 2022, 60, 954–959. [Google Scholar] [CrossRef]
  22. Jang, J.; Van, D.; Jang, H. Residual neural network-based fully convolutional network for microstructure segmentation. Sci. Technol. Weld. Join. 2022, 25, 282–289. [Google Scholar] [CrossRef]
  23. Wang, Y.Q.; Wu, S.W.; Cao, G.M. Deep learning-based strengthening and refinement analysis of microstructure characteristics of ultra-low carbon steel. Steel 2024, 60, 1–9. [Google Scholar] [CrossRef]
  24. Zhang, L.X.; Che, S.J.; Xu, Z.G. Residual network-based microstructure image segmentation method for high-temperature alloys. Sci. Technol. Eng. 2020, 20, 246–251. [Google Scholar]
  25. He, H.Z. Automation Recognition of Steel Metallographic Structure Based on Deep Learning. Master’s Thesis, Wuhan University of Engineering, Wuhan, China, 2022. [Google Scholar] [CrossRef]
  26. Ma, B.Y.; Liu, C.N.; Gao, M.F. Deep learning and region-aware method for polycrystalline microstructure image segmentation. Chin. J. Stereol. Image Anal. 2020, 25, 120–127. [Google Scholar] [CrossRef]
  27. Ye, W.L. Research on Identification and Segmentation Method of Metallographic Structure of Heat-Resistant Steel Based on Deep Learning. Master’s Thesis, . Inner Mongolia Agricultural University, Hohhot, China, 2024. [Google Scholar] [CrossRef]
  28. Redmon, J.; Divvala, S.; Girshick, R.; Farhadi, A. You Only Look Once: Unified, Real-Time Object Detection. In Proceedings of the IEEE Conference on Computer Vision and Pattern Recognition (CVPR), Las Vegas, NV, USA, 27–30 June 2016; pp. 779–788. [Google Scholar]
  29. Wang, C.Y.; Bochkovskiy, A.; Liao, H.Y.M. YOLOv7: Trainable Bag-of-Freebies Sets New State-of-the-Art for Real-Time Object Detectors. In Proceedings of the 2023 IEEE/CVF Conference on Computer Vision and Pattern Recognition (CVPR), Vancouver, BC, Canada, 17–24 June 2023; pp. 7464–7475. [Google Scholar]
  30. Wang, C.Y.; Yeh, I.H.; Mark Liao, H.Y. Yolov9: Learning what you want to learn using programmable gradient information. In European Conference on Computer Vision; Springer Nature: Cham, Switzerland, 2024; pp. 1–21. [Google Scholar]
  31. Wang, A.; Chen, H.; Liu, L. Yolov10: Real-time end-to-end object detection. arXiv 2024, arXiv:2405.14458. [Google Scholar]
  32. Khanam, R.; Hussain, M. Yolov11: An overview of the key architectural enhancements. arXiv 2024, arXiv:2410.17725. [Google Scholar]
  33. Liu, X.; Peng, H.; Zheng, N. Efficientvit: Memory efficient vision transformer with cascaded group attention. In Proceedings of the IEEE/CVF Conference on Computer Vision and Pattern Recognition, Vancouver, BC, Canada, 17–24 June 2023; pp. 14420–14430. [Google Scholar]
  34. Xu, X.; Jiang, Y.; Chen, W. Damo-yolo: A report on real-time object detection design. arXiv 2022, arXiv:2211.15444. [Google Scholar]
  35. Liu, W.; Lu, H.; Fu, H. Learning to upsample by learning to sample. In Proceedings of the IEEE/CVF International Conference on Computer Vision, Paris, France, 1–6 October 2023; pp. 6027–6037. [Google Scholar]
  36. He, R.; Tursun, M.; Liu, J.; Zhu, X.; He, C.; Dong, J.; Xu, L. Road Surface Crack Detection Based on Improved YOLOv8n. Mod. Comput. 2024, 30, 20–25. [Google Scholar] [CrossRef]
  37. Selvaraju, R.R.; Cogswell, M.; Das, A. Grad-CAM: Visual Explanations from Deep Networks via Gradient-Based Localization. Int. J. Comput. Vis. 2020, 128, 336–359. [Google Scholar] [CrossRef]
  38. Sun, Y.Y.; Wang, S. Rapid Development and Practical Projects with PySide6/PyQt6; China Industry and Information Publishing Group: Beijing, China: Beijing, China; Electronics Industry Press: Beijing, China, 2023. [Google Scholar]
Figure 1. YOLO11 Network Architecture Diagram.
Information 16 00570 g001
Figure 2. Schematic diagram of C3k2 structure.
Information 16 00570 g002
Figure 3. Schematic diagram of C2PSA structure.
Information 16 00570 g003
Figure 4. Schematic diagram of the Bottlent and EIEM structures.
Information 16 00570 g004
Figure 5. Gradient Magnitude and Directional Gradients.
Information 16 00570 g005
Figure 6. Schematic diagram of CGA structure.
Information 16 00570 g006
Figure 7. The RepGFPN structure.
Information 16 00570 g007
Figure 8. CSPStage Structure Diagram.
Information 16 00570 g008
Figure 9. Dynamic Up sampling in the DySample Module.
Information 16 00570 g009
Figure 10. Point sampling based on dynamic range factor.
Information 16 00570 g010
Figure 11. Example metallographic images of Cu-Fe alloys.
Information 16 00570 g011
Figure 12. YOLO Algorithm Segmentation Comparison, with red boxes highlighting defect regions.
Information 16 00570 g012
Figure 13. Segmentation Results of Different Algorithms.
Information 16 00570 g013
Figure 14. Performance Curves of Different Models.
Information 16 00570 g014
Figure 15. Segmentation effect diagram: (a) Original image; (b) YOLO11 model; (c) Improved YOLO11 model. red boxes highlight defect regions.
Information 16 00570 g015
Figure 16. Heat map of the target detection after processing.
Information 16 00570 g016aInformation 16 00570 g016b
Figure 17. Segmentation effect diagram of Secondary phase detection.
Information 16 00570 g017
Figure 18. Uniformity Evaluation Results.
Information 16 00570 g018
Table 1. Equipment Configuration.
DeviceConfiguration Parameters
Operating SystemWin10
CPU ModelIntel(R) Core (TM) i7-14650HX 2.2 GHz
GPU ModelNVIDIA GeForce RTX 4060 Laptop GPU
RAM16 GB
Deep Learning FrameworkPyTorch 2.2.2 + CUDA 12.1 + cuDNN 8.8.1
Development EnvironmentPycharm 2020.1.1 x64
Table 2. Comparison of YOLO Algorithm Performance.
Model Recall (%) Precision (%) mAP (%) FPS GFLOPS Weight (MB)
YOLOv578.779.685.010225.914.5
YOLOv777.380.184.540141.976.3
YOLOv878.878.185.111542.923.9
YOLOv978.778.685.018368.6116.6
YOLO1178.679.385.520810.26.1
Table 3. Performance Comparison of Different Models.
ModelmAP/MIOU (%)FPSGFLOPSParameters (M)
U-Net86.221.5288.643.9
DeepLabV3+84.759.682.85.8
YOLO1185.520810.22.7
Table 4. Ablation Experiment.
ModulesPrecision (%)Recall (%)mAP (%)Params (M)FPSGFLOPSWeight (MB)
EIEMC2CGAGDFPN
79.378.685.52.8320810.26.1
81.280.586.92.7927010.46.0
78.679.485.52.8130310.26.1
81.880.286.73.9930312.48.4
82.680.788.12.7725610.46.0
82.180.387.03.9729412.48.4
82.781.388.33.9417812.28.3
84.681.089.03.9125612.28.3
Disclaimer/Publisher’s Note: The statements, opinions and data contained in all publications are solely those of the individual author(s) and contributor(s) and not of MDPI and/or the editor(s). MDPI and/or the editor(s) disclaim responsibility for any injury to people or property resulting from any ideas, methods, instructions or products referred to in the content.

