Article

Being (Not) Successful in Internationalisation After Receiving Export Support: Which Predictors Are Able to Forecast It and How Accurately?

School of Economics and Business Administration, University of Tartu, 51009 Tartu, Estonia
*
Author to whom correspondence should be addressed.
Information 2025, 16(7), 544; https://doi.org/10.3390/info16070544
Submission received: 10 April 2025 / Revised: 11 June 2025 / Accepted: 23 June 2025 / Published: 27 June 2025
(This article belongs to the Special Issue Data-Driven Decision-Making in Intelligent Systems)

Abstract

This paper aims to outline which predictors are able to forecast being (not) successful in internationalisation after receiving export support and how accurately they can perform this task. Using data on export grant recipients from an Estonian export support programme, 15 theoretically motivated predictors grouped into four domains are used to forecast 24 different proxies of (non-)success with logistic regression and neural networks. The domains focus on firms’ general characteristics, earlier financial and export performance, and export-grant-specific characteristics. The highest areas under the curve exceed the 0.9 threshold, therefore indicating excellent predictive abilities, while more specific (non-)success proxies can be predicted less accurately than general ones. Predictors portraying firm size and export support size emerge as the best in the case of both methods, while in different neural networks, at least one predictor from each of the four domains is among the most important ones. These results lead to multiple practical implications concerning how to select firms into export grant programmes.

1. Introduction

Many countries aim to encourage firms to enter foreign markets and achieve a high export performance. Different tools are implemented for this purpose, such as providing information about potential foreign markets, partners, or customers, offering training on export activities, helping to create contacts with foreign partners or customers, and insuring foreign trade operations [1,2]. One of the most well-known measures is the provision of direct export support in the form of grants to companies. Such grants are meant to support a wide array of international marketing activities, such as participation in trade fairs, finding specific co-operation partners (such as resellers or customers) abroad, and adjusting goods to target markets’ requirements [3]. Therefore, for public export grant providers, it is vital to have tools for selecting firms in the case of which such grants would provide the largest effect, and as a result, enable obtaining the highest rate of return for public funds [4].
In the extant literature, focus on export support grants is widely popular, with some topics being elaborately addressed: for instance, the characteristics of various countries’ export promotion programmes and their efficiency in achieving their main goals—export initiation, export increase, and/or export survival [1,2,5,6]. Still, the abundant literature on the topic so far lacks a detailed analysis of the characteristics of firms that become (un)successful in their post-grant export performance [7,8]. Therefore, this paper aims to outline the predictors of (non-)success in internationalisation and their prediction accuracies by implementing a holistic view of what (non-)success is. By doing this, the paper directly contributes to fulfilling several research gaps concerning export support grant inputs and outputs indicated in an extensive recent literature review on export promotion programmes by Freixanet [1]. For instance, it shows what the exact roles of a firm’s own resources and capabilities and the obtained grant (i.e., different inputs) are in determining (non-)success and how the latter manifests when different types of (non-)success are considered in a lengthy timeframe (i.e., different outputs). Moreover, as the review by Freixanet [1] demonstrates, the extant research is dominated by firm-level studies outlining the effects of grants, rather than providing evidence (also by incorporating machine learning) of the predictors of (non-)success after obtaining such a grant and their prediction accuracies.
By using data on grant recipients from an Estonian export support programme, this paper longitudinally tracks their post-grant internationalisation performance over seven years. The dependent variables include various individual and complex (combined) export performance indicators, with firm survival as the most universal proxy of success. The theoretically motivated predictors are categorised into four pools of variables known at the grant provision, namely (1) the firms’ general characteristics, (2) their earlier export performance, (3) their financial performance, and (4) the characteristics of the provided grant. Logistic regression and neural networks are implemented to outline the behaviour and accuracies of predictors. The theoretical contribution of the paper emerges from determining whether the variables behave according to expectations, while the practical implication emerges from establishing how accurately (non-)success after export grant provision can be predicted.
The paper is structured in a classical way. First, the theoretical background of different variables in predicting (non-)success after export grant provision is outlined. Then, the study design’s part focuses on the dataset and methods implemented. Thereafter, the main results—including theoretical and practical discussion—are presented, and the paper is finalised with a conclusion part including the study’s limitations and future research directions.

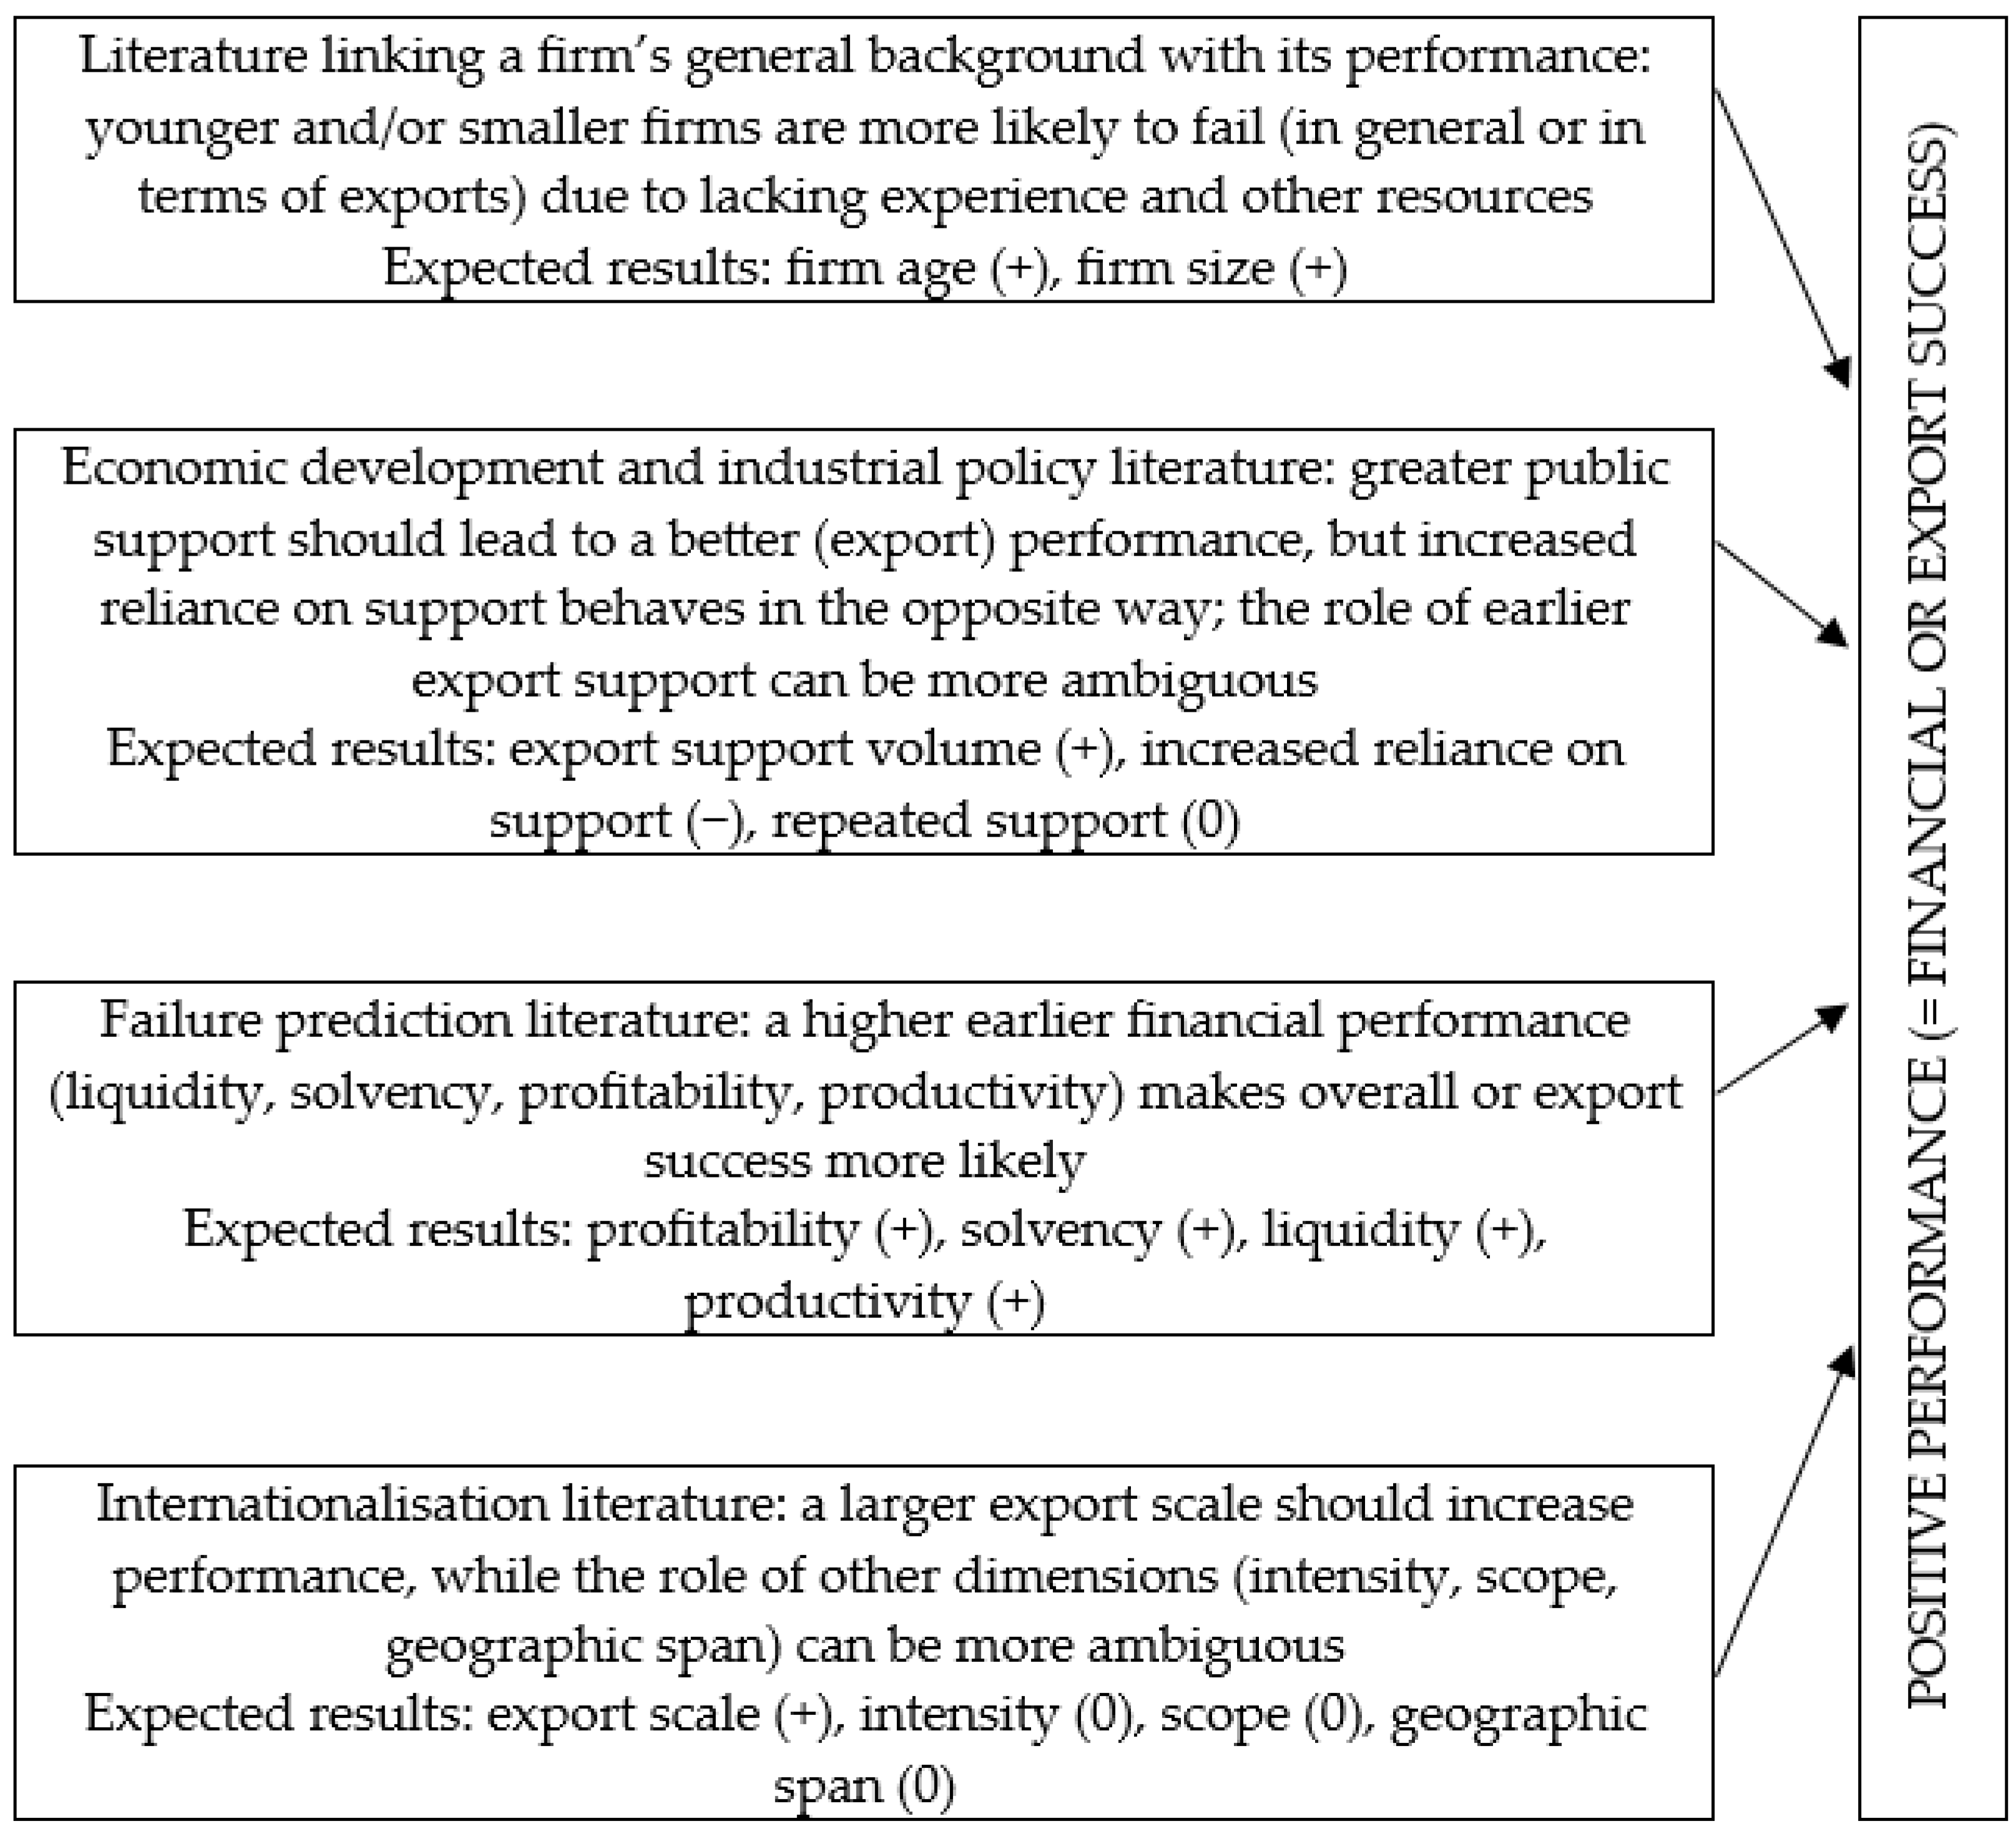
2. Theoretical Background

This paper is based on a multi-faceted theoretical framework to set expectations concerning (non-)success after obtaining export support. As no specific theories focus on (un)successful grant implementers [1,4], a more general approach is taken by merging various streams of research related to the topic.
The first pillar in this framework is the literature linking a firm’s general background with its future performance. In this line, two theoretical concepts stand out, namely the liabilities of smallness and newness [9]. The cornerstone of these concepts is that younger and/or smaller firms are more likely to be subject to failure [10]. The main weakness of new firms is having less experience compared to their adolescent or older counterparts [11]. Concerning exporting, older firms are more likely to have export experience, as, for instance, firms that enter several markets soon after establishment are relatively rare [12,13]. Small firms are usually more resource-constrained when compared to larger companies [14,15], and, due to that, they are less likely to hire export managers [16]. Therefore, with an increase in a firm’s age and size, its export success is likely to increase. The classical weaknesses of older or larger firms, namely a greater reliance on routines for the former and rigid administrative structures for the latter, might also play a role [17,18], though presumably not enough to diminish the positive effects of their age and size.
Economic development and industrial policy studies focus on various forms of support provided to firms, including grants [19,20], while export support programs have obtained remarkable research attention [1]. Generally, greater public support, especially when provided to smaller financially constrained firms, should, ceteris paribus, lead to greater survival chances and a higher likelihood of at least sustaining an earlier export performance [21]. This is also in accordance with the theoretical notion of overcoming financial constraints to be(come) a successful exporter [22]. While the latter relationship is rather straightforward, the impact of receiving export support multiple times might be more ambiguous, as different types of firms could be subject to repetitive public grant funding. In one extreme, there are successful firms, which create a large rate of return for public funding by quickly finding new markets or expanding on existing ones [23]. In the other extreme, there are support-dependent firms, often referred to as zombie firms, which are not able to exist without public support [24]. Therefore, the behaviour of this variable can be largely dependent on the share of different types of recipients in the population, and, thus, such a predictor might be insignificant. Finally, the proportion of the provided grant in a firm’s available slack resources is important [25]. The larger the latter in relation to the former, the easier it is to provide additional funding for a foreign enlargement project and continue it even after the original endeavour [26]. Therefore, an inverse relationship would be expected between the respective ratio and export success.
Since early studies (e.g., [27]) in the failure prediction literature, certain financial performance ratios have been proven valuable for forecasting the future fate of a company. As exemplified by topical literature reviews, firms’ liquidity, solvency, profitability, and productivity are the usual predictors [28], with an increase in these values making success or survival more likely. Specifically concerning exporting firms, a recent empirically validated theoretical concept by Lukason and Vissak [29] indicated liquidity and solvency to be the most crucial, with profitability having a smaller role and productivity being rather irrelevant in the case of ceasing export activities through bankruptcy. This result supports studies according to which overcoming financial constraints is important for becoming and persisting as an exporter, while higher productivity has been (besides liquidity and solvency) noted as a major prerequisite of export success [30,31].
In the internationalisation literature, three main dimensions of exporting are usually applied, namely scale (volume of exports), intensity (share of export sales from total sales), and scope (number of foreign markets), while some studies also focus on activities outside firms’ home continent [32]. For novice or young exporters, it is likely that all these dimensions will witness growth with or without export support [3], but foreign market exits are also common [33]. However, in the case of adolescent or mature exporters, these dimensions might behave differently [34]. For instance, some firms could aim to increase their export revenues, but if they have already found suitable target markets, they might neglect some less relevant ones to expand further in the most attractive countries [35]. As such an enlargement might not happen overnight, there can be a temporary rise in domestic revenues, especially if the indicated enlargement encompasses a substantial increase in production capabilities [36]. Therefore, an earlier, larger export scale is expected to increase export success, while concerning intensity, scope, and being operational outside the home continent, success can be more dependent on who the average grant recipient is, and, thus, these predictors might be insignificant. The literature review with the respective expectations concerning the behaviour of different dimensions is summarised in Figure 1.

3. Study Design

This paper focuses on the grant recipients of an export development programme that came into force on 1 November 2010 and was administered by the public institution Enterprise Estonia (currently, the Estonian Business and Innovation Agency), which provides support to enhance entrepreneurship. The programme’s main objective was to increase Estonian companies’ competitiveness in foreign markets, with a specific focus on increasing their (a) export sales, (b) share of high-value-added products and services among export sales, and (c) entrance to new export markets. The maximum amount of support was about 160 thousand EUR per company.
In total, 335 projects were supported by the programme, while some firms received support several times. In the latter case, only the later support episode is considered in the analysis. The main source of information for this study is firms’ annual reports, which include financial information and detailed export information in their appendix. This appendix was not compulsory for smaller firms and even many larger ones left markets unreported (for certain years). Therefore, the final dataset includes 200 unique firms that received export support and have all the necessary data for the follow-up analysis. These firms are largely dispersed over different sectors, as 50 different NACE classes are present, resulting in an average of four firms per class. The earliest project started in December 2010, while the last projects ended in January 2015. The projects were given a maximum of two years, and most of the firms chose that period.
The different dependent variables of this study encompass various proxies of (non-)success in exporting after receiving the aforementioned support. First, we consider four different periods after receiving export support. The first, denoted with “0”, refers to the final implementation year of the project. The three other periods, respectively, refer to the first (“1”), fourth (“4”), and seventh (“7”) post-implementation year. Therefore, the paper systematically focuses on a longitudinal period after receiving export support. The variables for those periods indicate whether a firm at least sustained its export scale (export turnover; “SC”), intensity (share of export sales from total sales; “INT”), or scope (number of export markets; “SP”). Besides these three individual variables, a complex variable (“C”) is created to encompass sustaining these three dimensions simultaneously.
While the latter variables focus on individual periods, in order to enhance the dynamic analysis, an additional set of dependent variables is created, where the maintenance of a specific exporting or complex variable should be achieved for all four periods (i.e., “0”, “1”, “4”, and “7”). This is noted with the suffix “ALL”, and therefore, the variables are, respectively, named “SCALL”, “INTALL”, “SPALL”, and “CALL”. Finally, for periods “4” and “7”, two additional dependent variables are created, indicating whether a firm had no export revenues (denoted as “EXPEXIT”) or no sales revenue at all (denoted as “EXIT”). These variables are coded for only two periods (i.e., “4” and “7”), as the occurrence of such severe failure is very unlikely immediately after receiving export support. All dependent variables take a binary form, where a value of “0” denotes being unsuccessful, while a value of “1” denotes the opposite. In summary, these 24 dependent variables enable obtaining a holistic picture of the predictors of being (un)successful in exporting after receiving export support and their prediction accuracies. Table 1 documents the frequencies of different proxies of (non-)success for the 200 studied firms.
Based on the theoretical background, this paper utilises 15 different predictors (independent variables) to forecast different forms of (non-)success in exporting. The respective predictors either directly rely on those covered by the theoretical concepts or are proxies chosen to cover a phenomenon described in the literature as closely as possible. All these variables are calculated based on the information known at the moment of receiving export support. The first four predictors focus on each firm’s general characteristics, which are, respectively, its age (“AGE”), total assets (“SIZE1”), total sales (“SIZE2”), and number of employees (“SIZE3”). The usage of three predictors is based exactly on the European Union’s criteria to determine a firm’s size. The next four variables focus on each firm’s earlier export behaviour, and consider earlier export revenue (“SCALE”), share of export sales from total sales (“INT”), number of foreign markets (“SCOPE”), and existence of non-European markets in a binary form (“OUTEUR”). The former three variables portray the same phenomena as export scope, intensity, and scale as binary dependent variables focusing on future periods. As noted in the literature review, these three criteria are the most common proxies of internationalisation behaviour in the extant research, while the fourth one (activities outside Europe) has often been used to determine if a firm has achieved a high geographical spread [32].
Thereafter, three variables focus on the characteristics of export support, specifically considering its value (“SUP”), the ratio of export support and current assets (“SUPSHA”), and having obtained earlier export support in a binary form (“PREVSUP”). Based on the literature review by Freixanet [1], it is assumable that the size of such support (in this study, portrayed as both absolute and relative) and repetitive grant provision could influence the success of its implementation. Finally, four classical financial ratios characteristic of (non-)success prediction studies are calculated, specifically focusing on profitability (net income to total assets; “NITA”), solvency (total equity to total assets; “TETA”), liquidity (net working capital to total assets; “WCTA”), and productivity (total sales to total assets; “STA”). These variables directly rely on the theoretical concept by Lukason and Vissak [29] and are among the most frequently used financial predictors of (non-)success to date. Natural logarithm is applied on all variables originally having a very large range (i.e., total assets, sales revenue, export sales revenue, export support, and number of employees; all except the latter originally in euros), while values of <1 are replaced with zeros without applying natural logarithm. Other predictors with extreme values are winsorized to avoid abnormal observations affecting the predictions. Table 2 documents the independent variables and descriptive statistics.
As the literature on export grants is lacking prediction studies, this paper borrows support from a more general (non-)success prediction domain. Based on a profound recent review by Cheraghali and Molnár [37], logistic regression as a classical statistical tool and neural networks as a machine learning tool are among the most widely used methods in the literature. Therefore, these tools are chosen for this study as well, with their particulars being discussed as follows. First, logistic regressions with robust standard errors are composed with each dependent and independent variable individually. The latter provides a clear understanding how these predictors behave in forecasting (non-)success in exporting on a univariate basis. Considering these predictors individually is important, as high multicollinearity logically existent between many variables can otherwise hinder obtaining a correct understanding of their behaviour. In the second stage, logistic regressions are composed for each dependent variable by applying all predictors from each of the four domains. This enables outlining the comparative value of predictor domains.
In the final stage of the analysis, as machine learning usually leads to higher prediction accuracies than classical statistical tools [37], neural networks are used in predicting each of the dependent variables, with all predictors included. The predictive performance of the models is reflected with the area under the receiver operating characteristic curve (AUC), which is among the most common performance indicators of (non-)success prediction models [37]. According to Hosmer and Lemeshow [38], AUC ≥ 0.7 is acceptable, while an outstanding figure is AUC ≥ 0.9. Neural networks are used with a two-layered structure by splitting the sample into 70% training and 30% testing, while the AUCs from the latter are presented. Standardised variables are used as inputs, while in both layers, a sigmoid function is applied for activation and the number of units in both layers is determined automatically without applying custom values. As machine learning tools can result in different outcomes per each run, five neural networks for each dependent variable are composed, and the one with the highest AUC is chosen. In this final analysis stage, the minority and majority groups are equalised with the synthetic minority oversampling technique (SMOTE) to facilitate both sub-samples to be equally considered in the analysis. SMOTE is applied by repeating the minority group’s observations as long as their frequency is equal to the frequency of the majority group’s observations. Additionally, the importance of independent variables in neural networks is outlined for each dependent variable. This enables understanding which variables among the 15 applied are the most meaningful in predicting the outcome. Logistic regression is conducted in Stata 15 and neural networks are conducted in IBM SPSS Statistics 29. Except for the choices explained earlier, the default settings of the programmes are implemented.

4. Results and Discussion

In Table 3, the results from the individual logistic regression analyses are documented. In the table, “+” and “−” are marked only for those variables which have a p-value of < 0.05. As only a single variable is included in each of these models, the significance of the model also coincides with the variable’s significance. The “+” denotes that an increase in the independent variable’s value makes it more likely to be a successful exporter with respect to the dependent variable in the row, while “−” means the opposite.
Below, a synthesis of the individual behaviour of variables is provided by the domains they represent. Clearly, firms’ general characteristics matter the most as predictors. Out of all significant relationships, 41% emerge from that domain of predictors. An increase in the different proxies of firm size, and, to a smaller extent, of age, makes a firm more likely to be successful in exporting. This is coherent with the theoretical expectation, as based on the theories of the liabilities of smallness and newness [9], larger and older firms are less likely to fail [10]. That behaviour is especially visible in the case of the most severe dependents of (non-)success (i.e., EXPEXIT and EXIT), while also for several longitudinal variables covering the whole viewed period (i.e., SCALL and SPALL). As indicated in Table 3, when significant, a firm’s general characteristics rank among the best predictors based on their individual AUCs. Out of these variables, SIZE2, reflecting sales revenue, should be especially pointed out.
From the earlier export performance variables, SCALE and INT matter the most, while SCOPE and OUTEUR are, in turn, less relevant predictors. While the earlier larger export scale (SCALE) usually increases the chances of success, the opposite occurs with an earlier export intensity (INT), the former of which is a theorised relationship. A probable explanation here could be that it is quite easy to repeat earlier export revenue in nominal terms, while the opposite behaviour of intensity could be linked with the following aspects. Firms with an originally very high export intensity might start concentrating on specific markets with the help of export support, which, in turn, might lead to neglecting less relevant markets, and, therefore, the intensity drops [35]. Additionally, for larger expansion in the most relevant markets, firms might need to increase their production volume, but as expansion can take time, initially, much of this production volume could be temporarily directed to the domestic market, organically leading to a drop in intensity [36]. Still, SCALE and INT are often significant for different dependent variables, the former, for instance, in predicting EXIT and EXPEXIT, while the latter for the complex dependents (C0, C1, C4, and C7). SCOPE and OUTEUR behave the same way as INT, reducing success likelihood, which was not a theorised relationship, while the number of significant relationships is smaller than for the other two variables. The explanation concerning the behaviour of SCOPE and OUTEUR is the same as for INT: older firms likely try to focus on certain foreign markets they are already active in. This argument regarding firm age is supported by the fact that, based on Table 2, the average age of grant recipients is 10 years. Concerning AUCs, when earlier export performance variables are significant, they usually resemble the best predictors among all variables, with a certain disclaimer that then they are among the few predictors that are significant at all.
Concerning export support variables, the volume of support (SUP) is clearly the most beneficial predictor, being also the most frequently significant among all variables, while behaving according to the theoretical expectation, as its increase raises the success chances [21]. Logically, with a larger amount of support, a firm can implement more effective export enhancement activities. The share of export support to current assets (SUPSHA) behaves as expected in the opposite way, namely, larger values lead to non-success, especially for the most severe dependent variables. This theoretically points to the fact that such unsuccessful firms have limited slack resources of their own, potentially up to the point where they are fully dependent on support, such as certain types of start-up companies [24]. Obtaining previous export support (PREVSUP) is largely an insignificant predictor, as theorised earlier [23]. When the variable SUP is significant, its AUC is among the highest, while this is not valid for the severe dependents of (non-)success, where it is surpassed by many variables from other domains, reducing its accuracy ranking to a modest level.
Interestingly, the earlier financial behaviour of a company has almost no relevance to its post-support (non-)success in exporting. The exceptions are mostly the severest (non-)success definitions, indicating that less liquid and solvent firms are likely to fully cease earning export or sales revenue. For the latter case, profitability also plays a role. This finding clearly links to the stream of literature explaining successful exporting through the lens of lower or absent financial constraints [30,31], while more generally with the literature stream focused on predicting the failure (e.g., bankruptcy) of exporting firms [29]. In addition, as the aim of the grant provider is usually to select firms likely to be successful in their export endeavours, filtering firms with a relatively good financial performance might take place, and, therefore, most of them could be undistinguishably well performing. On the few occasions when the earlier financial performance variables are significant, their AUCs remain modest in comparison with other variables.
Table 4 extends the latter analysis by considering the value of different variable domains in predicting (non-)success. This is accomplished by calculating the AUCs of logistic regression prediction models inclusive of all variables from each of the four domains. Table 4 indicates a certain divergence from the earlier univariate prediction results. Namely, while general characteristics are the most useful for predicting the severest definitions (i.e., full or export exit), the earlier export behaviour variables have the largest predictive potential for more specific definitions. Therefore, the achievement of success in internationalisation can be in an intricate relationship with a firm’s earlier exporter type. Export support characteristics usually rank third, leaving the earlier financial performance variables last. Still, concerning the latter, they rank second for the complex variables reflecting the simultaneous achievement of an earlier export scale, scope, and intensity. This could indicate that such a complex achievement is characteristic of firms which have a high financial performance over multiple respective dimensions simultaneously.
Next, a synthesis of the behaviour of predictors based on different types of dependent variables is provided. The most severe dependent variables (EXPEXIT4, EXPEXIT7, EXIT4, and EXIT7) witness the largest number of significant predictors, with only one longitudinal variable (i.e., SPALL) reaching the same number of significant relationships. For the other longitudinal variables (SCALL, INTALL, and CALL), the number of significant predictors remains more modest. For other dependent variables from different periods (SC, INT, SP, and C), the number of significant relationships is also quite small, although in the case of later periods of SC and INT, the number is clearly larger than that for earlier ones. For dependents with a small number of significant relationships, the latter usually originate among firms’ general characteristics or export support variables, while to a lesser extent (except for the complex dependent variables) from the earlier export performance domain. In these circumstances, financial predictors almost do not play any role. A consolidative narrative is composed and presented in Table 5, which summarises the findings concerning the behaviour of predictors by types of dependents. Rather than focusing on each dependent and independent variable individually, the aim is to provide a more general understanding. The respective narrative is tempted by the fact that the co-behaviour of variables from a certain domain can have an impact on their usefulness in predicting (non-)success in internationalisation, which was discussed earlier and is also outlined in Table 5.
Table 6 presents the AUCs for all dependent variables applied in this study, which are achieved by including all 15 predictors in neural networks. The four most severe failure definitions (EXPEXIT4, EXPEXIT7, EXIT4, and EXIT7) and the longitudinal complex non-achievement of export results (CALL) can be predicted with an almost ideal accuracy, with the AUC exceeding 0.95 for each of them. Generally, the specific (non-)success in exporting closer to support can be predicted more accurately than the more distant one, while longitudinal (non-)success is often more accurately predictable than that of single periods. The opposite to specific indicators occurs in the case of complex ones, i.e., for them, later success is more accurately predictable. The best AUCs in the case of each of the specific dependents are near to 0.9, while in the worst scenario, they are near to 0.7. Therefore, it can be generalised that the more detailed the export success dependent variables are, the more volatile the prediction accuracy can be, while the accuracy of such predictions is dependent on the exact time horizon as well.
The behaviour of predictors based on their normalised importance (NoIm) provides a supplement to the results when compared with their univariate behaviour in the logistic regression analysis in Table 3 and the behaviour of variable domains in prediction outlined in Table 4. A firm’s general background variables (specifically SIZE1, SIZE2, and SIZE3) are the most important predictors (NoIm = 100) in exactly half of the models, while SIZE2, reflecting the natural logarithm of total sales revenue, is the most useful out of all predictors (based on NoIm > 75 level), and SIZE1 and SIZE3 rank among the six best predictors based on the same NoIm level. Each of the other three domains provides one valuable predictor among the six best ones (based on NoIm > 75), specifically an earlier number of export markets (SCOPE), earlier profitability (NITA), and the size of export support (SUP). Still, the nature and number of important predictors can vary considerably for different dependent variables, as the number of predictors with NoIm > 75 ranges from one to seven over different models, with the median being two. Therefore, generally only a few variables matter in the neural networks.
The results concerning the variables’ importance indicate a clear nonlinearity in their behaviour, meaning that certain variables, despite their individual insignificance in logistic regressions, can play a (large) role jointly with other variables. While SIZE1, SIZE2, SIZE3, and SUP emerged earlier as individually highly important, the supplementation of NITA and SCOPE among the important predictors in neural networks could be an indication of different aspects. First, firms with a similar turnover but with a different number of export markets can behave differently. This could logically be explained by the fact that those with a very small number of markets are likely candidates to use export support for increasing their scope, while those with an earlier large number might want to use it to enlarge their activities in current important markets, probably at the expense of neglecting earlier unimportant ones. The latter is not merely a theoretical assumption, as two thirds of firms operating in zero or one foreign market sustain or increase their scope, while the scope for the remaining firms operating in more markets is in a clear downfall in the longitudinal horizon. This controversial behaviour is also potentially the reason why SCOPE is largely insignificant in the earlier Table 3 covering the significant variables in the logistic regression, as the latter method does not capture the respective nonlinear behaviour. Profitability might serve as a moderating variable for SUP and SIZE. It could indicate how likely a firm is to accomplish export plans with the same amount of support in the same size class, as greater profitability usually means larger slack resources, because it portrays the speed of the increase or decrease in the classical financial constraint solvency [29].
The paper leads to important implications for governmental agencies aiming to build automated systems to predict which firms will be successful exporters after obtaining public grants to enhance exporting. First, remaining functional overall or as an exporter is generally easier to predict than some more specific variables portraying export (non-)success. Although not fully generalisable, sustaining success in a longitudinal horizon might be easier to predict than achieving it within a certain specific timeline (including for multiple performance measures simultaneously). In addition, (non-)success portrayed with specific export performance measures can be more accurately predicted in a shorter time horizon. Although 15 different predictors were applied in this study, the usage of only a limited number of them is suggested. Based on the results from neural networks, the likely candidates for this purpose include different proxies of firm size, number of earlier export markets, profitability, and also the size of export support. Concerning the latter variable, for a grant provider, it is also possible to act in a way that, when the former three variables indicate a high likelihood of success, the amount of export support can be adjusted based on that information, so a high rate of return is potentially achieved from the allocation of public funds [21].

5. Conclusions

By applying data from one Estonian export grant programme, this paper aimed to outline the predictors of (non-)success in exporting after obtaining an export grant and their prediction accuracies. This was achieved by using 24 different proxies of (non-)success, 15 theoretically motivated predictors, and two methods (logistic regression and neural networks). In the case of dependent variables portraying severe forms of (non-)success, excellent accuracies were achieved, while in the case of several individual export performance measures as dependent variables, the predictions were (much) less accurate. Different proxies of firm size and amount of export support were beneficial predictors in both logistic regression and neural networks, while for the latter method, these two were supplemented by a firm’s earlier number of foreign markets and profitability. From a practical perspective, the paper outlined which post-grant provision export (non-)success proxies can be predicted highly accurately and with what variables this can be achieved.
The paper is subject to different limitations. It focused on a single export support programme from Estonia, which might hinder international applicability. Different export grants, even in the same country, can have very specific settings, while an additional question is, what are the exact selection processes for a firm to be eligible for support? For instance, a conservative grantor could select firms with a high likelihood of implementing the project, and, therefore, the emergent beneficial predictors might not be applicable to the general population of firms. Such a limitation might especially affect the usefulness of earlier financial performance indicators, when firms with weaker financial health will not receive export support. As the median recipient is an old micro firm, also bigger in the respective size category, the application of results to tiny start-up firms should be treated with caution as well.
Although the paper, on multiple occasions, achieved an excellent area under the curve with only 15 theoretically motivated variables, various additional predictors could be tested in future studies. This is especially important, as in the case of some dependent variables, the prediction accuracy was relatively weak. Potential candidates for enlarging the pool of predictors are various proxies of corporate governance, including earlier managerial behaviour, but also variables looking more explicitly into the actions planned when implementing an export grant. It is assumable that managers with an earlier lengthy track record of exporting and aiming at certain specific activities during new international enlargement could be more likely candidates to successfully implement such a grant. In addition, knowing the exact focus of the planned export activities would potentially enable to group firms into different pools, as presumably, different predictors could be beneficial when forecasting the success of increasing activities in current foreign markets or aiming to find new ones. Concerning the usage of different predictive tools, random forest as a collection of decision trees might potentially be the most promising, especially when firms with remarkably different backgrounds are included in the sample.

Author Contributions

Conceptualisation, O.L. and T.V.; methodology, O.L. and T.V.; formal analysis, O.L.; data curation, O.L.; writing—original draft preparation, O.L. and T.V.; writing—review and editing, O.L. and T.V. All authors have read and agreed to the published version of the manuscript.

Funding

This work was supported by the Estonian Research Council’s grant PRG1418 “Export(ers’) Performance in VUCA and Non-VUCA Environments”.

Institutional Review Board Statement

Not applicable.

Informed Consent Statement

Not applicable.

Data Availability Statement

The dataset applied in this article is not available because it was partly obtained from a third party not enabling redistribution.

Conflicts of Interest

The authors declare no conflicts of interest.

References

  1. Freixanet, J. Export promotion programs: A system-based systematic review and agenda for future research. J. World Bus. 2022, 57, 101344. [Google Scholar] [CrossRef]
  2. Heriqbaldi, U.; Esquivias, M.A.; Samudro, B.R.; Widodo, W. Do national export promotion programs in Indonesia support export competitiveness? Heliyon 2023, 9, e16918. [Google Scholar] [CrossRef] [PubMed]
  3. Kahiya, E.T. A problematization review of export assistance: Debates and future directions. Int. Bus. Rev. 2024, 33, 102202. [Google Scholar] [CrossRef]
  4. Heriqbaldi, U.; Esquivias, M.A.; Lau, W.; Cesilia, A.F. Export promotion programs and firm performance: Linking knowledge, commitment, and market strategy to enhance competitiveness. J. Open Innov. Technol. Mark. Complex. 2025, 11, 100479. [Google Scholar] [CrossRef]
  5. Jalali, H.S. Trade policy revisited: How government support initiatives affect international performance in SMEs? Rev. Int. Bus. Strategy 2024, 34, 692–712. [Google Scholar] [CrossRef]
  6. Jalali, H.S. Reframing government support for SMEs’ performance in international market: The critical role of institutional context. Asia-Pac. J. Bus. Adm. 2025, in press. [Google Scholar] [CrossRef]
  7. Coudounaris, D.N. Export promotion programmes for assisting SMEs. Rev. Int. Bus. Strategy 2018, 28, 77–109. [Google Scholar] [CrossRef]
  8. Demena, B.A. Does export promotion enhance firm-level intensive margin of exports? Evidence from a meta-regression analysis. J. Asian Bus. Econ. Stud. 2024, 31, 250–262. [Google Scholar] [CrossRef]
  9. Amankwah-Amoah, J. An integrative process model of organisational failure. J. Bus. Res. 2016, 69, 3388–3397. [Google Scholar] [CrossRef]
  10. Honjo, Y. Business failure of new firms: An empirical analysis using a multiplicative hazards model. Int. J. Ind. Organ. 2000, 18, 557–574. [Google Scholar] [CrossRef]
  11. Thornhill, S.; Amit, R. Learning about failure: Bankruptcy, firm age, and the resource-based view. Organ. Sci. 2003, 14, 497–509. [Google Scholar] [CrossRef]
  12. Aghazadeh, H.; Zandi, F. A typology of internationalisation patterns for SMEs in developing countries. J. Res. Mark. Entrep. 2022, 24, 337–364. [Google Scholar] [CrossRef]
  13. Vissak, T.; Masso, J. Export patterns: Typology development and application to Estonian data. Int. Bus. Rev. 2015, 24, 652–664. [Google Scholar] [CrossRef]
  14. Beck, T.; Demirgüç-Kunt, A.; Maksimovic, V. Financial and legal constraints to growth: Does firm size matter? J. Financ. 2005, 60, 137–177. [Google Scholar] [CrossRef]
  15. Esteve-Pérez, S.; Mañez-Castillejo, J.A. The resource-based theory of the firm and firm survival. Small Bus. Econ. 2008, 30, 231–249. [Google Scholar] [CrossRef]
  16. Vissak, T. A literature review on CEE firms’ outward internationalization failures: Definitions, processes, causes and consequences. Rev. Int. Bus. Strategy 2024, 34, 632–658. [Google Scholar] [CrossRef]
  17. Barroso, C.; Villegas, M.M.; Pérez-Calero, L. Board influence on a firm’s internationalization. Corp. Gov. Int. Rev. 2011, 19, 351–367. [Google Scholar] [CrossRef]
  18. Jiménez-Asenjo, N.; Filipescu, D.; Curran, L. Unpacking stimuli and barriers to internationalization across export stages: The case of Spanish wine firms in China. Thunderbird Int. Bus. Rev. 2024, 66, 429–446. [Google Scholar] [CrossRef]
  19. Flögel, F.; Letonja, M.; Meyer, K.; Rabadjieva, M.; Vilman, Z.; Zhekova, R.; Zlateva, M.; Butzin, A. Beyond start-up formation: Effects of entrepreneurial ecosystem support activities for developing lagging regions. Local Econ. 2024, 39, 127–146. [Google Scholar] [CrossRef]
  20. Pack, H.; Saggi, K. Is there a case for industrial policy? A critical survey. World Bank Res. Obs. 2006, 21, 267–297. [Google Scholar] [CrossRef]
  21. Zaman, M.; Tanewski, G. R&D investment, innovation, and export performance: An analysis of SME and large firms. J. Small Bus. Manag. 2024, 62, 3053–3086. [Google Scholar] [CrossRef]
  22. Chaney, T. Liquidity constrained exporters. J. Econ. Dyn. Control 2016, 72, 141–154. [Google Scholar] [CrossRef]
  23. Evans, P.C.; Oye, K.A. International competition: Conflict and cooperation in government export financing. In The Ex-Im Bank in the 21st Century: A New Approach? Hufbauer, G.C., Rodriguez, R.M., Eds.; Columbia University Press: New York, NY, USA, 2001; pp. 113–158. [Google Scholar]
  24. Nurmi, S.; Vanhala, J.; Virén, M. Are zombies for real? Evidence from zombie dynamics. Int. J. Ind. Organ. 2022, 85, 102888. [Google Scholar] [CrossRef]
  25. Wu, L.; Wei, Y.; Wang, C.; McDonald, F.; Han, X. The importance of institutional and financial resources for export performance associated with technological innovation. Technol. Forecast. Soc. Change 2022, 185, 122040. [Google Scholar] [CrossRef]
  26. Sui, S.; Baum, M. 2014. Internationalization strategy, firm resources and the survival of SMEs in the export market. J. Int. Bus. Stud. 2014, 45, 821–841. [Google Scholar] [CrossRef]
  27. Altman, E.I. Financial ratios, discriminant analysis and the prediction of corporate bankruptcy. J. Financ. 1968, 23, 589–609. [Google Scholar] [CrossRef]
  28. Bellovary, J.L.; Giacomino, D.E.; Akers, M.D. A review of bankruptcy prediction studies: 1930 to present. J. Financ. Educ. 2007, 33, 1–42. [Google Scholar]
  29. Lukason, O.; Vissak, T. Exporters’ failure predictors and processes: A multi-country analysis based on the theoretical concept of firms’ financial crisis types. Cogent Econ. Financ. 2024, 12, 2399957. [Google Scholar] [CrossRef]
  30. Askenazy, P.; Caldera, A.; Gaulier, G.; Irac, D. Financial constraints and foreign market entries or exits: Firm-level evidence from France. Rev. World Econ. 2015, 151, 231–253. [Google Scholar] [CrossRef]
  31. Görg, H.; Spaliara, M.-E. Financial health, exports and firm survival: Evidence from UK and French firms. Economica 2014, 81, 419–444. [Google Scholar] [CrossRef]
  32. Vissak, T. A literature review on CEE firms’ internationalization: Success measurement, achievement and outcomes. Rev. Int. Bus. Strategy 2023, 33, 740–762. [Google Scholar] [CrossRef]
  33. Fernandes, A.M.; Freund, C.; Pierola, M.D. Exporter behavior, country size and stage of development: Evidence from the exporter dynamics database. J. Dev. Econ. 2016, 119, 121–137. [Google Scholar] [CrossRef]
  34. Schueffel, P.; Baldegger, R.; Amann, W. Behavioral patterns in born-again global firms: Towards a conceptual framework of the internationalization activities of mature SMEs. Multinatl. Bus. Rev. 2014, 22, 418–441. [Google Scholar] [CrossRef]
  35. Freeman, S.; Vissak, T.; Nummela, N.; Trudgen, R. Do technology-focused fast internationalizers’ performance measures change as they mature? Int. Bus. Rev. 2023, 32, 102168. [Google Scholar] [CrossRef]
  36. Békés, G.; Muraközy, B. Temporary trade and heterogeneous firms. J. Int. Econ. 2012, 87, 232–246. [Google Scholar] [CrossRef]
  37. Cheraghali, H.; Molnár, P. SME default prediction: A systematic methodology-focused review. J. Small Bus. Manag. 2024, 62, 2847–2905. [Google Scholar] [CrossRef]
  38. Hosmer, D.W.; Lemeshow, S. Applied Logistic Regression, 2nd ed.; John Wiley & Sons Inc.: New York, NY, USA, 2004; 392p. [Google Scholar]
Figure 1. A summary of four literature streams with expected signs concerning specific dimensions portraying them in brackets (“+” meaning an increase making success more likely, “−“ less likely, and “0” not unambiguously determinable).
Information 16 00544 g001
Table 1. Dependent variables of the study.
Variable CodeVariable ContentNo. of Unsuccessful Firms (Value 0)No. of Successful Firms (Value 1)
EXIT4No sales revenue in the 4th year (=0)27173
EXIT7No sales revenue in the 7th year (=0)33167
EXPEXIT4No export sales in the 4th year (=0)35165
EXPEXIT7No export sales in the 7th year (=0)40160
SC0Not achieving earlier export scale in the 0th year (=0)59141
SC1Not achieving earlier export scale in the 1st year (=0)64136
SC4Not achieving earlier export scale in the 4th year (=0)77123
SC7Not achieving earlier export scale in the 7th year (=0)79121
INT0Not achieving earlier export intensity in the 0th year (=0)94106
INT1Not achieving earlier export intensity in the 1st year (=0)86114
INT4Not achieving earlier export intensity in the 4th year (=0)10595
INT7Not achieving earlier export intensity in the 7th year (=0)10793
SP0Not achieving earlier export scope in the 0th year (=0)55145
SP1Not achieving earlier export scope in the 1st year (=0)54146
SP4Not achieving earlier export scope in the 4th year (=0)78122
SP7Not achieving earlier export scope in the 7th year (=0)89111
C0Not achieving SC, INT, and SP together in the 0th year (=0)12278
C1Not achieving SC, INT, and SP together in the 1st year (=0)12080
C4Not achieving SC, INT, and SP together in the 4th year (=0)13268
C7Not achieving SC, INT, and SP together in the 7th year (=0)13664
SCALLNot achieving SC for the 0th, 1st, 4th, and 7th year (=0)11387
INTALLNot achieving INT for the 0th, 1st, 4th, and 7th year (=0)15050
SPALLNot achieving SP for the 0th, 1st, 4th, and 7th year (=0)11090
CALLNot achieving SC, INT and SP for the 0th, 1st, 4th, and 7th year (=0)16931
Note: 0th year is the final implementation year and 1, 4, and 7 denote the first, fourth, and seventh year after the implementation year.
Table 2. Independent variables of the study and descriptive statistics.
Variable CodeVariable Content (Expected Sign in Brackets)MeanS.D.MedianMin.Max.
General characteristics
AGEFirm age in years (“+”)10.04.910.90.817.1
SIZE1LN of total assets (“+”)14.11.714.27.918.3
SIZE2LN of sales revenue (“+”)14.22.614.50.018.8
SIZE3LN of number of employees (“+”)3.21.53.20.07.2
Earlier export performance
SCALELN of export sales revenue (“+”)12.64.313.90.018.3
INTExport share from sales (“0”)0.60.40.60.01.0
SCOPENumber of foreign markets (“0”)5.76.24.00.045.0
OUTEURAt least one market outside Europe (=1) (“0”)0.20.40.00.01.0
Export support characteristics
SUPLN of export support (“+”)9.91.110.26.212.0
SUPSHARatio of export support and current assets (“−”)0.10.20.00.01.0
PREVSUPObtained export support before (=1) (“0”)0.40.50.00.01.0
Earlier financial performance
NITARatio of net income and total assets (“+”)0.10.20.1−1.00.9
TETARatio of total equity and total assets (“+”)0.50.30.5−0.31.0
WCTARatio of net working capital to total assets (“+”)0.20.30.2−0.91.0
STARatio of sales to total assets (“+”)1.71.21.50.05.0
Notes: In the case where the original value is <1, LN is not applied and it is replaced with 0. Based on the coding of dependent variables, the expected sign “+” means that an increase in the value of the independent variable increases the likelihood that the respective firm is successful in internationalisation after receiving the grant, while “−” denotes the opposite. “0” means that the effect’s direction is not clearly determinable and might be very much dependent on which types of firms dominate the sample. The latter duality was discussed in the literature review part.
Table 3. Behaviour of predictors in single-variable logistic regressions (only p-value < 0.05 variables reported), with “+“ meaning an increase in a variable’s value making success more likely and “−” the opposite and ranking of those variables by AUC from the highest (smallest rank number) to the lowest (highest rank number).
Dependent (Row) and Independent (Column) Variable AGESIZE1SIZE2SIZE3SCALEINTSCOPEOUTEURSUPSUPSHAPREVSUPNITATETAWCTASTA# of “+” Sign# of “−” Sign
EXIT4+2+3+1+6+4 +11−5 +12+9+8 91
EXIT7+3+2+1+7+4 +10−8 +12+6+9 91
EXPEXIT4+3+5+1+6+2 +12−7 +8+9 81
EXPEXIT7+3+4+1+6+2+10 +11−7+12 +8+9 101
SC0 +1 10
SC1 +2 10
SC4+2 +4+1 +3 40
SC7+6+4+3+2+5 +1−9 61
INT0 +1 10
INT1 −1 01
INT4+6+4+3+1 −2 +5 51
INT7+7+4 +1 −2 −6 32
SP0 +5+3+8+1+2 +4 +670
SP1 +3 +1 +4 +240
SP4 +1+3 20
SP7+6+5+1+4 +3 50
C0 −1−2 02
C1 −3−1−2 03
C4 −1−2−3 03
C7 −1 −2 02
SCALL +3+4+2 +1 40
INTALL −1 −3+2 12
SPALL +5+2+4+1+6 +3−11+7+8 81
CALL −2−1 02
# of “+” sign9111313830016023442
# of “−” sign000029340600000
Notes: The last two rows and columns report how many variables increase (“+”) or decrease (“−“) the success likelihood. An empty cell refers that the variable is not significant at p < 0.05. The number behind the sign refers to the ranking of those variables based on the AUC of the logistic regression model, with “1” indicating the highest AUC and the larger numbers in an ascending order to the decrease of AUC. Some numbers in the rankings are missing from in between, as the larger p-value of a variable does not automatically mean a smaller AUC, while still an obvious negative correlation exists between them.
Table 4. Ranking of logistic regression models based on independent variable (predictor) domains (all variables from a specific domain included) based on AUC from highest (number 1) to lowest (number 4) with significance (“s”) of the model also outlined.
Dependent (Row) and Predictor Domain (Column)General CharacteristicsEarlier Export PerformanceExport Support CharacteristicsEarlier Financial Performance
RankAUCRankAUCRankAUCRankAUC
EXIT40.811 s0.742 s0.733 s0.704 s
EXIT70.771 s0.704 s0.703 s0.712 s
EXPEXIT40.781 s0.772 s0.683 s0.654
EXPEXIT70.771 s0.752 s0.693 s0.684 s
SC00.5840.5830.6210.592
SC10.5740.6020.5930.641
SC40.5830.651 s0.5820.504
SC70.6230.6320.661 s0.544
INT00.5640.6020.6010.603
INT10.5740.651 s0.5920.573
INT40.6020.631 s0.5730.524
INT70.6220.681 s0.5830.554
SP00.642 s0.691 s0.643 s0.614
SP10.6610.6620.6140.633 s
SP40.5820.6210.5830.574
SP70.6030.6120.611 s0.564
C00.5540.6110.5730.582
C10.5240.671 s0.5530.572
C40.5430.631 s0.5440.552
C70.5540.661 s0.5730.592
SCALL0.5730.6320.631 s0.534
INTALL0.5530.691 s0.6220.544
SPALL0.6330.6710.642 s0.574
CALL0.5620.681 s0.5530.524
Note: “s” behind the ranking denotes that the model is significant at p-value <0.05. For comparative purposes, the pseudo R2 for the highest AUC of 0.81 is 0.1986, while for the lowest AUC of 0.50 it is 0.0013.
Table 5. A synthesis of the predictors of export (non-)success after obtaining an export grant.
Type of DependentMain Results
Exiting export markets or ceasing all activities by the firm after receiving export supportFirms’ larger size and age, larger earlier export volume, better financial performance, more slack resources, and larger export support size increase success chances. The benefit of variable domains for prediction, in most cases, reduces in the following order: general characteristics, earlier export performance, export support characteristics, and earlier financial performance.
Not achieving an earlier export scale, intensity, or scope for certain periods after receiving export supportFirms’ larger size and age increase success chances, especially for later periods concerning the scale and intensity, while more universally for scope. Larger export support size increases success chances, while variables representing earlier export and financial performance are more irrelevant. In contrast to the latter, the earlier export performance variable domain inclusive of four predictors is often the most useful.
Not achieving all three export performance indicators simultaneously for certain periods after receiving export supportOnly earlier export performance variables are useful, while with an inverse relationship, their larger size reducing success chances. Linking to the previous finding, the earlier export performance variable domain inclusive of four predictors is the most useful. Only for this type of dependent, the earlier financial performance domain inclusive of four variables systematically obtains the second position.
Longitudinally not achieving single or all export performance indicators after receiving export supportLikewise with the previous simultaneous achievement dependent variables, an earlier export performance is mainly in an inverse relationship, but with much fewer significant relationships. Firms’ larger size and age, but also larger export support size, increase success chances. The domain of earlier export performance variables, followed by export support characteristics, emerge as the best predictor pools.
Table 6. Areas under the curve (AUC) and normalized importance (NoIm, %) of variables in the most accurate neural network model for each dependent variable.
AUC and Independent (Column) and Dependent (Row) VariablesAUC AGESIZE1SIZE2SIZE3SCALEINTSCOPEOUTEURSUPSUPSHAPREVSUPNITATETAWCTASTANoIm > 75 Frequency
EXIT40.96333721003349235330494116404355441
EXIT70.96237751004135254714481125295458391
EXPEXIT40.95952661005179328031632416625750383
EXPEXIT70.954547794444636100355544399610091596
SC00.89231100786272296324633131704775702
SC10.86438697761516333307232221004664342
SC40.74046100684068788224683229993768204
SC70.72945374649441767341002023532070271
INT00.74254334414454470165956151006145221
INT10.70521724544658817910025648111442
INT40.78331304196334026393924161002038172
INT70.73418502610051638452435210352827232
SP00.8704610091764734903285379503068375
SP10.90221451005443418727336218544236702
SP40.68742871004255189924343533604274243
SP70.71720337151323110040701125998955193
C00.747244936257136100171002723601335192
C10.78831794510044837455535722593964293
C40.78812436299100375116483414383138612
C70.88852728410031725968746634665049522
SCALL0.79436614975595327201002320565861201
INTALL0.91141819710076786357914638746681177
SPALL0.80138377436255710022412618982526172
CALL0.98939100406547817146825638716583594
NoIm > 75 frequency 08117351007007230
Notes: Normalized importances (NoIm) of >75% have been underlined to indicate which are the most important predictors in the case of each dependent variable or in how many occasions each of the predictors is highly important.
Disclaimer/Publisher’s Note: The statements, opinions and data contained in all publications are solely those of the individual author(s) and contributor(s) and not of MDPI and/or the editor(s). MDPI and/or the editor(s) disclaim responsibility for any injury to people or property resulting from any ideas, methods, instructions or products referred to in the content.

