Article

Opioid Crisis Detection in Social Media Discourse Using Deep Learning Approach

by
Muhammad Ahmad
1,
Grigori Sidorov
1,
Maaz Amjad
2,
Iqra Ameer
3 and
Ildar Batyrshin
1,*
1
Centro de Investigación en Computación, Instituto Politécnico Nacional (CIC-PN), Mexico City 07738, Mexico
2
Department of Computer Science, Texas Tech University, Lubbock, TX 79409, USA
3
Department of Computer Science, The Pennsylvania State University at Abington, Abington, PA 19001, USA
*
Author to whom correspondence should be addressed.
Information 2025, 16(7), 545; https://doi.org/10.3390/info16070545
Submission received: 6 November 2024 / Revised: 5 December 2024 / Accepted: 9 December 2024 / Published: 27 June 2025

Abstract

The opioid drug overdose death rate remains a significant public health crisis in the U.S., where an opioid epidemic has led to a dramatic rise in overdose deaths over the past two decades. Since 1999, opioids have been implicated in approximately 75% of the nearly one million drug-related deaths. Research indicates that the epidemic is caused by both over-prescribing and social and psychological determinants such as economic stability, hopelessness, and social isolation. Impeding this research is the lack of measurements of these social and psychological constructs at fine-grained spatial and temporal resolution. To address this issue, we sourced data from Reddit, where people share self-reported experiences with opioid substances, specifically using opioid drugs through different routes of administration. To achieve this objective, an opioid overdose dataset is created and manually annotated in binary and multi-classification, along with detailed annotation guidelines. In traditional manual investigations, the route of administration is determined solely through biological laboratory testing. This study investigates the efficacy of an automated tool leveraging natural language processing and transformer model, such as RoBERTa, to analyze patterns of substance use. By systematically examining these patterns, the model contributes to public health surveillance efforts, facilitating the identification of at-risk populations and informing the development of targeted interventions. This approach ultimately aims to enhance prevention and treatment strategies for opioid misuse through data-driven insights. The findings show that our proposed methodology achieved the highest cross-validation score of 93% for binary classification and 91% for multi-class classification, demonstrating performance improvements of 9.41% and 10.98%, respectively, over the baseline model (XGB, 85% in binary class and 81% in multi-class).

Graphical Abstract

1. Introduction

An overdose occurs when someone takes an excessive amount of opioids, surpassing their body’s safe limit, which can lead to life-threatening symptoms. Early detection of an opioid overdose is crucial for quick medical intervention and can help save a person’s life. The misuse of opioids has escalated into a significant health crisis in the United States over the last ten years [1]. People with poor mental health and chronic pain are often at risk of suicide. Since the beginning of the 21st century, nearly 400,000 Americans have lost their lives due to opioid overdose [2], and more than 115 people die daily from opioid overdoses [3]. Furthermore, it is estimated that over 2 million Americans are afflicted with substance use disorders stemming from prescription opioid pain relievers [4].
The patterns of risk [5] and associated behaviors among individuals who misuse opioids are not uniform. A better understanding of each individual’s specific risks and needs could help customize efforts to effectively address opioid crises [6]. Nevertheless, reaching illicit drug users, particularly those not receiving treatment, can be a challenge for research engagement. Social media offers a potential avenue for reaching these elusive populations [7]. However, the use of social media is a new strategy, with only a limited number of studies using it to target individuals who misuse opioids [8]. Recently, there has been a rapid epidemiological transition in overdose deaths in the U.S., shifting from those involving prescription opioids to heroin and now to potent synthetic opioids [9]. Illicitly manufactured synthetic opioids, particularly fentanyl and its analogs, are currently the most common class of drugs implicated in overdose deaths in the U.S. [10]. In the past, fentanyl was primarily used as a prescription medication in the form of patches or oral lozenges to manage persistent pain and as an injectable for pain relief during surgical operations [11,12,13]. Compared to other prescription opioids, it had notably lower rates of misuse [14] and did not significantly contribute to overall deaths from overdose. However, since 2013, there has been a significant and rapid increase in the presence of illicitly manufactured fentanyl in the U.S. illicit drug market. This surge has coincided with a sharp rise in overdose deaths involving synthetic opioids, particularly fentanyl [15,16,17].
Social media provide access to observational data sources that are potentially different from the data streams currently employed in public health surveillance. The pseudo-anonymous nature of these platforms can also encourage users to discuss stigmatized behaviors [18]. Another advantage of social media data is that many individuals are using these platforms to discuss their health and health-related issues [19].
One prominent platform for such discussions is Reddit, a social media platform where people can discuss a wide variety of topics. Each topic has its own subreddit for topic-specific content identified by a leading ‘r/’, where they can discuss various issues including sensitive issues, mental health [20], weight loss [21], gender issues [22], and substance abuse [23,24]. For example, ‘r/addiction’ is a subreddit where members support each other in battling addiction. Moreover, utilizing social media data that include geo-tagged information can be valuable in understanding the variations in opioid overdoses and deaths across different regions. Moreover, these data are free from expert bias, often reflecting first-hand user reports.
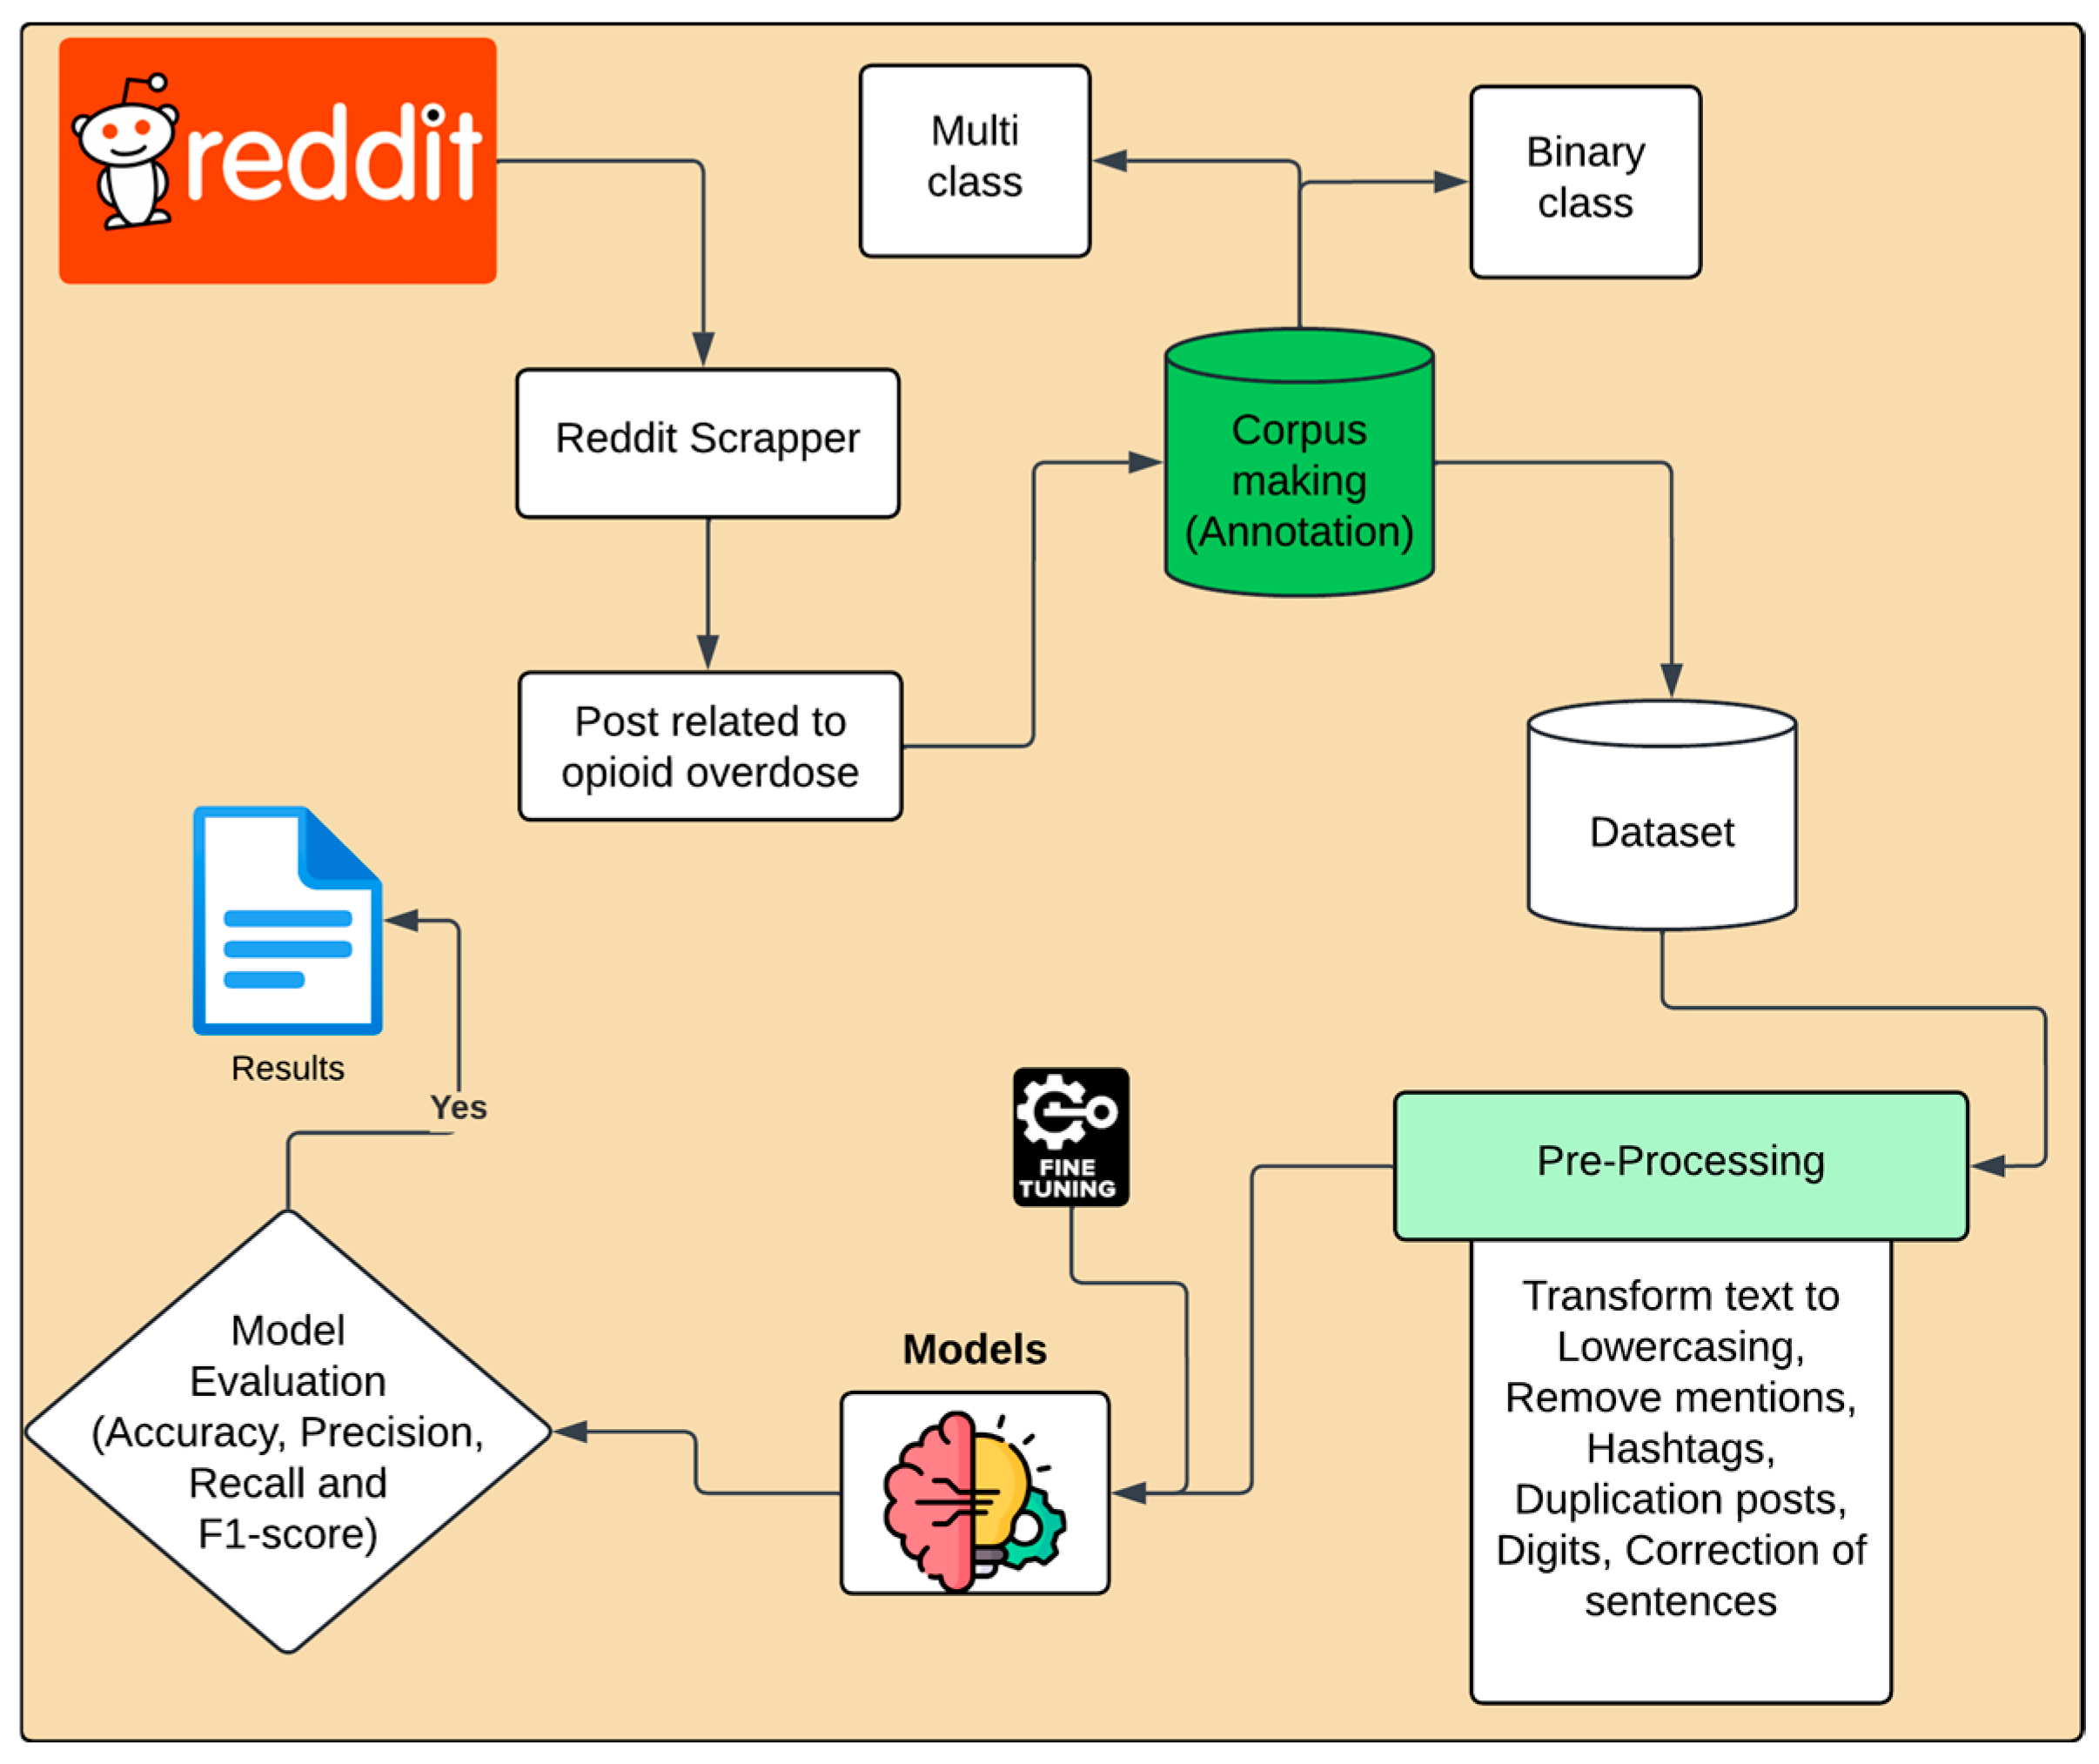
Most studies on opioid use and social media have focused on Twitter [25,
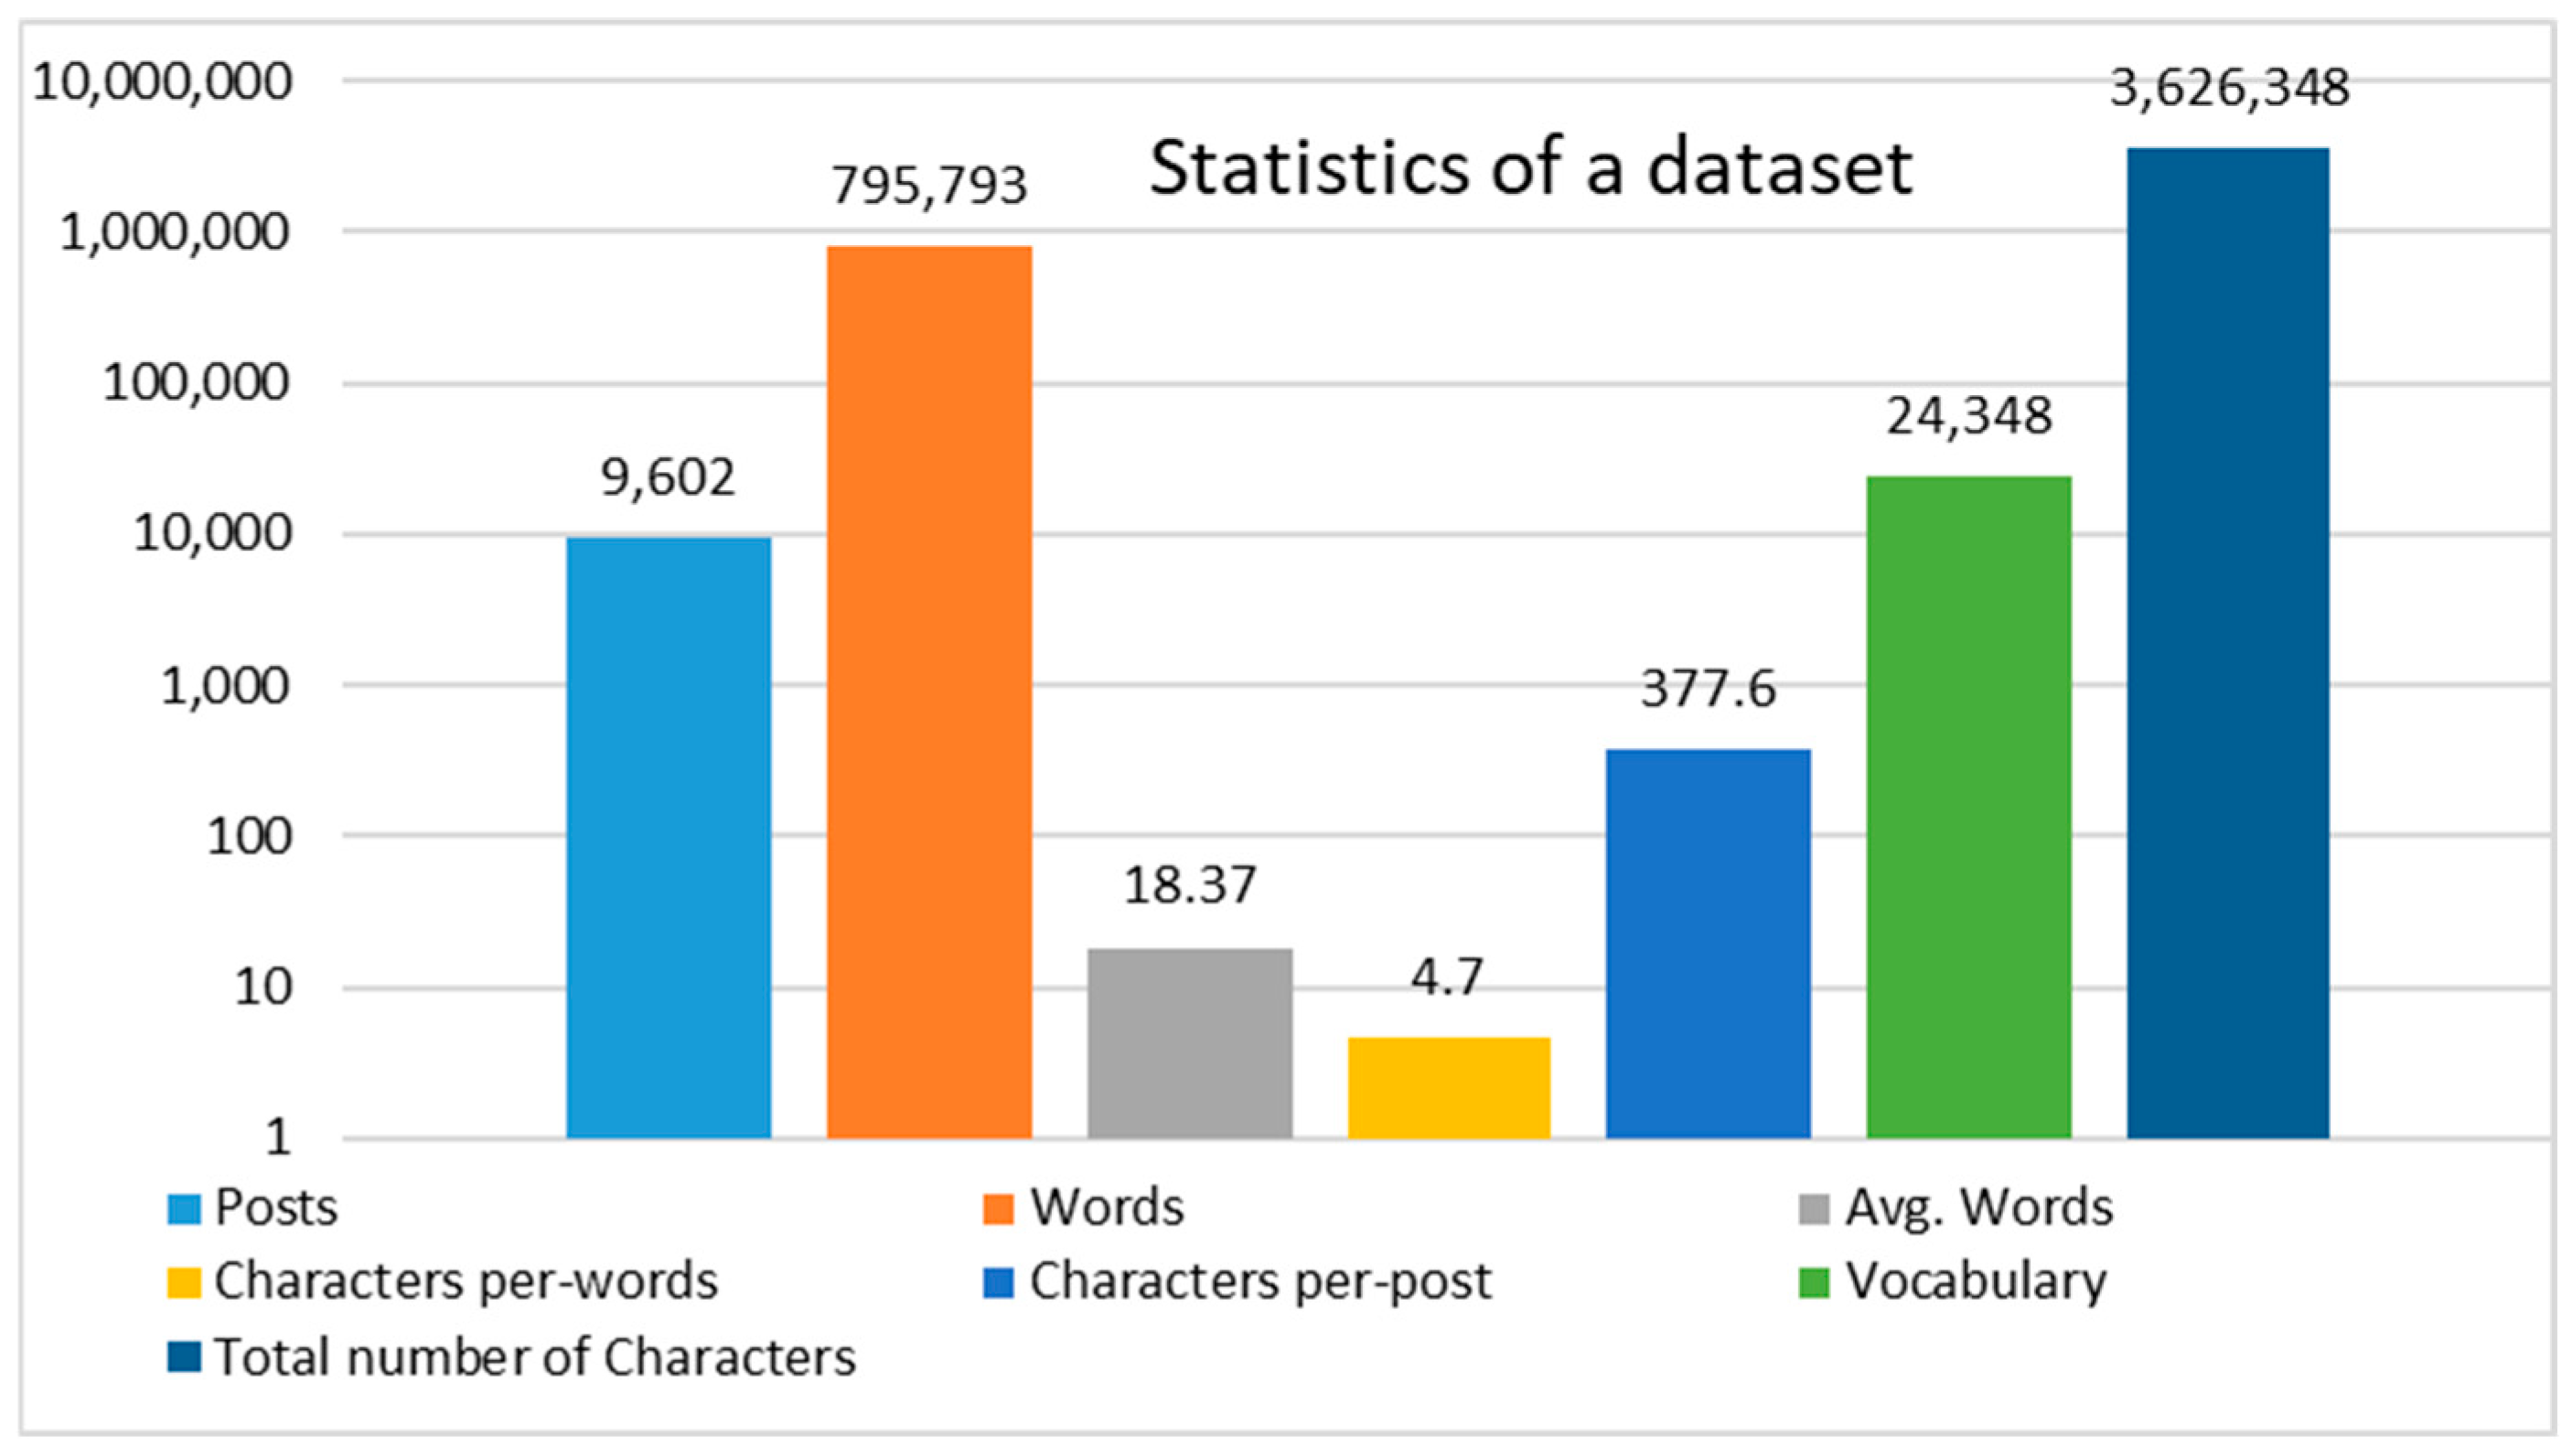
26]. However, the platform supports only 280 characters. This limit can restrict users from sharing information in a single post, which may make it difficult to express opioid overdose-related issues. In contrast, in this study, we developed a methodology utilizing a manually annotated dataset sourced from Reddit, which is the fifth most visited site in the U.S. and provides enough space for the user to express their self-reported experience related to a specific topic with a character limit of 40,000 for a text post. Thus, this dataset serves as a foundation for analyzing patterns of substance use and understanding user behaviors related to opioid consumption. To achieve this, the methodology encompasses the application of advanced natural language processing techniques and machine learning and deep learning models to extract meaningful insights from the textual data. Furthermore, the route of drug administration plays a significant role in determining health outcomes for users. It affects the likelihood of dependence and vulnerability to infections and can lead to health issues that may pose life-threatening risks. For example, smoking facilitates rapid absorption, leading to immediate effects on the lungs, and significantly increasing the risk of respiratory depression and potential death. Oral ingestion typically results in a slower onset, which can cause individuals to consume higher doses, ultimately leading to an overdose and severe liver damage. Intranasal also allows for quick absorption but can lead to nasal tissue damage, complicating further use and increasing the risk of overdose. Lastly, intravenous injection provides immediate effects but complicates dosage accuracy and is associated with severe risks, including life-threatening infections, such as HIV and hepatitis C. Therefore, to mitigate the risks associated with various routes of opioid administration, this study examines the efficacy of an automated tool leveraging natural language processing models, such as RoBERTa, to analyze patterns of substance use. By systematically examining these patterns, the model contributes to public health surveillance efforts, facilitating the identification of at-risk populations and informing the development of targeted interventions. Ultimately, this approach aims to enhance prevention and treatment strategies for opioid misuse through data-driven insights.
This study makes the following contributions:
We applied the schema to develop a comprehensive opioid overdose dataset for healthcare professionals, accurately annotated with high-quality labels able to identify high-risk behaviors and develop targeted interventions.
We propose, implement, and evaluate a transfer learning model designed to optimize the analysis of opioid overdose incidents based on social media data related to the opioid crisis, enhancing diagnostic accuracy and efficiency in identifying routes of administration, improving response strategies, and reducing reliance on human intervention through automated classification systems.
The tool was trained and tested using a comprehensive dataset of Reddit posts related to opioid overdose incidents, with binary classification indicating overdose (yes or no) and multi-class classification assessing the route of administration such as oral, intravenous, intranasal, smoking, and other classes.
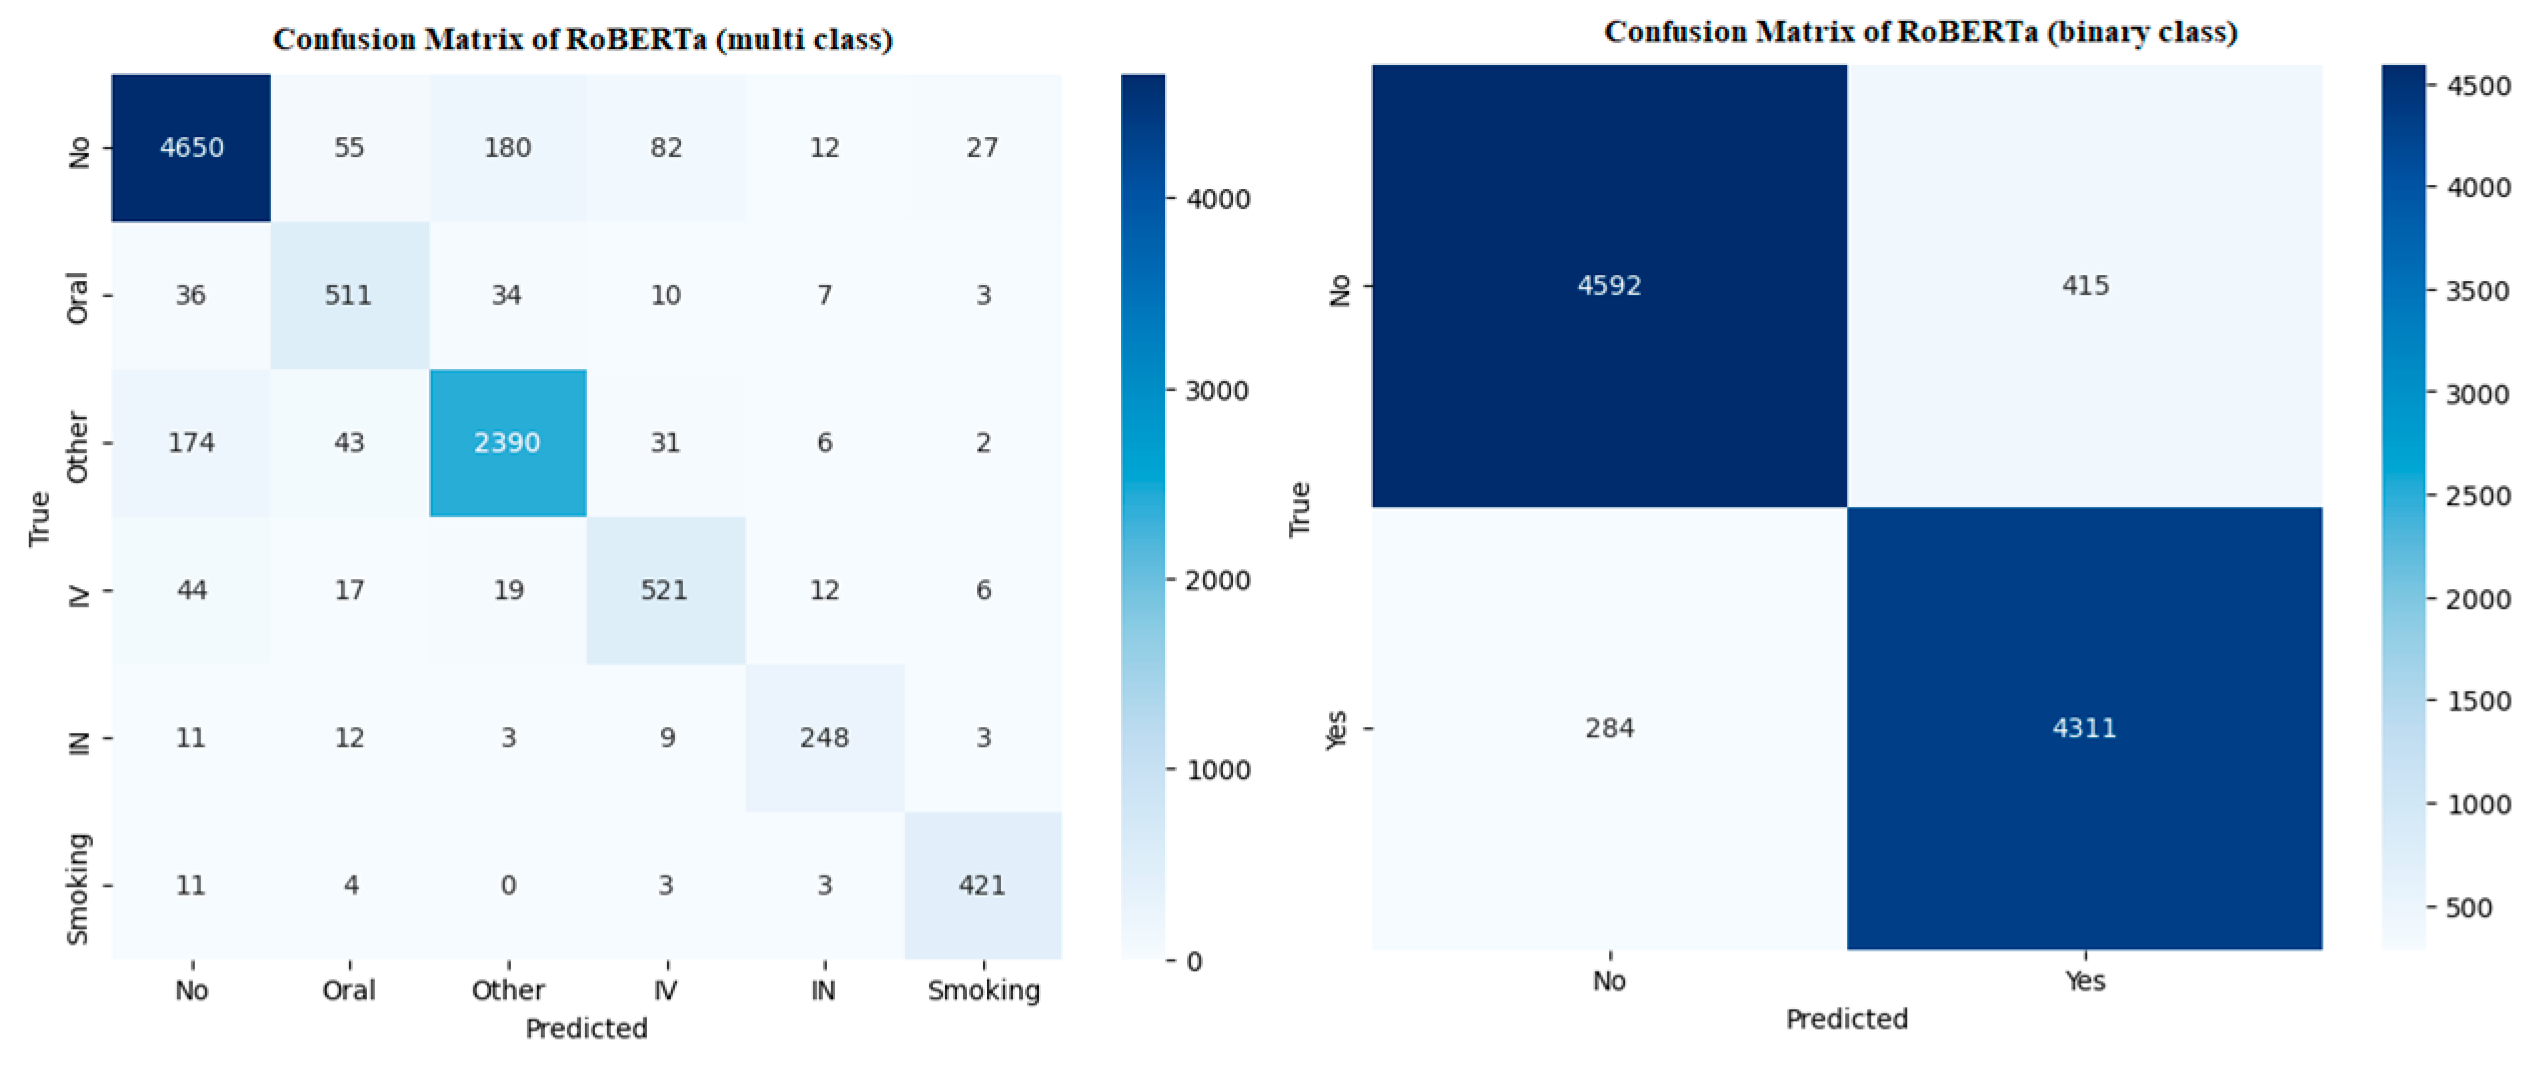
The proposed model (RoBERTa) achieved a 93% cross-validation score in binary classification and a 91% cross-validation score in multi-class classification, resulting in improvements of 9.41% and 10.98%, respectively, compared to traditional machine learning models.

Task Description

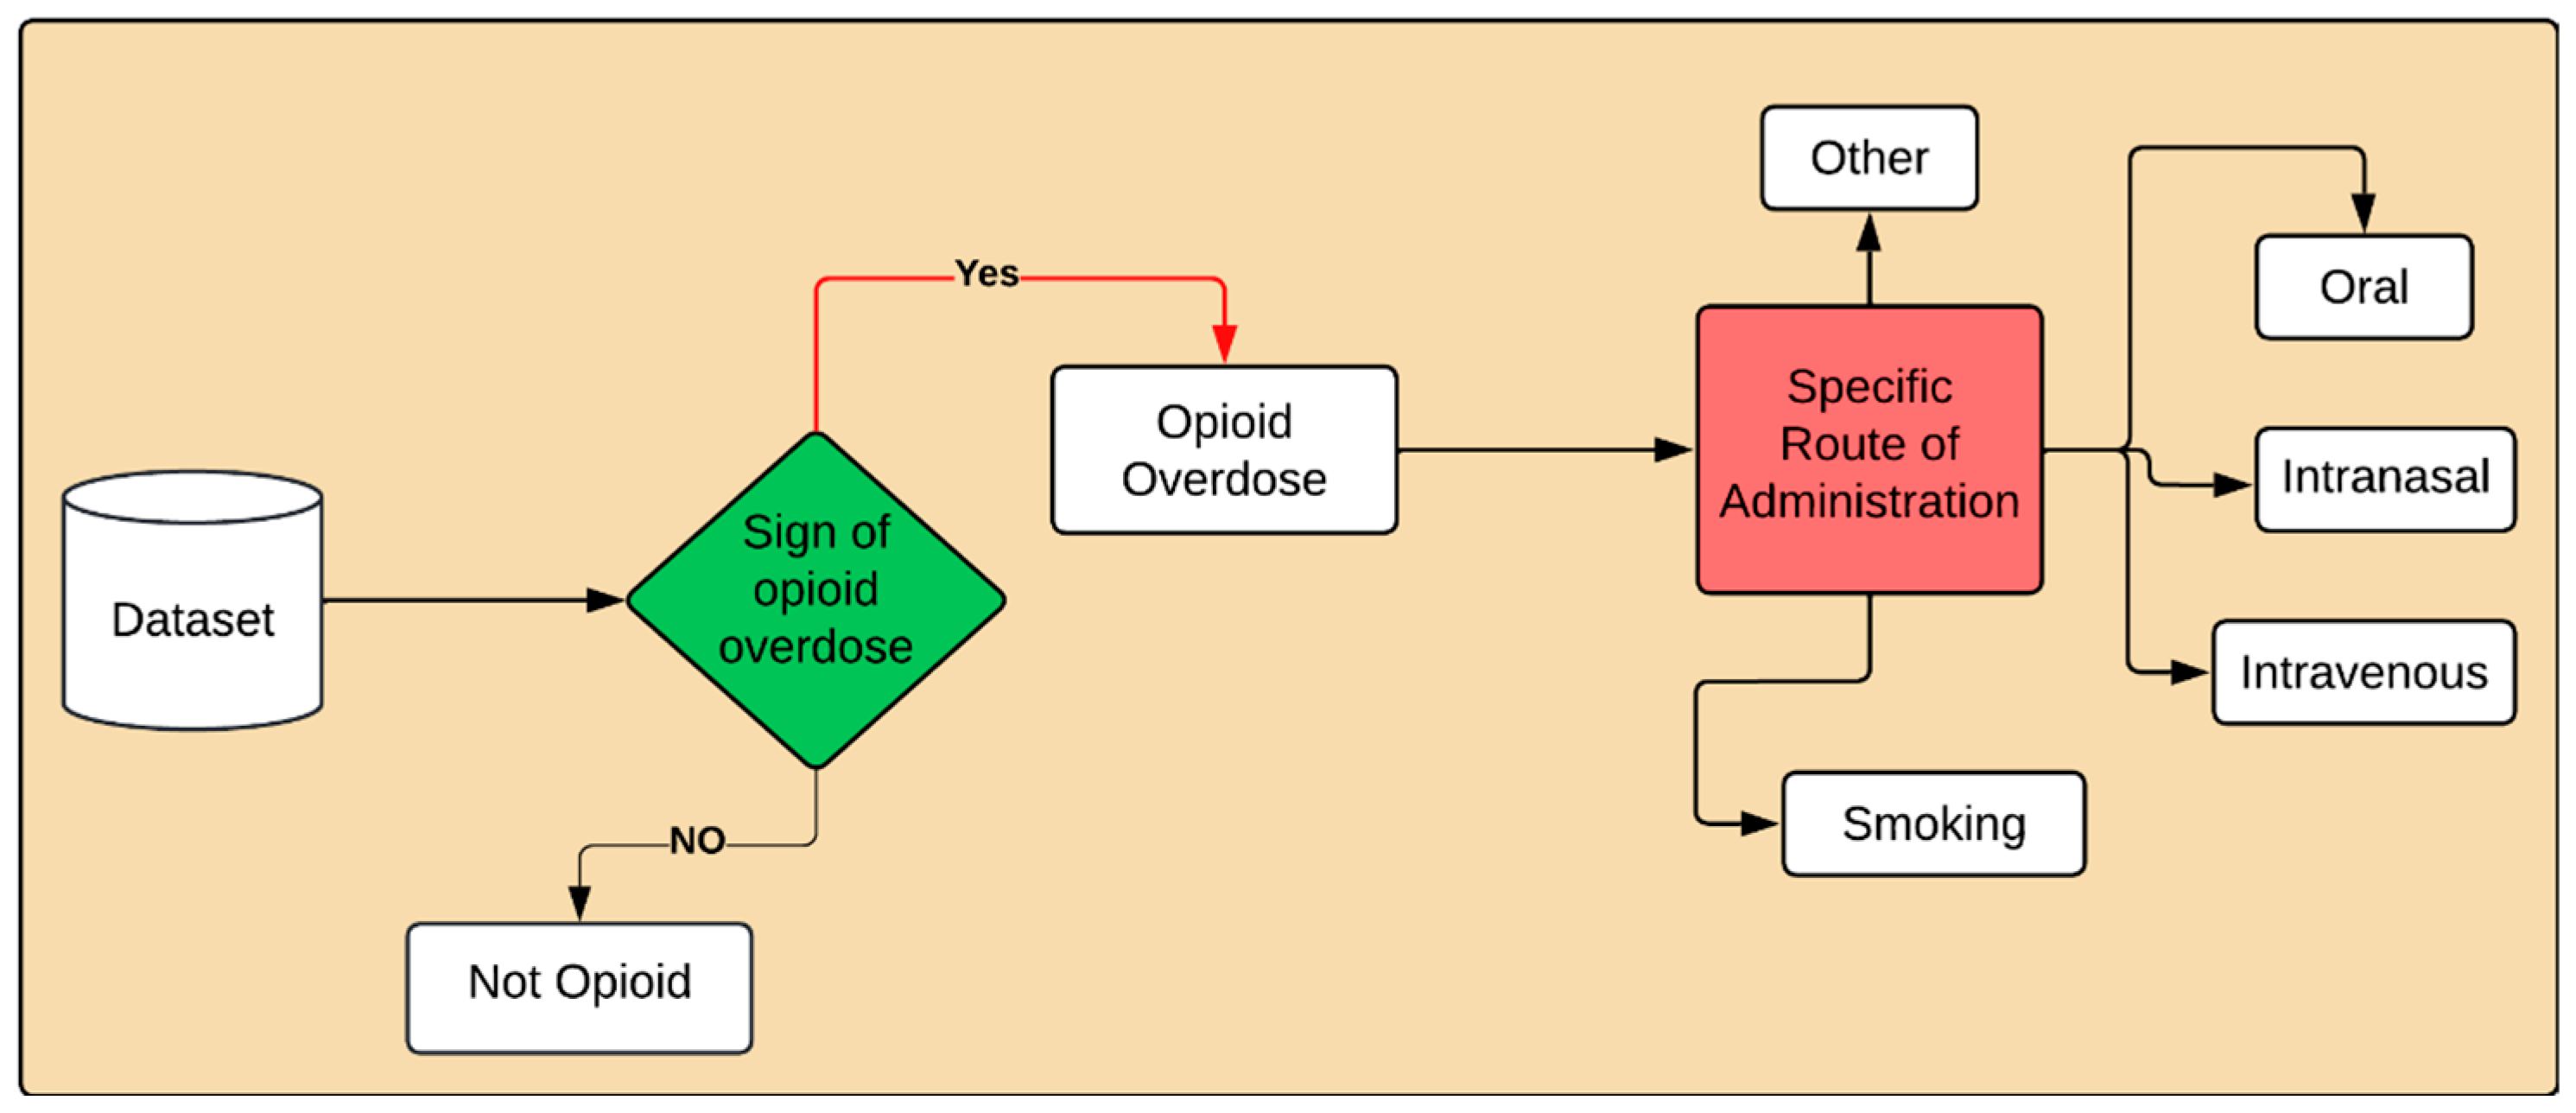
Task A—Binary Opioid Overdose Detection: In the binary classification task, each user post will be identified as either “Opioid overdose” or “Not Opioid overdose”.
Task B—Multi Class Opioid Overdose Detection: In this task, each user post will be classified into fine-grained opioid overdose categories: “Oral”, “Smoking”, “Intravenous”, “Intranasal”, and “other”, along with the Not opioid overdose class. We introduce an “Other” class for instances where the route of administration is not disclosed or is unknown. This class is designed to capture cases of opioid overdose where the specific method of substance use is not specified by the user.
The rest of the paper is organized as follows. Section 2 provides an overview of the related work. Section 3 discusses the proposed methodology. Section 4 covers the experimental setup. Finally, Section 5 concludes the paper and discusses the future work.

2. Literature Survey

Blackley et al. [27] developed an algorithm using a large clinical database from Mass General Brigham to identify Opioid Use Disorder (OUD) patients. Collaborating with an addiction psychiatrist, they devised hand-crafted rules and integrated them into a natural language processing (NLP) algorithm. This NLP-based classification achieved robust performance, with the best model achieving an F1-score of 0.97. The findings suggest the potential for the real-time identification of OUD patients in hospital settings.
Sarker et al. [28] addressed the notable lacuna in contemporary literature pertaining to the ramifications of the COVID-19 pandemic on individuals using opioids. Leveraging natural language processing (NLP), discourse from 14 opioid-related platforms on Reddit was meticulously analyzed, elucidating predominant themes encompassing opioid utilization, treatment accessibility, and withdrawal experiences. Through a comparative examination of data spanning pre-COVID-19 and COVID-19 epochs, a discernible escalation in dialogue concerning treatment access and withdrawal phenomena emerged. Particularly salient was the pronounced uptick in discussions pertaining to pharmacotherapeutic modalities for managing opioid use disorder, notably methadone. These findings collectively delineate the shifting landscape of concerns among opioid users during the pandemic, thereby accentuating the imperative for tailored interventions and support frameworks.
Wright et al. [29] underscore the challenge of promptly identifying emerging substances involved in overdoses through conventional public health data systems. By analyzing drug-related discussions on Reddit from 2011 to 2018 and employing diachronic word embeddings, a novel metric—the relative similarity ratio—was devised. Significantly, this metric facilitated the early detection of fentanyl as a notable emerging substance in overdose incidents, outpacing traditional surveillance methods by over a year. Such findings underscore the potential of innovative computational approaches to enhance the timeliness of preventive and therapeutic interventions in substance misuse epidemics.
Green et al. [30] developed and validated algorithms for the identification and classification of opioid overdoses, utilizing claims data and clinical text processed through natural language processing (NLP). Assessment within Kaiser Permanente Northwest (2008–2014) demonstrated robust performance, with code-based algorithms achieving notable sensitivity (97.2%) and specificity (84.6%) for opioid overdose detection, while NLP-enhanced algorithms exhibited enhanced sensitivity for suicide/attempts and abuse-related overdoses. These findings underscore the potential of NLP in improving the accuracy of algorithmic approaches in clinical settings.
Schell et al. [31] utilized machine learning methodologies to discern predictors of opioid overdose mortality at the neighborhood level. Leveraging statewide data from Rhode Island and 203 covariates from the American Community Survey, the analysis involved employing a least absolute shrinkage and selection operator (LASSO) algorithm, followed by variable importance rankings using a random forest algorithm. Double cross-validation was implemented, with 10 folds in the inner loop for model training and 4 outer folds for predictive performance assessment. The identified predictors encompassed various socioeconomic status dimensions, including education, income, residential stability, race/ethnicity, social isolation, and occupational status. The research underscores the utility of predictive modeling in identifying nuanced risk factors for opioid overdose mortality within communities.
Neill et al. [32] detailed two machine learning methods for detecting emerging trends in fatal accidental drug overdoses. The Gaussian Process Subset Scan enables the early identification of spatio-temporal patterns in opioid overdose deaths, offering advantages over traditional anomaly detection approaches. Additionally, the Multidimensional Tensor Scan uncovers previously unidentified overdose patterns, highlighting demographic clusters and the impacts of drug legislation. These approaches inform prevention efforts and policy changes.
Dong et al. [33] aim to predict patients at high risk of opioid overdose using a deep learning model trained on electronic health record data from 5,231,614 patients with opioid prescriptions and achieved the highest F-1 score (0.7815) and AUCROC (0.8449) when incorporating an attention mechanism. Top predictive features, including medications and vital signs, were identified, suggesting the potential of deep learning for early detection and intervention in opioid overdose cases.

3. Methodology and Design

To date, few studies have validated methods used to identify OODs [34,35,36]. The purpose of this study was to enhance and fully validate an existing algorithm for identifying opioid overdose events and create and validate algorithms that further classify the route of administration used in opioid overdoses. To achieve this objective, supervised machine learning, deep learning, and transfer learning algorithms were utilized. The methodology consisted of five main phases. Firstly, Reddit posts were collected related to opioid overdose. Secondly, the dataset consisted of manually annotated posts categorized into binary and multiclass. Thirdly, we preprocessed the data to remove noise. After that, pre-processed data underwent feature extraction using different word-embedding methods. After that, we applied a Support Vector Machine (SVM), Logistic Regression (LR), Extreme Gradient boosting (XGB), K-Nearest Neighbor (KNN), BiLSTM, CNN, and pre-trained Bert, Electra, RoBERTA, and XLENT. Lastly, we evaluate these models using four metrics: cross-validation (CV) score, precision, recall, and F1-score. We chose these models based on their strong fit with our dataset and the high CV for our task. The demonstrated efficacy of our selected methodology underscores its ability to effectively capture complex patterns within our dataset, highlighting its suitability for achieving the specific objectives of our study.

3.1. Construction of Dataset

Opioid use disorders and fatal and nonfatal opioid overdoses (OODs) are significant public health problems [37,38,39,40,41]. To address this issue, we sourced a dataset of 333,182 real-world Reddit posts related to opioid overdoses from four subreddits—r/opiates, r/choronicpain, r/OpiatesRecovery, and r/fentanyl—collected between January 2020 and September 2024 as these subreddits have active members that share self-reported experiences with opioid substances used daily, and it was determined that these subreddits were most appropriate for this study. Several factors contributed to data collection using this time span. First, the period coincided with the peak of the COVID-19 pandemic’s Delta variant, which has been shown to lead to an increase in the public’s pursuit of health-related information [42]. Second, drug overdose deaths increase during winter months. Consequently, we hypothesized that there might be an increase in the search for harm-reduction information during this time of year [43].
The data were collected using the Pushshift.io Reddit API and provided in comma-separated value (CSV) format, commonly known as CSV files. The CSV format facilitates the easy parsing and manipulation of data for analysis purposes, and three main columns are selected for annotation: user posts, binary classes, and multiple classes. In the binary classification, posts were labeled as 0 for “opioid overdose yes” and 1 for “not opioid overdose”. For the multiclass classification, posts were categorized to identify the route of administration used by opioid users, with 0 to 5 representing the following classes: 0 for “oral”, 1 for “intranasal”, 2 for “intravenous”, 3 for “smoking”, 4 for “other”, and 5 for “not overdose”, as illustrated in Figure 5. The other class is used if a user overdoses but does not mention any route of administration, e.g., “Hi everyone, I want some advice. I took heroine earlier, and I’m not feeling good. My whole body feels very heavy, and I’m having a hard time staying awake and my breathing is shallow, and my chest feels tight. I’m also really dizzy please help. ☹ (This post is taken from the dataset)”. A sample representation of the dataset is shown in Table 1, while Figure 1 explains the data flow and research design of the proposed method.

3.2. Annotation Guidelines

Annotation guidelines consist of a set of instructions provided to annotators to assist them in effectively classifying posts into one of two level classes: Overdose Yes (posts that mention opioid overdoses) and Not Overdose (posts that do not mention opioid overdose). In the second level, we categorized the Reddit posts into multiple classes with different routes of administration-related content based on features and characteristics, as shown in Figure 2. Furthermore, the annotation rules are listed below for the categorizations of posts presented in Table 1:
Mark only after reading the full post carefully. Skim-reading will be not allowed.
Use accurate labels as defined in these guidelines. Any deviation, such as “Maybe” or “Unclear”, is not permitted.
If a comment is off-topic such as spam or irrelevant content, mark it as Not Applicable.
Annotators should verify their labels before finalizing as this is a necessary step to ensure accuracy and consistency.
Cross-validation will be conducted after majority voting to ensure the accuracy of the annotations.
Only label those posts as “Overdose” if they explicitly mention overdose symptoms, experiences, or situations that indicate a life-threatening state due to opioid use. Unclear references should not be labeled as overdose.
Only label a post according to a specific route of administration if it clearly mentions one of the selected categories (Oral, Intravenous, Intranasal, and Smoking). General mentions of opioid use without specifying a route should be classified as other.
Label as “Not Overdose” if the post does not mention any overdose situation, even if it discusses opioid use. This includes general discussions about use, effects, or experiences without any overdose implications.
Maintain a record in a separate Excel file of any ambiguous posts for future reference and training purposes.
Figure 2. Workflow of annotation.
Information 16 00545 g002

3.3. Annotation Selection

Identifying the route of administration poses a significant challenge during the dataset annotation process. To address this, a strict method was implemented to carefully select expert annotators who qualified for the task, as outlined below. Selected annotators possess strong annotation skills, holding graduate and postgraduate degrees in computer sciences, with experience in NLP, machine learning, and deep learning. To supervise the annotation process, individual Google forms were created for each annotator, and weekly meetings were scheduled to assess the progress of the annotation and identify any challenges encountered during the process:
Five hundred samples of opioid overdose posts were given to seven candidates with strong knowledge of annotation, machine learning, and deep learning.
After receiving the annotated samples from the annotators, the labels provided by each annotator were analyzed carefully. Subsequently, 5 annotators agreed on the same label and were selected to proceed to the next round.
The 5 selected annotators were provided with 500 more samples for annotation, and their performance was strictly monitored and regularly supervised.
Ultimately, among the 5 annotators, only 3 improved the annotation quality and achieved better inter-annotator agreement on the sample posts. So, these 3 annotators were selected and awarded US $0.032 per annotation.

3.4. Annotation Agreement

We calculated the inter-annotator agreement (IAA) using Cohen’s kappa [44] for binary classification and Fleiss’ kappa [45] for multiclass classification. Fleiss’ kappa is particularly useful when dealing with three or more annotators and categorical output labels. During the annotation process, differences in opinions among the annotators may arise. It is essential to examine and analyze these discrepancies to derive meaningful insights from annotator outputs. This evaluation was conducted by calculating inter-annotator agreement (IAA). IAA serves as a measure of the quality and reliability of the annotation process, which is indicative of the accuracy of the results. In our study, the calculated K value was 0.81 in binary and 0.79% in multi-class, indicating that there is almost perfect agreement among the annotators.

3.5. Ethical Statement

This study utilized free publicly available data related to opioid overdose incidents, while strictly adhering to ethical standards. We are committed to protecting individual privacy by removing personal details. Throughout the annotation process, we implemented strict rules to prevent the inclusion of sensitive data, ensuring that our contributions were both responsible for and impactful in addressing the opioid crisis.

3.6. Preprocessing

Data pre-processing involves transforming raw data to make them suitable for machine learning models. It is essential to analyze Reddit posts to improve the quality of data and performance of the model. The preprocessing involved a series of essential steps: First, we standardized the input text by removing special characters, numbers, punctuations, short words, and extra spaces, converting everything to lowercase for uniformity. Next, we standardized the text into individual words or tokens, making it easier to work with. In the following step, we focused on removing noise from the tokens by looping through each one and filtering out any non-alphanumeric characters, ensuring that only relevant content remains. We then eliminated unwanted words by loading a list of English stop words and filtering out these common words, along with any tokens that are shorter than three characters. This helped to refine our dataset further. Afterward, we applied stemming to the filtered tokens, which reduces words to their base forms, ensuring consistency across the dataset. Finally, we compiled the cleaned and processed tokens into a final list, ready for analysis, as seen in Figure 3. Through these carefully executed steps, we ensured that the text data were clean, relevant, and well-prepared for meaningful insights.

3.7. Dataset Statistics

Figure 4 depicts a word cloud comprising keywords extracted from the posts in our dataset related to the topic of opioid overdose. Figure 5 depicts the distribution of labels for both the binary and multiclass classifications. We collected equal data related to opioid overdose and not opioid overdose class categories to show the data balance, and we needed to further categorize opioid overdose categories into multiple classes. The key characteristics of the opioid overdose dataset include the total posts (n = 9602), total vocabulary size (n = 24,348), total number of words (n = 795,793), total number of characters (n = 3,626,348), average number of words (n = 18.37), and average number of characters in a post (n = 377.6), as outlined in Figure 6. Table 2 shows the distribution of posts by drug type, categorizing posts related to prescription opioids and illicit drugs.

3.8. Feature Extraction

After pre-processing the dataset, feature extraction was required. This step is essential because, in the real world, data primarily exist in text format, which machines cannot directly understand. Therefore, it was necessary to convert the dataset into a machine-understandable format. Machine learning algorithms use predefined feature sets that are extracted from the training data because they cannot directly process raw data. Therefore, feature extraction is important for converting text data into feature vectors that represent symbolic or numerical characteristics for machine learning purposes. These features can be evaluated quickly. Feature extraction involves converting unprocessed raw data into numerical features that retain the information from the original dataset.

3.8.1. TF-IDF

TF-IDF, FastText, and GloVe are the primary feature extraction methods in machine learning and deep learning. TF-IDF consists of two components: TF (Term Frequency) and IDF (Inverse Document Frequency). TF represents the number of times a word appears in a document relative to the total number of words in that document. TF can be calculated using Equation (1):
TF = Number   of   times   term   t   appears   in   a   document Total   number   of   terms   in   the   document
The IDF of a term reflects the inverse proportion of documents that contain that term. Terms with technical jargon, for example, hold greater significance compared to words found in only a small percentage of all documents. The IDF can be computed using Equation (2):
IDF = Number   document   in   the   corpus Number   of   document   in   the   corpus   contain   terms
TF-IDF is calculated using Equation (3):
T F I D F = T F × I D F

3.8.2. FasText

FastText extends Word2Vec by representing words as bags of character n-grams. The embedding for a word w is calculated using Equation (4):
V w = g G ( w ) V g
where:
  • V is the set of character n-grams in the word w.
  • Vg is the vector representation of each n-gram g.
This allows FastText to generate embeddings for out-of-vocabulary words by combining the embeddings of their character n-grams.

3.8.3. GloVe

GloVe (Global Vectors for Word Representation) creates word embeddings based on the co-occurrence matrix of words. Equation (5) is derived from the ratio of co-occurrence probabilities:
C o s t = i , j V f ( X i , j ) ( V i T V j + b i + b j log ( x i , j ) ) 2
where:
  • Xi,j is the number of times word j occurs in the context of word i.
  • V is the vocabulary size.
  • Vi and Vj are the embeddings for words i and j.
  • bi and bj are bias terms for the words.
  • f (Xi,j) is a weighting function to down-weight the influence of very frequent words.

3.9. Application of Models, Training, and Testing Phase

In this section, we discuss the application of various models, including machine learning such as the Support Vector Machine (SVM with both linear and rbf kernels), Logistic Regression (LR), K-Nearest Neighbor (KNN), and Extreme Gradient Boosting (XGB), two additional deep learning models such as Convolutional Neural Networks (CNNs) and Bi-directional Long Short-Term Memory (BiLSTM), and four pre-trained transformer models: Bidirectional Encoder Representations from Transformers (BERT), Robustly Optimized BERT Pretraining Approach (RoBERTa), Efficiently Learning an Encoder that Classifies Token Replacements Accurately (ELECTRA), and XLNet. After the application of models and feature extraction, we employed five-fold cross-validation to partition the dataset, where each fold served as the test set once, while the remaining four folds were used for training as shown in Figure 7. This process was repeated for all five folds, ensuring that every data point was used for both training and testing. The models’ performances were evaluated using cross-validation scores based on metrics such as CV score, recall, precision, and F1-score. These metrics were calculated for each fold and then averaged across all five folds to obtain the final CV score. We calculated these metrics using the following equations:
C V   S c o r e = 1 K i = 1 k S c o r e i
P r e c i s i o n = T P F P + T P
R e c a l l = T P F N + T P
F 1   S c o r e = 2 × R e c a l l × P r e c i s i o n R e c a l l + P r e c i s i o n
TP is true positive, FP is false positive, and FN is false negative.

4. Results and Analysis

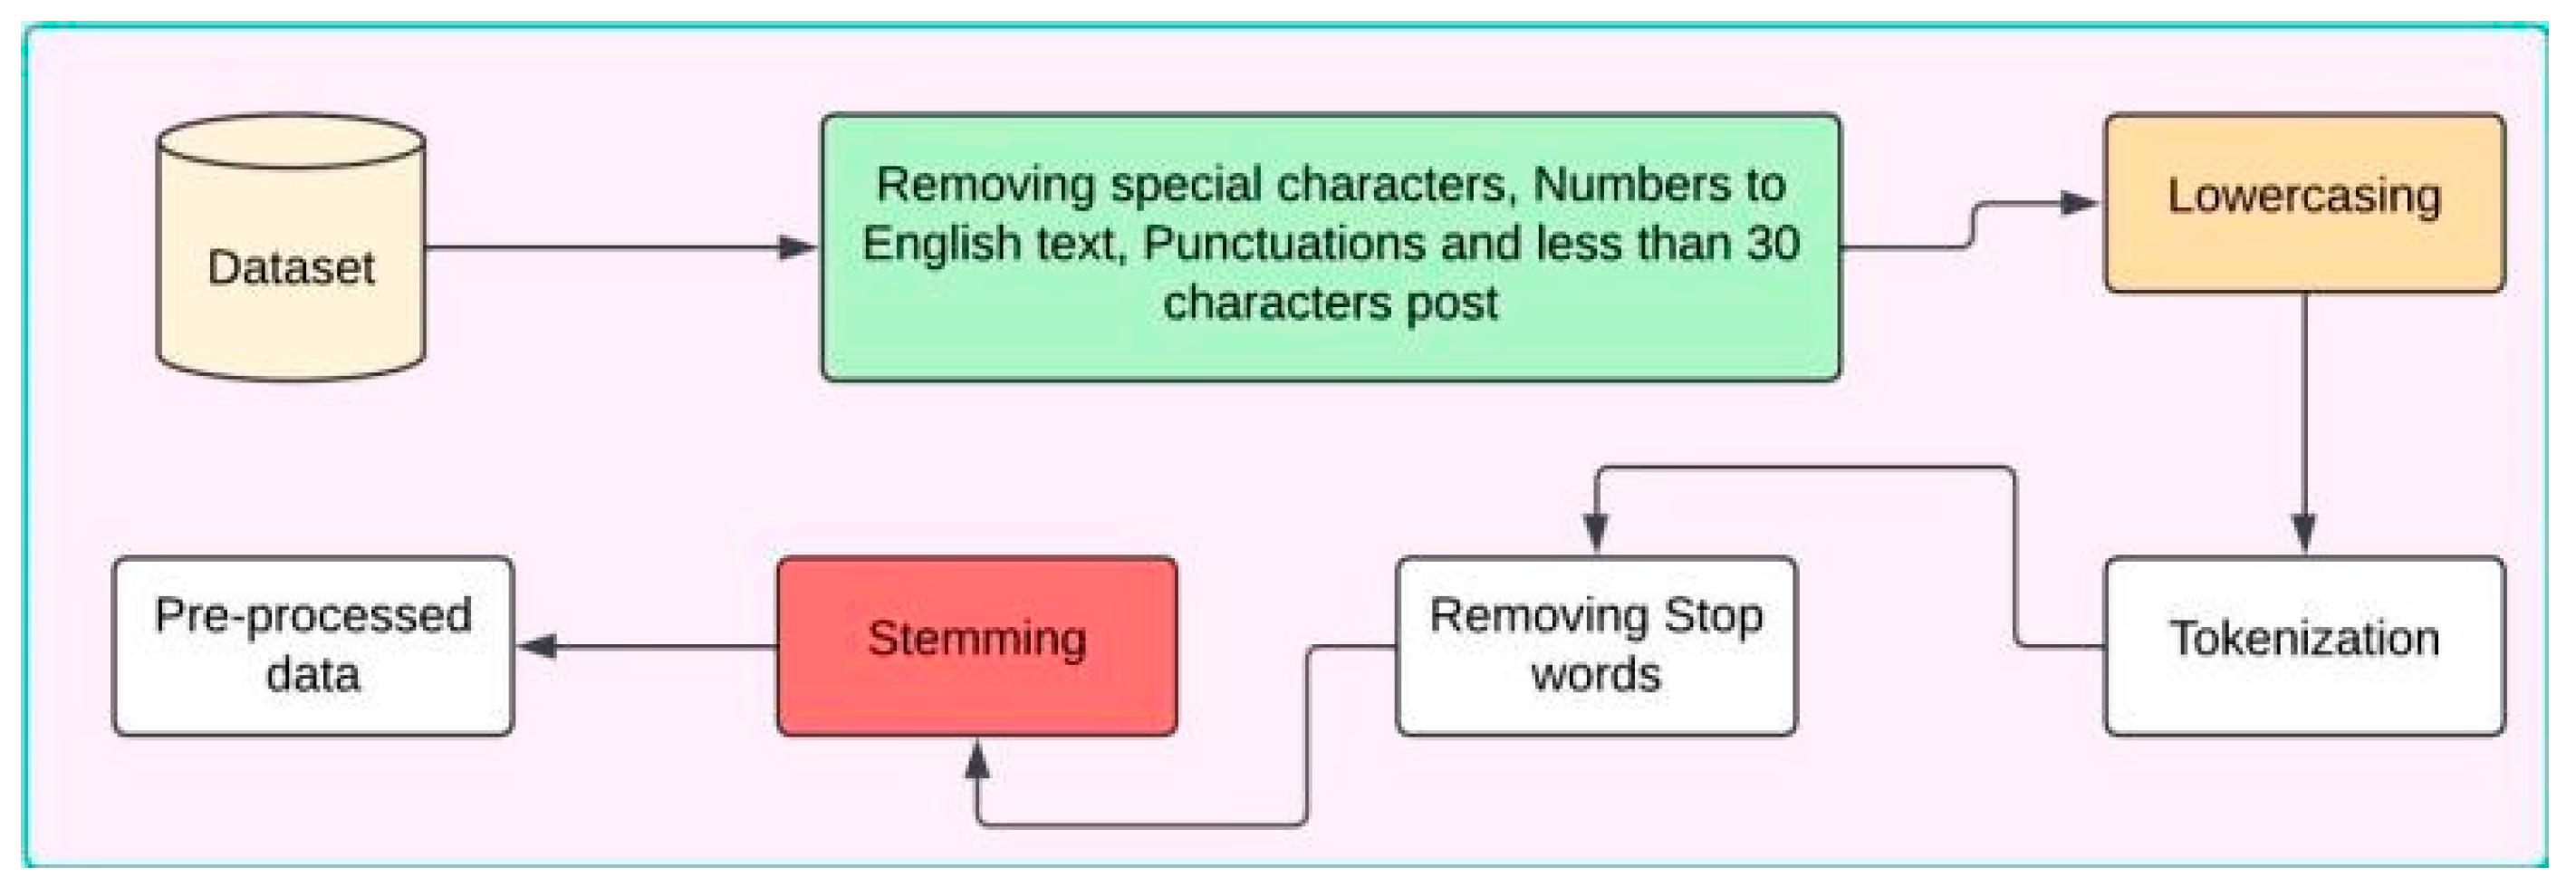
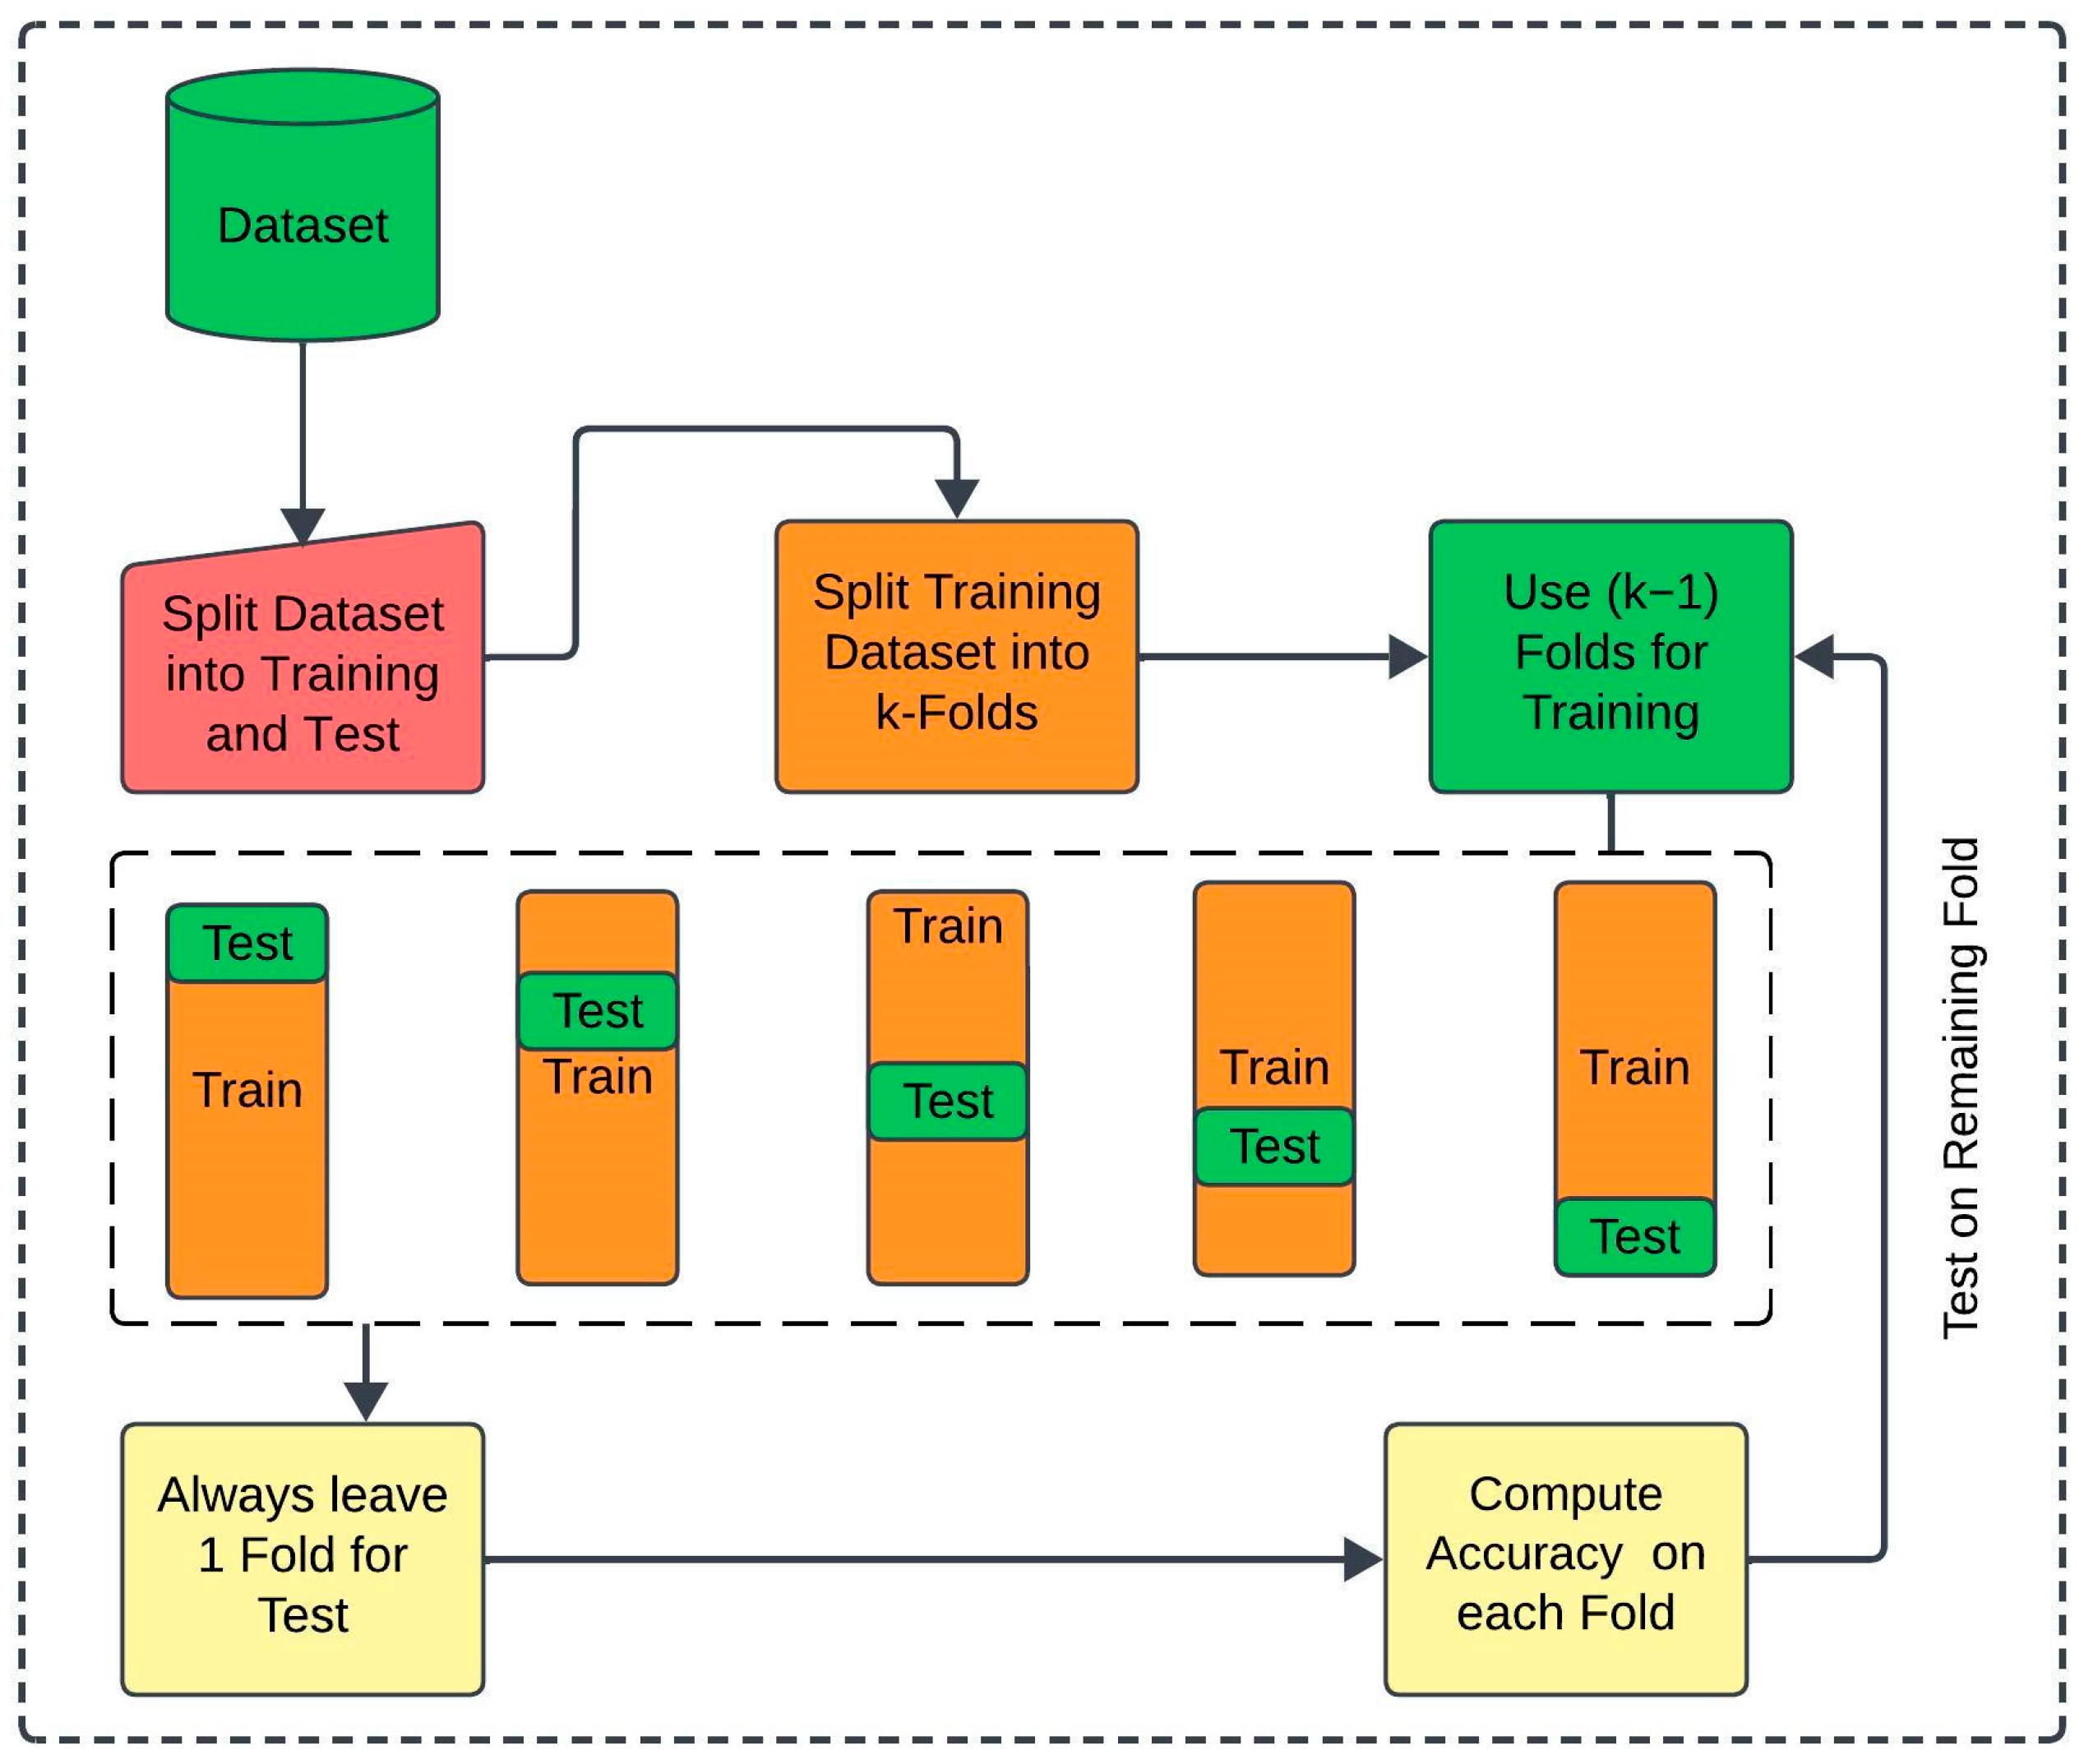
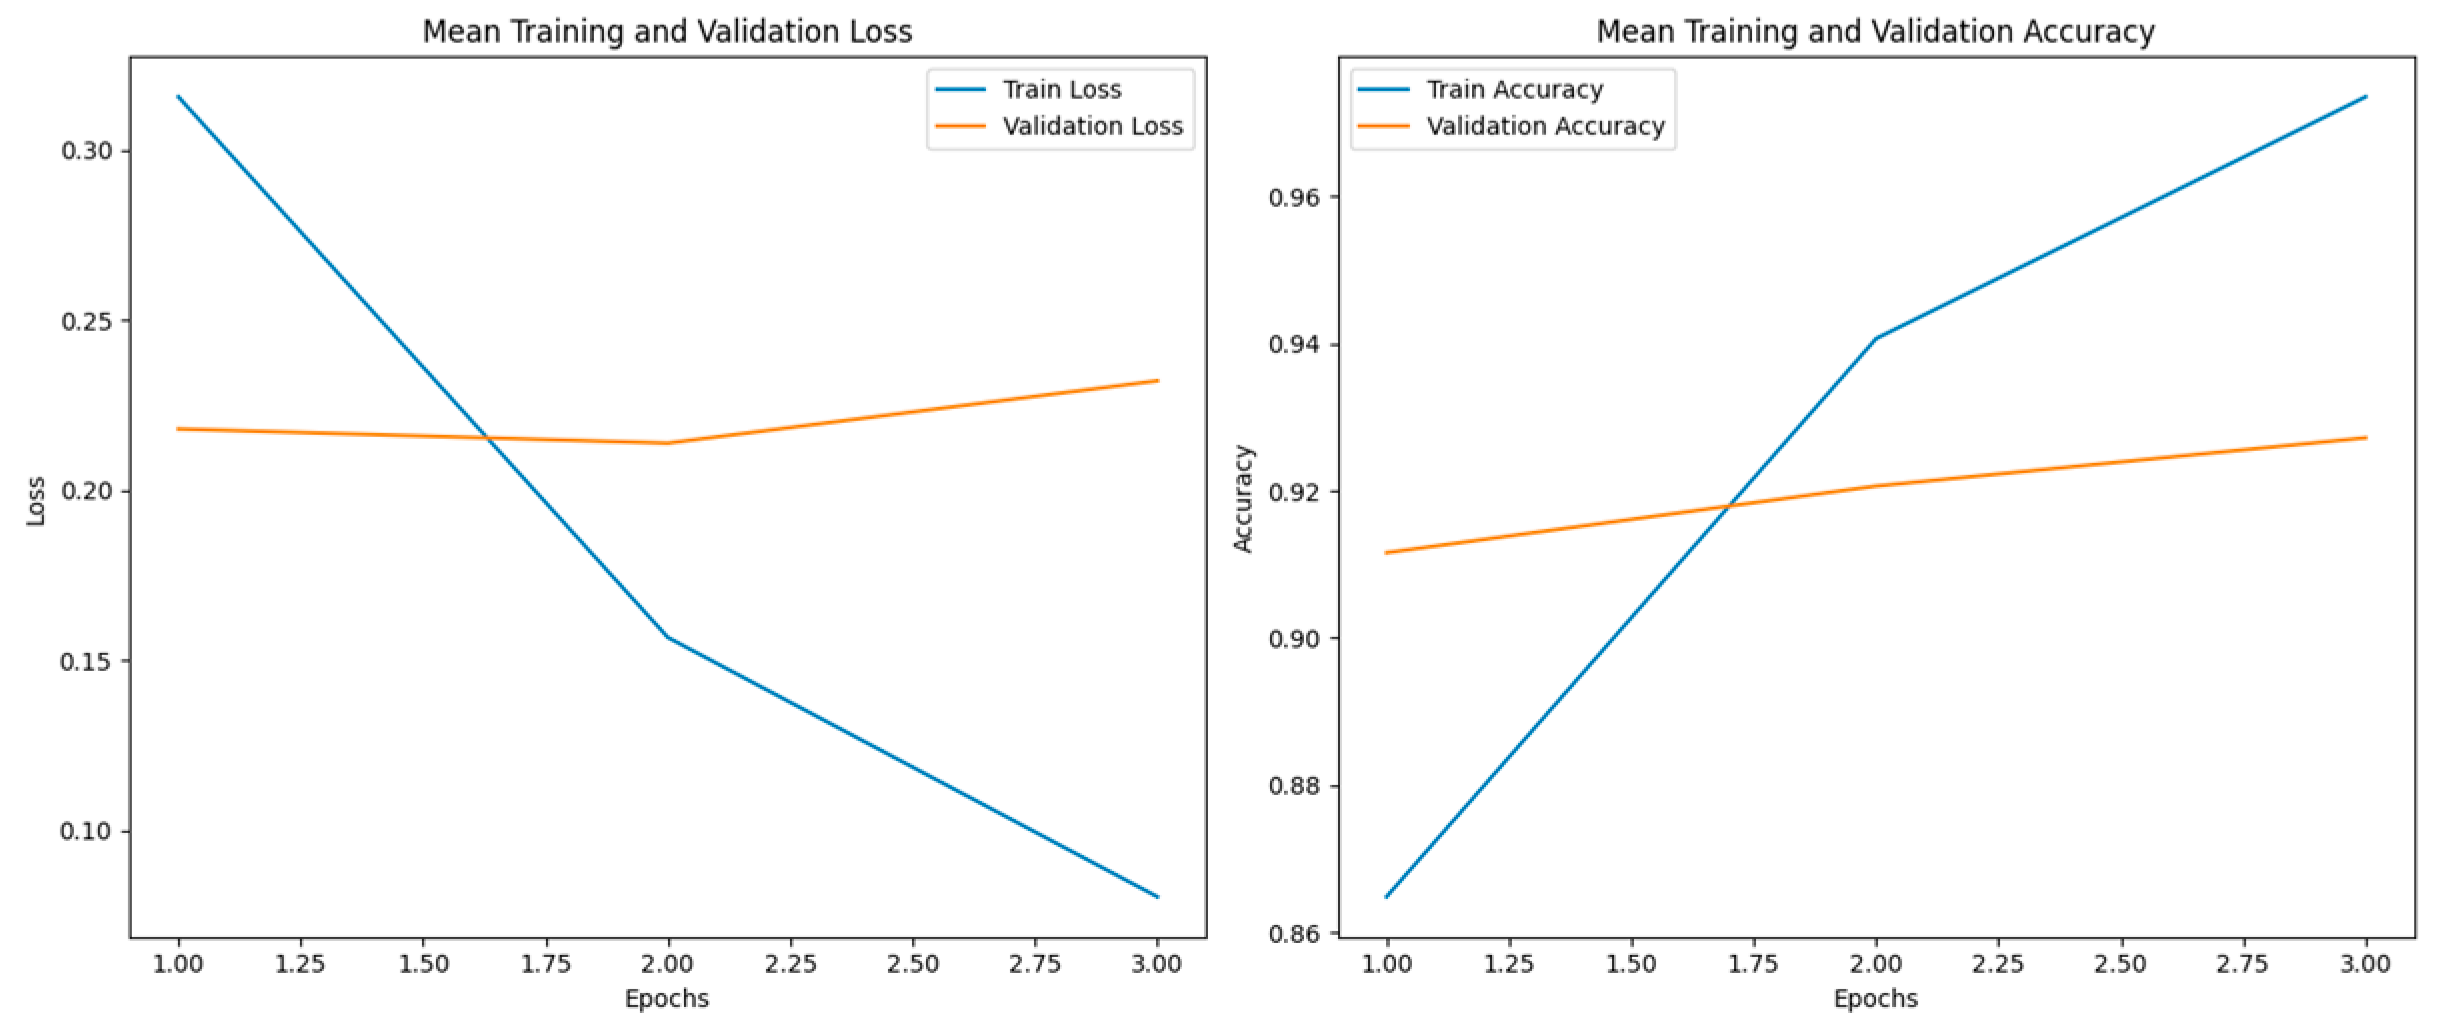
In this section, we discuss the results based on the methodology, implementation, and experiments presented in the previous sections. For machine learning models, we optimized hyperparameters using GridSearchCV, exploring parameters like regularization parameters (C, gamma) for SVM, penalty terms for LR, boosting parameters such as the learning rate, number of estimators, and maximum depth for XGB, and weights and neighbors for KNN. For deep learning models, we varied epochs, batch sizes, and learning rates to adapt BiLSTM and CNN to achieve the best results for our dataset. For transfer learning models, we fine-tuned pre-trained weights by adjusting learning rates, sequence lengths, and transformer-specific parameters to optimize BERT, Electra, RoBERTa, and XLNet for our dataset. To ensure optimal performance across all models, we systematically analyzed and fine-tuned their parameters, maximizing the specific contributions of each model and its hyperparameters. The detailed hyperparameters and corresponding search grids for the proposed methodology are presented in Table 6.

4.1. Software and Hardware

The experiments were performed on Google Colab. The software environment used Python 2.7. The Scikit-Learn [46] package was utilized for machine learning models, while TensorFlow [47] and Keras [48] were employed for deep learning tasks. For transformer-based models, the Hugging Face Transformers library was used. Model training was performed on an NVIDIA Tesla T4 GPU with 2560 CUDA cores and 16 GB GDDR6 memory. The hardware specifications included a Core i5 7th generation processor with 4 cores, an 8 GT/s bus speed, 24 GB of RAM, and 1 TB of storage.

4.2. Results for Machine Learning

Table 3 presents the performance of several machine learning models using five-fold cross-validation on both binary and multi-class classification tasks, based on precision, recall, and F1-score for both weighted and macro averages. For the binary classification task, models such as LR, SVM (with both linear and radial basis function (RBF) kernels), XGB, and KNN were tested. All models, except KNN, performed similarly well, with precision, recall, and F1-score around 0.84 to 0.85 for both weighted and macro averages, indicating robust performance in distinguishing between the two classes. However, KNN underperformed with scores of approximately 0.71 across all metrics, suggesting it struggled to differentiate between the classes effectively.
In the multi-class classification task, the models exhibited more variation in performance. LR had an average weighted precision of 0.78, recall of 0.77, and F1-score of 0.74, but its macro average recall and F1-scores were notably lower (0.49 and 0.57, respectively), indicating challenges in handling class imbalances. SVM (linear) performed better overall, with a weighted precision of 0.80, a recall of 0.79, and an F1-score of 0.78. Its macro average scores were also strong, particularly for precision (0.81), but recall (0.60) and F1-score (0.67) were somewhat lower. SVM (rbf) achieved high macro precision (0.83) but had a weaker macro recall and F1-score (0.46 and 0.53), indicating that it struggled to correctly identify some classes. KNN performed poorly in the multi-class task, with low weighted scores around 0.61 and even weaker macro averages. XGB demonstrated consistent performance, with a weighted precision of 0.81, a recall of 0.82, and an F1-score of 0.81, and high macro averages of 0.79 for precision, 0.68 for recall, and 0.72 for F1-score, making it one of the strongest models in the study. Overall, XGB showed the best ability to handle both tasks, while KNN struggled with class imbalances, particularly in multi-class classification.

4.3. Results for Deep Learning

Table 4 presents the evaluation metrics for binary and multi-class text classification tasks using BiLSTM and CNN models with FastText and GloVe word embeddings. For binary classification, the models achieved consistently high performances. BiLSTM with GloVe outperformed others, with average weighted and macro scores of 0.85 across precision, recall, and F1-score. Similarly, BiLSTM with FastText also performed well, achieving a score of 0.84. CNN models performed slightly lower, with GloVe yielding an average of 0.83 and FastText 0.81 across metrics.
For multi-class classification, the scores decreased, reflecting the increased complexity of the task. BiLSTM with GloVe again led with average weighted scores of 0.82–0.83 and macro scores of 0.78–0.75, followed by BiLSTM with FastText, which scored 0.79 (weighted) and 0.71 (macro) on precision. CNN models achieved moderate performance, with FastText scoring 0.72–0.74 (weighted) and 0.59–0.51 (macro), while GloVe yielded slightly better results, scoring 0.76 consistently across weighted metrics and 0.64–0.61 for macro scores. The cross-validation results align closely with the weighted scores, showcasing model reliability. Overall, BiLSTM outperformed CNN in both tasks, and GloVe embeddings delivered slightly better results than FastText.

4.4. Transformer Results

Table 5 compares the performance metrics of four transformer-based models (BERT, Electra, RoBERTa, and XLNet) for binary and multi-class text classification tasks. For binary classification, all models demonstrated exceptional performance with weighted and macro precision, recall, and F1-scores ranging between 0.91 and 0.93. Among these, Electra and RoBERTa performed slightly better, achieving scores of 0.93 across all metrics, closely followed by BERT at 0.92 and XLNet at 0.91. The high cross-validation scores indicate consistent and reliable performance.
In the multi-class classification task, performance slightly decreased due to the added complexity. RoBERTa led with an average weighted score of 0.91 and macro scores of 0.87–0.88, reflecting strong precision and recall balance. BERT followed with weighted scores of 0.9 and macro scores of 0.86–0.88. XLNet achieved a weighted score of 0.89 and macro scores of 0.83–0.86. Electra had comparatively lower scores, with a weighted average of 0.86 and macro scores of 0.68–0.7. Overall, while all models excelled in binary classification, RoBERTa and BERT were more robust for multi-class tasks, with RoBERTa emerging as the most effective model.
Table 6 presents the optimal fine-tuning hyper-parameters and grid search configurations used for different methodologies. In the transformer-based models (BERT, RoBERTa, XLNet, and ELECTRA), key hyperparameters include learning rate, epoch, batch size, optimizer (AdamW), and loss function (CrossEntropyLoss), with typical settings being 2 × 10⁻⁵, 3, 32, AdamW, and CrossEntropyLoss, respectively. For machine learning models, SVM employs parameters such as random state (42), kernel types (linear and RBF), C value (1.0), and gamma (auto). XGBoost (XGB) is tuned with 100 estimators, a maximum depth of 6, and a learning rate of 0.3. K-Nearest Neighbors (KNN) relies on five neighbors with uniform weighting. Logistic Regression (LR) uses a random state of 42, maximum iterations of 1000, a C value of 0.1, and the solver “liblinear”. Lastly, in the deep learning category, BiLSTM and CNN are trained with a learning rate of 0.1, 5 epochs, an embedding dimension of 300, and a batch size of 32. This configuration highlights the tailored tuning across methodologies to optimize performance.

4.5. Error Analysis

Table 7 provides class-wise performance metrics of the proposed methodology (RoBERTa) for binary and multi-class opioid overdose detection. This helps us to assess the performance of the model in terms of how well it performs for each class, identify any imbalances or weaknesses, and ensure accurate predictions across all classes. For binary classification, the model demonstrated balanced performance for both classes: overdose and not overdose. Both classes achieved high precision, recall, and F1-scores (0.91–0.94), with support values of 5007 and 4595 samples, respectively. The overall cross-validation score for binary classification was 93%, indicating the model’s reliability. For multi-class classification, the model’s performance varied across categories. The not overdose class, which has the largest support (5007 samples), achieved the highest F1-score of 0.94, reflecting the model’s strong predictive capability. The classes smoking and other also showed excellent performance, with F1-scores of 0.93 and 0.91, respectively. However, the performances for oral and intravenous were comparatively lower, with F1-scores of 0.82 each. The intranasal class achieved a moderate F1-score of 0.86. Cross-validation for multi-class classification was 91%, highlighting consistent performance despite the varying complexity of the categories. Overall, RoBERTa excelled in detecting the majority classes while maintaining reasonable performance for minority classes, whereas Figure 8, Figure 9 and Figure 10 show the confusion matrix of top-performing models in each learning approach such as machine learning, deep learning, and transfer learning, respectively. Figure 11 represents the training and validation performance metrics of our proposed model (RoBERTA) over multiple epochs in the binary class, whereas Figure 12 depicts the training and validation performance of different epochs in the multi-classification task.
Table 8 shows both binary and multi-class classification results for each type of learning; the pre-trained transformer-based model, RoBERTa, outperformed the other models across all learning approaches, achieving accuracies of 0.93 for binary classification and 0.91 for multi-class classification. Among the machine learning approaches, XGB performed best with accuracies of 0.85 for binary and 0.82 for multi-class tasks. In deep learning, BiLSTM achieved 0.85 in binary class and 0.83 in multiclass classification using GloVe word embedding. Overall, the transformer-based approach demonstrated the highest cross-validation score in both tasks, with a 9.41% performance improvement in binary classification and 10.98% in multiclass classification over the traditional machine learning models.

5. Conclusions

This research presents an effective methodology for detecting opioid crisis-related discussions on social media using a manually annotated dataset and transformer models, particularly RoBERTa. The model achieved 93% accuracy for binary classification and 91% for multi-class classification, highlighting the potential of social media data in the early detection of opioid misuse and related risk factors. By analyzing Reddit posts, this approach gathers more detailed self-reported experiences, providing important insights into opioid use patterns that people might not share openly elsewhere. This methodology not only aids in public health surveillance but also enables more efficient resource allocation and targeted interventions. Unlike traditional methods that rely on slower, static data sources, transformer models analyze real-time data, offering faster, more nuanced insights. Additionally, this approach can be adapted to other public health challenges, such as detecting early signs of mental health issues or tracking infectious disease outbreaks. Integrating social media monitoring into public health policies could lead to real-time surveillance, improving response times and reducing the stigma associated with seeking help. In simpler terms, transformer models like RoBERTa provide a powerful, scalable solution for analyzing complex datasets, making them invaluable tools for addressing various public health issues beyond the opioid crisis. These findings showcase how transformer-based tools can be leveraged to drive data-driven decision-making in public health, providing scalable and accurate solutions for monitoring and intervening in health crises.
Future work will focus on refining the model by incorporating more diverse datasets and exploring additional NLP techniques and large language models to improve classification accuracy. Further investigation into the use of real-time data for opioid surveillance could enhance response time and intervention strategies. Expanding the model to other public health crises could demonstrate its broader applicability.

Author Contributions

Conceptualization, G.S., M.A. (Muhammad Ahmad), and I.B.; methodology, M.A. (Muhammad Ahmad) and I.B.; software, M.A. (Muhammad Ahmad); validation, G.S. and M.A. (Maaz Amjad); formal analysis, M.A. (Maaz Amjad); investigation, I.B.; resources, G.S. and I.B.; data curation, M.A. (Muhammad Ahmad); writing—original draft preparation, M.A. (Muhammad Ahmad) and I.B.; writing—review and editing, M.A. (Muhammad Ahmad) and I.A.; visualization, G.S. and I.A.; supervision, I.B.; project administration, I.B. All authors have read and agreed to the published version of the manuscript.

Funding

This research received no external funding.

Institutional Review Board Statement

Not applicable.

Informed Consent Statement

Not applicable.

Data Availability Statement

Data will be made available upon request.

Acknowledgments

This work was performed with partial support from the Mexican Government through the grant A1-S-47854 of CONACYT, Mexico, and grants 20241816, 20241819, and 20240951 of the Secretaría de Investigación y Posgrado of the Instituto Politécnico Nacional, Mexico. The authors thank CONACYT for the computing resources brought to them through the Plataforma de Aprendizaje Profundo para Tecnologías del Lenguaje of the Laboratorio de Supercómputo of the INAOE, Mexico and acknowledge support of Microsoft through the Microsoft Latin America PhD.

Conflicts of Interest

The authors declare no conflicts of interest.

References

  1. Compton, W.M.; Jones, C.M.; Baldwin, G.T. Relationship between nonmedical prescription-opioid use and heroin use. N. Engl. J. Med. 2016, 374, 154–163. [Google Scholar] [CrossRef] [PubMed]
  2. Scholl, L. Drug and opioid-involved overdose deaths—United States, 2013–2017. MMWR Morb. Mortal. Wkly. Rep. 2019, 67, 1419–1427. [Google Scholar] [CrossRef] [PubMed]
  3. National Center for Health Statistics. National Vital Statistics System; Centers for Disease Control and Prevention: Atlanta, GA, USA, 2018. Available online: https://www.cdc.gov/nchs/nvss/deaths.htm (accessed on 22 September 2015).
  4. Substance Abuse and Mental Health Services Administration (SAMHSA). 2017 National Survey on Drug Use and Health: Detailed Tables; Center for Behavioral Health Statistics and Quality: Rockville, MD, USA, 2018. Available online: https://www.samhsa.gov/data (accessed on 6 November 2024).
  5. Kalichman, S.C.; Rompa, D. Sexual sensation seeking and sexual compulsivity scales: Validity, and predicting HIV risk behavior. J. Personal. Assess. 1995, 65, 586–601. [Google Scholar] [CrossRef] [PubMed]
  6. Malow, R.M.; Dévieux, J.G.; Jennings, T.; Lucenko, B.A.; Kalichman, S.C. Substance-abusing adolescents at varying levels of HIV risk: Psychosocial characteristics, drug use, and sexual behavior. J. Subst. Abus. 2001, 13, 103–117. [Google Scholar] [CrossRef]
  7. Miller, P.G.; Sønderlund, A.L. Using the internet to research hidden populations of illicit drug users: A review. Addiction 2010, 105, 1557–1567. [Google Scholar] [CrossRef]
  8. Yuan, Y.; Kasson, E.; Taylor, J.; Cavazos-Rehg, P.; De Choudhury, M.; Aledavood, T. Examining the Gateway Hypothesis and Mapping Substance Use Pathways on Social Media: Machine Learning Approach. JMIR Form. Res. 2024, 8, e54433. [Google Scholar] [CrossRef]
  9. Jalal, H.; Buchanich, J.M.; Roberts, M.S.; Balmert, L.C.; Zhang, K.; Burke, D.S. Changing dynamics of the drug overdose epidemic in the United States from 1979 through 2016. Science 2018, 361, eaau1184. [Google Scholar] [CrossRef]
  10. Wilson, N. Drug and opioid-involved overdose deaths—United States, 2017–2018. MMWR Morb. Mortal. Wkly. Rep. 2020, 69, 290–297. [Google Scholar] [CrossRef]
  11. Food and Drug Administration. Duragesic Prescribing Information. 2019. Available online: https://www.accessdata.fda.gov/drugsatfda_docs/label/2019/019813s079lbl.pdf (accessed on 6 November 2024).
  12. Food and Drug Administration. Fentora Prescribing Information. 2019. Available online: https://www.accessdata.fda.gov/drugsatfda_docs/label/2019/021947s029lbl.pdf (accessed on 6 November 2024).
  13. Food and Drug Administration. Fentanyl Citrate Prescribing Information. 2019. Available online: https://www.accessdata.fda.gov/drugsatfda_docs/label/2019/019115s033lbl.pdf (accessed on 6 November 2024).
  14. Butler, S.F.; Black, R.A.; Cassidy, T.A.; Dailey, T.M.; Budman, S.H. Abuse risks and routes of administration of different prescription opioid compounds and formulations. Harm Reduct. J. 2011, 8, 29. [Google Scholar] [CrossRef]
  15. Spencer, M.R.; Warner, M.; Bastian, B.A.; Trinidad, J.P.; Hedegaard, H. Drug Overdose Deaths Involving Fentanyl, 2011–2016; National Vital Statistics Reports: From the Centers for Disease Control and Prevention, National Center for Health Statistics, National Vital Statistics System; CDC: Atlanta, GA, USA, 2019; Volume 68, pp. 1–19.
  16. Drug Enforcement Administration. NFLIS Drug Brief: Fentanyl; U.S. Department of Justice. Available online: https://www.nflis.deadiversion.usdoj.gov/nflisdata/docs/15431NFLISDrugBriefFentanyl.pdf (accessed on 6 November 2024).
  17. O’Donnell, J.K. Trends in deaths involving heroin and synthetic opioids excluding methadone, and law enforcement drug product reports, by census region—United States, 2006–2015. MMWR Morb. Mortal. Wkly. Rep. 2017, 66, 897–903. [Google Scholar] [CrossRef]
  18. Hanson, C.L.; Cannon, B.; Burton, S.; Giraud-Carrier, C. An exploration of social circles and prescription drug abuse through Twitter. J. Med. Internet Res. 2013, 15, e189. [Google Scholar] [CrossRef] [PubMed]
  19. Rodrigues, F.; Newell, R.; Babu, G.R.; Chatterjee, T.; Sandhu, N.K.; Gupta, L. The social media Infodemic of health-related misinformation and technical solutions. Health Policy Technol. 2024, 13, 100846. [Google Scholar] [CrossRef]
  20. De Choudhury, M.; De, S. Mental health discourse on reddit: Self-disclosure, social support, and anonymity. In Proceedings of the International AAAI Conference on Web and Social Media, Ann Arbor, MI, USA, 1–4 June 2014; Volume 8, pp. 71–80. [Google Scholar]
  21. Enes, K.B.; Brum, P.P.V.; Cunha, T.O.; Murai, F.; da Silva, A.P.C.; Pappa, G.L. Reddit weight loss communities: Do they have what it takes for effective health interventions? In Proceedings of the 2018 IEEE/WIC/ACM International Conference on Web Intelligence (WI), Santiago, Chile, 3–6 December 2018; pp. 508–513. [Google Scholar]
  22. Saha, K.; Kim, S.C.; Reddy, M.D.; Carter, A.J.; Sharma, E.; Haimson, O.L.; De Choudhury, M. The language of LGBTQ+ minority stress experiences on social media. Proc. ACM Hum.-Comput. Interact. 2019, 3, 89. [Google Scholar] [CrossRef] [PubMed]
  23. Lu, J.; Sridhar, S.; Pandey, R.; Hasan, M.A.; Mohler, G. Redditors in recovery: Text mining reddit to investigate transitions into drug addiction. arXiv 2019, arXiv:1903.04081. [Google Scholar]
  24. Chancellor, S.; Nitzburg, G.; Hu, A.; Zampieri, F.; De Choudhury, M. Discovering alternative treatments for opioid use recovery using social media. In Proceedings of the 2019 CHI Conference on Human Factors in Computing Systems, Glasgow, UK, 4–9 May 2019; pp. 1–15. [Google Scholar]
  25. Mackey, T.K.; Kalyanam, J.; Katsuki, T.; Lanckriet, G. Twitter-based detection of illegal online sale of prescription opioid. Am. J. Public Health 2017, 107, 1910–1915. [Google Scholar] [CrossRef]
  26. Kalyanam, J.; Katsuki, T.; Lanckriet, G.R.; Mackey, T.K. Exploring trends of nonmedical use of prescription drugs and polydrug abuse in the Twittersphere using unsupervised machine learning. Addict. Behav. 2017, 65, 289–295. [Google Scholar] [CrossRef]
  27. Blackley, S.V.; MacPhaul, E.; Martin, B.; Song, W.; Suzuki, J.; Zhou, L. Using natural language processing and machine learning to identify hospitalized patients with opioid use disorder. In Proceedings of the AMIA Annual Symposium, San Diego, CA, USA, 30 October–3 November 2021; Volume 2020, p. 233. [Google Scholar]
  28. Sarker, A.; Nataraj, N.; Siu, W.; Li, S.; Jones, C.M.; Sumner, S.A. Concerns among people who use opioids during the COVID-19 pandemic: A natural language processing analysis of social media posts. Subst. Abus. Treat. Prev. Policy 2022, 17, 16. [Google Scholar] [CrossRef]
  29. Wright, A.P.; Jones, C.M.; Chau, D.H.; Gladden, R.M.; Sumner, S.A. Detection of emerging drugs involved in overdose via diachronic word embeddings of substances discussed on social media. J. Biomed. Inform. 2021, 119, 103824. [Google Scholar] [CrossRef]
  30. Green, C.A.; Perrin, N.A.; Hazlehurst, B.; Janoff, S.L.; DeVeaugh-Geiss, A.; Carrell, D.S.; Coplan, P.M. Identifying and classifying opioid-related overdoses: A validation study. Pharmacoepidemiol. Drug Saf. 2019, 28, 1127–1137. [Google Scholar] [CrossRef]
  31. Schell, R.C.; Allen, B.; Goedel, W.C.; Hallowell, B.D.; Scagos, R.; Li, Y.; Krieger, M.S.; Neill, D.B.; Marshall, B.D.L.; Cerda, M.; et al. Identifying predictors of opioid overdose death at a neighborhood level with machine learning. Am. J. Epidemiol. 2022, 191, 526–533. [Google Scholar] [CrossRef]
  32. Neill, D.B.; Herlands, W. Machine learning for drug overdose surveillance. J. Technol. Hum. Serv. 2018, 36, 8–14. [Google Scholar] [CrossRef]
  33. Dong, X.; Deng, J.; Hou, W.; Rashidian, S.; Rosenthal, R.N.; Saltz, M.; Wang, F. Predicting opioid overdose risk of patients with opioid prescriptions using electronic health records based on temporal deep learning. J. Biomed. Inform. 2021, 116, 103725. [Google Scholar] [CrossRef] [PubMed]
  34. Anderson, T.S.; Wang, B.X.; Lindenberg, J.H.; Herzig, S.J.; Berens, D.M.; Schonberg, M.A. Older Adult and Primary Care Practitioner Perspectives on Using, Prescribing, and Deprescribing Opioids for Chronic Pain. JAMA Netw. Open 2024, 7, e241342. [Google Scholar] [CrossRef] [PubMed]
  35. Goudman, L.; Moens, M.; Pilitsis, J.G. Incidence and Prevalence of Pain Medication Prescriptions in Pathologies with a Potential for Chronic Pain. Anesthesiology 2024, 140, 524–537. [Google Scholar] [CrossRef] [PubMed]
  36. Graham, S.S.; Shifflet, S.; Amjad, M.; Claborn, K. An interpretable machine learning framework for opioid overdose surveillance from emergency medical services records. PLoS ONE 2024, 19, e0292170. [Google Scholar] [CrossRef]
  37. Abuse, S.; Mental Health Services Administration. Results from the 2013 National Survey on Drug Use and Health: Mental Health Findings; NSDUH Series H-49; Substance Abuse and Mental Health Services Administration: Rockville, MD, USA, 2014; Volume 2, pp. 55–68.
  38. Paulozzi, L.J.; Jones, C.M.; Mack, K.A.; Rudd, R.A. Vital Signs: Overdoses of Prescription Opioid Pain Relievers--United States, 1999–2008. MMWR Morb. Mortal. Wkly. Rep. 2011, 60, 1487. [Google Scholar]
  39. Warner, M.; Chen, L.H.; Makuc, D.M.; Anderson, R.N.; Minino, A.M. Drug poisoning deaths in the United States, 1980–2008. NCHS Data Brief 2011, 81, 1–8. [Google Scholar]
  40. May, A.L.; Freedman, D.; Sherry, B.; Blanck, H.M.; Centers for Disease Control and Prevention (CDC). Obesity—United States, 1999–2010. MMWR Surveill. Summ. 2013, 62 (Suppl. S3), 120–128. [Google Scholar]
  41. Rudd, R.A.; Aleshire, N.; Zibbell, J.E.; Gladden, R.M. Increases in drug and opioid overdose deaths—United States, 2000–2014. Am. J. Transplant. 2016, 16, 1323–1327. [Google Scholar] [CrossRef]
  42. Zimmerman, M.S. Health information-seeking behavior in the time of COVID-19: Information horizons methodology to decipher source path during a global pandemic. J. Doc. 2021, 77, 1248–1264. [Google Scholar] [CrossRef]
  43. Brown University. Cold weather increases the risk of fatal opioid overdoses, study finds. News from Brown. 17 June 2019. Available online: https://www.brown.edu/news/2019-06-17/cold-overdoses (accessed on 6 November 2024).
  44. Cohen, J. A coefficient of agreement for nominal scales. Educ. Psychol. Meas. 1960, 20, 37–46. [Google Scholar] [CrossRef]
  45. Falotico, R.; Quatto, P. Fleiss’ kappa statistic without paradoxes. Qual. Quant. 2015, 49, 463–470. [Google Scholar] [CrossRef]
  46. Pedregosa, F. Scikit-learn: Machine learning in python Fabian. J. Mach. Learn. Res. 2011, 12, 2825. [Google Scholar]
  47. Abadi, M.; Barham, P.; Chen, J.; Chen, Z.; Davis, A.; Dean, J.; Zheng, X. {TensorFlow}: A system for {Large-Scale} machine learning. In Proceedings of the 12th USENIX Symposium on Operating Systems Design and Implementation (OSDI 16), Savannah, GA, USA, 2–4 November 2016; pp. 265–283. [Google Scholar]
  48. Gulli, A.; Pal, S. Deep Learning with Keras; Packt Publishing Ltd.: Birmingham, UK, 2017. [Google Scholar]
Figure 1. Proposed methodology and design.
Information 16 00545 g001
Figure 3. Pre-processing approach.
Information 16 00545 g003
Figure 4. Word cloud.
Information 16 00545 g004
Figure 5. Label distribution based on binary and multi-class.
Information 16 00545 g005
Figure 6. Dataset statistics.
Information 16 00545 g006
Figure 7. Illustration of k-Fold cross-validation.
Information 16 00545 g007
Figure 8. Confusion matrix of XGB for binary and multi-class.
Information 16 00545 g008
Figure 9. Confusion matrix of GLoVe for binary and multi-class.
Information 16 00545 g009
Figure 10. Confusion Matrix of RoBERTa for binary and multi-class.
Information 16 00545 g010
Figure 11. Training and validation performance of different epochs of RoBERTa in binary class.
Information 16 00545 g011
Figure 12. Training and validation performance of different epochs of RoBERTa in multi-class.
Information 16 00545 g012
Table 1. Samples from the dataset.
Reddit PostBinary ClassMulti Class
I want to warn about the dangers of smoking opioids. My friend recently overdosed on smoked fentanyl, barely surviving the terrifying experienceYes (1)Smoking (1)
Hi everyone, I want some advice. I took heroine earlier, and I’m not feeling good. My whole body feels very heavy, and I’m having a hard time staying awake and my breathing is shallow, and my chest feels tight. I’m also really dizzy please help. ☹Yes (1)Other (2)
I’m raising awareness about the hidden dangers of oral opioids; my family member overdosed on painkillers after developing a tolerance and increasing the dose without consulting a doctor.Yes (1)Oral (3)
I want to highlight the dangers of snorting opioids. My friend nearly died after snorting crushed oxycodone for a faster high and ended up overdosing.Yes (1)Intranasal (4)
Injecting opioids leads to an almost instantaneous effect and carries the highest risk of overdose, along with infection and disease risks. If you’re struggling with IV drug use, please seek professional help. Your life is worth itYes (1)Intravenous (5)
It’s not as easy as it used to be but yes, you can still get Real Black Tar in Southern California. Im 9 months sober off a 2-year run but I could get it for $60 a G, tested it several times several different batches never had fent, never OD’d on it.No (0)No (6)
Table 2. Distribution of posts by drug type (prescription opioids vs. illicit drugs).
CategoryNumber of Posts Percentage (%)
Prescription Opioids615364.09
Illicit Drugs344935.91
Total9602100
Table 3. Results for machine learning models.
ModelAvg. Weighted ScoresAvg. Macro ScoresCorss Validation
PrecisionRecallF1-ScorePrecisionRecallF1-Score
Binary classification
LR0.840.840.840.840.840.840.84
SVM (linear)0.840.840.840.840.840.840.84
SVM (rbf)0.850.850.850.850.850.850.85
KNN0.710.710.710.710.710.710.71
XGB0.850.850.850.850.850.850.85
Multi classification
LR0.780.770.740.820.490.570.77
SVM (linear)0.80.790.780.810.600.670.79
SVM (rbf)0.770.760.730.830.460.530.76
KNN0.610.630.610.510.400.430.63
XGB0.810.820.810.790.680.720.82
Table 4. Results for deep learning models.
ModelAvg. Weighted ScoresAvg. Macro ScoresCross Validation
PrecisionRecallF1-ScorePrecisionRecallF1-Score
Binary classification
Word Embedding using FastText
BiLSTM0.840.840.840.840.840.840.84
CNN0.810.810.810.810.810.810.81
Word Embedding using GloVe
BiLSTM0.850.850.850.850.850.850.85
CNN0.830.830.830.830.830.830.83
Multi classification
Word Embedding using FastText
BiLSTM0.790.80.790.710.60.630.8
CNN0.720.740.720.590.490.510.74
Word Embedding using GloVe
BiLSTM0.820.830.820.780.720.750.83
CNN0.760.760.760.640.590.610.76
Table 5. Transformers results.
ModelAvg. Weighted ScoresAvg. Macro ScoresCross Validation
PrecisionRecallF1-ScorePrecisionRecallF1-Score
Binary classification
BERT0.920.920.920.920.920.920.92
Electra0.930.930.930.930.930.930.93
RoBERTa0.930.930.930.930.930.930.93
XLNet0.910.910.910.910.910.910.91
Multi classification
BERT0.90.90.90.860.880.870.9
Electra0.860.860.860.70.70.680.86
RoBERTa0.910.910.910.870.890.880.91
XLNet0.890.890.890.830.860.840.89
Table 6. Optimum values identified for the hyper-parameters of proposed models.
Learning ApproachModelsHyper ParameterGrid Search
TransformerBERT, RoBERTa, XLNET, ELECTRAlearning rate, epoch, batch size, Optimizer, Loss Function 2 × 10⁻⁵, 3, 32, AdamW, CrossEntropyLoss
Machine learningSVMrandom state, kernel, c value, gamma42, linear and rbf, 1.0, auto
XGBn_estimators, max_depth, learning_rate100, 6, 0.3
KNNn_neighbors, weights5, uniform
LRrandom state, max_iter, c value, solver42, 1000, 0.1, liblinear
Deep learningBiLSTM and CNNlearning rate, epoch, embedding_dim, batch size, 0.1, 5, 300, 32
Table 7. Class-wise score for RoBERTa model.
CategoriesPrecisionRecallF1-ScoreSupportCorss Validation
Binary classification
overdose0.910.920.93500793%
Not Overdose 0.940.920.934595
Multi classification
Oral0.800.850.8260291%
Smoking0.910.950.93442
Other0.910.900.912646
Not overdose0.940.930.945007
Intravenous0.790.840.82619
Intranasal0.860.870.86286
Table 8. Top-performing models in each learning approach.
ModelLearning ApproachCross Validation
Binary classification
XGBMachine learning (baseline)0.85
BiLSTM (GloVe)Deep learning0.85
RoBERTaTransformer 0.93
Multi classification
XGBMachine learning (baseline)0.82
BiLSTM (GloVe)Deep learning0.83
RoBERTaTransformer0.91
Disclaimer/Publisher’s Note: The statements, opinions and data contained in all publications are solely those of the individual author(s) and contributor(s) and not of MDPI and/or the editor(s). MDPI and/or the editor(s) disclaim responsibility for any injury to people or property resulting from any ideas, methods, instructions or products referred to in the content.

